EP0603908A2 - Verfahren und Gerät zur Bildsignalkonvertierung - Google Patents
Verfahren und Gerät zur Bildsignalkonvertierung Download PDFInfo
- Publication number
- EP0603908A2 EP0603908A2 EP93120852A EP93120852A EP0603908A2 EP 0603908 A2 EP0603908 A2 EP 0603908A2 EP 93120852 A EP93120852 A EP 93120852A EP 93120852 A EP93120852 A EP 93120852A EP 0603908 A2 EP0603908 A2 EP 0603908A2
- Authority
- EP
- European Patent Office
- Prior art keywords
- signal
- signals
- common
- parameter
- generating
- Prior art date
- Legal status (The legal status is an assumption and is not a legal conclusion. Google has not performed a legal analysis and makes no representation as to the accuracy of the status listed.)
- Ceased
Links
Images




Classifications
-
- G—PHYSICS
- G06—COMPUTING OR CALCULATING; COUNTING
- G06T—IMAGE DATA PROCESSING OR GENERATION, IN GENERAL
- G06T5/00—Image enhancement or restoration
- G06T5/90—Dynamic range modification of images or parts thereof
- G06T5/92—Dynamic range modification of images or parts thereof based on global image properties
-
- G—PHYSICS
- G06—COMPUTING OR CALCULATING; COUNTING
- G06T—IMAGE DATA PROCESSING OR GENERATION, IN GENERAL
- G06T5/00—Image enhancement or restoration
- G06T5/40—Image enhancement or restoration using histogram techniques
-
- H—ELECTRICITY
- H04—ELECTRIC COMMUNICATION TECHNIQUE
- H04N—PICTORIAL COMMUNICATION, e.g. TELEVISION
- H04N1/00—Scanning, transmission or reproduction of documents or the like, e.g. facsimile transmission; Details thereof
- H04N1/40—Picture signal circuits
- H04N1/407—Control or modification of tonal gradation or of extreme levels, e.g. background level
- H04N1/4072—Control or modification of tonal gradation or of extreme levels, e.g. background level dependent on the contents of the original
- H04N1/4074—Control or modification of tonal gradation or of extreme levels, e.g. background level dependent on the contents of the original using histograms
-
- H—ELECTRICITY
- H04—ELECTRIC COMMUNICATION TECHNIQUE
- H04N—PICTORIAL COMMUNICATION, e.g. TELEVISION
- H04N1/00—Scanning, transmission or reproduction of documents or the like, e.g. facsimile transmission; Details thereof
- H04N1/46—Colour picture communication systems
- H04N1/56—Processing of colour picture signals
- H04N1/60—Colour correction or control
- H04N1/6027—Correction or control of colour gradation or colour contrast
Definitions
- the present invention relates to a method of determining a color separation rule employable in an image processor such as a process scanner and an apparatus for converting image signals of a plurality of originals, and in particular, relates to determination of a signal-conversion characteristic defining a color separation rule employable in an image processor such as a process scanner.
- a process color scanner which is disclosed in the U.S. Patent No. 4,679,095, for example, is known in the field of image processors for obtaining halftone dot images (reproduced images) from original images.
- the conventional process color scanner comprises an image scan reader 101, an image processing unit 102, an image scan recorder 103, a display device 104 and a data processor 105.
- the image scan reader 101 reads the image of an original (not shown) mounted on an input drum (or an original table).
- the image processing unit 102 comprises: a look-up table memory for storing a normalizing curve therein; a color computer for converting the Blue, Green and Red (R, G, B) components of image data into Yellow, Magenta, Cyan and Black (Y, M, C, K) components; and other circuits.
- the image processing unit 102 is operable to obtain input image data from the image scan reader 101 and to convert the input image data into output image data through the look-up table memory and the color computer.
- the normalizing curve defines a conversion characteristic for converting the range of the input image data or signals into a range appropriate to image recording by the image scan recorder 103.
- the image scan recorder 103 comprises a dot generator for receiving the output image data from the image processing unit 102 and converting the same into halftone dot signals. In response to the halftone dot signals, a halftone dot image is recorded through photo-scan of a photosensitive material which is mounted on an output cylinder or is linearly moved.
- the display device 104 has a CRT display, on which an image expressed by the output image data having been processed in the image processor 102 is displayed.
- the data processor 105 comprises a console, a CPU, a memory and the like, and is operable to generate the normalizing curve to be set in the look-up table memory in the image processor 102 on the basis of the input image data obtained by the image scan reader 101.
- the data processor 105 can correct the normalizing curve and designate regions on the image displayed on the CRT of in the display device 104 in response to manual operation of the console.
- an operator designates points on the original image to determine a highlight point and/or a shadow point, which will be hereinafter referred to as "reference density point(s)".
- the reference points are points through the normalizing curve passes , such the density levels of the pixels corresponding to the points are converted into predetermined levels.
- Fig. 13 depicts an example of the normalizing curve.
- the values D NX and D NH for the normalized density signals D NX are values common to all color components.
- the value D HX for the input signals is a highlight density value for each color component B, G, R, and the value D SX is a shadow density value for each color component B, G, R.
- the coordinates of the highlight point HL and a shadow point SD are (D HX , D NH ) and (D SX , D NS ), respectively. Accordingly, each input signal D X is converted by the normalizing curve C connecting the two points, whereby the normalized density signal D X which is in the range defined between the values D NH and D NS .
- the normalizing curve C is determined for each color component B, G, R to normalize each color component B, G, R, whereby an optimum color separation rule is obtained.
- the plurality of original images are color-separated according to a same color separation rule to unify the respective tones of recorded images of respective original images.
- a conventional technique to determine a uniform or common color-separation condition such that a typical one of the plurality of original images is selected by an operator and color-separation condition is determined for the selected one original image in accordance with the process described above. The color separation rule thus determined is applied to color-separation of respective original images.
- the present invention is directed to a method of converting image signals representative of a plurality of original images into converted image signals adapted to a predetermined image processing.
- the method comprising the steps of: a) obtaining a plurality of parameter signals depending on density distributions of the plurality of original images, respectively; b) averaging the plurality of parameter signals to obtain an averaged signal; c) generating a common parameter signal common to the plurality of original images in response to the averaged signal; d) generating a common signal-conversion characteristic in response to the common parameter signal; and e) converting each of the image signals through the signal-conversion characteristics to obtain the converted image signals, respectively.
- the common signal-conversion characteristic is obtained by averaging the plurality of parameter signals determined for the plurality of originals, it is not required for operators to select a specific original image to determine the common signal-conversion characteristic. Accordingly, the process of determining the common signal-conversion characteristic is easily atomized, and desirable signal conversion can be always attained.
- respective weights of the plurality of parameter signals are determined and a weighted average of the plurality of parameter signals using the weight signals is obtained.
- a weighted average signal representative of the weighted average is generated to thereby obtain the averaged parameter signal.
- the common signal-conversion characteristic can be obtained by designating the weights according to a priority order of the plurality of objective originals.
- the common signal-conversion characteristic reflects the operator's intention.
- difference signals representative of differences between the common parameter signal and respective ones of the parameter signals are generated.
- the difference signals is compared with a threshold signal, and a warning signal is generated when at least one of the plurality of parameter signals is deviated from a difference range defined by the threshold.
- the operator may change the respective parameter signals to obtain an optimum signal-conversion characteristic.
- the present invention also provide an apparatus adapted to the present method.
- an object of the present invention is to convert image signals representative of a plurality of originals through a signal-conversion characteristic which is common to respective image signals and is independent of operator's skill.
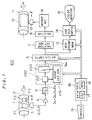
- Fig. 1 is a block diagram showing the overall structure of a process color scanner 100 according to a preferred embodiment of the present invention.
- a plurality of color original films F1, F2 and F3 serving as originals are wound around an original drum 2 and a pickup head 3 facing to the original drum 2 is provided.
- Main scannings and subscannings are attained by rotation of the original drum 2 in the direction (a main scanning direction) ⁇ and translation of the pickup head 3 in the direction (a subscanning direction) ⁇ , respectively.
- the color images on the original films F1, F2 and F3 are photoelectrically read by the pickup head 3 for each pixel according to the order of scanning lines, to obtain color image signals.
- the image signals representing respective density for each pixel of images on the original films F1, F2 and F3 are converted into logarithm signals by logarithm converter 4 for each color component of blue (B), green (G) and red (R), and then, are further converted into digital density signals D B , D G and D R in an A/D converter 5.
- the normalizing converter 200 comprises a switching circuit 201, a normalizing curve generator 210 and a look-up table (LUT) 202.
- the switching circuit 201 connects its input to the normalizing curve generator 210.
- the normalizing curve generator 210 determines a common color separation rule (high light density values and shadow density values) on the basis of density values (the density signals D X ) of each pixel and frequency of densities appearing on the original films F1, F2 and F3 according to a method described later, to thereby obtain a normalizing curve such as the curve or line shown in Fig. 13.
- the data representing the normalizing curve is loaded to the LUT 202 in the form of numerical data for each color component.
- the switch circuit 201 opens the connection to the normalizing curve generator 210 and closes the connection to the LUT 202.
- the density signals D X of each pixel obtained by scanning the originals again are normalized by the data stored in the LUT 202 to become normalized density signals D NX , which are transmitted to a first color computer 6 provided in the next stage.
- the color computer 6 converts the normalized density signals D X into color component signals for Yellow (Y), Magenta (M), Cyan (C) and Black (K) blocks corresponding to respective halftone dot percentages.
- the color component signals for blocks are converted into Y, M, C and K halftone dot signals in a halftone dot generator 7.
- a selector 8 combines the halftone dot signals with each other in a time-sharing form and the resultant combined signals are outputted to an output circuit 9.
- the recording head 10 comprises a laser source therein and modulates a laser beam in a binary form, i.e., ON and OFF, in response to a modulation signals which are the combined signals inputted.
- a photosensitive film 12 is wound around a recording drum 11.
- the laser beam exposes the photosensitive film 12 for each pixel in the order of scanning lines to record color component images for Y, M, C and K on respective areas of the photosensitive film 11.
- the color component signals for Y, M, C and K blocks are stored in a monitor frame memory 13 for each pixel, and then, converted back to B-, G- and R-color component signals in a second color computer 14 to be displayed on a color monitor device 15.
- An operator can observe the processed color image on the display device to monitor the result of the image processing in the normalizing converter 200 and the first color computer 6 while operating the process scanner.
- a data processor 16 is provided with a CPU 17 and a memory 18 storing system programs, which are operable to control the respective operations of the normalizing converter 200, the first color computer 6, the monitor frame memory 13 and the second color computer 14.
- a console 19 is used for inputting commands and data through manual operation thereof.
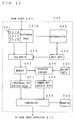
- Fig 2 is a block diagram showing the structure of the normalizing curve generator 210 in the normalizing converter 200 according to the preferred embodiment of the present invention.
- the normalizing curve generator 210 comprises an input portion 220, a color separation rule generating portion 230 and a normalizing curve generating portion 250. Details of these porions will be described with the operation of generating normalizing curves shown in the flowcharts of Figs. 3, 4 and 5.
- signals expressing representative average density values of the original images F1, F2 and F3, which are parameters of individual color separation rules, are generated on the basis of respective density distribution characteristics on the original films F1, F2 and F3.
- the signals expressing representative average density values are averaged to obtain the common color separation rules. Details of the process are as follows:
- the image signals obtained by the prescanning are converted into the digital image signals D X by the logarithm converter 4 and the A/D converter 5 (Fig. 1), as described above.
- the digital image signals D X are transmitted to a frame memory 221 (Fig. 2), which is provided in the input portion 220, through the switching circuit 201.
- the digital image signals D X are stored in the frame memory 221 for each color component of B, G, R and each pixel (the process step S1 of Fig. 3).
- the storage of the density signals D X in the frame memory 221 is conducted while skipping pixels in the density signals D X .
- a sample-area determining portion 222 determines respective sample areas to be analyzed on the original films F1, F2 and F3, which are objective areas analyzed to determine color separation rules of the original films F1, F2 and F3 (the process step S2).
- the sample areas are rectangular areas determined by designating the coordinates of respective ends of a diagonal line of each rectangle. For example, suppose that images I1, I2 and I3 on the original films F1, F2 and F3 are displayed on the color monitor 15 in the prescanning step, as illustrated in Fig. 6.
- step S3 the value "1" is set for a count value j of a counter 222a provided in the sample-area determining portion 222 and the density signal D X of each pixel included in the pixel group on the sample area A1 are transmitted to the color separation rule generating portion 230.
- the next process step S100 is a subroutine for obtaining highlight-side average density values D HAX and shadow-side average density values D SAX for the sample area A j determined by the sample-area determining portion 222.
- the values D HAX and D SAX represent the density distribution character of the sample area A j and are hereinafter referred to as "representative average density values D AX " in general.
- the representative average density values D AX may be determined as follows:
- Fig. 4 is a flowchart illustrating the details of the process step S100.
- An average density histogram generator 231N generates signals representative of an average density histogram for each color component on a histogram plane defined by an abscissa representing respective ranks of the average density and an ordinate representing the number N X of pixels belonging to respective ranks.
- accumulated density histogram generators 231B, 231G and 231R accumulate or sum up the density signals D X for respective color components B, G and R of the pixels belonging to each rank of the average density histogram, respectively.
- the accumulated histogram is also represented by electric signals.
- the process steps S101 and S102 may be conducted in parallel.
- an accumulation processor 232 generates signals representing an accumulated relative histogram shown in Fig. 9 from the average density histogram shown in Fig. 7.
- the accumulated relative histogram takes their values from 0% to 100% in the range from the minimum density D Mmin to the maximum density D Mmax .
- the accumulated relative histogram illustrated in Fig. 9 is approximated by a continuous curve under the assumption that the width of each rank is sufficiently small.
- Predetermined values R NH and R NS of accumulated frequency are registered in a section determining portion 233.
- a tentative highlight average density value D MH and a tentative shadow average density value D MS are obtained by applying the accumulated frequency values R NH and R NS to the accumulated relative histogram of Fig. 9.
- Data related to density sections of the highlight side and the shadow side, from which average density values are to be obtained, are generated from the tentative highlight average density value D MH and the tentative shadow average density value D MS and are delivered to an average density operating portion 234.
- the accumulated frequency values R NH and R NS are previously determined as resulting optimum highlight and shadow points, which may be obtained by previously analyzing many original images. For example, the accumulated frequency values R NH and R NS are 1% and 98%, respectively.
- the average density operating portion 234 averages respective density values of pixels for each color component included in the sections determined by the section determining portion 233, whereby representative average density values D AX are obtained (the process step 105).
- the accumulated density values ⁇ D X are averaged for each color component within: the density section (D Mmin ⁇ D M ⁇ D H ) lower than the tentative highlight average density value D H for the highlight side; and the density section (D MS ⁇ D M ⁇ D Mmax ) higher than the tentative shadow average density value D S for the shadow side, as illustrated in Fig. 10 with slanted lines.
- the highlight-side average density value D HAX and the shadow-side average density value D SAX are defined by the following expressions (1) and (2):
- D HAX ⁇ ( ⁇ D X ) H / ⁇ N PH (1)
- D SAX ⁇ ( ⁇ D X ) S / ⁇ N PS (2)
- ⁇ N PH is the total number of pixels belonging to the density section determined for the highlight-side
- ⁇ ( ⁇ D X ) H is the sum of the accumulated density values for each color component in the density section determined for the highlight-side
- ⁇ N PS is the total number of pixels belonging to the density section determined for the shadow-side
- ⁇ ( ⁇ D X ) S is the sum of the accumulated density values for each color component in the density section determined for the shadow-side.
- the representative average density value D AX for the sample area Aj obtained in the process step S100 is stored in a memory 235.
- the process step S5 If the count j of the counter 222a is not less than "3", in the process step S5, it is found that the representative average density value D AX has been obtained for all sample areas A j , so that the process proceeds to the process step S7.
- a weighted average calculator 236 calculates a weighted average of respective representative average density values D AX by using the following expression (3), to thereby obtain signals expressing representative density value D CX .
- the representative density values D CX are common to respective original films F j and are hardly influenced by individual skill or character of operators, so that determination of color separation rules are easily atomized.
- the representative density values D CX obtained in the weighted average calculator 236 are compared with respective representative average density values D AX stored in the memory 235 and it is judged whether or not the absolute values of their differences D d (herein after referred to as "density differences") are less than a predetermined threshold D L .
- the comparison and judgement are conducted in a comparator 238.
- the threshold D L may be different between the highlight-side and the shadow-side.
- the threshold D L may be previously and experientially obtained by analyzing many original images and is a limit of the color separation rules applied to original films having predetermined density distribution character.
- the process returns to the process step S11 and a warning signal indicating the deviation is generated by a warning portion 239.
- the warning signal may be used to generate a warning message on the color monitor 15, or to generate a warning sound.
- the operator temporally stops determination of color separation rules in response to the warning. The selection of next process step after the warning is entrusted to the operator.
- the operator may try to determine color separation rules again while changing the analyzing conditions by: (1) newly determining the sample areas A j in the sample-area determining portion 222; or (2) changing the weights W j for respective original films to other weight values in the weight determining portion 237, for example, to obtain signals representing new representative density values D CX .
- color separation rules are determined by obtaining a highlight density value D HX and a shadow density value D SX (herein after referred to as "reference density values") for each color component. That is, a highlight point HL and a shadow point SD (Fig. 13) on a normalizing coordinate plane are determined on the basis of the highlight density value D HX and the shadow density value D SX , respectively, and a normalization curve C is so determined as to pass through the highlight point HL and the shadow point SD.
- the representative density values D CX are common to all objective original films and represent the density values on the highlight and shadow sides as a whole. Accordingly, the representative density values D CX themselves may be employed as highlight density values D HX and shadow density values D SX common to all objective originals.
- reference density values are determined for each color component in a common reference density value determining portion 240 so that gray balance for the representative density values D CX is maintained, as follows:
- Fig. 5 is a flowchart showing the details of the process step S200 corresponding to the determination of the reference density values.
- the representative density values D CX are classified into highlight-side representative density values D HCX and shadow-side representative density values D SCX .
- reference density values i.e., highlight density reference value D HO and a shadow density reference value D SO , commonly applicable to respective color components are determined on the basis of the highlight-side representative density value D HCX and the shadow-side representative density value D SCX , respectively.
- the reference density values are represented by reference density signals.
- the highlight density reference value D HO is obtained by a weighted average of a standard highlight density value D HF and a minimum one of the highlight-side representative density values D HCX
- the shadow density reference value D SO is obtained by a weighted average of a standard shadow density value D SF and a maximum one of the shadow-side representative density values D SCX , for example.
- the standard highlight density value D HF and the standard shadow density value D SF are previously obtained as reference density values applicable to many originals.
- the highlight density reference value D HO and the shadow density reference value D SO may be determined by weighted averages or simple averages of the highlight-side representative density values D HCX and the shadow-side representative density values D SCX for respective color components, respectively.
- correction signals representing highlight correction values ⁇ D HX and shadow correction values ⁇ D SX for the reference density values are generated in accordance with the following expressions (4) and (5):
- ⁇ D HX K H ⁇ GH(D HCX - D HO )
- ⁇ D SX K S ⁇ GS(D SCX - D SO )
- D Hmax MAX(D HCB , D HCG , D HCR )
- D Hmin MIN(D HCB , D HCG , D HCR )
- the highlight correction values ⁇ D HX and the shadow correction values ⁇ D SX are proportional to (D HCX - D HO ) and (D SCX - D SO ), respectively.
- the value (D HCX - D HO ) reflects uniform deviation of color tone in the highlight part while the value (D SCX - D SO ) reflects uniform deviation of color tone in the shadow part.
- the highlight density value D HX and the shadow density value D SX thus obtained for each color component are reference density values not only common to the all original films F1, F2 and F3 but also effective to suppress uniform color deviation of color tone and maintain gray balance.
- the normalizing curve generating portion 250 determines normalizing curve for each color component on the basis of the common reference density values (the highlight density value D HX and the shadow density value D SX ) (the process step S10).
- the determination is attained by providing the reference density values to the highlight density value D HX and the shadow density value D SX of the input density signals D X for defining the highlight point HL and the shadow point SD on the normalizing curve C of Fig. 13.
- numerical data representing the respective normalizing curve C is generated and are stored in the LUT 202 of Fig. 1 for each color component.
- the density signals D X for each pixel obtained in the regular scanning are normalized through the data stored in the LUT 202.
Landscapes
- Engineering & Computer Science (AREA)
- Physics & Mathematics (AREA)
- General Physics & Mathematics (AREA)
- Theoretical Computer Science (AREA)
- Multimedia (AREA)
- Signal Processing (AREA)
- Facsimile Image Signal Circuits (AREA)
Applications Claiming Priority (3)
| Application Number | Priority Date | Filing Date | Title |
|---|---|---|---|
| JP35819392 | 1992-12-25 | ||
| JP358193/92 | 1992-12-25 | ||
| JP312700/93 | 1993-11-17 |
Publications (2)
| Publication Number | Publication Date |
|---|---|
| EP0603908A2 true EP0603908A2 (de) | 1994-06-29 |
| EP0603908A3 EP0603908A3 (de) | 1996-02-07 |
Family
ID=18458017
Family Applications (1)
| Application Number | Title | Priority Date | Filing Date |
|---|---|---|---|
| EP93120852A Ceased EP0603908A3 (de) | 1992-12-25 | 1993-12-23 | Verfahren und Gerät zur Bildsignalkonvertierung. |
Country Status (1)
| Country | Link |
|---|---|
| EP (1) | EP0603908A3 (de) |
Cited By (9)
| Publication number | Priority date | Publication date | Assignee | Title |
|---|---|---|---|---|
| DE19508545C1 (de) * | 1995-03-10 | 1996-09-19 | Inst Rundfunktechnik Gmbh | Verfahren zum gleichzeitigen Wiegergeben von mehreren stehenden Farbbildern auf einem Bildschirm |
| EP0747855A3 (de) * | 1995-06-05 | 1997-08-20 | Xerox Corp | Verfahren und Vorrichtung zur Verbesserung eines numerischen Bildes |
| EP0794513A1 (de) * | 1996-03-09 | 1997-09-10 | Samsung Electronics Co., Ltd. | Verfahren und Schaltungsanordnung zur Bildverbesserung durch verteilten Histogrammausgleich mit Hilfe einer quantisierten mittleren Bildhelligkeit |
| WO1997034257A1 (en) * | 1996-03-14 | 1997-09-18 | Polaroid Corporation | Method and apparatus for pixel level luminance adjustment |
| WO2000062528A1 (en) * | 1999-04-13 | 2000-10-19 | Athentech Technologies Inc | Virtual true color light amplification |
| US6677959B1 (en) | 1999-04-13 | 2004-01-13 | Athentech Technologies Inc. | Virtual true color light amplification |
| EP1351489A3 (de) * | 2002-03-20 | 2004-10-27 | Eastman Kodak Company | Verfahren zur Digitalen Farbbildverarbeitung |
| US6961066B2 (en) | 1999-04-13 | 2005-11-01 | Athentech Technologies, Inc. | Automatic color adjustment for digital images |
| CN111290001A (zh) * | 2018-12-06 | 2020-06-16 | 杭州海康威视数字技术股份有限公司 | 一种基于gps坐标的目标统筹方法、装置及设备 |
Family Cites Families (3)
| Publication number | Priority date | Publication date | Assignee | Title |
|---|---|---|---|---|
| JPS6120042A (ja) * | 1984-07-06 | 1986-01-28 | Dainippon Screen Mfg Co Ltd | 画像走査記録方法及び装置 |
| JPH0683373B2 (ja) * | 1988-12-09 | 1994-10-19 | 大日本スクリーン製造株式会社 | 基準濃度点の設定方法 |
| US5117293A (en) * | 1989-11-28 | 1992-05-26 | Dainippon Screen Mfg. Co. Ltd. | Method of and apparatus for generating conversion curve employable for converting reproduction characteristic of image |
-
1993
- 1993-12-23 EP EP93120852A patent/EP0603908A3/de not_active Ceased
Cited By (13)
| Publication number | Priority date | Publication date | Assignee | Title |
|---|---|---|---|---|
| DE19508545C1 (de) * | 1995-03-10 | 1996-09-19 | Inst Rundfunktechnik Gmbh | Verfahren zum gleichzeitigen Wiegergeben von mehreren stehenden Farbbildern auf einem Bildschirm |
| EP0747855A3 (de) * | 1995-06-05 | 1997-08-20 | Xerox Corp | Verfahren und Vorrichtung zur Verbesserung eines numerischen Bildes |
| EP0794513A1 (de) * | 1996-03-09 | 1997-09-10 | Samsung Electronics Co., Ltd. | Verfahren und Schaltungsanordnung zur Bildverbesserung durch verteilten Histogrammausgleich mit Hilfe einer quantisierten mittleren Bildhelligkeit |
| WO1997034257A1 (en) * | 1996-03-14 | 1997-09-18 | Polaroid Corporation | Method and apparatus for pixel level luminance adjustment |
| GB2363933B (en) * | 1999-04-13 | 2003-08-27 | Athentech Tech Inc | Virtual true color light amplificaion |
| GB2363933A (en) * | 1999-04-13 | 2002-01-09 | Athentech Tech Inc | Virtual true color light amplificaion |
| WO2000062528A1 (en) * | 1999-04-13 | 2000-10-19 | Athentech Technologies Inc | Virtual true color light amplification |
| US6677959B1 (en) | 1999-04-13 | 2004-01-13 | Athentech Technologies Inc. | Virtual true color light amplification |
| US6961066B2 (en) | 1999-04-13 | 2005-11-01 | Athentech Technologies, Inc. | Automatic color adjustment for digital images |
| EP1351489A3 (de) * | 2002-03-20 | 2004-10-27 | Eastman Kodak Company | Verfahren zur Digitalen Farbbildverarbeitung |
| US7085007B2 (en) | 2002-03-20 | 2006-08-01 | Eastman Kodak Company | Digital color image processing method |
| CN111290001A (zh) * | 2018-12-06 | 2020-06-16 | 杭州海康威视数字技术股份有限公司 | 一种基于gps坐标的目标统筹方法、装置及设备 |
| US11985428B2 (en) | 2018-12-06 | 2024-05-14 | Hangzhou Hikvision Digital Technology Co., Ltd. | GPS coordinates-based target overall planning method and camera |
Also Published As
| Publication number | Publication date |
|---|---|
| EP0603908A3 (de) | 1996-02-07 |
Similar Documents
| Publication | Publication Date | Title |
|---|---|---|
| US7085009B2 (en) | Image processing apparatus and method | |
| US5018008A (en) | Method of and appartus for setting color separation | |
| US5907415A (en) | Image processing apparatus with color gamut dependent on color mode | |
| US5870491A (en) | Image processing apparatus which controls processing conditions of an image signal on detected features of the image signal | |
| US5844699A (en) | Color image processing apparatus | |
| US5296939A (en) | Image area discriminating system for an image processing apparatus | |
| US5130935A (en) | Color image processing apparatus for extracting image data having predetermined color information from among inputted image data and for correcting inputted image data in response to the extracted image data | |
| JP3359116B2 (ja) | 画像処理方法及び装置 | |
| US6417932B1 (en) | Image processor | |
| EP0430165B1 (de) | Verfahren und Anordnung zur Erzeugung einer zur Umsetzung einer Bildreproduktionscharakteristik verwendbaren Umsetzungscharakteristik | |
| US5754708A (en) | Dotted image area detecting apparatus and dotted image area detecting method | |
| US5164837A (en) | Method of correcting setup parameter decision characteristics and automatic setup apparatus using a neural network | |
| US6377703B1 (en) | Apparatus and method for determining an area encompassing an image for scanning the image | |
| US5323241A (en) | Method of and an apparatus for generating a normalizing curve | |
| US6330075B1 (en) | Image processing method and apparatus | |
| US5130819A (en) | Image processing apparatus | |
| EP0603908A2 (de) | Verfahren und Gerät zur Bildsignalkonvertierung | |
| US5867634A (en) | Image processor | |
| US5461490A (en) | Method of and apparatus for converting image signals representing a plurality of originals | |
| JP3452212B2 (ja) | 減色処理を行なうカラー画像処理装置 | |
| JPH11220631A (ja) | 画像処理装置 | |
| US6891641B1 (en) | Method and apparatus for converting number of colors and processing image data | |
| JP3630827B2 (ja) | 色変換装置および色変換方法 | |
| JPS60136478A (ja) | 画調識別方法 | |
| JP3587740B2 (ja) | 画像処理装置 |
Legal Events
| Date | Code | Title | Description |
|---|---|---|---|
| PUAI | Public reference made under article 153(3) epc to a published international application that has entered the european phase |
Free format text: ORIGINAL CODE: 0009012 |
|
| AK | Designated contracting states |
Kind code of ref document: A2 Designated state(s): DE FR GB |
|
| PUAL | Search report despatched |
Free format text: ORIGINAL CODE: 0009013 |
|
| AK | Designated contracting states |
Kind code of ref document: A3 Designated state(s): DE FR GB |
|
| 17P | Request for examination filed |
Effective date: 19960508 |
|
| 17Q | First examination report despatched |
Effective date: 19980403 |
|
| GRAG | Despatch of communication of intention to grant |
Free format text: ORIGINAL CODE: EPIDOS AGRA |
|
| STAA | Information on the status of an ep patent application or granted ep patent |
Free format text: STATUS: THE APPLICATION HAS BEEN REFUSED |
|
| 18R | Application refused |
Effective date: 19990610 |