EP0660257A2 - Détermination de seuil automatique pour un scanner numérique - Google Patents
Détermination de seuil automatique pour un scanner numérique Download PDFInfo
- Publication number
- EP0660257A2 EP0660257A2 EP94308738A EP94308738A EP0660257A2 EP 0660257 A2 EP0660257 A2 EP 0660257A2 EP 94308738 A EP94308738 A EP 94308738A EP 94308738 A EP94308738 A EP 94308738A EP 0660257 A2 EP0660257 A2 EP 0660257A2
- Authority
- EP
- European Patent Office
- Prior art keywords
- cell
- peak
- graylevel
- pixel
- determining
- Prior art date
- Legal status (The legal status is an assumption and is not a legal conclusion. Google has not performed a legal analysis and makes no representation as to the accuracy of the status listed.)
- Granted
Links
Images








Classifications
-
- H—ELECTRICITY
- H04—ELECTRIC COMMUNICATION TECHNIQUE
- H04N—PICTORIAL COMMUNICATION, e.g. TELEVISION
- H04N1/00—Scanning, transmission or reproduction of documents or the like, e.g. facsimile transmission; Details thereof
- H04N1/40—Picture signal circuits
- H04N1/403—Discrimination between the two tones in the picture signal of a two-tone original
-
- G—PHYSICS
- G06—COMPUTING OR CALCULATING; COUNTING
- G06V—IMAGE OR VIDEO RECOGNITION OR UNDERSTANDING
- G06V30/00—Character recognition; Recognising digital ink; Document-oriented image-based pattern recognition
- G06V30/10—Character recognition
- G06V30/16—Image preprocessing
- G06V30/162—Quantising the image signal
-
- G—PHYSICS
- G06—COMPUTING OR CALCULATING; COUNTING
- G06V—IMAGE OR VIDEO RECOGNITION OR UNDERSTANDING
- G06V30/00—Character recognition; Recognising digital ink; Document-oriented image-based pattern recognition
- G06V30/10—Character recognition
Definitions
- the present invention relates generally to digital image scanners and more specifically to a method and system for automatically determining the brightness threshold for multiple portions of a scanned page.
- Digital scanners are often used to digitize document pages so the text thereon can be manipulated using a computer.
- a scanner coupled to an optical character recognition device can be used to digitize text and put it into a format recognized by a word processing program. This allows an operator to revise or modify the document using the word processor.
- This process of scanning and digitizing text is often referred to as optical character recognition (OCR).
- Contemporary black and white digitizing scanners typically convert a document (i.e. one or more pages of text and/or graphics) into a plurality of pixels each represented by a certain number of bits for a given resolution.
- the bits of each pixel refer to a graylevel of that pixel.
- 256 colors or shades of gray
- One common format is to use four bits per pixel to represent a tonal range of 0 to 15, where 0 (or 15) is pure black and 15 (or 0) is pure white.
- the scanner When an image is scanned and digitized, the scanner first determines the graylevel for each pixel.
- the graylevel is the level of brightness of that pixel. For example, for 64 shades of gray, a graylevel of 0 (digital 000000) may indicate white while a graylevel of 63 (digital 111111) indicates black. All graylevels in between these limits represent the shades of gray between black and white.
- each pixel is either black or white (which can be represented by a binary 1 or 0). Storing a digital image with only one bit per pixel is more efficient than storing the image with multiple bits per pixel.
- a threshold level must be determined. For example, scanned pixels having a graylevel below the threshold level will be set to appear as background (e.g., white), while pixels having a graylevel above threshold will be set to appear as foreground matter (e.g., black).
- One technique used with conventional scanners is to have a human operator manually adjust the threshold level (sometimes called intensity or brightness) for a document to be scanned.
- the threshold level sometimes called intensity or brightness
- accurate threshold determination is critical for performing OCR.
- An additional problem with a manual determination and setting of the threshold level is that an operator is required to estimate the correct setting in advance and then, perhaps by trial and error, make adjustments to optimize the quality of the scanned document. This can lead to wasted time.
- threshold is determined for the entire page being scanned. If one threshold level would be appropriate for one area of the page and a second level would be better for a second area, one portion of the page would not be of optimum quality.
- the present invention is directed toward a system and method for automatically determining the threshold level of a digitizing scanner.
- a scanned page is divided into cells.
- Each cell is digitized into an array of pixels, wherein each pixel is represented by a plurality of bits.
- the bits represent the graylevel of the pixel.
- the first step in determining the threshold is to construct a co-occurrence matrix.
- the co-occurrence matrix is a two-dimensional matrix indicating the number of pixels at each graylevel that are adjacent to pixels at another graylevel.
- One-dimensional histograms and other features of the cell are extracted from the co-occurrence matrix.
- the one-dimensional histogram extracted from the co-occurrence matrix is used to determine the graylevel of the foreground and background peaks of the scanned cell.
- the histogram is then used to determine how sharp and how broad the peaks are. These features of the peaks indicate the extent of the peaks. The determination is based on the number of pixels at graylevels of each peak.
- the delta between the peaks can be determined.
- the delta is an indication of the difference between the foreground peak and the background peak.
- the delta takes into account the extent of the two peaks.
- the delta is then used to determine the influence of the background and foreground peaks in the cell. This influence can be determined by performing a simple table lookup based on the value of the delta.
- a second one-dimensional histogram is used in conjunction with the co-occurrence matrix to determine the deviation of the foreground peak.
- This second one-dimensional histogram is created by collapsing the co-occurrence matrix and summing the rows of the collapsed matrix. Each sum is entered into the element of the second one-dimensional histogram that corresponds to the summed row.
- This second one-dimensional histogram is used to calculate the deviation of the foreground peak. The deviation is then used to determine the weight of the foreground.
- values are determined to be used in calculating the center of mass for the cell.
- the center of mass is then used to determine the threshold for the system.
- Fig. 1 is a high-level operational flow diagram illustrating the steps of determining a threshold level according to the present invention.
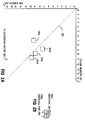
- Fig. 2A is a diagram illustrating the structure of a co-occurrence matrix.
- Fig. 2B is a diagram illustrating pixel graylevel pairs used to complete a co-occurrence matrix.
- Fig. 3 is an operational flow diagram illustrating the steps of constructing a co-occurrence matrix for a cell.
- Fig. 4 illustrates an example of a completed co-occurrence matrix for a cell.
- Fig. 5 is an operational flow diagram illustrating the steps of determining foreground and background peaks for a cell.
- Fig. 6 illustrates an example of a one dimensional histogram constructed using the co-occurrence matrix illustrated in Fig. 4.
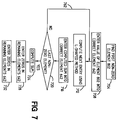
- Fig. 7 is an operational flow diagram illustrating the manner in which a one-dimensional histogram is constructed from a co-occurrence matrix.
- Fig. 8 illustrates the manner in which the co-occurrence matrix illustrated in Fig. 4 is used to construct the one-dimensional histogram illustrated in Fig. 6.
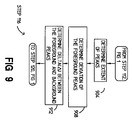
- Fig. 9 is an operational flow diagram illustrating the manner in which features of peaks are determined.
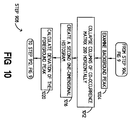
- Fig. 10 is an operational flow diagram illustrating the manner in which the deviation of the foreground peak is determined.
- Fig. 11 illustrates the collapse of the example co-occurrence matrix to construct a second one-dimensional histogram.
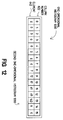
- Fig. 12 illustrates an example of a second one-dimensional histogram constructed from the collapsed co-occurrence matrix illustrated in Fig. 11.
- Fig. 13 is an operational flow diagram illustrating the manner in which the center of mass for the cell is determined.
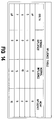
- Fig. 14 is a diagram illustrating the influence values for various delta values in one embodiment of the invention.
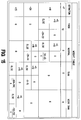
- Fig. 15 is a diagram illustrating in tabular format the foreground weight for various deviation values in one embodiment of the invention.
- Fig. 16 is a diagram illustrating in graphic format the foreground weight for various deviation values in one embodiment of the invention.
- Fig. 17 is a diagram illustrating a representative architecture of an automatic threshold determination system.
- the present invention is directed to a method and system for automatically determining the correct threshold level for scanning and digitizing a document using an optical scanner.
- the scanner produces a digital image of each pixel on the document.
- This digital image can then be used by OCR software which converts the image to computer readable (e.g., ASCII) form.
- OCR software converts the image into computer readable form, the image must first be separated into text and background.
- a page of a document is scanned.
- the scanned page is virtually divided into regions called "cells.”
- Each cell is scanned and digitized into an array of pixels that are represented digitally.
- each pixel can be represented by one or several bits. The bits represent the shade or "graylevel" of the pixel.
- a co-occurrence matrix is constructed that represents the number of adjacent graylevels in each cell.
- the co-occurrence matrix is collapsed, and the collapsed matrix is used to construct a one-dimensional matrix called a "histogram.” From the histogram, the graylevel of the foreground and background peaks can be determined. The histogram is used to determine the extent of the peaks and the delta between the foreground and background peaks.
- a second one-dimensional histogram is extracted form the collapsed co-occurrence matrix to determine the deviation of the foreground peak. This information indicates the type of foreground (e.g. thin, very thin, thick, etc.) and the type of background (e.g. white, light color, dark color, etc.).
- a form of fuzzy logic is used to then determine the optimum threshold based on the deviation and the delta determined above.
- the threshold value is used in subsequent operations to convert the scanned image from a multiple bit-per-pixel image to a one bit-per-pixel image. For example, scanned pixels having a graylevel below the threshold level are set to appear as background (e.g., white, with a single bit representation of 0) while pixels having a graylevel at or above the threshold are set to appear as foreground matter (e.g., black, with a single bit representation of 1).
- This series of steps is performed for each cell so that a threshold level is calculated for each cell of the scanned page.
- a threshold level is calculated for each cell of the scanned page.
- Fig. 1 is an operational flow diagram illustrating the steps involved with determining the threshold level for a scanner according to one embodiment of the invention.
- a page to be digitized is scanned by a digitizing scanner.
- the scanner operates at a resolution defined in part by the number of pixels per unit area (i.e. the "pixel density") used to represent the digitized image. For a greater pixel density, the scanned image can be represented at a higher resolution.
- Each pixel is represented by one or more bits.
- the bits indicate the shading of the pixel. As discussed above, this is referred to as the graylevel of the pixel. If 8 bits per pixel are used, each pixel can be assigned a value representing one of two-hundred-and-fifty-six (256) graylevels. In the illustrated embodiment, 4 bits per pixel are used to represent one of sixteen (0-15) graylevels. Thus, each pixel is scanned and assigned a graylevel from zero (0) to fifteen (15); zero being the lightest (e.g., white) and 15 being the darkest (e.g., black).
- a co-occurrence matrix is constructed for each cell of the page.
- the cell is a region of the page, the size of which is chosen by making a performance/quality tradeoff. If the cell size is designated as smaller (corresponding to a greater number of cells per page), more threshold determinations can be made for each page. Such a smaller designation provides an accurate threshold determination for smaller portions of the page.
- Fig. 2A is a diagram illustrating the framework of a co-occurrence matrix.
- Fig. 2b is a diagram illustrating the manner in which the graylevel value for each pixel is paired for use in constructing the co-occurrence matrix.
- Fig. 3 is an operational flow diagram illustrating the steps involved in constructing the co-occurrence matrix.
- a co-occurrence matrix 200 is a symmetrical matrix having a number of rows and columns that is equal to the number of possible graylevels in each cell.
- co-occurrence matrix 200 is a symmetrical 16 X 16 matrix.
- Each row is identified by a row number 208, and each column is identified by a column number 212.
- each row and column is an element 204 of co-occurrence matrix 200.
- element 204A At the intersection of row 7 and column 9 is element 204A; at the intersection of row 9 and column 10 is element 204C; and at the intersection of row 10 and column 11 is element 204B.
- elements can also be referred to by their coordinates: for example, (7,9), (9,10), and (10,11), respectively.
- each element 204 of co-occurrence matrix 200 is initialized to an initial value (such as zero (0)).
- pixel graylevel pairs are determined.
- the resultant pixel pattern can be paired into a pair of adjacent pixel graylevel values 224 referred to as a pixel graylevel pair 220.
- This pair indicates that a pixel of a first graylevel 224 value is adjacent to a pixel having a second graylevel 224 value.
- two pixel graylevel pairs are illustrated.
- a first pair 220 indicates that a pixel with a graylevel 224 of seven is next to a pixel having a graylevel 224 of nine.
- a second pair indicates that a pixel with a graylevel 224 of ten (represented by HEX A) is next to a pixel having a graylevel 224 of eleven (represented by HEX B).
- Grouping of pixel graylevels 224 into pairs as illustrated in Fig. 2B describes only one possible embodiment of the invention. Additional and/or alternative groupings could be implemented. For example, additional pairs 220 could be defined using these same four pixels but in different combination. The inventors have determined that the marginal increase in scanned quality obtained by including these additional pair does not warrant the additional processing time required in subsequent steps to handle such an increase in the number of pairs 220.
- each pixel graylevel pair 220 indicates that a pixel having a first graylevel 224 is adjacent to another pixel having a second graylevel 224. Note that these two graylevels 224 that make up the pair 220 can be the same.
- one pair 220 indicates that a pixel having a graylevel 224 of seven is next to a pixel having a graylevel 224 of 9.
- element 204A i.e. element (7,9)
- the element 204 corresponding to the intersection of row X, column Y e.g. element (X,Y) is incremented.
- each element 204 for each X,Y intersection contains a number indicating the number of times a pixel having a graylevel 224 of X is adjacent to a pixel having a graylevel 224 of Y.
- a pair given by (X,Y) is the same as pair (Y,X).
- a graylevel 224 of 7 next to a graylevel 224 of 9 is the same as a graylevel 224 of 9 next to a graylevel 224 of 7. Therefore, in a step 108 (referring back to Fig. 1) co-occurrence matrix 200 is collapsed such that only elements 204 on and above the main diagonal (represented by dashed line 232) of co-occurrence matrix 200 are incremented.
- element 204A is incremented twice and an element 214 does not need to be incremented (because (7,9) is the same as (9,7)).
- only data in elements 204 on and above the main diagonal need to be processed.
- FIG. 4 An example of a co-occurrence matrix 200 with data from a cell inserted therein is illustrated in Fig. 4.
- Fig. 4 in this example there are seven (7) occurrences of a pixel with a graylevel 224 of three (3) next to a pixel with a graylevel 224 of four (4) (see element 404), two (2) occurrences of a pixel with a graylevel 224 of three (3) next to a pixel with a graylevel 224 of five (5) (see element 408), one-hundred and three (103) occurrences of a pixel with a graylevel 224 of four (4) next to a pixel with a graylevel 224 of four (4) (see element 412), ninety-five (95) occurrences of a pixel with a graylevel 224 of four (4) next to a pixel with a graylevel 224 of five (5) (see element 416), and so on.
- data is entered only into elements on and above the main diagonal of the matrix 200.
- a step 112 the background and foreground peaks of the scanned cell are determined.
- the manner in which this is accomplished is illustrated in Fig. 5.
- Fig. 5 is an operational flow diagram illustrating the manner in which cell peaks are determined according to one embodiment of the invention.
- a one-dimensional histogram of graylevel data is constructed using the co-occurrence matrix 200 (Fig. 2A).
- the one-dimensional histogram is used to determine where the foreground and background peaks are located in the scanned cell in a step 508.
- An example of a one-dimensional histogram is illustrated in Fig. 6. This example is constructed from the example co-occurrence matrix 400 (a specific example of generic matrix 200 in Fig. 2A) illustrated in Fig. 4.
- the one-dimensional histogram 600 can be constructed in a number of different ways. It is typically constructed by summing proximate data points along the main diagonal of the co-occurrence matrix 200 for the cell. A preferred method by which the one-dimensional histogram 600 is constructed by summing proximate data points is illustrated in Figs. 7 and 8.
- a step 704 the main diagonal is traversed until the first non-zero entry is found.
- this is element 802 which has a value of 103.
- the value in element 802 (the first non-zero element) is entered into an element 642 of the one-dimensional histogram 600 at the column number 622 corresponding to the column number 212 in which element 802 is found.
- the value 103 is entered into column 4. Because the values in the elements along the main diagonal to the left of element 802 are zero, zeros are entered in the elements 642 having column numbers 622 corresponding to column numbers 212. This is illustrated in Fig. 6 for columns 0 - 3.
- a step 712 the entry for the next horizontal location (in this example, location 5) is computed using an "L-shaped method."
- the value for the next element along the main diagonal is summed with the value in the element above it and the value in the element to the right of it.
- the value in element 5,5 72
- the value in element 4,5 95
- step 716 the sum computed in step 712 is entered into the one-dimensional matrix at the element 642 of column number 622 corresponding to the column number 212 of the element 204 on the main diagonal of co-occurrence matrix 200.
- the value 228 is entered into column 5 as illustrated in Fig. 6.
- Steps 712 and 716 are repeated for each subsequent element along the main diagonal as illustrated by feedback line 762 in Fig. 7 and the L-shaped boxes 804B as illustrated in Fig. 8. Following the current example, these values are entered into the one-dimensional histogram 600 at columns 6 - 13.
- Steps 712 and 716 are repeated until the last non-zero element 204 along the main diagonal is reached as illustrated by decision block 720.
- the value of this element 204 is summed with the value of the elements 204 above and below it.
- this sum is entered into the corresponding element 642 in one-dimensional matrix 600.
- box 806 (Fig. 8) is drawn around the last non-zero element along the main diagonal and the elements with which it is summed. Twenty-nine, the value in this last element, is summed with nine and zero for a total of thirty-eight. This total is entered into one-dimensional histogram 600 at column 14.
- one-dimensional histogram 600 is completed by entering zeros (0s) into the remaining horizontal locations.
- the only location in which this occurs is that location corresponding to column 15.
- the foreground and background peaks are determined in a step 508.
- the peaks can be determined simply by examining one-dimensional histogram 600 to determine which locations contain the numbers having the greatest value. For the examples illustrated in Fig. 6, the peaks are at location 5 and location 13, as illustrated by circles 623 and 624, respectively. Thus for dark text on a light background, the foreground peak (for the text) is at graylevel 13 and the background is at graylevel 5.
- HistPeak[0] the peaks are called: HistPeak[0] to HistPeak[ M ]
- the value of HistPeak[ M ] is given by the graylevel of that peak of the histogram. For example, in one-dimensional histogram 600, the first peak, HistPeak[0] occurs at graylevel 5. The second peak HistPeak[1] , occurs at graylevel 13.
- step 116 features of the peaks are ascertained.
- the features are used to determine characteristics of the foreground and background of the page. For example, the features are used to determine whether the text (or line in a line drawing) is thin, normal, or thick, and whether the background is weak or strong.
- the features determined can include the extent of the peaks, the deviation of the foreground peak, and the delta between the peaks.
- Fig. 9 is an operational flow diagram illustrating the manner in which peak features are determined.
- a step 904 the extent of each of the peaks is determined.
- the extent indicates how sharp (or conversely how broad) the peaks are.
- the extent of the background peak is indicated as BkndExt .
- the extent of the foreground peak is indicated as FgndExt .
- One way to determine the peak extent is to examine one dimensional histogram 600 at the peak and to examine adjacent elements. The peak is compared with adjacent elements to determine if the peak is broad or sharp. If an adjacent element is greater than or equal to one-half the value of the peak element, it is included in the extent. If, on the other hand, it is less than one-half the value of the peak it is not included in the extent and the process stops. If an adjacent element is included in the extent, the element adjacent to that element is also examined. If that element is greater than or equal to one-half the value of the peak it is included in the extent. This process continues until no more elements are found that can be included in the extent.
- the value of the extent is deemed to be zero (0) if the peak spans only one element, and is incremented by one (1) for each additional element included in the extent. Thus, theoretically, the extent could range from zero (0) to fifteen (15) for the illustrated example.
- the one-dimensional histogram 600 provides an example of peak extent. In this example, there are no elements adjacent to either peak that are greater than or equal to one half the value of the peak. Therefore, both peaks have an extent of zero (0).
- a step 908 the deviation of the peaks is determined. In a preferred embodiment, only the deviation of the foreground peak is determined. The manner in which the deviation of the foreground peak is determined is illustrated in Fig. 10.
- the background peak is examined. If it is at a graylevel less than or equal to a specified value (3 in a preferred embodiment), the columns of the co-occurrence matrix are collapsed horizontally by three ahead and one behind the column of the foreground peak. This is illustrated in step 1012. If, on the other hand, the background peak is at a graylevel greater than the specified value (3 in a preferred embodiment), the co-occurrence matrix is collapsed horizontally by one column ahead and one column behind the column of the foreground peak.
- the collapsed matrix is used to create a second one-dimensional histogram.
- This second one-dimensional histogram is created by summing the values in elements of selected portions of the rows of co-occurrence matrix 200. Each sum is stored in a column of the second one-dimensional histogram that corresponds to the row summed.
- this second one-dimensional histogram is created by way of example.
- the collapse of the example co-occurrence matrix 400 is illustrated again in Fig. 11, and the resultant second one-dimensional histogram 1200 is illustrated in Fig. 12.
- Each row of co-occurrence matrix 400 is read.
- the elements 204 of each row that lie within the columns to be collapsed are summed for that row.
- the sum is stored in the appropriate element 642 of one-dimensional histogram 1200.
- the appropriate element 642 is the one corresponding to the column number 622 of histogram 1200 that is the same as row number 208 of co-occurrence matrix 200.
- a step 1020 the deviation of the foreground peak can be calculated using the following equation: where the summation is executed over the values of x equal to zero (0) to x equal to p .
- x is the column number 622 of the second one-dimensional histogram 1200
- p is the column number 622 of the foreground peak
- f(x) is the value in column x .
- a step 912 the peak graylevels and the extent are used to calculate the delta between the foreground peak and the background peak as follows: ⁇ - FgndPk - BkndPk + BkndExt - FgndExt Where FgndPk is the graylevel of the foreground peak, BkndPk is the graylevel of the background peak, BkndExt is the background peak extent, and FgndExt is the foreground peak extent.
- the delta is nine (9).
- a step 120 the center of mass of the peaks is determined.
- the manner in which the center of mass is determined is illustrated in the operational flow diagram of Fig. 13.
- a step 1304 the influence of the cell is determined.
- the influence is used to indicate how much data from the background of the image has an effect on the foreground data. Values for influence are assigned based on the delta. The manner in which influence values assigned for a preferred embodiment are illustrated in Fig. 14.
- a strong influence is given a value of ten, and normal and weak influence are given values of zero. If the delta is five strong influence and normal influence are assigned a value of five, and the weak influence is assigned a value of zero. For a delta of six, a normal influence is given a value of ten and the strong influence and weak influence are assigned a value of zero. For a delta of seven, the strong influence value is zero, and the normal influence and weak influence values are five. For a delta of eight or higher, the values for strong influence and normal influence are zero, and the value for weak influence is ten.
- a step 1308 the weight of the foreground is determined. This determination is made based on the deviation calculated in step 1020 above.
- the manner in which the foreground weight is determined for a preferred embodiment is illustrated in Fig. 15.
- a graphical representation of how these weights are assigned is illustrated in Fig. 16.
- a thick weight is assigned a value of ten, and normal thin, thin, and very thin weights are assigned a value of zero.
- the value of the thick weight is minus 2x + 22. If however this value is less than zero, or greater than 10, it is set to zero.
- the normal weight is equal to (5z -45)/4, where x is the deviation. Again, if this value is less than zero or greater than 10, it is set to zero.
- the values for thin and very thin are set to zero.
- values for thick and very thin are set to zero.
- the value for the normal weight is minus 2x + 44, where x is the deviation. If this value is less than zero or greater than ten, it is set to zero.
- the thin weight is minus x minus 15, where x is the deviation. For values less than zero and greater than 10, the thin weight is set to zero.
- the thick weight and normal weight are set to zero.
- the thin weight is set to (minus 10x + 310)/6, where x is the deviation. If this value is less than zero or greater than ten, it is set to zero.
- the very thin weight is set to (5x - 130)/4, where x is the deviation. If this weight is less than zero or greater than ten it is set to zero.
- values for the variables LargePos, Pos, Zero, Neg, and LargeNeg are assigned. In one embodiment, the assignment is made based on the following rules:
- the center of mass is determined.
- the center of mass O is defined by:
- the center of mass and the histogram peak values are used to determine the threshold.
- the threshold is determined differently for different center of mass values. The manner in which the threshold is determined for the different center of mass value ranges is now described.
- each cell is examined in conjunction with neighboring cells.
- each cell is examined along with the 24 cells immediately surrounding it (i.e., the subject cell is the center cell of a 5x5 matrix of cells).
- the features of the cells are examined as well as the threshold for each cell determined as described above. If the threshold of the subject cell appears to be quite different from that of the surrounding cells, it may be changed. For example, if the subject cell has a threshold of seven and the surrounding cells all have a threshold of two, the threshold determined for the subject cell is considered to be anomalous and changed to two. One possible cause for such an anomaly could be unwanted noise in the system. This process is similar to smoothing a line on a line graph by discarding anomalous data points.
- FIG. 17 A representative architecture for an automatic threshold determination system is illustrated in Fig. 17.
- an automatic threshold determination system 1700 includes a matrix generator 1708, a peak extractor 1712, and a threshold determination module 1716.
- Automatic threshold determination system 1700 accepts a digital image 1732.
- Digital image can, for example, be generated by a digitizer 1704 such as a digitizing scanner. In the case of a bed scanner, a page, or portion thereof, is scanned to create digital image 1732.
- Digital image 1732 uses a plurality of bits to represent a graylevel of each pixel of the image.
- Digital image 1732 is grouped into cells, where each cell is a subset of the entire image 1732.
- Matrix generator 1708 provides the capability to generate co-occurrence matrix 200 and the first one-dimensional histogram. Co-occurrence matrix 200 and the first one dimensional histogram are provided to peak extractor 1712 via path 1742. Information regarding the graylevel of the background peak is provided to matrix generator 1708 via path 1746. Matrix generator 1708 uses this information to create a second one dimensional histogram which is also provided to peak extractor 1712.
- Peak extractor 1712 determines the foreground and background peaks and also determines the peak features and the center of mass of each cell. The center of mass and peak features are provided to threshold module via path 1744. Threshold determination module 1716 uses this information to determine the optimum threshold level for each cell.
Landscapes
- Engineering & Computer Science (AREA)
- Multimedia (AREA)
- Computer Vision & Pattern Recognition (AREA)
- Physics & Mathematics (AREA)
- General Physics & Mathematics (AREA)
- Theoretical Computer Science (AREA)
- Signal Processing (AREA)
- Character Input (AREA)
- Image Analysis (AREA)
Applications Claiming Priority (2)
| Application Number | Priority Date | Filing Date | Title |
|---|---|---|---|
| US08/171,122 US5651077A (en) | 1993-12-21 | 1993-12-21 | Automatic threshold determination for a digital scanner |
| US171122 | 1993-12-21 |
Publications (3)
| Publication Number | Publication Date |
|---|---|
| EP0660257A2 true EP0660257A2 (fr) | 1995-06-28 |
| EP0660257A3 EP0660257A3 (fr) | 1996-06-05 |
| EP0660257B1 EP0660257B1 (fr) | 1999-10-27 |
Family
ID=22622622
Family Applications (1)
| Application Number | Title | Priority Date | Filing Date |
|---|---|---|---|
| EP94308738A Expired - Lifetime EP0660257B1 (fr) | 1993-12-21 | 1994-11-25 | Détermination de seuil automatique pour un scanner numérique |
Country Status (3)
| Country | Link |
|---|---|
| US (1) | US5651077A (fr) |
| EP (1) | EP0660257B1 (fr) |
| DE (1) | DE69421369T2 (fr) |
Families Citing this family (10)
| Publication number | Priority date | Publication date | Assignee | Title |
|---|---|---|---|---|
| US5883973A (en) * | 1996-02-20 | 1999-03-16 | Seiko Epson Corporation | Method and apparatus for processing a document by segmentation into text and image areas |
| JPH1013623A (ja) * | 1996-06-21 | 1998-01-16 | Nikon Corp | 画像入力方法 |
| EP1271403B1 (fr) * | 2001-06-26 | 2005-03-09 | Nokia Corporation | Procédé et appareil pour la localisation de caractères dans des images à partir d'une caméra digitale |
| US20040205454A1 (en) * | 2001-08-28 | 2004-10-14 | Simon Gansky | System, method and computer program product for creating a description for a document of a remote network data source for later identification of the document and identifying the document utilizing a description |
| US7088857B2 (en) * | 2002-01-31 | 2006-08-08 | Hewlett-Packard Development Company, L.P. | Dynamic bilevel thresholding of digital images |
| US20040024801A1 (en) * | 2002-07-31 | 2004-02-05 | Hamilton Robert A. | System and method for computing histograms with exponentially-spaced bins |
| US7496237B1 (en) | 2004-01-02 | 2009-02-24 | The United States Of America As Represented By The Administrator Of The National Aeronautics And Space Administration | Image processing for binarization enhancement via fuzzy reasoning |
| US7298897B1 (en) | 2004-02-11 | 2007-11-20 | United States Of America As Represented By The Administrator Of The National Aeronautics And Space Administration | Optimal binarization of gray-scaled digital images via fuzzy reasoning |
| US7400766B1 (en) | 2004-02-19 | 2008-07-15 | The United States Of America As Represented By The Administrator Of The National Aeronautics And Space Administration | Image edge extraction via fuzzy reasoning |
| JP4484643B2 (ja) * | 2004-09-10 | 2010-06-16 | 独立行政法人科学技術振興機構 | 時系列データ異常判定用プログラム及び時系列データ異常判別方法 |
Family Cites Families (21)
| Publication number | Priority date | Publication date | Assignee | Title |
|---|---|---|---|---|
| US3755780A (en) * | 1971-06-28 | 1973-08-28 | Pattern Analysis & Recognition | Method for recognizing characters |
| JPS59106079A (ja) * | 1982-12-10 | 1984-06-19 | Omron Tateisi Electronics Co | 図形照合装置の二値化装置 |
| US4577235A (en) * | 1984-08-20 | 1986-03-18 | The Mead Corporation | Text/continuous tone image decision processor |
| US4668995A (en) * | 1985-04-12 | 1987-05-26 | International Business Machines Corporation | System for reproducing mixed images |
| US4742557A (en) * | 1985-11-08 | 1988-05-03 | Ncr Corporation | Adaptive character extraction method and system |
| US4897880A (en) * | 1987-02-17 | 1990-01-30 | Soricon Corporation | Data acquisition control method and system for a hand held reader |
| US4975970A (en) * | 1987-03-18 | 1990-12-04 | General Electric Company | Image display having automatic image adjustment |
| US4817169A (en) * | 1987-04-14 | 1989-03-28 | Nippon Sheet Glass Co., Ltd. | Page segmentor |
| EP0358815B1 (fr) * | 1988-09-12 | 1993-05-26 | Océ-Nederland B.V. | Système et méthode pour segmentation automatique |
| JPH0789371B2 (ja) * | 1988-09-28 | 1995-09-27 | 富士写真フイルム株式会社 | 所望画像信号範囲決定方法 |
| US5097520A (en) * | 1989-01-20 | 1992-03-17 | Ricoh Company, Ltd. | Method of obtaining optimum threshold values |
| US5093871A (en) * | 1989-10-10 | 1992-03-03 | Unisys Corporation | Method and apparatus for effecting background suppression of image data |
| US5131049A (en) * | 1989-12-08 | 1992-07-14 | Xerox Corporation | Identification, characterization, and segmentation of halftone or stippled regions of binary images by growing a seed to a clipping mask |
| JPH0444165A (ja) * | 1990-06-12 | 1992-02-13 | Nec Corp | 対称連立一次方程式の求解方式 |
| US5086485A (en) * | 1990-10-19 | 1992-02-04 | Xerox Corporation | Method and apparatus for dynamically setting a background level |
| US5179599A (en) * | 1991-06-17 | 1993-01-12 | Hewlett-Packard Company | Dynamic thresholding system for documents using structural information of the documents |
| US5371810A (en) * | 1991-09-27 | 1994-12-06 | E. I. Du Pont De Nemours And Company | Method of determining the interior points of an object in a background |
| US5481620A (en) * | 1991-09-27 | 1996-01-02 | E. I. Du Pont De Nemours And Company | Adaptive vision system |
| US5337373A (en) * | 1991-10-24 | 1994-08-09 | International Business Machines Corporation | Automatic threshold generation technique |
| US5377020A (en) * | 1992-05-28 | 1994-12-27 | Contex A/S | Method and apparatus for scanning an original and updating threshold values for use in the processing of data |
| US5327262A (en) * | 1993-05-24 | 1994-07-05 | Xerox Corporation | Automatic image segmentation with smoothing |
-
1993
- 1993-12-21 US US08/171,122 patent/US5651077A/en not_active Expired - Lifetime
-
1994
- 1994-11-25 DE DE69421369T patent/DE69421369T2/de not_active Expired - Fee Related
- 1994-11-25 EP EP94308738A patent/EP0660257B1/fr not_active Expired - Lifetime
Non-Patent Citations (1)
| Title |
|---|
| IEEE TRANSACTIONS ON SYSTEMS, MAN AND CYBERNETICS, DEC. 1978, USA, vol. SMC-8, no. 12, ISSN 0018-9472, pages 895-898, AHUJA N ET AL 'A note on the use of second-order gray-level statistics for threshold selection' * |
Also Published As
| Publication number | Publication date |
|---|---|
| EP0660257A3 (fr) | 1996-06-05 |
| US5651077A (en) | 1997-07-22 |
| EP0660257B1 (fr) | 1999-10-27 |
| DE69421369T2 (de) | 2000-02-10 |
| DE69421369D1 (de) | 1999-12-02 |
Similar Documents
| Publication | Publication Date | Title |
|---|---|---|
| US5546474A (en) | Detection of photo regions in digital images | |
| EP0255949B1 (fr) | Procédé et appareil pour corriger la gradation d'une image représentée par des données d'image | |
| US5008950A (en) | Image processing method and apparatus for error-dispersion digitization without moire or spurious stripe formation | |
| EP0522702B1 (fr) | Extraction de la couleur de points images | |
| US6914628B1 (en) | Image processing apparatus and method, and medium containing image processing control program | |
| US5243444A (en) | Image processing system and method with improved reconstruction of continuous tone images from halftone images including those without a screen structure | |
| US6864994B1 (en) | High-speed, high-quality descreening system and method | |
| EP0239936B1 (fr) | Appareil de sélection à niveau d'algorithme | |
| EP0024902A2 (fr) | Appareil et méthode de conversion d'informations binaires d'image en informations d'échelle de gris | |
| EP0194689A2 (fr) | Méthode et appareil pour l'amélioration de l'image d'entrée par suppression des points et des trous | |
| US7064862B2 (en) | Printer and printing method for image-quality correction | |
| JPH0554756B2 (fr) | ||
| EP0660257B1 (fr) | Détermination de seuil automatique pour un scanner numérique | |
| EP0682320A2 (fr) | Filtres en pile pour un traitement d'image de 1-à-N-Bits dans des imprimantes électroniques | |
| US6381372B1 (en) | Systems and methods for designing image processing filters using templates | |
| US5398311A (en) | Character processing apparatus and method for processing character data as an array of coordinate points of contour lines | |
| JP3554033B2 (ja) | Ocr方法およびocrシステム | |
| US6025930A (en) | Multicell clustered mask with blue noise adjustments | |
| US5572600A (en) | Color image processing apparatus capable of suppressing moire | |
| US5083210A (en) | Elimination of contouring on displayed gray level images | |
| USH2003H1 (en) | Image enhancing brush using minimum curvature solution | |
| JPH11298716A (ja) | 画像処理装置 | |
| EP0600613A2 (fr) | Améliorations dans le traitement d'images | |
| US6741751B1 (en) | Logic based tagging for hyperacuity rendering of an input image with a 5×5 context | |
| US6567565B1 (en) | Antialiased image rendering algorithm |
Legal Events
| Date | Code | Title | Description |
|---|---|---|---|
| PUAI | Public reference made under article 153(3) epc to a published international application that has entered the european phase |
Free format text: ORIGINAL CODE: 0009012 |
|
| AK | Designated contracting states |
Kind code of ref document: A2 Designated state(s): DE FR GB |
|
| PUAL | Search report despatched |
Free format text: ORIGINAL CODE: 0009013 |
|
| AK | Designated contracting states |
Kind code of ref document: A3 Designated state(s): DE FR GB |
|
| 17P | Request for examination filed |
Effective date: 19960923 |
|
| GRAG | Despatch of communication of intention to grant |
Free format text: ORIGINAL CODE: EPIDOS AGRA |
|
| 17Q | First examination report despatched |
Effective date: 19990205 |
|
| GRAG | Despatch of communication of intention to grant |
Free format text: ORIGINAL CODE: EPIDOS AGRA |
|
| GRAH | Despatch of communication of intention to grant a patent |
Free format text: ORIGINAL CODE: EPIDOS IGRA |
|
| GRAH | Despatch of communication of intention to grant a patent |
Free format text: ORIGINAL CODE: EPIDOS IGRA |
|
| GRAA | (expected) grant |
Free format text: ORIGINAL CODE: 0009210 |
|
| AK | Designated contracting states |
Kind code of ref document: B1 Designated state(s): DE FR GB |
|
| REF | Corresponds to: |
Ref document number: 69421369 Country of ref document: DE Date of ref document: 19991202 |
|
| ET | Fr: translation filed | ||
| PLBE | No opposition filed within time limit |
Free format text: ORIGINAL CODE: 0009261 |
|
| STAA | Information on the status of an ep patent application or granted ep patent |
Free format text: STATUS: NO OPPOSITION FILED WITHIN TIME LIMIT |
|
| 26N | No opposition filed | ||
| REG | Reference to a national code |
Ref country code: GB Ref legal event code: 732E |
|
| REG | Reference to a national code |
Ref country code: GB Ref legal event code: IF02 |
|
| REG | Reference to a national code |
Ref country code: FR Ref legal event code: TP |
|
| PGFP | Annual fee paid to national office [announced via postgrant information from national office to epo] |
Ref country code: GB Payment date: 20071128 Year of fee payment: 14 Ref country code: FR Payment date: 20070207 Year of fee payment: 13 |
|
| PGFP | Annual fee paid to national office [announced via postgrant information from national office to epo] |
Ref country code: DE Payment date: 20071221 Year of fee payment: 14 |
|
| REG | Reference to a national code |
Ref country code: FR Ref legal event code: ST Effective date: 20080930 |
|
| PG25 | Lapsed in a contracting state [announced via postgrant information from national office to epo] |
Ref country code: FR Free format text: LAPSE BECAUSE OF NON-PAYMENT OF DUE FEES Effective date: 20071130 |
|
| GBPC | Gb: european patent ceased through non-payment of renewal fee |
Effective date: 20081125 |
|
| PG25 | Lapsed in a contracting state [announced via postgrant information from national office to epo] |
Ref country code: DE Free format text: LAPSE BECAUSE OF NON-PAYMENT OF DUE FEES Effective date: 20090603 |
|
| PG25 | Lapsed in a contracting state [announced via postgrant information from national office to epo] |
Ref country code: GB Free format text: LAPSE BECAUSE OF NON-PAYMENT OF DUE FEES Effective date: 20081125 |