EP0874983B1 - Procede et dispositif d'evaluation de la teneur de globules rouges individuels en hemoglobine - Google Patents
Procede et dispositif d'evaluation de la teneur de globules rouges individuels en hemoglobine Download PDFInfo
- Publication number
- EP0874983B1 EP0874983B1 EP97901337A EP97901337A EP0874983B1 EP 0874983 B1 EP0874983 B1 EP 0874983B1 EP 97901337 A EP97901337 A EP 97901337A EP 97901337 A EP97901337 A EP 97901337A EP 0874983 B1 EP0874983 B1 EP 0874983B1
- Authority
- EP
- European Patent Office
- Prior art keywords
- red blood
- blood cells
- aperture
- cell
- cells
- Prior art date
- Legal status (The legal status is an assumption and is not a legal conclusion. Google has not performed a legal analysis and makes no representation as to the accuracy of the status listed.)
- Expired - Lifetime
Links
- 210000003743 erythrocyte Anatomy 0.000 title claims description 122
- 108010054147 Hemoglobins Proteins 0.000 title claims description 107
- 102000001554 Hemoglobins Human genes 0.000 title claims description 107
- 238000000034 method Methods 0.000 title claims description 48
- 238000005259 measurement Methods 0.000 claims description 85
- 210000004369 blood Anatomy 0.000 claims description 30
- 239000008280 blood Substances 0.000 claims description 30
- 230000008859 change Effects 0.000 claims description 20
- 239000007788 liquid Substances 0.000 claims description 14
- 230000000215 hyperchromic effect Effects 0.000 claims description 10
- 239000003153 chemical reaction reagent Substances 0.000 claims description 5
- 238000003384 imaging method Methods 0.000 claims description 5
- 241000269627 Amphiuma means Species 0.000 claims 1
- 210000004027 cell Anatomy 0.000 description 173
- 239000000523 sample Substances 0.000 description 22
- 239000000243 solution Substances 0.000 description 20
- 239000012895 dilution Substances 0.000 description 15
- 238000010790 dilution Methods 0.000 description 15
- 210000000601 blood cell Anatomy 0.000 description 11
- 239000012266 salt solution Substances 0.000 description 9
- 239000012530 fluid Substances 0.000 description 8
- 239000002245 particle Substances 0.000 description 8
- 238000009652 hydrodynamic focusing Methods 0.000 description 7
- FAPWRFPIFSIZLT-UHFFFAOYSA-M Sodium chloride Chemical compound [Na+].[Cl-] FAPWRFPIFSIZLT-UHFFFAOYSA-M 0.000 description 6
- 238000004458 analytical method Methods 0.000 description 6
- 230000005684 electric field Effects 0.000 description 5
- 230000003287 optical effect Effects 0.000 description 5
- 210000000170 cell membrane Anatomy 0.000 description 4
- 210000000805 cytoplasm Anatomy 0.000 description 4
- 238000010586 diagram Methods 0.000 description 4
- 239000012470 diluted sample Substances 0.000 description 4
- 239000003792 electrolyte Substances 0.000 description 4
- 238000002474 experimental method Methods 0.000 description 4
- 239000000644 isotonic solution Substances 0.000 description 4
- IZWSFJTYBVKZNK-UHFFFAOYSA-N lauryl sulfobetaine Chemical compound CCCCCCCCCCCC[N+](C)(C)CCCS([O-])(=O)=O IZWSFJTYBVKZNK-UHFFFAOYSA-N 0.000 description 4
- 150000003839 salts Chemical class 0.000 description 4
- 238000004611 spectroscopical analysis Methods 0.000 description 4
- 206010022971 Iron Deficiencies Diseases 0.000 description 3
- 208000036696 Microcytic anaemia Diseases 0.000 description 3
- 208000002903 Thalassemia Diseases 0.000 description 3
- 230000001413 cellular effect Effects 0.000 description 3
- 239000003795 chemical substances by application Substances 0.000 description 3
- 238000004163 cytometry Methods 0.000 description 3
- 201000010099 disease Diseases 0.000 description 3
- 208000037265 diseases, disorders, signs and symptoms Diseases 0.000 description 3
- 239000012528 membrane Substances 0.000 description 3
- 230000004044 response Effects 0.000 description 3
- 239000011780 sodium chloride Substances 0.000 description 3
- XLYOFNOQVPJJNP-UHFFFAOYSA-N water Substances O XLYOFNOQVPJJNP-UHFFFAOYSA-N 0.000 description 3
- SXRSQZLOMIGNAQ-UHFFFAOYSA-N Glutaraldehyde Chemical compound O=CCCCC=O SXRSQZLOMIGNAQ-UHFFFAOYSA-N 0.000 description 2
- 208000007502 anemia Diseases 0.000 description 2
- 239000000872 buffer Substances 0.000 description 2
- 230000015556 catabolic process Effects 0.000 description 2
- 238000004737 colorimetric analysis Methods 0.000 description 2
- 230000003247 decreasing effect Effects 0.000 description 2
- 230000001419 dependent effect Effects 0.000 description 2
- 238000001514 detection method Methods 0.000 description 2
- 239000003599 detergent Substances 0.000 description 2
- 238000003745 diagnosis Methods 0.000 description 2
- 230000004069 differentiation Effects 0.000 description 2
- 230000000694 effects Effects 0.000 description 2
- 238000011156 evaluation Methods 0.000 description 2
- 150000002500 ions Chemical class 0.000 description 2
- 239000000203 mixture Substances 0.000 description 2
- 239000013610 patient sample Substances 0.000 description 2
- 238000011002 quantification Methods 0.000 description 2
- 238000007430 reference method Methods 0.000 description 2
- 239000001509 sodium citrate Substances 0.000 description 2
- NLJMYIDDQXHKNR-UHFFFAOYSA-K sodium citrate Chemical compound O.O.[Na+].[Na+].[Na+].[O-]C(=O)CC(O)(CC([O-])=O)C([O-])=O NLJMYIDDQXHKNR-UHFFFAOYSA-K 0.000 description 2
- 239000012064 sodium phosphate buffer Substances 0.000 description 2
- 238000011282 treatment Methods 0.000 description 2
- 108010044267 Abnormal Hemoglobins Proteins 0.000 description 1
- 206010002043 Anaemia folate deficiency Diseases 0.000 description 1
- 208000032467 Aplastic anaemia Diseases 0.000 description 1
- 241000483002 Euproctis similis Species 0.000 description 1
- 206010029783 Normochromic normocytic anaemia Diseases 0.000 description 1
- 230000002159 abnormal effect Effects 0.000 description 1
- 239000013060 biological fluid Substances 0.000 description 1
- 239000000470 constituent Substances 0.000 description 1
- 230000001086 cytosolic effect Effects 0.000 description 1
- 231100001020 decreased hemoglobin concentration Toxicity 0.000 description 1
- LOKCTEFSRHRXRJ-UHFFFAOYSA-I dipotassium trisodium dihydrogen phosphate hydrogen phosphate dichloride Chemical compound P(=O)(O)(O)[O-].[K+].P(=O)(O)([O-])[O-].[Na+].[Na+].[Cl-].[K+].[Cl-].[Na+] LOKCTEFSRHRXRJ-UHFFFAOYSA-I 0.000 description 1
- 238000013399 early diagnosis Methods 0.000 description 1
- 239000000834 fixative Substances 0.000 description 1
- 230000004907 flux Effects 0.000 description 1
- 201000008909 folic acid deficiency anemia Diseases 0.000 description 1
- 238000009472 formulation Methods 0.000 description 1
- 230000036541 health Effects 0.000 description 1
- 108010036302 hemoglobin AS Proteins 0.000 description 1
- 208000007475 hemolytic anemia Diseases 0.000 description 1
- 230000002949 hemolytic effect Effects 0.000 description 1
- 208000009601 hereditary spherocytosis Diseases 0.000 description 1
- 238000005286 illumination Methods 0.000 description 1
- 239000012212 insulator Substances 0.000 description 1
- 230000003834 intracellular effect Effects 0.000 description 1
- 230000037427 ion transport Effects 0.000 description 1
- 201000006437 macrocytic anemia Diseases 0.000 description 1
- 239000000463 material Substances 0.000 description 1
- 238000012544 monitoring process Methods 0.000 description 1
- 230000007935 neutral effect Effects 0.000 description 1
- 208000037233 normocytic anemia Diseases 0.000 description 1
- 229960000988 nystatin Drugs 0.000 description 1
- VQOXZBDYSJBXMA-NQTDYLQESA-N nystatin A1 Chemical compound O[C@H]1[C@@H](N)[C@H](O)[C@@H](C)O[C@H]1O[C@H]1/C=C/C=C/C=C/C=C/CC/C=C/C=C/[C@H](C)[C@@H](O)[C@@H](C)[C@H](C)OC(=O)C[C@H](O)C[C@H](O)C[C@H](O)CC[C@@H](O)[C@H](O)C[C@](O)(C[C@H](O)[C@H]2C(O)=O)O[C@H]2C1 VQOXZBDYSJBXMA-NQTDYLQESA-N 0.000 description 1
- 239000002953 phosphate buffered saline Substances 0.000 description 1
- 230000008569 process Effects 0.000 description 1
- 238000012552 review Methods 0.000 description 1
- 208000007056 sickle cell anemia Diseases 0.000 description 1
- 238000012795 verification Methods 0.000 description 1
Images




Classifications
-
- G—PHYSICS
- G01—MEASURING; TESTING
- G01N—INVESTIGATING OR ANALYSING MATERIALS BY DETERMINING THEIR CHEMICAL OR PHYSICAL PROPERTIES
- G01N15/00—Investigating characteristics of particles; Investigating permeability, pore-volume or surface-area of porous materials
- G01N15/10—Investigating individual particles
- G01N15/1031—Investigating individual particles by measuring electrical or magnetic effects
- G01N15/12—Investigating individual particles by measuring electrical or magnetic effects by observing changes in resistance or impedance across apertures when traversed by individual particles, e.g. by using the Coulter principle
-
- G—PHYSICS
- G01—MEASURING; TESTING
- G01N—INVESTIGATING OR ANALYSING MATERIALS BY DETERMINING THEIR CHEMICAL OR PHYSICAL PROPERTIES
- G01N15/00—Investigating characteristics of particles; Investigating permeability, pore-volume or surface-area of porous materials
- G01N15/10—Investigating individual particles
- G01N15/1031—Investigating individual particles by measuring electrical or magnetic effects
-
- G—PHYSICS
- G01—MEASURING; TESTING
- G01N—INVESTIGATING OR ANALYSING MATERIALS BY DETERMINING THEIR CHEMICAL OR PHYSICAL PROPERTIES
- G01N15/00—Investigating characteristics of particles; Investigating permeability, pore-volume or surface-area of porous materials
- G01N15/10—Investigating individual particles
- G01N2015/1022—Measurement of deformation of individual particles by non-optical means
-
- G—PHYSICS
- G01—MEASURING; TESTING
- G01N—INVESTIGATING OR ANALYSING MATERIALS BY DETERMINING THEIR CHEMICAL OR PHYSICAL PROPERTIES
- G01N15/00—Investigating characteristics of particles; Investigating permeability, pore-volume or surface-area of porous materials
- G01N15/10—Investigating individual particles
- G01N2015/103—Particle shape
-
- G—PHYSICS
- G01—MEASURING; TESTING
- G01N—INVESTIGATING OR ANALYSING MATERIALS BY DETERMINING THEIR CHEMICAL OR PHYSICAL PROPERTIES
- G01N15/00—Investigating characteristics of particles; Investigating permeability, pore-volume or surface-area of porous materials
- G01N15/10—Investigating individual particles
- G01N15/1031—Investigating individual particles by measuring electrical or magnetic effects
- G01N15/12—Investigating individual particles by measuring electrical or magnetic effects by observing changes in resistance or impedance across apertures when traversed by individual particles, e.g. by using the Coulter principle
- G01N2015/139—Measuring the ratio of AC/DC impedances
Definitions
- the present invention relates to the measurement of the hemoglobin concentration of individual red blood cells in a whole blood sample. More specifically, the present invention relates a method for making such measurement and for determining statistical characteristics and identifying subpopulations of the sample.
- red blood cell The evaluation of the properties of an individual's red blood cells is a standard part of the evaluation of the health of the individual and is used in the diagnosis of certain diseases and the monitoring of treatments.
- Properties of the red blood cell that are routinely reported include the number of red cells per unit volume of blood (called the "Red Cell Count” or “RBC”), the volume percentage of red cells in whole blood (Packed Cell Volume or PCV), the amount of hemoglobin per unit volume of whole blood (Hemoglobin Concentration or [Hgb]), the average size of the red cell (Mean Cell Volume or MCV) and the distribution of red cell sizes (Red Cell Distribution Width or RDW), the average amount of hemoglobin in each red blood cell (Mean Cell Hemoglobin or MCH) and the average concentration of hemoglobin within the red blood cell (Mean Cell Hemoglobin Concentration or MCHC).
- RBC Red Cell Count
- the reported red cell parameters are used to describe the status of a patient's blood sample and relate to the classification and diagnosis of anemia. For example, subclassification of anemias is possible using the MCV. Decreased MCV is seen in the microcytic anemias such as iron deficiency or thalassemia. Increased MCV occurs with the macrocytic anemias of B12/folate deficiency or aplastic anemia. Normocytic anemias (normal MCV) include immune hemolytic anemia or hereditary spherocytosis. Narrowing of the classification is possible with the addition of other parameters, such as MCHC or MCH.
- iron deficiency shows a decrease in both MCV and MCHC, whereas only MCV is decreased in thalassemia.
- the distribution of values within the red blood cell population adds increased information. For example, with microcytic anemias, the RDW is increased for iron deficiency but not for thalassemia.
- MCHC is determined by dividing the hemoglobin content by the packed cell volume.
- packed cell volume is not determined directly, but is determined as the cell count times the mean cell volume.
- this error in volume propagates into the measurement of mean cell hemoglobin concentration.
- a ratio referred to as the "opacity" of the cell By determining the ratio of the RF resistance to the DC resistance, a ratio referred to as the "opacity" of the cell, one can eliminate the influence of the size of the cell and create a measure that is only dependent on the internal conductivity of the cell and its shape.
- the opacity measurement has been used in several applications to differentiate subpopulations of blood cells within a larger population, such as for the identification of specific white cell types or for the differentiation of platelets from red cells. This differentiation is based on the relative measure of one population versus another and does not involve the quantification of the specific cellular properties responsible for the observed measurement.
- Groves et al., U.K. Patent Application GB 2,064,133 teach an apparatus and method for hydrodynamically focusing a stream of red blood calls to pass through an orifice wherein a low frequency electrical current passes through the orifice to produce an electrical first impedance signal measurement and obtaining the length measurement of each red blood cell while hydrodynamically focused by an optical signal generating means to obtain red blood cell shape information.
- an additional high frequency electrical current passes through the orifice to produce an electrical second impedance signal measurement to obtain red blood cell internal resistivity of each red blood cell.
- the reference does not teach or imply the determination of individual red blood cell hemoglobin concentration.
- Pilwat and Zimmermann "Determination of Intracellular Conductivity from Electrical Breakdown Measurements," Biochimica et Biophysica Acta, 820:305-314, 1985, described the determination of the average internal conductivity of cells within a flow cytometric aperture by the use of a high strength electrical field which causes breakdown of the cell membrane and thus allows current to pass through the cell. This technique then compares the electrical resistance for the disrupted cell population to measurements made at a lower field strength which does not disrupt the cells. With this technique, as with alternating current spectroscopy, an average measure for the internal conductivity of the cell population can be determined.
- the present invention is directed to a method to determine the hemoglobin concentration of individual red blood cells.
- the method comprises the steps of entraining red blood cells of a blood sample into a stream of spaced apart, individual red blood cells in an electrolyte liquid; measuring the low frequency electrical resistance of the electrolytic liquid within an aperture, including measuring a change in the electrical resistance caused by the passing of each of the red blood cells of the stream through the aperture, and deriving a corresponding first pulse signal having an amplitude representative of the change in the electrical resistance caused by the passing of the red blood cell throughout the aperture; measuring the radio frequency (RF) resistance of the electrolytic liquid within the aperture, including measuring a change in the radio frequency resistance caused by the passing of each of the red blood cells of the stream through the aperture, and deriving a corresponding second pulse signal having an amplitude representative of the change in the radio frequency resistance caused by the passing of the red blood cell throughout the aperture; determining a shape for each red blood cell; and calculating the hemoglobin concentration of each of the red blood cells of the stream from
- the determination of the red blood cell shape can be made by different methods which include sphering the blood cells, direct measurement of the blood cells and selecting a constant value for the red blood cells.
- the present inventions further relates to a method which further comprises determining the volume of the red blood cell using the measured change in the low frequency electrical resistance caused by the passing of each of the red blood cells of the stream through the aperture.
- the method of the present invention enables the identification of subpopulations of red blood cells based upon the determination of red cell hemoglobin concentration.
- the present invention relates to an apparatus for measuring the hemoglobin concentration of individual red blood cells.
- the apparatus contains a means for entraining red blood cells of a blood sample into a stream of spaced apart, individual red blood cells in an electrolyte liquid; a resistance measuring means for measuring the low frequency electrical resistance of the electrolytic liquid within an aperture, including measuring a change in the electrical resistance caused by the passing of each of the red blood cells of the stream through the aperture, and deriving a corresponding first pulse signal having an amplitude representative of the change in the electrical resistance caused by the passing of the red blood cell throughout the aperture; a radio frequency measuring means for measuring the radio frequency (RF) resistance of the electrolytic liquid within the aperture, including measuring a change in the radio frequency resistance caused by the passing of each of the red blood cells of the stream through the aperture, and deriving a corresponding second pulse signal having an amplitude representative of the change in the radio frequency resistance caused by the passing of the red blood cell throughout the aperture; a means for determining a shape for each red blood cell; and
- the apparatus is directed to an instrument which can include a non focus flow aperture.
- the apparatus can employ a focus flow aperture.
- the apparatus is directed to providing a determination of the shape of the red blood cells.
- the apparatus contains a vessel (not shown) which is used to mix the red blood cells with a sphering agent to sphere the blood cells.
- the apparatus contains a means for the direct measurement of the blood cells. This means includes an imaging system to obtain an image of the red blood cell (not shown).
- the present invention further relates to an apparatus which further comprises a means for determining the volume of the red blood cell using the measured change in the electrical resistance caused by the passing of each of the red blood cells of the stream through the aperture.
- the present apparatus enables the identification of subpopulations of red blood cells based upon the determination of red cell volume and hemoglobin concentration.
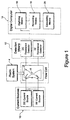
- Figure 1 is a schematic of an apparatus for use with the present invention.
- Figure 2 is a diagram of the relationship between the initial ionic content of a buffered salt solution, the solution's concentration of hemoglobin, and the electrical conductivity of the resulting mixture.
- Figure 3 is a diagram of the relationship between the concentration of hemoglobin in a buffered salt solution and the electrical conductivity of the solution relative to the buffered salt solution without hemoglobin present.
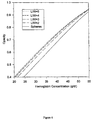
- Figure 4 is a diagram which depicts the dependency upon the shape of the cell of the relationship between the hemoglobin concentration of a red blood cell and the opacity measurement of the cell.
- Figure 5 is diagram which depicts opacities of sphered and deformable red cells as a function of hemoglobin concentrations. The curves represent the theoretical projections expected based upon the analysis developed in this application.
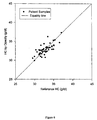
- Figure 6 is a comparison of hemoglobin concentration determined by the method of this invention versus a reference method for 54 patient samples.
- Figure 7 is a hemoglobin concentration histogram of blood samples determined by the present invention.
- Figure 7 (A) depicts a normal red cell population.
- Figure 7 (B) shows a significant increase in red cells that are hypochromic red blood cells.
- Figure 7 (C) shows a significant increase in red cells that are hyperchromic red blood cells.
- the apparatus of this invention consists of a flow cell 2 attached to a fluidic system 4 that presents a diluted red blood cell sample to the flow cell.
- the flow cell 2 contains a measuring aperture 6, through which red blood cells flow substantially one at a time.
- Electrodes 8 are located on each side of the aperture.
- the electrodes are connected to electrical circuitry 10, capable of establishing a direct current field and a radio frequency alternating current electrical field across the aperture.
- Electrical circuitry 12 is also attached to the electrodes and measures changes in the DC and RF voltages that occur as red blood cells travel through the aperture.
- the output of this circuitry is connected to a computer 14 by digitizing means 16.
- the computer contains recording means 18 which records the magnitude of the change in DC voltage and RF voltage caused by each red blood cell passing through the aperture.
- the computer then performs an analysis using calculating means 20 to determine the hemoglobin concentration of the individual red cell that passed the aperture in accordance with the present disclosure.
- the volume of each red blood cell is calculated.
- the digital computer compiles statistical measurements for the red cell population, including the mean, standard deviation and coefficient of variation of cellular hemoglobin concentration and volume.
- red blood cells To determine the hemoglobin concentration of individual red blood cells an aliquot of red blood cells is diluted with a isotonic solution of known conductivity. The dilution should be in a ratio to ensure that the cells can flow through the aperture substantially one at a time. Typical dilutions are known to those skilled in art for the intended purpose. Usually the dilutions are greater than 1 to 1. For instruments which use a focus flow aperture system, the dilution of the red blood cells to the electrolyte is approximately 1 to 2,500. For instruments which use a non focus flow aperture system, the dilution of the red blood cells to the electrolyte is approximately 1 to 5,000.
- the range of conductivity of the isotonic solution has not been shown to be significant. A broad range of conductivity has been shown to be useful in this invention.
- the isotonic solution is typically a buffered salt solution of sodium chloride having a neutral pH.
- An example of a suitable isotonic solution is an isotonic phosphate-buffered saline solution of pH 7.4 and osmolarity of approximately 290 mOsm.
- the hemoglobin concentration of the cell is obtained from analyzing the DC and RF resistance of the red blood cell measured as the cell flows through a measurement aperture.
- the electrical resistance caused by a particle or cell suspended within an electrically conductive fluid as it flows through a measurement aperture is determined by the volume of the particle or cell, its shape and orientation, and the electrical conductivity of that particle or cell relative to the suspending fluid for that particular frequency of electrical current.
- the sum effect of the shape, orientation and conductivity of the cell or particle is referred to as a "shape factor".
- the ratio of the conductivity of the cell to the conductivity of the external medium, ⁇ c / ⁇ e , as it appears in Equation 1, is referred to as the relative conductivity.
- the conductivity of the cell is determined by the conductivity of its interior.
- the interior normally contains only a solution of hemoglobin and does not contain a nucleus or other internal structures. Therefore, the conductivity of the hemoglobin solution that makes up the cell's cytoplasm is totally responsible for the determining the conductivity of the cell to RF currents.
- the electrical conductivity of the cytoplasm is of the same order of magnitude as the conductivity of external buffered salt solution in which the cells are suspended.
- Equation 3 f s, DC is described by Equation 3 and f s,RF is described by Equation 1. Therefore, the opacity of a cell is described as:
- the opacity of a cell is dependent only upon the shape of the cell, as described by the parameter "m", and upon the ratio of the conductivity of the interior of the cell to the conductivity of the external medium ( ⁇ c / ⁇ e ).
- the cells are diluted into a large volume of buffered salt solution.
- the membrane of the red cell allows both water flux and ion transport through it, the red cell will respond to dilution in an external solution of a specific ionic concentration by adjusting its internal solution to an ion concentration approximately equal to the external solution ion concentration.
- the relative conductivity as determined in the experiments described above and described in Equation 9, is equal to the relative conductivity as measured by opacity in the method described herein and described in Equation 7. Therefore, by combining Equations 7 and 9, the relationship between hemoglobin concentration and opacity is determined.
- Equation 10 This relationship between hemoglobin concentration and opacity is plotted in Figure 4 for a range of the cell shape parameter "m". As seen in this figure, there can be a substantial difference in the opacity measurement for a given hemoglobin concentration due to variations in the shape of the red cell.
- the sphered cells can be stabilized with known cell fixative reagent.
- the means to isovolumetrically sphere red cells are well known to those skilled in the art.
- a sphering reagent can be used to transform the red blood cells from their normal biconcave disk shape into spheres by reducing the surface area of the cell membrane to be as small as possible.
- the red cell volume should remain nearly constant and not change due to the use of the sphering agent.
- the shape parameter "m" would be equal to 1 for all cells, and the hemoglobin concentration can be determined by Equation 10 or Figure 4 accordingly.
- a second alternative means to account for the cell shape would be to measure the shape of each cell.
- Methods to do so are known to those skilled in the art of cytometry. Methods to directly measure the shape of each cell would include a direct imaging method or a slit scanning method which is taught by Groves et al.
- a third alternative means to account for the cell shape would be to assume a shape of the cell. This method is possible because a normal population of red cells has a consistent and known shape and deformability. While using this method would be the simplest to implement, it does have the potential for inaccuracy, particularly for samples of red cells that do not conform to the normal behavior.
- the model system utilizes the technique of Clark et al., "Study on the Dehydrating Effect of the Red Cell Na + /K + -Pump in Nystatin-treated Cells with Varying Na + and Water Contents," Biochimica et Biophysica Acta, 646:422-432, 1981, to produce populations of red cells with narrowly defined hemoglobin concentrations.
- Clark et al. "Study on the Dehydrating Effect of the Red Cell Na + /K + -Pump in Nystatin-treated Cells with Varying Na + and Water Contents”
- Figure 5 shows results with cells treated with this technique to create samples of cells with specific concentration of hemoglobin.
- Cells are measured both after sphering and in their normal state.
- the solid lines in this figure represent the predicted measurement of opacity for a given hemoglobin concentration, as described by this disclosure, both for cells fixed in the spherical shape and for cells retaining normal deformability. Close agreement is seen for both populations of cells. It should be noted that the normal deformability of a cell varies with hemoglobin concentration, among other factors, and that cells with high hemoglobin concentration behave in a manner similar to the sphered cells.
- the results of the hemoglobin concentration measurement by the opacity method described herein for a group of 54 patient samples measured after fixing the cells as spheres is seen in Figure 6.
- the hemoglobin measurement as determined by the opacity method is compared to hemoglobin as measured by the reference colorimetric method.
- the line of equivalence between these two measurements is also plotted.
- the standard deviation between the hemoglobin concentration as measured by the opacity technique described herein, and hemoglobin concentration as determined by the reference colorimetric method is 1.09 g/dl.
- Figure 7 (A) shows a normal red blood cell population having a majority of cells with a hemoglobin concentration between 29 g/dl and 41 g/dl. This red blood cell subpopulation is described as being normochromic.
- Figure 7 (B) is a hemoglobin distribution from a patient which exhibited a significant hypochromic subpopulation of red blood cells.
- Figure 7 (C) is a hemoglobin distribution from a different patient which exhibited a significant hyperchromic subpopulation of red blood cells. The method of Example 3 was employed to obtain these determinations.
- a sample of 2 ⁇ l of whole blood is diluted into 5 ml of 10 mM sodium phosphate buffer, pH of 7.4, containing 140 mM sodium chloride adjusted to 290 mOsm.
- the sample is aspirated into a hematology analyzer with a flow cell employing hydrodynamic focusing and containing a cylindrical measurement aperture of the dimensions of approximately 50 microns in diameter by 70 microns long.
- the flow cell contains two electrodes, one on each side of the aperture, which are connect to appropriate electronic circuitry to allow for the measurement of direct current (DC) resistance and radio frequency (RF) resistance at a frequency of 23 MHz across the aperture.
- DC direct current
- RF radio frequency
- the diluted sample of blood typically containing greater than 99% red cells is caused to flow through the measurement aperture essentially one cell at a time, as determined by the dilution ratio of the blood sample and the volume of the aperture.
- the hydrodynamic focusing of the fluid stream containing the sample of cells with a second fluid stream causes an additional dilution by a factor of approximately 4.
- the velocity of flow is set to be approximately 5 meters per second within the measurement aperture.
- the red cells deform in response to the fluidic forces exerted upon them during flow. Measurements of the DC and RF resistance are recorded for each of approximately 32,000 cells.
- the hemoglobin concentration of each cell is determined from the opacity measurement as described herein with the assumption that each cell assumes a shape with a length to width ratio of 4 to 1 during the measurement.
- the mean of the hemoglobin concentration is computed from the individual hemoglobin concentration determinations, as well as the statistical measures of the standard deviation and coefficient of variation of the population.
- a histogram of the hemoglobin concentration of the population is also produced, and hypochromic and hyperchromic populations are identified.
- a sample of 2 ⁇ l of whole blood is diluted into 5 ml of 10 mM sodium phosphate buffer, pH of 7.4, containing 140 mM sodium chloride adjusted to 290 mOsm.
- the sample is aspirated into a hematology analyzer with a flow cell employing hydrodynamic focusing and containing a rectangular measurement aperture of the dimensions of approximately 50 microns by 50 microns in cross section and 70 microns long.
- the flow cell contains two electrodes, one on each side of the aperture, which are connect to appropriate electronic circuitry to allow for the measurement of direct current (DC) resistance and radio frequency (RF) resistance at a frequency of 23 MHz across the aperture.
- An imaging system is also fitted to the aperture, to allow images of individual cells to be recorded as they flow through the aperture.
- the diluted sample of blood typically containing greater than 99% red cells is caused to flow through the measurement aperture essentially one cell at a time, as determined by the dilution ratio of the blood sample and the volume of the aperture.
- the hydrodynamic focusing of the fluid stream containing the sample of cells with a second fluid stream causes an additional dilution by a factor of approximately 4.
- the velocity of the flow is set to be approximately 5 meters per second within the measurement aperture.
- the red cells deform in response to the fluidic forces exerted upon them during flow. Measurements of the DC and RF resistance are recorded for each of approximately 32,000 cells. An image of the shape of each cell while in the measurement aperture is obtained along with the DC and RF measurements.
- the shape of each cell is obtained from the image.
- the hemoglobin concentration of each cell is determined from the opacity measurement and from the shape measurement by the analysis described herein.
- the mean of the hemoglobin concentration is computed from the individual hemoglobin concentration determinations, as well as the statistical measures of the standard deviation and coefficient of variation of the population.
- a histogram of the hemoglobin concentration of the population is also produced, and hypochromic and hyperchromic populations are identified.
- a sample of 2 ⁇ l of whole blood is diluted into 5 ml of 7.0 mM sodium citrate buffer, pH 7.4, containing 74 mM KCI, 71 mM NaCI, 100 ⁇ g/dl of the detergent n-dodecyl-n,n-dimethyl-3-ammonio-1-propane sulfonate (DDAPS) and .1% gluteraldehyde at 290 mOsm. Dilution of the red cells into the solution results in the iso-volumetric sphering of each cell and the fixation of the cell to prevent deformation during flow.
- DDAPS n-dodecyl-n,n-dimethyl-3-ammonio-1-propane sulfonate
- the sample is aspirated into a hematology analyzer with a flow cell employing hydrodynamic focusing and containing a cylindrical measurement aperture of the dimensions of approximately 50 microns in diameter by 70 microns long.
- the flow cell contains two electrodes, one on each side of the aperture, which are connect to appropriate electronic circuitry to allow for the measurement of direct current (DC) resistance and radio frequency (RF) resistance at a frequency of 23 MHz across the aperture.
- DC direct current
- RF radio frequency
- the hydrodynamic focusing of the fluid stream containing the sample of cells with a second fluid stream causes an additional dilution by a factor of approximately 4.
- Measurements of the DC and RF resistance are recorded for each of approximately 32,000 cells.
- the hemoglobin concentration of each cell is determined from the opacity measurement as described herein with the knowledge that each cell has a spherical shape during the measurement.
- the mean of the hemoglobin concentration is computed from the individual hemoglobin concentration determinations, as well as the statistical measures of the standard deviation and coefficient of variation of the population.
- a histogram of the hemoglobin concentration of the population is also produced, and hypochromic and hyperchromic populations are identified.
- a sample of 1 ⁇ l of whole blood is diluted into 10 ml of 7.0 mM sodium citrate buffer, pH 7.4, containing 74 mM KCI, 71 mM NaCI, 100 ⁇ g/dl of the detergent n-dodecyl-n,n-dimethyl-3-ammonio-1-propane sulfonate (DDAPS) and .1% gluteraldehyde at 290 mOsm..
- DDAPS n-dodecyl-n,n-dimethyl-3-ammonio-1-propane sulfonate
- gluteraldehyde gluteraldehyde
- the sample is aspirated into a hematology analyzer with a flow cell that does not employ hydrodynamic focusing and containing a cylindrical measurement aperture of the dimensions of approximately 50 microns in diameter by 70 microns long.
- the flow cell contains two electrodes, one on each side of the aperture, which are connect to appropriate electronic circuitry to allow for the measurement of direct current (DC) resistance and radio frequency (RF) resistance at a frequency of 23 MHz across the aperture.
- the diluted sample of blood typically containing greater than 99% red cells is caused to flow through the measurement aperture essentially one cell at a time, as determined by the dilution ratio of the blood sample and the volume of the aperture. Measurements of the DC and RF resistance are recorded for each of approximately 32,000 cells.
- the hemoglobin concentration of each cell is determined from the opacity measurement as described herein with the knowledge that each cell has a spherical shape during the measurement.
- the mean of the hemoglobin concentration is computed from the individual hemoglobin concentration determinations, as well as the statistical measures of the standard deviation and coefficient of variation of the population.
- a histogram of the hemoglobin concentration of the population is also produced, and hypochromic and hyperchromic populations are identified.
Landscapes
- Chemical & Material Sciences (AREA)
- Dispersion Chemistry (AREA)
- Physics & Mathematics (AREA)
- Health & Medical Sciences (AREA)
- Life Sciences & Earth Sciences (AREA)
- Analytical Chemistry (AREA)
- Biochemistry (AREA)
- General Health & Medical Sciences (AREA)
- General Physics & Mathematics (AREA)
- Immunology (AREA)
- Pathology (AREA)
- Investigating Or Analysing Biological Materials (AREA)
Claims (20)
- Méthode pour déterminer la concentration en hémoglobine des globules rouges d'individus, caractérisée par les étapes de:a. entraíner les globules rouges d'un échantillon de sang dans un courant de globules rouges individuels espacés dans un liquide électrolytique,b. mesurer la résistance électrique basse fréquence de liquide électrolytique dans une ouverture, comprenant la mesure d'un changement de la résistance électrique provoqué par le passage de chacun des globules rouges du courant à travers l'ouverture et dériver un premier signal impulsionnel correspondant pour chaque globule rouge, ayant une amplitude représentative du changement de la résistance électrique provoqué par le passage du globule rouge à travers l'ouverture,c. mesurer la résistance haute fréquence (RF) du liquide électrolytique dans l'ouverture, comprenant la mesure d'un changement de la résistance haute fréquence provoqué par le passage de chacun des globules rouges du courant à travers l'ouverture et dériver un second signal impulsionnel correspondant pour chaque globule rouge ayant une amplitude représentative du changement de la résistance haute fréquence provoqué par le passage de chaque globule rouge à travers l'ouverture,d. déterminer une forme pour chaque globule rouge, ete. calculer la concentration en hémoglobine de chacun des globules rouges du courant à partir d'un rapport du second signal impulsionnel correspondant au premier signal impulsionnel et de la forme des globules rouges.
- Méthode de la revendication 1, où la détermination de la forme est caractérisée en ce qu'on mélange les globules rouges avec un réactif chimique qui a pour résultat que les globules rouges sont mis sous forme sphérique.
- Méthode de la revendication 1, où la détermination de la forme est caractérisée par la mesure directe des globules rouges.
- Méthode de la revendication 3, où la mesure directe des globules rouges est caractérisée par l'imagerie optique des globules rouges.
- Méthode de la revendication 1, où la détermination de la forme est caractérisée en ce qu'on suppose une forme constante pour les globules rouges.
- Méthode de la revendication 1, où l'ouverture est caractérisée par une ouverture d'écoulement non-focus.
- Méthode de la revendication 1, où l'ouverture est caractérisée par une ouverture d'écoulement focus et où les globules rouges sont gainés par ledit liquide électrolytique.
- Méthode de la revendication 1 qui est de plus caractérisée en ce qu'on détermine le volume de chaque globule rouge.
- Méthode de la revendication 8, qui est de plus caractérisée par l'identification de sous-populations de globules rouges en se basant sur la détermination de chaque concentration en hémoglobine des globules rouges.
- Méthode de la revendication 9, où les sous-populations des globules rouges sont caractérisées par des globules rouges normochromiques, hyperchromiques et hypochromiques.
- Appareil pour mesurer la concentration en hémoglobine de globules rouges individuels, caractérisé par:a. un moyen pour entraíner les globules rouges d'un échantillon de sang dans un courant de globules rouges individuels espacés dans un liquide électrolytique.b. un moyen de mesure de résistance pour mesurer la résistance électrique basse fréquence du liquide électrolytique dans une ouverture, consistait à mesurer un changement de la résistance électrique provoqué par le passage de chacun des globules rouges du courant à travers l'ouverture et dériver un premier signal impulsionnel correspondant pour chaque globule rouge, ayant une amplitude représentative du changement de résistance électrique provoqué par le passage de chaque globule rouge à travers l'ouverture,c. un moyen de mesure haute fréquence pour mesurer la résistance haute fréquence (RF) du liquide électrolytique dans l'ouverture, consistant à mesurer un changement de la résistance haute fréquence provoqué par le passage de chacun des globules rouges du courant à travers l'ouverture et dériver un second signal impulsionnel correspondant pour chaque globule rouge, ayant une amplitude représentative du changement de la résistance haute fréquence provoqué par le passage de chaque globule rouge à travers l'ouverture, etd. un moyen pour déterminer une forme pour chaque globule rouge, ete. un moyen pour calculer la concentration en hémoglobine de chacun des globules rouges du courant à partir d'un rapport du second signal impulsionnel correspondant au premier signal impulsionnel et de la forme des globules rouges.
- Appareil de la revendication 11, où le moyen pour déterminer la forme est caractérisé par un moyen pour mélanger les globules rouges avec un réactif chimique qui a pour résultat que les globules rouges sont mis sous la forme de sphères.
- Appareil de la revendication 11, où le moyen pour déterminer la forme est caractérisé par un moyen pour effectuer une mesure directe des globules rouges.
- Appareil de la revendication 13 où la mesure directe des globules rouges est caractérisée par l'imagerie optique des globules rouges.
- Appareil de la revendication 11, où le moyen pour déterminer la forme est caractérisé par un moyen pour supposer une forme constante pour les globules rouges.
- Appareil de la revendication 11, où l'ouverture est caractérisée par une ouverture d'écoulement non focus.
- Appareil de la revendication 11, où l'ouverture est caractérisée par une ouverture d'écoulement focus et où les globules rouges sont gainés par ledit liquide électrolytique.
- Appareil de la revendication 11, qui est de plus caractérisé par un moyen pour déterminer le volume de chaque globule rouge.
- Appareil de la revendication 18, qui est de plus caractérisé par un moyen pour l'identification de sous-populations de globules rouges en se basant sur la détermination de la concentration en hémoglobine dans chaque globule rouge.
- Appareil de la revendication 19, où le moyen pour l'identification de sous-populations de globules rouges est caractérisé en ce que ledit moyen permet la détermination de globules rouges normaux chromiques, hyperchromiques et hypochromiques.
Applications Claiming Priority (3)
| Application Number | Priority Date | Filing Date | Title |
|---|---|---|---|
| US588793 | 1984-03-12 | ||
| US08/588,793 US5686309A (en) | 1996-01-19 | 1996-01-19 | Method and apparatus for determination of hemoglobin content of individual red blood cells |
| PCT/US1997/000099 WO1997026528A1 (fr) | 1996-01-19 | 1997-01-06 | Procede et dispositif d'evaluation de la teneur de globules rouges individuels en hemoglobine |
Publications (2)
| Publication Number | Publication Date |
|---|---|
| EP0874983A1 EP0874983A1 (fr) | 1998-11-04 |
| EP0874983B1 true EP0874983B1 (fr) | 2000-03-15 |
Family
ID=24355324
Family Applications (1)
| Application Number | Title | Priority Date | Filing Date |
|---|---|---|---|
| EP97901337A Expired - Lifetime EP0874983B1 (fr) | 1996-01-19 | 1997-01-06 | Procede et dispositif d'evaluation de la teneur de globules rouges individuels en hemoglobine |
Country Status (5)
| Country | Link |
|---|---|
| US (1) | US5686309A (fr) |
| EP (1) | EP0874983B1 (fr) |
| JP (1) | JP3828155B2 (fr) |
| DE (1) | DE69701446T2 (fr) |
| WO (1) | WO1997026528A1 (fr) |
Families Citing this family (19)
| Publication number | Priority date | Publication date | Assignee | Title |
|---|---|---|---|---|
| US6833369B2 (en) | 1997-06-24 | 2004-12-21 | Janssen Pharmaceutica, Nv | Angiogenesis inhibiting 5-substituted-1,2,4,-thiadiazolyl derivatives |
| US6060322A (en) * | 1998-10-20 | 2000-05-09 | Coulter International Corp. | Method for identification of reticulated cells |
| US6187592B1 (en) | 1998-12-23 | 2001-02-13 | Sandia Corporation | Method for determining properties of red blood cells |
| DE19946458C2 (de) * | 1999-09-28 | 2002-10-24 | Fraunhofer Ges Forschung | Vorrichtung und Verfahren zur Charakterisierung von Sphäroiden |
| IL132687A0 (en) * | 1999-11-01 | 2001-03-19 | Keren Mechkarim Ichilov Pnimit | System and method for evaluating body fluid samples |
| US20030027347A1 (en) * | 2001-05-25 | 2003-02-06 | Phyllis Shapiro | Automated method for correcting blood analysis parameter results affected by interference from exogenous blood substitutes in whole blood, plasma, and serum |
| USRE49221E1 (en) | 2002-06-14 | 2022-09-27 | Parker Intangibles, Llc | Single-use manifolds for automated, aseptic handling of solutions in bioprocessing applications |
| US20040214243A1 (en) * | 2003-04-25 | 2004-10-28 | Beckman Coulter, Inc. | Differential determination of hemoglobins |
| US7857506B2 (en) * | 2005-12-05 | 2010-12-28 | Sencal Llc | Disposable, pre-calibrated, pre-validated sensors for use in bio-processing applications |
| US7361512B2 (en) * | 2006-01-20 | 2008-04-22 | Beckman Coulter, Inc. | Low hemoglobin concentration cell percentage and method of use in detection of iron deficiency |
| CN102027368B (zh) * | 2008-03-21 | 2014-02-26 | 艾博特健康公司 | 利用红细胞内含有的血红蛋白的本征色素沉着来确定血样的红细胞指数的方法及设备 |
| JP5604862B2 (ja) * | 2009-01-09 | 2014-10-15 | ソニー株式会社 | 流路デバイス、複素誘電率測定装置及び誘電サイトメトリー装置 |
| FR2956207B1 (fr) | 2010-02-10 | 2012-05-04 | Horiba Abx Sas | Dispositif et procede de mesures multiparametriques de microparticules dans un fluide |
| CN105008907B (zh) * | 2013-03-15 | 2018-12-28 | 索尼公司 | 血液状态分析装置、血液状态分析系统、血液状态分析方法 |
| WO2015159583A1 (fr) * | 2014-04-17 | 2015-10-22 | ソニー株式会社 | Dispositif, système, procédé et programme d'analyse de l'état du sang permettant à un ordinateur de mettre en œuvre ledit procédé |
| JP6442858B2 (ja) | 2014-04-17 | 2018-12-26 | ソニー株式会社 | 血液状態解析装置、血液状態解析システム、血液状態解析方法、および該方法をコンピューターに実現させるための血液状態解析プログラム |
| CN105334191B (zh) * | 2014-07-25 | 2020-09-08 | 深圳迈瑞生物医疗电子股份有限公司 | 单个红细胞的血红蛋白浓度、体积修正方法及装置 |
| MX381655B (es) * | 2015-05-04 | 2025-03-13 | Versantis AG | Metodo para preparar vesiculas con gradiente de ph de transmembrana. |
| US11203017B2 (en) | 2016-07-26 | 2021-12-21 | Hewlett-Packard Development Company, L.P. | Microfluidic apparatuses |
Family Cites Families (13)
| Publication number | Priority date | Publication date | Assignee | Title |
|---|---|---|---|---|
| US2656508A (en) * | 1949-08-27 | 1953-10-20 | Wallace H Coulter | Means for counting particles suspended in a fluid |
| US3502974A (en) * | 1966-05-23 | 1970-03-24 | Coulter Electronics | Signal modulated apparatus for generating and detecting resistive and reactive changes in a modulated current path for particle classification and analysis |
| BE790042A (nl) * | 1971-10-14 | 1973-04-13 | Coulter Electronics | Werkwijze voor het classifiseren van deeltjes |
| US4052596A (en) * | 1974-12-23 | 1977-10-04 | Hycel, Inc. | Automatic hematology analyzer |
| US4298836A (en) * | 1979-11-23 | 1981-11-03 | Coulter Electronics, Inc. | Particle shape determination |
| US4735504A (en) * | 1983-10-31 | 1988-04-05 | Technicon Instruments Corporation | Method and apparatus for determining the volume & index of refraction of particles |
| GB8619627D0 (en) * | 1986-08-12 | 1986-09-24 | Genetics Int Inc | Electrochemical assay |
| KR970007077B1 (ko) * | 1987-03-13 | 1997-05-02 | 코울터 일렉트로닉스 인커퍼레이티드 | 광산란 기술을 이용한 다중-부분식별 분석 방법 |
| DE3889733T2 (de) * | 1987-07-24 | 1994-09-08 | Terumo Corp | Vorrichtung zur messung der konzentration und sauerstoffsättigung von hämoglobin. |
| JP2667867B2 (ja) * | 1988-03-30 | 1997-10-27 | 東亜医用電子株式会社 | 粒子解析装置 |
| US5194909A (en) * | 1990-12-04 | 1993-03-16 | Tycko Daniel H | Apparatus and method for measuring volume and hemoglobin concentration of red blood cells |
| DE69432410T2 (de) * | 1993-05-14 | 2004-03-04 | Coulter International Corp., Miami | Retikulozyt bestimmungsverfahren und geraet, das lichtstreuungstechniken verwendet |
| US5583432A (en) * | 1994-04-11 | 1996-12-10 | Sci-Nostics Limited | Electrical method and apparatus for non-contact determination of physical and/or chemical properties of a sample, particularly of blood |
-
1996
- 1996-01-19 US US08/588,793 patent/US5686309A/en not_active Expired - Lifetime
-
1997
- 1997-01-06 WO PCT/US1997/000099 patent/WO1997026528A1/fr not_active Ceased
- 1997-01-06 JP JP52603097A patent/JP3828155B2/ja not_active Expired - Fee Related
- 1997-01-06 EP EP97901337A patent/EP0874983B1/fr not_active Expired - Lifetime
- 1997-01-06 DE DE69701446T patent/DE69701446T2/de not_active Expired - Lifetime
Also Published As
| Publication number | Publication date |
|---|---|
| DE69701446D1 (de) | 2000-04-20 |
| JP2000503772A (ja) | 2000-03-28 |
| JP3828155B2 (ja) | 2006-10-04 |
| DE69701446T2 (de) | 2001-03-08 |
| US5686309A (en) | 1997-11-11 |
| WO1997026528A1 (fr) | 1997-07-24 |
| EP0874983A1 (fr) | 1998-11-04 |
Similar Documents
| Publication | Publication Date | Title |
|---|---|---|
| US5686309A (en) | Method and apparatus for determination of hemoglobin content of individual red blood cells | |
| US5194909A (en) | Apparatus and method for measuring volume and hemoglobin concentration of red blood cells | |
| CN111656161B (zh) | 样本分析仪异常的报警方法、系统及存储介质 | |
| JP4184258B2 (ja) | 光学式赤血球および白血球の弁別 | |
| EP0784201B1 (fr) | Procédé automatisé, précis et de haute sensibilité et dispositif pour l'identification et le dosage des plaquettes sanguines et pour déterminer l'état d'activation des plaquettes en utilisant des échantillons du sang complet | |
| EP0698211B1 (fr) | Procede et appareil d'analyse de reticulocytes utilisant des techniques de dispersion de la lumiere | |
| US11874212B2 (en) | Blood analysis method, blood analysis system and storage medium | |
| US5378633A (en) | Method for accurately enumerating and sensitively qualifying heterogenous cell populations in cytolytic processing conditions | |
| DE69806802T2 (de) | Verfahren zur unterscheidung von erythroblasten | |
| CN111801568B (zh) | 测定血小板浓度的方法及系统 | |
| JP2619900B2 (ja) | 血液中の白血球およびヘモグロビンの測定用試薬および方法 | |
| JP5230648B2 (ja) | 自動血液分析装置による全血試料中の有核赤血球及び白血球細胞の測定方法 | |
| Fujimoto | Principles of measurement in hematology analyzers manufactured by Sysmex Corporation | |
| NL8006326A (nl) | Inrichting en werkwijze voor impedantiemetingen aan afzonderlijke deeltjes, gesuspendeerd in een vloei- stofstroom. | |
| EP0941464A2 (fr) | Dispositif et procede pour determiner la forme de globules rouges individuels | |
| Lines | The electrical sensing zone method (the Coulter principle) | |
| US4535284A (en) | High and low frequency analysis of osmotic stress of cells | |
| Lombarts et al. | Basic principles and problems of haemocytometry | |
| US8512977B2 (en) | Analyzing reticulocytes | |
| US6662117B2 (en) | Particle analyzer and particle classifying method | |
| Groner et al. | Characterizing blood cells by biophysical measurements in flow | |
| Kim et al. | Automated red blood cell differential analysis on a multi‐angle light scatter/fluorescence hematology analyzer | |
| EP0870185B1 (fr) | Procede pour tester une suspension cellulaire | |
| Leif et al. | Two‐dimensional impedance studies of BSA buoyant density separated human erythrocytes | |
| Pilwat et al. | Comments on" Erythrocyte and ghost cytoplasmic resistivity and voltage-dependent apparent size" |
Legal Events
| Date | Code | Title | Description |
|---|---|---|---|
| PUAI | Public reference made under article 153(3) epc to a published international application that has entered the european phase |
Free format text: ORIGINAL CODE: 0009012 |
|
| 17P | Request for examination filed |
Effective date: 19980807 |
|
| AK | Designated contracting states |
Kind code of ref document: A1 Designated state(s): DE FR GB |
|
| RIN1 | Information on inventor provided before grant (corrected) |
Inventor name: WYATT, JAMES, LYNN Inventor name: FRANK, ROBERT, STEWART |
|
| GRAG | Despatch of communication of intention to grant |
Free format text: ORIGINAL CODE: EPIDOS AGRA |
|
| 17Q | First examination report despatched |
Effective date: 19990604 |
|
| GRAG | Despatch of communication of intention to grant |
Free format text: ORIGINAL CODE: EPIDOS AGRA |
|
| GRAH | Despatch of communication of intention to grant a patent |
Free format text: ORIGINAL CODE: EPIDOS IGRA |
|
| GRAH | Despatch of communication of intention to grant a patent |
Free format text: ORIGINAL CODE: EPIDOS IGRA |
|
| GRAA | (expected) grant |
Free format text: ORIGINAL CODE: 0009210 |
|
| AK | Designated contracting states |
Kind code of ref document: B1 Designated state(s): DE FR GB |
|
| REF | Corresponds to: |
Ref document number: 69701446 Country of ref document: DE Date of ref document: 20000420 |
|
| ET | Fr: translation filed | ||
| PLBE | No opposition filed within time limit |
Free format text: ORIGINAL CODE: 0009261 |
|
| STAA | Information on the status of an ep patent application or granted ep patent |
Free format text: STATUS: NO OPPOSITION FILED WITHIN TIME LIMIT |
|
| 26N | No opposition filed | ||
| REG | Reference to a national code |
Ref country code: GB Ref legal event code: IF02 |
|
| PGFP | Annual fee paid to national office [announced via postgrant information from national office to epo] |
Ref country code: GB Payment date: 20130125 Year of fee payment: 17 Ref country code: FR Payment date: 20130211 Year of fee payment: 17 Ref country code: DE Payment date: 20130129 Year of fee payment: 17 |
|
| REG | Reference to a national code |
Ref country code: DE Ref legal event code: R119 Ref document number: 69701446 Country of ref document: DE |
|
| GBPC | Gb: european patent ceased through non-payment of renewal fee |
Effective date: 20140106 |
|
| PG25 | Lapsed in a contracting state [announced via postgrant information from national office to epo] |
Ref country code: DE Free format text: LAPSE BECAUSE OF NON-PAYMENT OF DUE FEES Effective date: 20140801 |
|
| REG | Reference to a national code |
Ref country code: FR Ref legal event code: ST Effective date: 20140930 |
|
| REG | Reference to a national code |
Ref country code: DE Ref legal event code: R119 Ref document number: 69701446 Country of ref document: DE Effective date: 20140801 |
|
| PG25 | Lapsed in a contracting state [announced via postgrant information from national office to epo] |
Ref country code: FR Free format text: LAPSE BECAUSE OF NON-PAYMENT OF DUE FEES Effective date: 20140131 Ref country code: GB Free format text: LAPSE BECAUSE OF NON-PAYMENT OF DUE FEES Effective date: 20140106 |