EP0882952A2 - Mesure d'écoulement - Google Patents
Mesure d'écoulement Download PDFInfo
- Publication number
- EP0882952A2 EP0882952A2 EP98304403A EP98304403A EP0882952A2 EP 0882952 A2 EP0882952 A2 EP 0882952A2 EP 98304403 A EP98304403 A EP 98304403A EP 98304403 A EP98304403 A EP 98304403A EP 0882952 A2 EP0882952 A2 EP 0882952A2
- Authority
- EP
- European Patent Office
- Prior art keywords
- flow
- logger
- measurement
- values
- artefact
- Prior art date
- Legal status (The legal status is an assumption and is not a legal conclusion. Google has not performed a legal analysis and makes no representation as to the accuracy of the status listed.)
- Withdrawn
Links
- 238000005259 measurement Methods 0.000 title claims abstract description 56
- 238000000034 method Methods 0.000 claims abstract description 31
- 125000004122 cyclic group Chemical group 0.000 claims abstract description 16
- 230000001052 transient effect Effects 0.000 claims abstract description 15
- 230000004044 response Effects 0.000 claims abstract description 3
- 238000004458 analytical method Methods 0.000 claims description 7
- 238000000691 measurement method Methods 0.000 claims description 4
- 230000000630 rising effect Effects 0.000 claims 1
- 230000009471 action Effects 0.000 abstract description 2
- XLYOFNOQVPJJNP-UHFFFAOYSA-N water Substances O XLYOFNOQVPJJNP-UHFFFAOYSA-N 0.000 description 17
- 238000012935 Averaging Methods 0.000 description 12
- 230000010355 oscillation Effects 0.000 description 12
- 230000008859 change Effects 0.000 description 8
- 238000009826 distribution Methods 0.000 description 8
- 238000004364 calculation method Methods 0.000 description 6
- 230000000694 effects Effects 0.000 description 6
- 230000001105 regulatory effect Effects 0.000 description 6
- 238000012797 qualification Methods 0.000 description 4
- 238000013459 approach Methods 0.000 description 3
- 238000004422 calculation algorithm Methods 0.000 description 3
- 230000003534 oscillatory effect Effects 0.000 description 3
- 230000000737 periodic effect Effects 0.000 description 3
- 238000013179 statistical model Methods 0.000 description 3
- 230000001360 synchronised effect Effects 0.000 description 3
- 238000003491 array Methods 0.000 description 2
- 238000005311 autocorrelation function Methods 0.000 description 2
- 238000012544 monitoring process Methods 0.000 description 2
- RIGXBXPAOGDDIG-UHFFFAOYSA-N n-[(3-chloro-2-hydroxy-5-nitrophenyl)carbamothioyl]benzamide Chemical compound OC1=C(Cl)C=C([N+]([O-])=O)C=C1NC(=S)NC(=O)C1=CC=CC=C1 RIGXBXPAOGDDIG-UHFFFAOYSA-N 0.000 description 2
- 238000000926 separation method Methods 0.000 description 2
- 238000012360 testing method Methods 0.000 description 2
- 230000003044 adaptive effect Effects 0.000 description 1
- 238000007796 conventional method Methods 0.000 description 1
- 230000003111 delayed effect Effects 0.000 description 1
- 238000011161 development Methods 0.000 description 1
- 230000005611 electricity Effects 0.000 description 1
- 230000003993 interaction Effects 0.000 description 1
- 238000004519 manufacturing process Methods 0.000 description 1
- 230000003278 mimic effect Effects 0.000 description 1
- 230000008569 process Effects 0.000 description 1
- 238000012545 processing Methods 0.000 description 1
- 230000009467 reduction Effects 0.000 description 1
- 238000007619 statistical method Methods 0.000 description 1
Images







Classifications
-
- G—PHYSICS
- G01—MEASURING; TESTING
- G01F—MEASURING VOLUME, VOLUME FLOW, MASS FLOW OR LIQUID LEVEL; METERING BY VOLUME
- G01F15/00—Details of, or accessories for, apparatus of groups G01F1/00 - G01F13/00 insofar as such details or appliances are not adapted to particular types of such apparatus
- G01F15/06—Indicating or recording devices
-
- G—PHYSICS
- G01—MEASURING; TESTING
- G01F—MEASURING VOLUME, VOLUME FLOW, MASS FLOW OR LIQUID LEVEL; METERING BY VOLUME
- G01F15/00—Details of, or accessories for, apparatus of groups G01F1/00 - G01F13/00 insofar as such details or appliances are not adapted to particular types of such apparatus
- G01F15/07—Integration to give total flow, e.g. using mechanically-operated integrating mechanism
- G01F15/075—Integration to give total flow, e.g. using mechanically-operated integrating mechanism using electrically-operated integrating means
- G01F15/0755—Integration to give total flow, e.g. using mechanically-operated integrating mechanism using electrically-operated integrating means involving digital counting
Definitions
- This invention relates to flow measurement, and is particularly concerned with the measurement of flow for use in determination of leakage in water distribution systems.
- a conventional electric water meter generates an electrical pulse after a predetermined volume of water has passed through the meter.
- the meter usually controls the opening and closing of a switch to create a train of pulses from an external source of electricity, which may be the battery of a data logger.
- Pulses from a meter are counted over fixed intervals, typically 15 minutes, during the night. Since individual pulses are scaled to represent known volumes of water, the 15 minute pulse count will give a result corresponding to the average flow rate during the 15 minute interval. As will be seen from Figure 1, this measured average can be significantly greater than the actual minimum flow rate.
- Water flow is also measured using analogue meters which output voltage or current values related to the measured flow but these also measure an average value, typically over a 15 minute period.
- a method of measuring minimum flow which includes taking account of "measurement artefact” and/or “hydraulic transient artefact” and/or “hydraulic cyclic artefact”.
- measure artefact refers to factors arising as a result of inherent variations of meter output.
- hydroaulic transient artefact refers to variations arising as a result of surge-related oscillations
- hydroaulic cyclic artefact refers to factors arising as a result of cyclic variations
- the measurement method may be carried out using a flow meter which generates pulses in response to flow, the method comprising measuring the intervals between successive pulses and converting the time interval measurements to flow measurements.
- the time intervals may be measured between the leading edges of successive pulses or between the trailing edges of successive pulses, or some other combination.
- a method of measuring minimum flow using a flow meter comprises obtaining a number of measurements by the method defined above and ascertaining the optimum number of measurements over which to average to obtain an accurate flow measurement.
- the invention further provides a method of determining leakage which includes carrying out the method of measurement defined above.
- a measurement system comprising a data logger and analysis computer in combination, the logger and computer being adapted to perform the measurement method(s) of the first and/or second aspects as defined above.
- the data logger may be adapted merely to measure and memorise the individual time intervals or, if using an analogue meter, the output voltage or current values, with the other steps of the method being performed by the computer, under control of suitable software.
- the data logger may be adapted to perform all the steps. Again, other allocations of steps between the logger and the computer are possible.
- Hydraulic disturbances such as, for example, the starting of pumps, can generate major transients or surges in pipelines causing flows to oscillate about mean levels for a significant length of time. The oscillations are significant and can occur in all networks. Previous measurement systems have not been able to distinguish surge-decelerated flows from genuine dips caused by low demand.
- the statistical analysis of the measurements which are obtained is preferably such as to provide for separation of the user flow and leakage values.
- a further feature of the present invention is thus that it enables an estimate to be made of intermittent water consumption by industrial, trade or other exceptional users. Conventionally, this use has been difficult to quantify because it is variable, but inaccurate estimates lead to confusion as to the likely level of leakage in a network.
- the present invention enables the minimum flow to be determined more accurately than previously utilised methods. It may be adapted to record the pressure at the feed point of a network accurately synchronised with the minimum flow measurement. Then, for a large number of readings of minimum flows and associated pressures from the same site or group of sites, it is possible to determine an empirical relationship between leakage and pressure. This is important for the control and measurement of leakage.
- Figure 1 has been referred to above. It shows the generation of a series of pulses having clearly defined trailing and leading edges. It also shows that, during the time period in which the pulses are being generated, there are substantial differences between the time intervals between successive pulses.
- the Pulse Interval Timing Value (or PIT value) is the time between the leading edges (or the trailing edges) of adjacent pulses of a train of pulses generated by a pulse-type meter.
- the contours of the pulses are as shown in Figure 1.
- the pulse contours can be as shown in Figure 1a.
- the "jitter" or bounce effect shown in Figure 1a can apply to either the leading or the trailing edge of a pulse. If, therefore, the time intervals between successive leading edges are being measured, the system will be so programmed that, having detected a potential leading edge, that leading edge will be ignored if the next "falling" edge is less than, for example, 40 milliseconds away.
- This threshold time e.g. typically 40 milliseconds, is chosen so that genuine short period pulses associated with high flows are not incorrectly rejected.
- a similar arrangement would apply to the trailing edges if the time intervals being measured were those between the trailing edges of successive pulses.
- Measurement artefact This inherent variation, which is independent of flow, is referred to herein as “measurement artefact” and has to be accounted for when carrying out measurements at high resolution.
- PIT 1 be the first pulse interval time, which is generated by internal segment 1 of a pulse output device which generates 100 pulses for each complete revolution of the pulse head
- PIT 2 be the second pulse interval time, which is generated by internal segment 2, ...................
- PIT 1082 be the one thousand and eighty second pulse interval time, which is generated by segment 82 on the 11th cycle, .....etc.
- the logger reads in and stores all the PIT values from the pulse head in the sequence in which they were generated.
- a pulse head which generates one hundred pulses for each complete revolution of the pulse head and have collected 2000 PIT values, i.e. 20 revolutions worth of PIT values.
- a set of adjustment coefficients is calculated as follows:
- the resulting set of coefficients represents how much on average each segment is shorter or longer than the average of the whole group.
- a segment with a coefficient of 1.0 needs no adjustment. If, for example, segment 47 has a coefficient of 0.5, this means it consistently generates PIT values half the width of the average of the whole set. If, for example, segment 82's coefficient is 1.5, it consistently generates PIT values 50% longer than the average of the whole set.
- PIT 1147 be 2.486 seconds and PIT 1182 be 3.915 seconds.
- PIT values from segment 82 are taken as being the times taken for 10 X 1.5 Litres to pass through the meter.
- the logger should read into memory the complete nightline sequence of raw PIT values, i.e. values obtained from the pulse head without any adjustment or compensation. These would then be processed at the end of the nightline to provide compensation coefficients which are synchronised with the raw PIT sequence.
- Another possibility is for the logger to carry out the compensation calculations adaptively whilst in the course of conventional logging.
- the risk with this approach is loss of synchronisation if the pulse head was for any reason temporarily taken off the meter body. If the interruption of the pulse stream was detected by, for instance, measuring an abnormally high PIT value, the adaptive calculation would have to be restarted. If it was not detected, the coefficient estimates would be invalidated.
- pulse-type meters are those most commonly employed, analogue-type meters are also sometimes used and the invention is also applicable to measurements taken using analogue type meters.
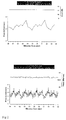
- Some pulse type meters show oscillatory variation in PIT values, as shown in Figure 2C.
- the oscillation is unstable and so cannot be compensated for by the method described above.
- the present invention enables these oscillations to be filtered out either by averaging PIT values or their equivalent flows over fixed or variable numbers of PIT values, (e.g. ten PIT values) or over fixed or variable time intervals (e.g. ten seconds).
- the averaging may be over non-overlapping sequential groups of values or over overlapping groups of values.
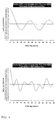
- Figure 3 shows two high-resolution views of nightlines taken from the same District Meter Area.
- a cycle repeating every 25 seconds can be observed while, in the lower graph, a 10 second cycle is evident.
- the average flow is about the same, i.e. 5 litres/sec, so the meter is rotating at the same speed. This rules out the possibility of the oscillation being due to residual measurement artefact which had not been cancelled. If this were the case, the cyclic behaviour would have the same frequency in both plots.
- This cyclic variation is referred to as "cyclic hydraulic artefact" and implementation of this aspect of the invention is as follows:
- the raw flow data sequence (of PIT values or other measurements) is transformed via, for example, linear interpolation to a regular sequence of values spaced at, for example, 1 second intervals.
- This sequence (the base sequence) might comprise 7200 values if the logger is analysing a 2 hour nightline. Other lengths of nightline may be analysed in like manner.
- the algorithm proceeds by dividing the base sequence into a series of 119 X 120 value overlapping data blocks.
- the first data block holds base values 1 to 120.
- the second data block holds base values 61 to 180........ the last holds base values 7081 to 7200 etc. (other data block lengths and overlaps could be used).
- For each 120 value data block proceed as follows:
- the 120 sample data block can be called "S2".
- the logger copies the first 60 samples of S2 into a new sequence called S1 and which has values s1 1, s1 2 , s1 3 ...s1 60 .
- the logger now mathematically compares S1 with successive sets of 60 consecutive samples drawn out of S2, each successive set of S2 being one second later than the previous set. So the logger starts by comparing S1 with the first 60 values in S2, i.e. values s2 1 , s2 2 , s2 3 ...s2 60 . Since the two sequences are of course the same, they match or correlate exactly.
- the logger compares S1 with the next set of S2 values delayed by 1 second, i.e.
- the logger records the degree of comparison and continues with the next set of S2 values, i.e. s2 3 , s2 4, s2 5 ...s2 62 etc.
- the logger stops when it has completed the final comparison of S1 with the last set of values in S2, i.e. s2 61 , s2 62 , s2 63 ...s2 120 .
- the mathematical comparison is the autocorrelation function: in which r 12 (j) is the autocorrelation coefficient corresponding to the correlation of sequences S1 of evenly spaced samples with sequence S2, in which sequence S2 is sequence S1 advanced by j samples.
- the resulting set of 60 correlation coefficients for the first 120 value data block is stored in the first column of an array which may be called R[119][60], i.e. in positions R[1][1] Vietnamese R[1][60].
- the resulting set of 60 correlation coefficients is stored in positions R[2][1] acrossR[2][60].
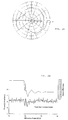
- Rseg[] is an average correlation array for the whole two hour nightline. Typical examples of such arrays are shown in Figures 4 and 5.
- the logger searches the array for the first qualifying minimum value such that the next occurring maximum value minus the qualifying minimum value is greater than some predetermined threshold limit. This eliminates early false minima.
- the logger locates the positions of all the following maxima and minima using the same separation threshold limit. The resulting number of half periods are then averaged and doubled to provide an estimate of the shortest repeat period.
- the logger determines an average correlation array from calculations on the whole two-hour night line. It would be possible to split the 2 hour nightline into smaller parts and to determine separate correlation arrays (and associated repeat periods) for each part. Other lengths of nightline can be treated in the same way.
- the logger determines the shortest repeat period. It would also be possible to extract the longest repeat period or intermediate repeat periods.
- the logger determines an optimum repeat period by autocorrelating the flow data.
- Other repeat periods could be determined by autocorrelating the pressure data or cross-correlating the flow data with the pressure data.
- the logger has used autocorrelation.
- frequency analysis techniques such as Fourier analysis (DFT or FFT) to find the shortest, longest or intermediate repeat periods
- Sudden hydraulic disturbances such as the starting of pumps, can generate major surges or transients in networks causing the measured flows to oscillate strongly about mean values. The troughs of these oscillations are difficult to distinguish from genuine short-term reductions in user demand.
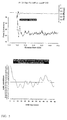
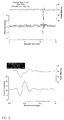
- Figure 6 shows an example in which the top graph clearly illustrates how the normal flow pattern is disturbed.
- the lower graph is a detailed view of the transient.
- the most reliable method of detecting flow surges is to check for accompanying transients in the pressure characteristic.
- a typical peak-to-peak transient pressure change is at least 2 metres, which is clearly different from normal pressure changes.
- the logger checks for pressure transients. It scans the nightline pressure record with a fixed length moving window (herein called the qualification time window). A pressure transient is detected if the difference between any two pressure samples within the qualification time window exceeds a predetermined threshold.
- P_LIMIT the change in head or pressure
- QT the fixed length qualification time window and is typically 15 seconds.
- QT is the same qualification time as used for the pressure change threshold.
- WAIT typically 2 minutes
- WAIT the skip time which is invoked if the pressure change threshold is crossed. It is the time allowed for the pressure oscillation to die away.
- the logger reads in a night line of flow and pressure data (typically two hour's worth).
- the logger compensates the flow data for measurement artefact. If the compensated data is unevenly spaced, it interpolates it to generate evenly spaced samples at, for example, 1 second intervals.
- the logger autocorrelates the flow data to determine the optimum averaging period to smooth out hydraulic oscillations. Let us call this period NSEQ seconds.
- the logger proceeds to scan the interpolated data to find the minimum night flow value as follows:
- the logger proceeds as follows:
- the logger proceeds as follows:
- Steps 1, 2 and 3, and 4, 5 and 6 above are not optimal in terms of avoiding duplicated scans. It is possible to speed up the algorithm by carrying out a check to see whether the average flow in the current NSEQ period is less than the current datum value. If it is not, then that particular time segment is ignored when looking for the minimum flow period.
- the logger applies all the measurement techniques so far described (except transients which are treated differently). Thus, given a nightline data record, it:
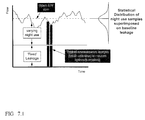
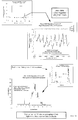
- micro value variation is therefore due to changing use during the nightline as shown in the drawings, particularly Figure 7.1.
- the crux of the problem is thus to determine an appropriate statistical model for the micro value variation and to infer from this model the lowest potential limit of user flow given the size and type of the network being monitored.
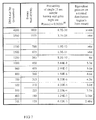
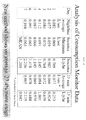
- the system models the micro value variation as a normal distribution. To this end the logger calculates the two hour mean of all the values and the standard deviation of the values about this mean. Either it or the host processing system then uses the example data in column 4 of Figure 7 to determine the lowest potential limit of user flow in terms of standard deviations from the mean for different sized networks.
- a feature of this system is that as the user flow on a site increases, so too will there be a tendency for the standard deviation of the flow micro values to rise. Because a fixed multiple of the standard deviation is subtracted from the nightline mean, more is subtracted from the mean to automatically compensate for the increased use. Increased leakage on the other hand does not affect the standard deviation but simply shifts the whole distribution towards higher flow values.
- a further feature is that the standard deviation value is sensitive to changes in the pattern of use. Uncharacteristically large standard deviations are noted when industrial use occurs (e.g. Figure 8). This provides a warning signal to ignore leakage estimates based on that night's data.
- a further feature of the invention is that it enables an estimate to be made of customer night use expressed in, for example, litres per property per hour (I/prop/hr).
- a global figure is assumed for this entity, typically 1.7 L/prop/hr.
- this conventional approach is very inaccurate as customer night use varies substantially from night to night.
- an average value of leakage can be calculated for a given sequence of nights, as shown in Figure 8A. This value can be subtracted from the average flow over the same sequence of nights.
- This result expressed in litres per hour and divided by the number of properties in the network being investigated yields a customer night use value which reflects the actual level of customer activity on the network - see Figure 8B.
- Figure 8C (i) shows an example of an approximately l5L/sec change in flow caused by a major trade user.
- Figure 8C (ii) shows a portion of the lower level flow which itself has an intermittent trade process use superimposed.
- the invention enables a measurement to be obtained of the minimum flow value between the periods of industrial use which is substantially different to that obtained using a conventional approach.
- Figure 8C (iii) shows how the system can be adapted to construct a histogram of micro values for a given period so that, where there are distinct levels of flow during the monitoring period, as in the example shown in Figure 8C (i), the histogram comprises distinct portions.
- the higher portions may be attributed to trade or other exceptional users and the lowest portion may be attributed to minor users (including domestic users).
- the system of separating user flow from leakage flow described above may now be applied to the lower portion, as shown in Figure 8C (iv).
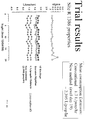
- the system determines a minimum flow measurement for each nightline. Over a series of nightlines, these minima will have a statistical distribution from which the lowest possible flow might be inferred given the size and type of the network being monitored.
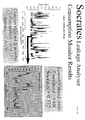
- the method of the present invention which more accurately determines the minimum flow in this application compared to conventional methods (see Figures 10 and 11), may be adapted to record the pressure at the feed point of a network accurately synchronised with the time of minimum flow measurement. Then, for a large number of readings of minimum flows and associated pressures from the same site or group of sites, it is possible to determine an empirical relationship between leakage and pressure. This is important for the control and measurement of leakage.
Landscapes
- Physics & Mathematics (AREA)
- Fluid Mechanics (AREA)
- General Physics & Mathematics (AREA)
- Measuring Volume Flow (AREA)
- Indicating Or Recording The Presence, Absence, Or Direction Of Movement (AREA)
Applications Claiming Priority (2)
| Application Number | Priority Date | Filing Date | Title |
|---|---|---|---|
| GBGB9711409.4A GB9711409D0 (en) | 1997-06-04 | 1997-06-04 | Flow measurement |
| GB9711409 | 1997-06-04 |
Publications (2)
| Publication Number | Publication Date |
|---|---|
| EP0882952A2 true EP0882952A2 (fr) | 1998-12-09 |
| EP0882952A3 EP0882952A3 (fr) | 2000-03-08 |
Family
ID=10813469
Family Applications (1)
| Application Number | Title | Priority Date | Filing Date |
|---|---|---|---|
| EP98304403A Withdrawn EP0882952A3 (fr) | 1997-06-04 | 1998-06-04 | Mesure d'écoulement |
Country Status (2)
| Country | Link |
|---|---|
| EP (1) | EP0882952A3 (fr) |
| GB (2) | GB9711409D0 (fr) |
Cited By (1)
| Publication number | Priority date | Publication date | Assignee | Title |
|---|---|---|---|---|
| CN111595420A (zh) * | 2012-05-11 | 2020-08-28 | 布里斯托尔D/B/A远程自动化解决方案公司 | 经流量计算机启动流量计内验证测试的系统及其方法 |
Families Citing this family (1)
| Publication number | Priority date | Publication date | Assignee | Title |
|---|---|---|---|---|
| FR2904688B1 (fr) * | 2006-08-04 | 2010-09-17 | Lyonnaise Eaux France | Dispositif de comptage de fluide avec detection de blocage. |
Family Cites Families (9)
| Publication number | Priority date | Publication date | Assignee | Title |
|---|---|---|---|---|
| US3862405A (en) * | 1973-04-05 | 1975-01-21 | Hb Ind Inc | Parameter compensating circuit for flow meter |
| SE377612B (fr) * | 1973-11-09 | 1975-07-14 | T L B Greverus | |
| JPS5567618A (en) * | 1978-11-17 | 1980-05-21 | Toukiyouto | Liquid meter of electronic integrating type |
| US4305281A (en) * | 1979-06-04 | 1981-12-15 | Rockwell International Corporation | Self-correcting self-checking turbine meter |
| US4885943A (en) * | 1988-05-11 | 1989-12-12 | Hydro-Craft, Inc. | Electronic flowmeter system and method |
| JPH0457528A (ja) * | 1990-06-27 | 1992-02-25 | Nec Corp | 同期多重端局装置 |
| EP0626566B1 (fr) * | 1993-05-25 | 2001-11-21 | Contadores De Agua De Zaragoza, S.A. | Circuit pour corriger le signal de sortie d'un débitmètre |
| US5544531A (en) * | 1995-01-09 | 1996-08-13 | Marsh-Mcbirney, Inc. | Flowmeter having active temperature compensation |
| JP3644750B2 (ja) * | 1996-03-27 | 2005-05-11 | 東洋計器株式会社 | 最小流量検出方法 |
-
1997
- 1997-06-04 GB GBGB9711409.4A patent/GB9711409D0/en active Pending
-
1998
- 1998-06-04 EP EP98304403A patent/EP0882952A3/fr not_active Withdrawn
- 1998-06-04 GB GB9812028A patent/GB2325985B/en not_active Expired - Fee Related
Cited By (1)
| Publication number | Priority date | Publication date | Assignee | Title |
|---|---|---|---|---|
| CN111595420A (zh) * | 2012-05-11 | 2020-08-28 | 布里斯托尔D/B/A远程自动化解决方案公司 | 经流量计算机启动流量计内验证测试的系统及其方法 |
Also Published As
| Publication number | Publication date |
|---|---|
| GB9711409D0 (en) | 1997-07-30 |
| GB2325985A (en) | 1998-12-09 |
| GB9812028D0 (en) | 1998-07-29 |
| EP0882952A3 (fr) | 2000-03-08 |
| GB2325985B (en) | 2002-02-20 |
Similar Documents
| Publication | Publication Date | Title |
|---|---|---|
| EP1877877B1 (fr) | Dispositif de diagnostic pour systeme de commande de processus | |
| US9341511B2 (en) | Timing analysis | |
| US5388445A (en) | Method for determining arrival and amplitude of a wave front and apparatus therefor | |
| US20190277722A1 (en) | Sensor recording analysis apparatus and method | |
| US9046000B2 (en) | Method for detecting foreign object damage in turbomachinery | |
| JP2018147390A (ja) | 異常波形検知システム、異常波形検知方法、及び波形分析装置 | |
| WO2003048714A1 (fr) | Systemes et procedes d'identification de la presence d'un defaut dans une machine a vibration | |
| US6448782B1 (en) | Arrangement and method for defining the location of source of partial discharges | |
| CN116952318B (zh) | 超声水表的流量计量方法 | |
| CN117972318B (zh) | 一种高速自发电剪切阀脉冲波形测试方法及系统 | |
| US7542860B2 (en) | Method and device for detecting the location of a pulse-type mechanical effect on a system part | |
| CN117957396A (zh) | 用于公共服务分配系统中的声学泄漏检测的系统和方法 | |
| CN120176789A (zh) | 用于电磁流量计的脉冲输出传感器控制系统 | |
| CN121278544B (zh) | 一种漏磁数据缺陷识别检测方法及系统 | |
| EP0882952A2 (fr) | Mesure d'écoulement | |
| CN113537156A (zh) | 一种基于区间标准差结合频谱分析的振动数据清洗方法 | |
| CN121026283B (zh) | 用于天然气井的流量计在线校准方法及系统 | |
| CN110133383A (zh) | 基于噪声关联的噪声敏感系数测量方法 | |
| CN121431797B (zh) | 一种基于物联网的城市供水系统水质智能监测方法 | |
| CN121500184B (zh) | 基于信号数据驱动的功率变换器系统级故障检测方法 | |
| JP3146062B2 (ja) | 診断装置 | |
| FI130776B1 (en) | METHOD AND APPARATUS FOR DEFECT DETECTION | |
| CN121841456A (zh) | 一种光缆故障预测方法、系统及介质 | |
| CN121409507A (zh) | 一种基于压力变送器在线检修方法及系统 | |
| KR20030054626A (ko) | 스키드 마크 자동추정을 통한 두께제어장치 |
Legal Events
| Date | Code | Title | Description |
|---|---|---|---|
| PUAI | Public reference made under article 153(3) epc to a published international application that has entered the european phase |
Free format text: ORIGINAL CODE: 0009012 |
|
| AK | Designated contracting states |
Kind code of ref document: A2 Designated state(s): AT BE CH CY DE DK ES FI FR GB GR IE IT LI LU MC NL PT SE |
|
| AX | Request for extension of the european patent |
Free format text: AL;LT;LV;MK;RO;SI |
|
| PUAL | Search report despatched |
Free format text: ORIGINAL CODE: 0009013 |
|
| AK | Designated contracting states |
Kind code of ref document: A3 Designated state(s): AT BE CH CY DE DK ES FI FR GB GR IE IT LI LU MC NL PT SE |
|
| AX | Request for extension of the european patent |
Free format text: AL;LT;LV;MK;RO;SI |
|
| RIC1 | Information provided on ipc code assigned before grant |
Free format text: 7G 01F 15/00 A, 7G 01F 15/02 B |
|
| AKX | Designation fees paid | ||
| STAA | Information on the status of an ep patent application or granted ep patent |
Free format text: STATUS: THE APPLICATION IS DEEMED TO BE WITHDRAWN |
|
| 18D | Application deemed to be withdrawn |
Effective date: 20000909 |
|
| REG | Reference to a national code |
Ref country code: DE Ref legal event code: 8566 |