EP1236984A2 - Dispositif et procédé de mesure de la distribution de la dispersion chromatique - Google Patents
Dispositif et procédé de mesure de la distribution de la dispersion chromatique Download PDFInfo
- Publication number
- EP1236984A2 EP1236984A2 EP02250758A EP02250758A EP1236984A2 EP 1236984 A2 EP1236984 A2 EP 1236984A2 EP 02250758 A EP02250758 A EP 02250758A EP 02250758 A EP02250758 A EP 02250758A EP 1236984 A2 EP1236984 A2 EP 1236984A2
- Authority
- EP
- European Patent Office
- Prior art keywords
- measured
- power
- optical device
- chromatic dispersion
- input light
- Prior art date
- Legal status (The legal status is an assumption and is not a legal conclusion. Google has not performed a legal analysis and makes no representation as to the accuracy of the status listed.)
- Withdrawn
Links
Images


Classifications
-
- G—PHYSICS
- G01—MEASURING; TESTING
- G01M—TESTING STATIC OR DYNAMIC BALANCE OF MACHINES OR STRUCTURES; TESTING OF STRUCTURES OR APPARATUS, NOT OTHERWISE PROVIDED FOR
- G01M11/00—Testing of optical apparatus; Testing structures by optical methods not otherwise provided for
- G01M11/30—Testing of optical devices, constituted by fibre optics or optical waveguides
- G01M11/31—Testing of optical devices, constituted by fibre optics or optical waveguides with a light emitter and a light receiver being disposed at the same side of a fibre or waveguide end-face, e.g. reflectometers
- G01M11/3109—Reflectometers detecting the back-scattered light in the time-domain, e.g. OTDR
Definitions
- the present invention relates to a chromatic dispersion distribution measurement apparatus for measuring a chromatic dispersion distribution in an optical device to be measured, such as an optical fiber, and a method for the same.
- optical communication systems using optical fibers have been constructed.
- the chromatic dispersion is a phenomenon caused by varying the speeds of lights transmitted in a medium, with the wavelength of the light. In the construction of the optical communication systems, it is necessary to grasp the chromatic dispersion characteristic in detail.
- a chromatic dispersion distribution measurement apparatus for measuring the chromatic dispersion is shown in, for example, Japanese Patent Application Publication No. Tokukai-Hei 10-83006 (corresponding to the United States Patent No. 5,956,131 and the European Patent Application No. 0819926A2).
- the chromatic dispersion distribution measurement apparatus measures the dispersion distribution in a longitudinal direction of a fiber to be measured, as follows. Two lights having different wavelengths from each other are inputted into the fiber to be measured. A specific wavelength component is extracted by an optical bandpass filter from a four-wave mixed light caused by the interaction between these two lights. A light having the extracted specific wavelength component is inputted into an Optical Time Domain Reflectometer (OTDR).
- OTDR Optical Time Domain Reflectometer
- FIG. 3 shows the relationship between the transmission distance along the fiber (abscissa axis) and the intensity of the back-scattered light generated at any portion of the fiber to be measured (ordinate axis) when the two lights having different wavelengths from each other are launched into the fiber to be measured.
- This intensity distribution (shown in solid line) is observed by the OTDR. As illustrated in this figure, the intensity changes periodically according to the transmission distance. Also, the intensity decreases as the transmission distance becomes longer.
- the intensity distribution shown in FIG. 3 is frequently called an OTDR waveform.
- the Hilbert transform is performed on the OTDR waveform data observed by the OTDR.
- the OTDR waveform intensity fluctuates sharply at a near-end of an optical fiber (around a zero distance)
- the following problem is caused.
- an object of the present invention is to provide a chromatic dispersion distribution measurement apparatus and a method for the same, for controlling a power of an input light to be input into the optical device to be measured, for example, so as to reduce the near-end dead zone, that is, the effect of the sharpness of the intensity around the zero distance in the light intensity distribution.
- a chromatic dispersion distribution measurement apparatus comprises:
- a chromatic dispersion distribution measurement method comprises:
- the input light power of the input light to the optical device to be measured in accordance with the previously measured power of an output light from the optical device to be measured as a function of a transmission distance along the optical device to be measured, it is possible to give a correct measurement of the chromatic dispersion distribution.
- the input light power calculation unit may vary the power value of the input light to the optical device to be measured, according to a level of the previously measured power of the output light from the optical device to be measured.
- the input light power calculating may be carried out by varying the power value of the input light to the optical device to be measured, according to a level of the previously measured power of the output light from the optical device to be measured.
- the chromatic dispersion distribution measurement apparatus may further comprise a calculated data combination unit for combining a first chromatic dispersion distribution datawhich is calculated by the chromatic dispersion distribution calculation unit when the input light power is small, with a second chromatic dispersion distribution data which is calculated by the chromatic dispersion distribution calculation unit when the input light power is large.
- the chromatic dispersion distribution measurement method may further comprise combining a first chromatic dispersion distribution data which is calculated when the input light power is small, with a second chromatic dispersion distribution data which is calculated when the input light power is large.
- a chromatic dispersion distribution measurement apparatus comprises:
- the power calculation unit may determine the power value of the input light to be approximately half of the output light power of the output light from a near-end portion of the optical device to be measured, when the output light power of the output light from the near-end portion of the optical device to be measured is too large to calculate the chromatic dispersion distribution.
- the power calculation unit may calculate each power value of the input light in accordance with each output light power of the output lights outputted from a plurality of points of the optical device to be measured; and the control unit may control each input light power of the input light in accordance with each power value of the input light, which is calculated by the power calculation unit.
- the chromatic dispersion distribution measurement apparatus may further comprise: a measuring unit for measuring each scattered light power of a light scattered from the optical device to be measured, on each input light power controlled by the control unit; a chromatic dispersion calculation unit for calculating each chromatic dispersion distribution in the optical device to be measured, on each scattered light power measured by the measuring unit; and a combination unit for combining a part of one chromatic dispersion distribution calculated on one input light power, with a part of another chromatic dispersion distribution calculated on another input light power.
- a chromatic dispersion distribution measurement method comprises:
- the calculating may be carried out by determining the power value of the input light to be approximately half of the output light power of the output light from a near-end portion of the optical device to be measured, when the output light power of the output light from the near-end portion of the optical device to be measured is too large to calculate the chromatic dispersion distribution.
- the calculating may be carried out by calculating each power value of the input light in accordance with each output light power of the output lights outputted from a plurality of points of the optical device to be measured; and the controlling may be carried out by controlling each input light power of the input light in accordance with each calculated power value of the input light.
- the chromatic dispersion distribution measurement method may further comprise: measuring each scattered light power of a light scattered from the optical device to be measured, on each controlled input light power; calculating each chromatic dispersion distribution in the optical device to be measured, on each of the measured scattered light power; and combining a part of one chromatic dispersion distribution calculated on one input light power, with a part of another chromatic dispersion distribution calculated on another input light power.
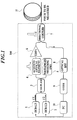
- FIG. 1 is a block diagram showing the structure of the optical fiber chromatic dispersion distribution measurement apparatus 100 to which the present invention is applied.
- the optical fiber chromatic dispersion distribution measurement apparatus 100 comprises two distributed feedback-laser diodes (DFB-LD) 1 and 2, a coupler 3, an acousto-optical element 4, a wavelength measuring unit 5, an erbium-doped fiber amplifier (EDFA) 6, a directional coupler 7, an optical bandpass filter (BPF) 8, an optical time domain reflectometer (OTDR) 9, a personal computer (PC) 10 and the like.
- a fiber 11 to be measured is connected with the optical fiber chromatic dispersion distribution measurement apparatus 100.
- the DFB-LDs 1 and 2 are light sources .
- the DFB-LD 1 outputs a light having a wavelength ⁇ 1.
- the DFB-LD 2 outputs a light having a wavelength ⁇ 2 (which is not equal to ⁇ 1).
- the power of these lights outputted from the DFB-LDs 1 and 2 is controlled (increased or decreased) in accordance with a control signal outputted from the PC 10 which will be explained below.
- the coupler (coupler unit) 3 couples two lights outputted from the DFB-LDs 1 and 2.
- the acousto-optical element 4 shapes a waveform of the coupled light outputted from the coupler 3, into a pulse form.
- the wavelength measuring unit 5 monitors the waveform of the coupled light outputted from the coupler 3.
- the EDFA 6 amplifies the pulse light outputted from the acousto-optical element 4.
- the directional coupler 7 is connected with the fiber 11 to be measured.
- the directional coupler 7 outputs the pulse light amplified by the EDFA 6, to the fiber 11 to be measured. Further, the directional coupler 7 outputs all of the reflected lights including the four-wave mixing (FWM) light, which are generated by the fiber 11 to be measured, to the optical BPF 8.
- FWM four-wave mixing
- the four-wave mixing is a phenomenon caused by the non-linearity of a plurality of lights having different wavelengths from each other in an optical fiber. For example, when two lights have wavelengths ⁇ 1 and ⁇ 2 respectively, a wavelength ⁇ 3 of the FWM light (Stokes light) caused by this phenomenon and a wavelength ⁇ 4 of the FWM light (anti-Stokes light) caused by the phenomenon satisfy the following equation (1).
- the optical BPF 8 passes only a light having a specific wavelength out of the FWM light outputted from the fiber 11 to be measured, and outputs the passed light to the OTDR 9.
- the optical BPF 8 passes one of the Stokes light and the anti-Stokes light.
- the OTDR 9 measures an intensity distribution of the FWM light generated in the fiber 11 to be measured, in accordance with the passed light (Stokes light or anti-Stokes light) from the optical BPF 8.
- the PC 10 calculates an optimum power of an input light to the fiber 11 to be measured, in order to calculate a chromatic dispersion distribution in the fiber 11 to be measured, based on the light intensity distribution shown in FIG. 3. Further, the PC 10 outputs power control signals to the EFB-LDs 1 and 2 in accordance with the calculated optimum power of the input light. Furthermore, the PC 10 performs a chromatic dispersion distribution calculating process (shown in FIG. 2) for the fiber 11 to be measured, on the OTDR waveform data obtained at each power of the input light. Also, the PC 10 combines each of the chromatic dispersion distributions calculated by the calculating process.
- the fiber 11 to be measured When two lights having different wavelengths from each other, which are outputted from the DFB-LDs 1 and 2, are supplied to the fiber 11 to be measured through the directional coupler 7, the fiber 11 to be measured generates an FWM light by the interaction between these two lights.
- the intensity distribution of the light received by the OTDR 9 can be adjusted by controlling each power of the input lights outputted from the DFB-LDs 1 and 2.
- the PC 10 calculates the optimum power of the input light to be supplied by the DFB-LDs 1 and 2, based on the intensity around the near-end portion of the fiber 11 to be measured, in the light intensity distribution shown in FIG. 3.
- the optimum power of the input light is calculated, for example, to be a power corresponding to half the intensity around the near-end portion.
- the PC 10 controls the power of the light outputted from the DFB-LDs 1 and 2 by outputting the control signals to the DFB-LDs 1 and 2 in accordance with the calculated optimum power of the input light.
- this optimum power is called a small power.
- the PC 10 stores the waveform data obtained from the OTDR 9 when this small power input is applied, in a storage area (not shown in the figure) such as a Random Access Memory (RAM).
- RAM Random Access Memory
- the PC 10 calculates the optimum power of the input light to be supplied by the DFB-LDs 1 and 2, based on the intensity at the far-end portion in the light intensity distribution shown in FIG. 3.
- the optimum power of the input light is calculated, for example, to be a power corresponding to one and a half times as large as the intensity at the far-end portion.
- the PC 10 controls the power of the light outputted from the DFB-LDs 1 and 2 by outputting the control signals to the DFB-LDs 1 and 2 in accordance with the calculated optimum power of the input light.
- this optimum power is called a large power.
- the PC 10 stores the waveform data obtained from the OTDR 9 when this large power input is applied, in the storage area.
- the waveform data obtained from the OTDR 9 is the intensity distribution data of the back-scattered light which is generated at any portions of the fiber 11 to be measured, as a function of the transmission distance as shown in FIG. 3.
- the intensity cyclically varies with the transmission distance, that is, the intensity oscillates. Therefore, the transmission distance corresponds to the phase ⁇ ( ⁇ ) in the cyclic variation (oscillation) of the intensity distribution.
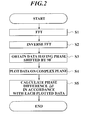
- the chromatic dispersion distribution calculating process for calculating a chromatic dispersion distribution in the fiber 11 to be measured, in accordance with the waveform data obtained from the OTDR 9, will be explained. This calculating process will be performed on each waveform data obtained in the small power input and the large power input.
- the PC 10 executes the fast Fourier transform (FFT) of the OTDR waveform data (the intensity distribution data) stored in the storage area, in order to calculate the waveform data expressed by a frequency spectrum (Step S1).
- the PC 10 executes the inverse Fourier transform (inverse FFT) of only the data at positive frequencies (Step S2).
- the PC 10 calculates the data having the phase shifted by 90° from the original OTDR waveform data (Step S3).
- the PC 10 plots the waveform data obtained in the Step S3 on a complex plane (Step S4). Then, each phase difference ⁇ ( ⁇ ) between two adjacent plotted data is calculated (Step S5). Each chromatic dispersion value is calculated in accordance with the calculated phase difference ⁇ ( ⁇ ). Then, the chromatic dispersion distribution calculating process is finished.
- the PC 10 combines the chromatic dispersion distribution around the near-end portion, which is obtained when the small power input is applied, and the chromatic dispersion distribution at the far-end portion, which is obtained when the large power input is applied.
- the combined chromatic dispersion distribution is regarded as the chromatic dispersion distribution in the fiber 11 to be measured.
- the PC 10 calculates the optimum power of the input light to the fiber 11 to be measured in order to calculate a chromatic dispersion distribution in the fiber 11 to be measured, based on the previously measured power of the output light from the fiber 11 to be measured, and controls the power of the light to be emitted from the DFB-LDs 1 and 2, the effect of the sharpness of the light intensity in the OTDR waveform around the near-end portion can be reduced. As a result, the near-end dead zone can be minimized. This makes it possible to give a correct measurement of the chromatic dispersion distribution and increase the reliability of the measurement.
- the EDFA 6 controls each power of the input lights so as to adjust the intensity around the near-end portion to not more than a half of the maximum value of the light receivable range as shown in FIG. 4A. After the intensity distribution is observed in the above condition, the EDFA 6 controls each power of the input light so as to adjust the intensity around the near-end portion to the vicinity of the maximum value of the light receivable range as shown in FIG. 4B. Then, the intensity distribution is observed in this condition.
- variable attenuator connected with the fiber 11 to be measured to control an attenuation of the input light.
Landscapes
- Physics & Mathematics (AREA)
- Optics & Photonics (AREA)
- Chemical & Material Sciences (AREA)
- Analytical Chemistry (AREA)
- General Physics & Mathematics (AREA)
- Optical Communication System (AREA)
- Testing Of Optical Devices Or Fibers (AREA)
Applications Claiming Priority (2)
| Application Number | Priority Date | Filing Date | Title |
|---|---|---|---|
| JP2001030008A JP2002236077A (ja) | 2001-02-06 | 2001-02-06 | 波長分散分布測定器、及びその測定方法 |
| JP2001030008 | 2001-02-06 |
Publications (2)
| Publication Number | Publication Date |
|---|---|
| EP1236984A2 true EP1236984A2 (fr) | 2002-09-04 |
| EP1236984A3 EP1236984A3 (fr) | 2004-01-21 |
Family
ID=18894282
Family Applications (1)
| Application Number | Title | Priority Date | Filing Date |
|---|---|---|---|
| EP02250758A Withdrawn EP1236984A3 (fr) | 2001-02-06 | 2002-02-05 | Dispositif et procédé de mesure de la distribution de la dispersion chromatique |
Country Status (3)
| Country | Link |
|---|---|
| US (1) | US6580499B2 (fr) |
| EP (1) | EP1236984A3 (fr) |
| JP (1) | JP2002236077A (fr) |
Families Citing this family (7)
| Publication number | Priority date | Publication date | Assignee | Title |
|---|---|---|---|---|
| JP2002168733A (ja) * | 2000-11-29 | 2002-06-14 | Ando Electric Co Ltd | 光ファイバ波長分散分布測定器及び測定方法 |
| WO2003042652A1 (fr) * | 2001-11-13 | 2003-05-22 | Advantest Corporation | Systeme de sondage de dispersion de longueur d'onde |
| US7919325B2 (en) | 2004-05-24 | 2011-04-05 | Authentix, Inc. | Method and apparatus for monitoring liquid for the presence of an additive |
| JP4690690B2 (ja) * | 2004-10-15 | 2011-06-01 | 古河電気工業株式会社 | 光ファイバの波長分散値及び非線形定数の測定方法、光ファイバの波長分散値及び非線形定数の測定装置、ファイバ製造方法、分散分布測定方法、測定誤差補償方法、測定条件特定方法 |
| CN101819086B (zh) * | 2010-05-19 | 2012-05-09 | 中国人民解放军国防科学技术大学 | 光纤色散测量系统及其使用方法 |
| CN108072504A (zh) * | 2016-11-15 | 2018-05-25 | 上海朗研光电科技有限公司 | 基于高速单光子探测器的光纤断点定位及长度测量方法 |
| CN110986814B (zh) * | 2019-12-11 | 2021-10-08 | 安捷光通科技成都有限公司 | 一种动态应变测量范围提升的相位敏感光时域反射系统 |
Family Cites Families (5)
| Publication number | Priority date | Publication date | Assignee | Title |
|---|---|---|---|---|
| US4958926A (en) * | 1988-10-31 | 1990-09-25 | Reliance Comm/Tec Corporation | Closed loop control system for laser |
| US5069544A (en) * | 1990-04-12 | 1991-12-03 | Minnesota Mining And Manufacturing Company | Adaptive pulse width optical fault finder |
| US5956131A (en) | 1996-07-17 | 1999-09-21 | Lucent Technologies Inc. | System and method for mapping chromatic dispersion in optical fibers |
| US6011615A (en) * | 1997-06-09 | 2000-01-04 | Lucent Technologies Inc. | Fiber optic cable having a specified path average dispersion |
| JP3989627B2 (ja) * | 1998-06-23 | 2007-10-10 | 富士通株式会社 | 光ゲート装置、該装置の製造方法及び該装置を備えたシステム |
-
2001
- 2001-02-06 JP JP2001030008A patent/JP2002236077A/ja active Pending
-
2002
- 2002-01-25 US US10/054,815 patent/US6580499B2/en not_active Expired - Fee Related
- 2002-02-05 EP EP02250758A patent/EP1236984A3/fr not_active Withdrawn
Also Published As
| Publication number | Publication date |
|---|---|
| EP1236984A3 (fr) | 2004-01-21 |
| JP2002236077A (ja) | 2002-08-23 |
| US6580499B2 (en) | 2003-06-17 |
| US20020131037A1 (en) | 2002-09-19 |
Similar Documents
| Publication | Publication Date | Title |
|---|---|---|
| US20020122171A1 (en) | Chromatic dispersion distribution measuring apparatus and measuring method thereof | |
| JP3587176B2 (ja) | ラマン増幅器及びラマン増幅方法 | |
| US5724126A (en) | Method for measuring distribution of zero dispersion wavelengths in an optical fiber and apparatus therefor | |
| US8068275B2 (en) | Method for measuring nonlinear optical properties | |
| US6154273A (en) | Wavelength dispersion measurement apparatus and a method thereof | |
| JP2003166904A (ja) | 光ファイバの波長分散値、非線形定数測定方法及び測定装置 | |
| US6856723B1 (en) | Group velocity dispersion measuring device and group velocity dispersion measuring method | |
| Lee et al. | Measurement of stimulated-Brillouin-scattering threshold for various types of fibers using Brillouin optical-time-domain reflectometer | |
| EP1236984A2 (fr) | Dispositif et procédé de mesure de la distribution de la dispersion chromatique | |
| US6819412B2 (en) | Measurement method for determining the nonlinearities in an optical fiber | |
| US5852700A (en) | Method and device for the generation of ultrashort optical pulses | |
| US6459479B1 (en) | Optical detection of a fiber span with high polarization-mode dispersion in a fiber system | |
| US6643603B2 (en) | Chromatic dispersion distribution measurement apparatus and method for the same | |
| US6594005B2 (en) | Chromatic dispersion distribution measurement apparatus, method and storage medium for the same | |
| JP2007173969A (ja) | 光パワー調整方法、光送信装置、及び光受信装置 | |
| JP3152314B2 (ja) | 後方散乱光の測定方法およびその装置 | |
| EP1227309A2 (fr) | Méthode et appareil pour mesurer la distribution de la dispersion chromatique | |
| US6580500B2 (en) | Chromatic dispersion distribution measurement apparatus and method for the same | |
| EP0998662B1 (fr) | Systeme de mesure de longueurs d'ondes | |
| US8102519B2 (en) | System and method for measuring dispersion | |
| KR100488195B1 (ko) | 광섬유 라만 증폭기 | |
| JPH0331736A (ja) | 光ファイバの曲率分布測定方法および装置 | |
| JP2002228549A (ja) | 波長分散分布測定器、及び測定方法 | |
| JP2004240461A (ja) | 測定装置、光伝送システム、及びラマン利得測定方法 | |
| JP2000221114A (ja) | 光ファイバの零分散波長の測定方法 |
Legal Events
| Date | Code | Title | Description |
|---|---|---|---|
| PUAI | Public reference made under article 153(3) epc to a published international application that has entered the european phase |
Free format text: ORIGINAL CODE: 0009012 |
|
| AK | Designated contracting states |
Kind code of ref document: A2 Designated state(s): AT BE CH CY DE DK ES FI FR GB GR IE IT LI LU MC NL PT SE TR |
|
| AX | Request for extension of the european patent |
Free format text: AL;LT;LV;MK;RO;SI |
|
| PUAL | Search report despatched |
Free format text: ORIGINAL CODE: 0009013 |
|
| AK | Designated contracting states |
Kind code of ref document: A3 Designated state(s): AT BE CH CY DE DK ES FI FR GB GR IE IT LI LU MC NL PT SE TR |
|
| AX | Request for extension of the european patent |
Extension state: AL LT LV MK RO SI |
|
| AKX | Designation fees paid |
Designated state(s): DE FR GB |
|
| STAA | Information on the status of an ep patent application or granted ep patent |
Free format text: STATUS: THE APPLICATION IS DEEMED TO BE WITHDRAWN |
|
| 18D | Application deemed to be withdrawn |
Effective date: 20040722 |