EP1376144A2 - Analysesystem für Testdaten - Google Patents
Analysesystem für Testdaten Download PDFInfo
- Publication number
- EP1376144A2 EP1376144A2 EP03254101A EP03254101A EP1376144A2 EP 1376144 A2 EP1376144 A2 EP 1376144A2 EP 03254101 A EP03254101 A EP 03254101A EP 03254101 A EP03254101 A EP 03254101A EP 1376144 A2 EP1376144 A2 EP 1376144A2
- Authority
- EP
- European Patent Office
- Prior art keywords
- analysis
- data
- information
- test data
- semiconductor test
- Prior art date
- Legal status (The legal status is an assumption and is not a legal conclusion. Google has not performed a legal analysis and makes no representation as to the accuracy of the status listed.)
- Withdrawn
Links
Images












Classifications
-
- G—PHYSICS
- G01—MEASURING; TESTING
- G01R—MEASURING ELECTRIC VARIABLES; MEASURING MAGNETIC VARIABLES
- G01R31/00—Arrangements for testing electric properties; Arrangements for locating electric faults; Arrangements for electrical testing characterised by what is being tested not provided for elsewhere
- G01R31/28—Testing of electronic circuits, e.g. by signal tracer
- G01R31/2832—Specific tests of electronic circuits not provided for elsewhere
- G01R31/2836—Fault-finding or characterising
- G01R31/2846—Fault-finding or characterising using hard- or software simulation or using knowledge-based systems, e.g. expert systems, artificial intelligence or interactive algorithms
-
- H—ELECTRICITY
- H10—SEMICONDUCTOR DEVICES; ELECTRIC SOLID-STATE DEVICES NOT OTHERWISE PROVIDED FOR
- H10P—GENERIC PROCESSES OR APPARATUS FOR THE MANUFACTURE OR TREATMENT OF DEVICES COVERED BY CLASS H10
- H10P74/00—Testing or measuring during manufacture or treatment of wafers, substrates or devices
- H10P74/23—Testing or measuring during manufacture or treatment of wafers, substrates or devices characterised by multiple measurements, corrections, marking or sorting processes
Definitions
- the present invention relates to analysis of semiconductor test data, and more particularly to a semiconductor test data analysis system, which, by visually rendering analysis operations such as analysis conditions and analysis procedures with respect to test data, facilitates the setting or changing of analysis operations by the user.
- analysis results are obtained by loading and analyzing test data, in accordance with commands in such a software.
- This type of analysis operation can be performed any number of times, with varied analysis conditions or procedures. Because the analysis conditions or procedures are usually stored in a file, it is possible for a user to perform batch processing by specifying a data file. By executing batch processing, it is not necessary for the user to repeatedly input the analysis conditions or procedure for each set of test data to be analyzed.
- the present invention provides semiconductor test data analysis system which, during an analysis operation, automatically records operation information of the analysis operation, including analysis conditions or an analysis procedure for input test data, or analysis information obtained by the analysis operation.
- one preferred aspect of the present invention is a semiconductor test data analysis system that automatically records operation information of the analysis operation, including analysis conditions or procedures for input test data, or analysis information obtained by the analysis operation
- the system includes: processing means; analysis target data storage means for storing the test data as analysis target data; a historical data storage means for storing as historical data at least one of operation information of the analysis operation or analysis information obtained by the analysis operation; and display data storage means for storing analysis information obtained by the analysis operation, which stores analysis display data generated by the processing means, wherein when a new analysis operation is specified, the processing means processes the input test data in accordance with the newly specified analysis operation, information of at least one of analysis target data, historical data, and display data being processed by the newly specified analysis operation.
- Another preferred aspect of the present invention is a semiconductor test data analysis system in which the processing means comprises reading test data from database or data file, and storing the test data as analysis target data in the analysis target data storage means by the newly specified analysis operation.
- Another preferred aspect of the present invention is the semiconductor test data analysis system in which the processing means comprises processing the analysis target data by the newly specified analysis operation.
- processing analysis target data further comprises filtering or sorting processing.
- Another preferred aspect of the present invention is the semiconductor test data analysis system in which operation information of the newly specified analysis operation or analysis target data related to the analysis information is further stored as new analysis target data in the analysis target data storage means.
- Yet another preferred aspect of the present invention is the semiconductor test data analysis system wherein the operation information of the newly specified analysis operation or historical data related to the analysis information is stored as new historical data in the historical data storage means.
- Still another preferred aspect of the present invention is the semiconductor test data analysis system wherein operation information of the newly specified analysis operation or display data related to the analysis information is stored as new display data in the display data storage means.
- Another preferred aspect of the present invention is the semiconductor test data analysis system which copies, synthesizes, or integrates operation information or analysis information concerning at least one of a database, a data file, the analysis target data, the historical data, and the display data, so as to generate new operation information or analysis information.
- Another preferred aspect of the present invention is the semiconductor test data analysis system further including a display apparatus.
- Yet another preferred aspect of the present invention further includes an input apparatus.
- the present invention also provides a semiconductor test data analysis system in which the display apparatus displays at least one of a data window related to analysis target data stored in the analysis target data storage means, a history window related to historical data stored in the historical data storage means, a display window related to display data stored in the display data storage means, and a plurality of icons, which display or specify either operation information of the analysis operation or analysis information.
- Another preferred aspect of the present invention is one in which the plurality of icons includes any one of:
- Another preferred aspect of the present invention is one wherein when specification is made of an icon among the plurality of icons, subsequent analysis target data in the analysis operation associated with that icon is further specified.
- Yet another preferred aspect of the present invention is one wherein when specification is made on an icon among the plurality of icons, the analysis operation associated with that icon is automatically re-executed.
- Another preferred aspect of the present invention is one wherein at least one icon among the plurality of icons starts batch processing associated with that icon.
- Another preferred aspect of the present invention is one further including means whereby, when a plurality of icons associated with the analysis operation are specified, the data specified by each of the respective icons is copied, synthesized, or integrated.
- Yet another preferred aspect of the present invention is one further having means whereby when the plurality of icons related to visual rendering of data are related to one another, analysis information obtained by an analysis operation specified by one icon and analysis information obtained by an analysis operation specified by another icon are visually rendered and displayed in one and the same window.
- the present invention also provides a method for analyzing semiconductor test data which automatically records, during an analysis operation, operation information of the analysis operation, including input test data analysis conditions or analysis procedures, or analysis information obtained by the analysis operation.
- the processing means processing the input test data in accordance with the analysis operation, and processing information of at least one of the analysis target data, the historical data, or the display data by the new analysis operation.
- processing the test data by the processing means further comprises reading test data from database or data file, and storing the test data as analysis target data in the analysis target data storage means in accordance with the newly specified analysis operation.
- processing using the processing means further comprises processing the analysis target data by a newly specified analysis operation.
- processing using the processing means further comprises filtering or sorting.
- operation information of the new analysis operation or analysis target data related to the analysis information is further stored as new analysis target data in the analysis target data storage means.
- Another preferred aspect is one wherein the operation information of the new analysis operation or historical data related to the analysis information is stored as new historical data in the historical data storage means.
- Yet another preferred aspect is one wherein operation information of the new analysis operation or display data related to the analysis information is stored as new display data in the display data storage means.
- Another preferred aspect is one which copies, synthesizes, or integrates operation information or analysis information concerning at least one of a database, a data file, the analysis target data, the historical data, and the display data, so as to generate new operation information or analysis information.
- Another preferred aspect is one which further includes a step of displaying on a display apparatus operation information or analysis information of the new analysis operation.
- Yet another preferred aspect is one which further includes a step of inputting operation information or analysis information of an analysis operation from an input apparatus.
- the present invention also provides a method for analyzing semiconductor test data which further includes a step of displaying on the display apparatus at least one of a data window related to analysis target data stored in the analysis target data storage means, a history window related to historical data stored in the historical data storage means, a display window related to display data stored in the display data storage means, and a plurality of icons, which display or specify either operation information of the analysis operation or analysis information.
- a step of generating the plurality of icons includes any one of: generating means for displaying or making a selection related to operation information of the analysis operation, generating means for displaying or making a selection related to analysis information of the analysis operation, generating means for generating an indicator representing a relationship between the means for displaying or making a selection related to operation information of the analysis operation and means for displaying or making a selection related to analysis information of the analysis operation, and generating means for displaying or making a selection for visually rendering analysis information of the analysis operation.
- Another preferred aspect further includes a step whereby when specification is made of an icon of the plurality of icons, subsequent analysis target data in the analysis operation associated with that icon is further specified.
- Another preferred aspect further has a step whereby when specification is made on an icon of the plurality of icons, the analysis operation associated with that icon is automatically re-executed.
- Another aspect has a further step whereby at least one of the plurality of icons starts batch processing associated with the analysis operation.
- Another aspect has a further step whereby when a plurality of icons associated with the analysis operation are specified, the data specified by each of the respective icons is copied, synthesized, or integrated.
- Another preferred aspect having a further step whereby when the plurality of icons related to visual rendering of data are related to one another, analysis information obtained by an analysis operation specified by one icon and analysis information obtained by an analysis operation specified by another icon are visually rendered and displayed in one and the same window.
- the present invention also provides a computer program for execution by a computer of any of the above-noted methods for analyzing semiconductor test data.
- analysis operation will be understood to include processing of test data based on operation information established by a user, and also encompass an operation of comparison with this operation information.
- analysis target data as used herein will be understood to include test data that is to be subjected to the execution of the above-noted analysis operation.
- operation information will be understood to include information related to analysis conditions or analysis procedures executed by the above-noted analysis operation.
- analysis information will be understood to include analysis results obtained by the above-noted analysis operation, analysis target data related to these analysis results, a link to these analysis results, or a link to analysis display data of these analysis results.
- indicator as used herein will be understood to include a line, a character, a graphic, color-coding, gradation, or a combination of these elements.
- phrase "means for generating an indicator” as used herein will be understood to include, for example, the displaying on the above-noted display apparatus of the above-noted indicator.
- icon as used herein will be understood to include a display means or input means for causing a computer to execute a command related to acquisition, processing, visual rendering, or display of analysis target data, operation information, or analysis information.
- An icon is normally composed of one or more characters, graphics, or symbols, or a combination thereof.
- the term icon used herein is not restricted to an icon as would be displayed on the display apparatus of a computer, but will be understood as further including a tool bar or button within a window on a display apparatus.
- the term "computer” used herein will be understood to include a data input means such as a keyboard, mouse, or touch-panel, a storage means, such as a semiconductor memory (hereinafter simply referred to as memory) or a hard disk drive or other types of drives for storing input data, a processing means for processing or analyzing input data or stored data, and a display means for displaying on a display apparatus input data or processed data.
- a data input means such as a keyboard, mouse, or touch-panel
- a storage means such as a semiconductor memory (hereinafter simply referred to as memory) or a hard disk drive or other types of drives for storing input data
- a processing means for processing or analyzing input data or stored data
- a display means for displaying on a display apparatus input data or processed data.
- commands relating to analysis target data, operation information, or analysis information need not be input at the computer, but can be communicated to the computer via a communication means such as a LAN or the Internet.
- the "computer" of the present invention includes, for example, a data acquisition means for storage, saving, reading, and writing of analysis target data, operation information, or analysis information data, a data processing means for performing data filtering, sorting, joining, or product or sum calculations, and a data visual rendering means for generating and displaying a graphic or table for extracting characteristics of analysis target data or analysis information.
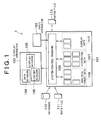
- This analysis system includes a computer 101, a display apparatus 102, and an input apparatus 103, such as a keyboard, a mouse, or a touch-panel.
- an input apparatus 103 such as a keyboard, a mouse, or a touch-panel.
- the computer 101, the display apparatus 102, and the input apparatus 103 are representing in the drawing as being separate, it will be understood that the computer 101, the display apparatus 102, and the input apparatus 103 can be integrated as one, such as is the case in a laptop computer or the like.
- the display apparatus 102 is described here with reference to Fig. 1.
- Analysis target data stored in an analysis target data storage means 109 are displayed in a data window 104 of the display apparatus 102.
- Display data obtained by processing analysis target data is displayed in a display window 105 of the display apparatus 102.
- commands stored in a historical data storage means 107 and executed in an analysis operation, and historical data indicating the sequence of the commands are displayed in a history window 108 of the display apparatus 102.
- Fig. 2 shows a history window for displaying an analysis operation history in a semiconductor test data analysis system according to the present invention.
- Icons 201 and 203 related to acquisition of analysis target data
- icons 202 and 206 related to processing such as filtering and sorting
- an icon 205 related to visual rendering of data
- indicators 204 and 207 which indicate analysis operation procedures, are displayed in the history window 108.
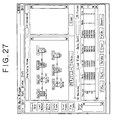
- Another example of a history window is shown in Fig. 28.
- the system control program 106 of the computer 101 acquires analysis target data by an analysis operation.
- the acquisition of this analysis target data is done from at least one of the database 110, the data file 111, and the analysis target data storage means 109.
- the acquired analysis target data is stored in the analysis target data storage means 109.
- the above-noted operation information of the analysis operation is stored as the historical data in the historical data storage means 107.
- an icon in relation to the analysis operation is displayed in the history window 108.
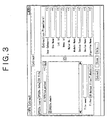
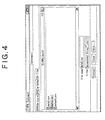
- Fig. 3 and Fig. 4 show, respectively, windows used when a user searches the database 110 and when a user specifies the data file 111.
- queries and filters may be used for Extraction Parameters, or the name of a prescribed file is input at the window shown in Fig. 3. If data is to be acquired from the data file, the name of a prescribed file is input at the window shown in Fig. 4. As a result, the analysis data is acquired from the database 110 or the data file 111 and the icon 201 is displayed in the history window 108.
- the processing of data in the analysis system of the present invention includes at least one of data filtering and data sorting.
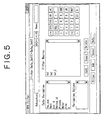
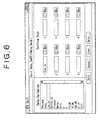
- the windows used by the user to specify data processing conditions for these analysis operations are shown in Fig. 5 and Fig. 6, respectively.
- the user selects one or more data variables, and inputs item names and ranges thereof to execute filtering of analysis target data.
- the user selects one or more data variables, and executes sorting of the prescribed analysis target data, in either ascending order or descending order.
- the operation information of the above-noted analysis operations can be stored in the historical data storage means 107 as historical data.
- the icon 202 associated with data processing is then added to the history window 108.
- the icon 202 is related to data processing that filters only data of the analysis target data specified by the icon 203 that satisfies prescribed conditions input from Fig. 5. For this reason, the icon 202 is displayed as an icon including characters indicating filtering. An indicator 204 is generated between the icon 202 and the icon 203, which is associated with analysis target data of the analysis operation. The indicator 204 is displayed as a straight line with an arrow related to the analysis operation procedure. By doing this, the user can tell at a glance what analysis operation was performed on which analysis target data.
- the analysis target data acquired by the processing of data is stored in the analysis target data storage means 109.
- the icon 206 similar to the icon 202, is associated with filtering of only data of the analysis target data specified by a given an icon that satisfies prescribed conditions input from Fig. 5.
- the computer 101 processes the analysis target data specified with the icon 206 by the system control program 106, generating display data for the visual rendering of data.
- the display data is then stored in the display data storage means 112, and the icon 205 is displayed in the display window 105.
- the computer 101 records the analysis information of the analysis operation at that time into the historical data storage means 107 as historical data, and the icon 205 associated with visual rendering of data is then displayed in the history window 108. Because the icon 205 is the analysis operation corresponding to the generation of a scatter plot as shown in Fig. 7, the icon is displayed so as to include a graphic indicating a scatter plot. An indicator 207 is generated between the icon 205 and the icon 206, which is associated with data processing to filter test data. The indicator 207 is displayed as a straight line with an arrow related to the analysis operation procedure. By doing this, the user can tell at a glance what analysis operation was performed on which analysis target data.
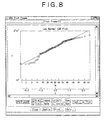
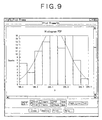
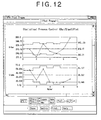
- the visual rendering of data in the analysis system according to the present invention is not restricted to the scatter plot shown in Fig. 7, but also includes, for example, the cumulative distribution plot shown in Fig. 8, the histogram shown in Fig. 9, the wafer map shown in Fig. 10, the box and whiskers plot shown in Fig. 11, and the SPC (Statistical Process Control) plot shown in Fig. 12 or a table.
- the analysis system of the present invention further includes windows for the purpose of specifying conditions for analysis operations for these types of visual renderings, details of which are shown in Fig. 13 through Fig. 18.
- Fig. 13 is a setting window for the scatter plot shown in Fig.
- Fig. 14 is a setting window for the cumulative distribution plot shown in Fig. 8.
- Fig. 15 is a setting window for the histogram shown in Fig. 9.
- Fig. 16 is a setting window for the wafer map shown in Fig. 10.
- Fig. 17 is a setting window for the box and whiskers plot shown in Fig. 11.
- Fig. 18 is a setting window for the SPC plot shown in Fig. 12.
- analysis target data, historical data, and display data obtained by data acquisition, data processing, and data visual rendering are stored, respectively, in the storage means 109, 107, and 112.
- the icons associated with data acquisition, data processing, and data visual rendering are each displayed in the history window 108.
- these icons correspond to display means or input means for specifying some analysis operation.
- the user can click or double click the left button of a mouse or the other selecting operations such like using a keyboard to select an icon from the history window 108, whereupon the computer 101, upon receiving the selection of that icon (for example, by a click or double click operation), by the system control program 106, displays the analysis target data associated with that icon in the data window 104 or the display data associated with that icon in the display window 105.
- the user can select an arbitrary icon in the history window 108, and re-execute with changed analysis conditions an analysis operation that had already been stored in the analysis system of the present invention. If the user selects an icon in the history window 108 with the right button of the mouse, it is possible to select setting windows (corresponding to the windows shown in Fig. 3, Fig. 4, Fig. 5, Fig. 6, Fig. 13, Fig. 14, Fig. 15, Fig. 16, Fig. 17, and Fig. 18) priorly associated with the icon. From any arbitrary use of these windows, if operation information or analysis information related to data acquisition, data processing, or visual rendering of data is changed, the computer 101, by the system control program 106, re-executes the analysis operation with the changed operation information or analysis information.
- setting windows corresponding to the windows shown in Fig. 3, Fig. 4, Fig. 5, Fig. 6, Fig. 13, Fig. 14, Fig. 15, Fig. 16, Fig. 17, and Fig. 18
- the analysis target data updated by the re-execution of this analysis operation is then stored into the analysis target data storage means 109, the historical data at that time is stored into the historical data storage means 107, and the display data at that time is stored into the display data storage means 112.
- the computer 101 In a case related to either of acquisition of data or data processing affected by a changed analysis operation, the computer 101, using the system control program 106, re-executes the analysis operation derived from the analysis target data related to the changed analysis operation with at least one of operation information or analysis information obtained from historical data.
- the analysis operation re-executed in this manner as long as there exists an analysis operation derived from the changed analysis operation in the historical data, can be re-executed by the system control program 106 of the computer.
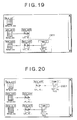
- the user can copy an icon derived from any arbitrary icon, and link to arbitrary analysis target data specified by this icon. By doing this, it is possible to apply an analysis operation already recorded in the analysis system of the present invention to an arbitrary analysis target data. For example, as shown in Fig. 19, at the history window 108 the user can hold down the left button of the mouse and drag the mouse so as to surround a plurality of icons (1901), which are specified as a set of icons. If the user requests copying, the system control program 106 of the computer 101 reads from the historical data storage means 107 the historical data related to each of the specified icons, and creates new historical data. At the history window 108 shown in Fig.
- an icon associated with the newly copied historical data and an indicator are displayed together as 2001.
- this display there is distinction made between an icon and indicator related to analysis target data that have not yet been executed and an icon and indicator that have already been executed.
- An icon and indicator that have not yet been executed in this case are displayed translucently, so that the user can know their status at a glance.
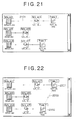
- the computer when an icon associated with analysis target data and an icon and indicator 2001 associated with a copied analysis operation are connected as shown by the indicator 2101, the computer, by the system control program 106, can apply the newly copied analysis operation to the analysis target data at the origin of the linked data. It is thus possible to integrate the analysis operations associated with a plurality of icons. This type of integration can be executed easily by the user by selecting an icon in the history window 108 on the display apparatus 102, and performing the same type of mouse operation as with a conventional computer. Additionally, the user can save the operation information of this selected analysis operation in the batch file 113 shown in Fig. 1. When this batch file 113 is selected, the computer 101, by the system control program 106, reads the selected batch file and generates historical data. When the historical data is generated in this manner, similar to the above-noted of copying, it is possible to apply the selected batch file to any arbitrary analysis target data.
- Fig. 22 shows two icons, 2201 and 2202 which exhibit compatibility in units between at least one of the corresponding axes (both being related to visual rendering of data, these being analysis operations that generate scatter plots).
- the user clicks and drags from the icon 2201 associated with analysis target data that is to be grouped up to the icon 2202 associated with another set to analysis target data it is possible to request synthesis (grouping) of these analysis operations.
- an indicator 2203 is generated from the icon 2201 to the icon 2202.
- the computer 101 by the system control program 106, then adds the analysis operation associated with the icon 2201 to the analysis operation associated with the icon 2202.
- historical data of the analysis operation associated with the icon 2202 and historical data of the analysis operation associated with the icon 2201 are stored in the historical data storage means 107 of the computer 101.
- the display data associated with the icon 2202 is then changed, this display data being displayed in the display window 105. This causes the synthesized display of each of the display data associated with the icons 2201 and 2202 in the display window 105, in accordance with the display format and display items of the icons 2201 and 2202. It is possible, for example as shown in Fig.
- the Extract Data button is selected to either search a database by means of the database search condition setting window shown in Fig. 3 or read a data file by means of the data file specification window shown in Fig. 4, thereby displaying an icon associated with the database or the data file, as shown by the reference numeral 201 in Fig. 2.
- any one of the icons associated with the analysis target data is selected.
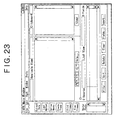
- the Filter button in the main window shown in Fig. 24 is selected, after which from the filter window of Fig. 5 the instruction for the analysis operation is given and the Filter button is selected, thereby displaying the original icon, an icon associated with filtering, and an indicator there between, as indicated by the reference numerals 202, 203, and 204 of Fig. 2.
- any one of the icons associated with the analysis target data is selected. Then, the Sort button shown in Fig. 24 is selected. From the sort window shown in Fig. 6, an instruction is given for sorting, and the Sort button is selected, thereby displaying an arrow and an icon as shown like 2404 in Fig. 24 and generating data.
- any one of the icons having the corresponding analysis data is selected.
- the Create Frame button shown in Fig. 24 is selected so as to generate a display window showing a graph of the selected icon.
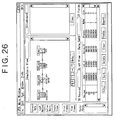
- Settings of the various tab pages of the window shown in Fig. 25 are made, and the Plot button is selected, thereby displaying the visual rendering of data, like showing in Fig. 7 through Fig. 12, an icon 2406 and an arrow.
- the contents of settings in tab pages hidden behind the Distribution tab page in Fig. 25 is similar to the various setting windows shown in Fig. 13, 15, 16, 17, and 18.
- the Load Method button shown in Fig. 24 is selected.
- the load method to be used is selected.
- the two icons 2001 and arrows shown in Fig. 20 are displayed.
- the Overplot button 2408 shown in Fig. 24 is selected and a mouse is dragged with holding the left mouse button from a source icon of join to a destination icon of join so as to establish a relationship between two operation information.
- display data of the source icon is overlapped and displayed jointly onto the graph associated with the icon at the front end of the arrow, i.e., the destination icon.
- the analysis system of the present invention automatically records previously executed analysis operations, a user can easily access these analysis operations for each analysis operation. For this reason, particularly in the case of the early stages of the semiconductor manufacturing development process, it is possible to perform quick trial-and-error analysis to determine the optimum analysis conditions and analysis operations. Even at a late stage in the semiconductor manufacturing process, when the user performs batch processing based on already optimized analysis operations, it is possible to perform the batch processing quickly and easily. Because analysis information is visually rendered, the user can easily understand operation information or analysis information, thereby preventing operational errors. Because a user can quickly analysis diverse analysis target data, it is possible more quickly identify failure locations. For this reason, the present invention can improve production efficiency and reduce cost.
Landscapes
- Engineering & Computer Science (AREA)
- Health & Medical Sciences (AREA)
- Artificial Intelligence (AREA)
- Evolutionary Computation (AREA)
- Medical Informatics (AREA)
- General Engineering & Computer Science (AREA)
- Physics & Mathematics (AREA)
- General Physics & Mathematics (AREA)
- Testing Or Measuring Of Semiconductors Or The Like (AREA)
- Tests Of Electronic Circuits (AREA)
Applications Claiming Priority (2)
| Application Number | Priority Date | Filing Date | Title |
|---|---|---|---|
| US10/186,171 US6898545B2 (en) | 2002-06-28 | 2002-06-28 | Semiconductor test data analysis system |
| US186171 | 2002-06-28 |
Publications (2)
| Publication Number | Publication Date |
|---|---|
| EP1376144A2 true EP1376144A2 (de) | 2004-01-02 |
| EP1376144A3 EP1376144A3 (de) | 2006-01-18 |
Family
ID=29718020
Family Applications (1)
| Application Number | Title | Priority Date | Filing Date |
|---|---|---|---|
| EP03254101A Withdrawn EP1376144A3 (de) | 2002-06-28 | 2003-06-27 | Analysesystem für Testdaten |
Country Status (4)
| Country | Link |
|---|---|
| US (2) | US6898545B2 (de) |
| EP (1) | EP1376144A3 (de) |
| JP (1) | JP2004072093A (de) |
| TW (1) | TWI292540B (de) |
Families Citing this family (16)
| Publication number | Priority date | Publication date | Assignee | Title |
|---|---|---|---|---|
| US7143370B1 (en) * | 2003-06-11 | 2006-11-28 | Advanced Micro Devices, Inc. | Parameter linking system for data visualization in integrated circuit technology development |
| CN100555567C (zh) * | 2004-11-30 | 2009-10-28 | 尼康股份有限公司 | 组件处理系统、信息显示方法及其应用装置 |
| JP4537277B2 (ja) * | 2005-07-08 | 2010-09-01 | 株式会社日立ハイテクノロジーズ | 半導体検査装置 |
| US7200523B1 (en) * | 2005-11-30 | 2007-04-03 | Taiwan Semiconductor Manufacturing Company, Ltd. | Method and system for filtering statistical process data to enhance process performance |
| US20100076724A1 (en) * | 2008-09-23 | 2010-03-25 | Harold Lee Brown | Method for capturing and analyzing test result data |
| US20140277467A1 (en) | 2013-03-14 | 2014-09-18 | Spinal Stabilization Technologies, Llc | Prosthetic Spinal Disk Nucleus |
| CN104077271B (zh) * | 2013-03-27 | 2018-06-05 | 珠海全志科技股份有限公司 | 晶圆图数据的处理方法及系统 |
| WO2015049734A1 (ja) * | 2013-10-02 | 2015-04-09 | 株式会社日立製作所 | 検索システム及び検索方法 |
| US10786360B2 (en) | 2014-11-04 | 2020-09-29 | Spinal Stabilization Technologies Llc | Percutaneous implantable nuclear prosthesis |
| AU2015343171B2 (en) | 2014-11-04 | 2020-08-06 | Spinal Stabilization Technologies Llc | Percutaneous implantable nuclear prosthesis |
| US10204188B2 (en) * | 2015-03-13 | 2019-02-12 | Samsung Electronics Co., Ltd. | Systems, methods and computer program products for analyzing performance of semiconductor devices |
| AU2016315964B2 (en) | 2015-09-01 | 2021-05-13 | Spinal Stabilization Technologies Llc | Implantable nuclear prosthesis |
| JP2020004070A (ja) * | 2018-06-28 | 2020-01-09 | ルネサスエレクトロニクス株式会社 | 半導体製品品質管理サーバ、半導体装置、および半導体製品品質管理システム |
| WO2020106350A2 (en) | 2018-09-04 | 2020-05-28 | Spinal Stabilization Technologies, Llc | Implantable nuclear prosthesis, kits, and related methods |
| US11475052B1 (en) * | 2019-11-08 | 2022-10-18 | Tableau Software, Inc. | Using visual cues to validate object models of database tables |
| CN114297052B (zh) * | 2021-12-13 | 2025-03-21 | 上海金仕达软件科技股份有限公司 | 测试数据生成方法及装置 |
Citations (2)
| Publication number | Priority date | Publication date | Assignee | Title |
|---|---|---|---|---|
| WO1999022310A1 (en) | 1997-10-27 | 1999-05-06 | Kla-Tencor Corporation | Software system and method for extending classifications and attributes in production analysis |
| US6097887A (en) | 1997-10-27 | 2000-08-01 | Kla-Tencor Corporation | Software system and method for graphically building customized recipe flowcharts |
Family Cites Families (25)
| Publication number | Priority date | Publication date | Assignee | Title |
|---|---|---|---|---|
| US5371851A (en) * | 1989-04-26 | 1994-12-06 | Credence Systems Corporation | Graphical data base editor |
| JP2941308B2 (ja) * | 1989-07-12 | 1999-08-25 | 株式会社日立製作所 | 検査システムおよび電子デバイスの製造方法 |
| DE69325770T2 (de) * | 1992-06-02 | 1999-11-18 | Hewlett-Packard Co., Palo Alto | Verfahren zum rechnergestützten entwurf für mehrschichtverbindungen-technologien |
| JP2616413B2 (ja) * | 1993-11-22 | 1997-06-04 | 日本電気株式会社 | リペアデータの編集装置およびリペアデータの編集方法 |
| JPH07234188A (ja) * | 1994-02-23 | 1995-09-05 | Hitachi Ltd | データ解析システム |
| US5761417A (en) * | 1994-09-08 | 1998-06-02 | International Business Machines Corporation | Video data streamer having scheduler for scheduling read request for individual data buffers associated with output ports of communication node to one storage node |
| JP3364390B2 (ja) * | 1995-12-30 | 2003-01-08 | 東京エレクトロン株式会社 | 検査装置 |
| US20020109734A1 (en) * | 1997-10-10 | 2002-08-15 | Satoshi Umezu | GUI processing system for performing an operation of an application which controls testing equipment |
| US6128759A (en) * | 1998-03-20 | 2000-10-03 | Teradyne, Inc. | Flexible test environment for automatic test equipment |
| US6476913B1 (en) * | 1998-11-30 | 2002-11-05 | Hitachi, Ltd. | Inspection method, apparatus and system for circuit pattern |
| US6292766B1 (en) * | 1998-12-18 | 2001-09-18 | Vlsi Technology, Inc. | Simulation tool input file generator for interface circuitry |
| JP2000269107A (ja) * | 1999-03-15 | 2000-09-29 | Toshiba Corp | 半導体製造工程のデータ解析システム |
| US6319737B1 (en) * | 1999-08-10 | 2001-11-20 | Advanced Micro Devices, Inc. | Method and apparatus for characterizing a semiconductor device |
| US6681351B1 (en) * | 1999-10-12 | 2004-01-20 | Teradyne, Inc. | Easy to program automatic test equipment |
| US6707474B1 (en) * | 1999-10-29 | 2004-03-16 | Agilent Technologies, Inc. | System and method for manipulating relationships among signals and buses of a signal measurement system on a graphical user interface |
| JP3660561B2 (ja) * | 1999-11-10 | 2005-06-15 | 株式会社東芝 | 半導体集積回路の故障解析装置 |
| JP3447638B2 (ja) * | 1999-12-24 | 2003-09-16 | 日本電気株式会社 | 半導体装置のテスト方法及びシステム並びに記録媒体 |
| JP2001306999A (ja) * | 2000-02-18 | 2001-11-02 | Fujitsu Ltd | データ解析装置およびデータ解析方法 |
| JP2002071762A (ja) * | 2000-06-13 | 2002-03-12 | Advantest Corp | 半導体試験装置及びそのモニタ装置 |
| CA2321346A1 (en) * | 2000-09-28 | 2002-03-28 | Stephen K. Sunter | Method, system and program product for testing and/or diagnosing circuits using embedded test controller access data |
| KR100374636B1 (ko) * | 2000-10-18 | 2003-03-04 | 삼성전자주식회사 | 결함 테스트 및 분석 회로를 구비하는 반도체 장치 및 결함 분석 방법 |
| JP2002163900A (ja) * | 2000-11-22 | 2002-06-07 | Hitachi Ltd | 半導体ウエハ、半導体チップ、半導体装置および半導体装置の製造方法 |
| US6711522B2 (en) * | 2001-04-25 | 2004-03-23 | Fujitsu Limited | Data analysis apparatus, data analysis method, and computer products |
| AU2002341677A1 (en) * | 2001-09-18 | 2003-04-01 | Applied Materials, Inc. | Integrated equipment set for forming an interconnect on a substrate |
| US7043696B2 (en) * | 2002-01-15 | 2006-05-09 | National Instruments Corporation | Graphical program system having a single graphical user interface shared by a plurality of graphical programs |
-
2002
- 2002-06-28 US US10/186,171 patent/US6898545B2/en not_active Expired - Fee Related
-
2003
- 2003-06-27 TW TW092117608A patent/TWI292540B/zh not_active IP Right Cessation
- 2003-06-27 EP EP03254101A patent/EP1376144A3/de not_active Withdrawn
- 2003-06-30 JP JP2003187735A patent/JP2004072093A/ja active Pending
-
2005
- 2005-01-04 US US11/028,823 patent/US7035752B2/en not_active Expired - Fee Related
Patent Citations (2)
| Publication number | Priority date | Publication date | Assignee | Title |
|---|---|---|---|---|
| WO1999022310A1 (en) | 1997-10-27 | 1999-05-06 | Kla-Tencor Corporation | Software system and method for extending classifications and attributes in production analysis |
| US6097887A (en) | 1997-10-27 | 2000-08-01 | Kla-Tencor Corporation | Software system and method for graphically building customized recipe flowcharts |
Also Published As
| Publication number | Publication date |
|---|---|
| US7035752B2 (en) | 2006-04-25 |
| JP2004072093A (ja) | 2004-03-04 |
| US20050119852A1 (en) | 2005-06-02 |
| TWI292540B (en) | 2008-01-11 |
| TW200406692A (en) | 2004-05-01 |
| US6898545B2 (en) | 2005-05-24 |
| EP1376144A3 (de) | 2006-01-18 |
| US20040002829A1 (en) | 2004-01-01 |
Similar Documents
| Publication | Publication Date | Title |
|---|---|---|
| US6898545B2 (en) | Semiconductor test data analysis system | |
| AU2011245430B2 (en) | Spin control user interface for selecting options | |
| US6233719B1 (en) | System and method for analyzing semiconductor production data | |
| US6239800B1 (en) | Method and apparatus for leading a user through a software installation procedure via interaction with displayed graphs | |
| JPH08227349A (ja) | 表示装置 | |
| EP3594827A1 (de) | Dokumentbasierte arbeitsabläufe | |
| JP2001521249A (ja) | 生産分析において分類及び属性を拡張するソフトウエアシステム及び方法 | |
| US20200103844A1 (en) | Bulk commissioning of field devices within a process plant | |
| CN101258490A (zh) | 指定、设置和发现电子表格文档的参数 | |
| KR20080041234A (ko) | 데이터베이스 애플리케이션에 선택 가능 기능 컨트롤을디스플레이하기 위한 명령 사용자 인터페이스 | |
| US5459866A (en) | Method of automatically producing job flow specification | |
| US8239757B2 (en) | System and method for creating and modifying test data files | |
| JP2000347894A (ja) | ソースプログラムチェック装置およびそのプログラム記録媒体 | |
| JP5651050B2 (ja) | データ生成装置及びデータ生成プログラム | |
| US6243858B1 (en) | Program construction assisting system | |
| JP2001356936A (ja) | Gui系プログラムのテスト支援装置および支援方法 | |
| US6996516B1 (en) | Apparatus for analyzing software and method of the same | |
| JPH07219810A (ja) | モジュールテスト方法および装置 | |
| US20050022170A1 (en) | Visual debugging interface | |
| US20040169684A1 (en) | Linking images for navigation | |
| JP2000172739A (ja) | 設計支援装置 | |
| US20230281216A1 (en) | Systems and methods for a graphical user interface for data analysis and visualisation | |
| JP2004362495A (ja) | エラーログ情報解析支援方法及び実施装置並びに処理プログラム | |
| US20080072165A1 (en) | Display method, computer program product and computer system | |
| CN121501803B (zh) | 面向线上电子表格的业务数据管理方法及装置 |
Legal Events
| Date | Code | Title | Description |
|---|---|---|---|
| PUAI | Public reference made under article 153(3) epc to a published international application that has entered the european phase |
Free format text: ORIGINAL CODE: 0009012 |
|
| AK | Designated contracting states |
Kind code of ref document: A2 Designated state(s): AT BE BG CH CY CZ DE DK EE ES FI FR GB GR HU IE IT LI LU MC NL PT RO SE SI SK TR |
|
| AX | Request for extension of the european patent |
Extension state: AL LT LV MK |
|
| PUAL | Search report despatched |
Free format text: ORIGINAL CODE: 0009013 |
|
| AK | Designated contracting states |
Kind code of ref document: A3 Designated state(s): AT BE BG CH CY CZ DE DK EE ES FI FR GB GR HU IE IT LI LU MC NL PT RO SE SI SK TR |
|
| AX | Request for extension of the european patent |
Extension state: AL LT LV MK |
|
| RIC1 | Information provided on ipc code assigned before grant |
Ipc: H01L 21/66 20060101ALI20051125BHEP Ipc: G01R 31/28 20060101AFI20031016BHEP |
|
| 17P | Request for examination filed |
Effective date: 20060316 |
|
| AKX | Designation fees paid |
Designated state(s): DE FR |
|
| RAP1 | Party data changed (applicant data changed or rights of an application transferred) |
Owner name: SANDIA TECHNOLOGIES, INC. Owner name: AGILENT TECHNOLOGIES, INC. |
|
| 17Q | First examination report despatched |
Effective date: 20081117 |
|
| STAA | Information on the status of an ep patent application or granted ep patent |
Free format text: STATUS: THE APPLICATION IS DEEMED TO BE WITHDRAWN |
|
| 18D | Application deemed to be withdrawn |
Effective date: 20110104 |