EP1564984A2 - Estimation de la fréquence et de l'amplitude d'une trame en demi-teintes pour le détramage de documents - Google Patents
Estimation de la fréquence et de l'amplitude d'une trame en demi-teintes pour le détramage de documents Download PDFInfo
- Publication number
- EP1564984A2 EP1564984A2 EP05100845A EP05100845A EP1564984A2 EP 1564984 A2 EP1564984 A2 EP 1564984A2 EP 05100845 A EP05100845 A EP 05100845A EP 05100845 A EP05100845 A EP 05100845A EP 1564984 A2 EP1564984 A2 EP 1564984A2
- Authority
- EP
- European Patent Office
- Prior art keywords
- signal
- frequency
- image data
- screen
- filter
- Prior art date
- Legal status (The legal status is an assumption and is not a legal conclusion. Google has not performed a legal analysis and makes no representation as to the accuracy of the status listed.)
- Withdrawn
Links
- 238000000034 method Methods 0.000 claims abstract description 19
- 238000005259 measurement Methods 0.000 claims description 17
- 238000005070 sampling Methods 0.000 claims description 9
- 238000001914 filtration Methods 0.000 claims description 5
- 238000012216 screening Methods 0.000 claims description 5
- 238000001514 detection method Methods 0.000 description 5
- 238000010606 normalization Methods 0.000 description 5
- 238000012935 Averaging Methods 0.000 description 4
- 238000010586 diagram Methods 0.000 description 3
- 238000012545 processing Methods 0.000 description 3
- 230000035945 sensitivity Effects 0.000 description 3
- 230000010339 dilation Effects 0.000 description 2
- 238000011143 downstream manufacturing Methods 0.000 description 2
- 238000009499 grossing Methods 0.000 description 2
- 239000000203 mixture Substances 0.000 description 2
- 238000000926 separation method Methods 0.000 description 2
- 238000000859 sublimation Methods 0.000 description 2
- 230000001629 suppression Effects 0.000 description 2
- 230000003044 adaptive effect Effects 0.000 description 1
- 230000000295 complement effect Effects 0.000 description 1
- 230000000694 effects Effects 0.000 description 1
- 230000003090 exacerbative effect Effects 0.000 description 1
- 230000011218 segmentation Effects 0.000 description 1
- 238000000638 solvent extraction Methods 0.000 description 1
Images


Classifications
-
- H—ELECTRICITY
- H04—ELECTRIC COMMUNICATION TECHNIQUE
- H04N—PICTORIAL COMMUNICATION, e.g. TELEVISION
- H04N1/00—Scanning, transmission or reproduction of documents or the like, e.g. facsimile transmission; Details thereof
- H04N1/40—Picture signal circuits
- H04N1/40075—Descreening, i.e. converting a halftone signal into a corresponding continuous-tone signal; Rescreening, i.e. combined descreening and halftoning
Definitions
- the present invention relates generally to methods and systems for image processing, and more particularly to methods and systems for de-Screening digitally scanned documents.
- halftone screens Almost all printed matter, except silver-halide photography, is printed using halftone screens.
- the need to estimate the halftone frequency and magnitude stems from the fact that almost all printed matter, with the exception of a few devices like dye-sublimation or silver-halide photography, is printed out using halftone screens.
- These halftones are very specific to the printing device and when scanned and re-halftoned may cause visible artifacts and/or unacceptable Moiré patterns if not properly removed.
- the suppression of halftones is especially important for color documents, since these are typically printed with four or more color separations containing slightly different screens at different angles and or frequencies, and these may interact with each other to cause undesirable spatial artifacts.
- a highly efficient method and system for eliminating halftone screens from scanned documents while preserving the quality and sharpness of text and line-art is disclosed.
- a screen estimate module which uses only a single channel of image data processing to generate a screen frequency estimate for downstream image processing, particularly for de-screening of the halftone signals from the image.
- the screen estimate module can generate a high quality and reliable estimate of the halftone screen frequency.
- a single channel screen frequency estimate is sufficient, because when the contrast is low or near zero, the frequency estimate is based on a highly filtered image signal, and may not be an accurate frequency measurement. However, when it is low, minimal halftone noise is measured in the input image and knowledge of its precise frequency is not required by downstream processing. A wide range of edge-sharpening effects may be applied to the image data in this situation, without exacerbating undesirable halftone artifacts.
- the frequency estimate is based on a reliable measurement of the halftone frequencies occurring in the image. Therefore, a single channel screen frequency estimate can be used over the full range of image contrast.
- the apparatus further comprises:
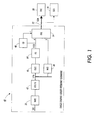
- FIG. 1 is a block diagram of the system of a single channel screen estimator module.
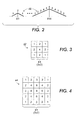
- FIG. 2 illustrates one-dimensional filter responses of various filter units.
- FIGS. 3-5 illustrates two-dimensional filter responses of various units.
- FIGS. 6A and 6B illustrates a typical 3x3 max module structure.
- FIGS. 7A and 7B illustrates a typical 3x3 contrast module structure.
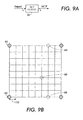
- FIG. 8 shows a min-max detection structure within a 3x3 window.
- FIGS. 9A and 9B illustrates a single interpolation unit.
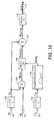
- FIG. 10 is a block diagram of a structure of a Bilinear Interpolation unit.
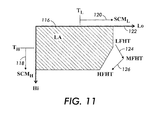
- FIG. 11 illustrates a screen frequency estimation equation
- FIG. 1 a block diagram of the method and system of the present invention is represented by a single channel screen estimator module SEM 40.
- the screen estimator module 40 is responsible for estimating the instantaneous halftone frequency at the current pixel of interest.
- the screen estimator module 40 operates on an 8-bit source image Src 28, and produces an 8-bit halftone frequency estimate Scm 72.
- a de-screen module (DSC) as described in Applicant's co-pending application, Attorney Docket number 118591, relies on the information that is produced by the screen estimator module in order to eliminate (filter out) the original halftone patterns from the original scanned image.
- DSC de-screen module
- the suppression of halftones is especially important for color documents, since these are typically printed with four or more color separations containing slightly different screens at different angles and or frequencies, and these may interact with each other to cause undesirable spatial artifacts.
- the prior art screen estimator module used up to three frequency channels at different levels of sensitivities.
- An upper channel was tuned for maximum frequency sensitivity at the full source resolution and therefore is used for deriving the screen frequency estimate signal.
- this channel was very sensitive and would usually report the existence of frequencies even when the screen is very weak. Therefore the screen frequency was additionally qualified by a screen magnitude Scm 72.
- the single channel 40 in FIG. 1 is tuned for moderate frequency sensitivity and operates at the full source resolution.
- the screen frequency signal Scm 72 is derived from the analysis of the frequency estimate that is produced by the single channel.
- the single channel 40 is made up of a Min-Max texture detector MM3 32 to be described below, followed by an averaging filter 42.
- the single channel MM3 32 unit operates on the single channel 8 bit incoming source signal Src 28.
- the MM3 Min-Max module 32 is used for finding peaks and valleys in the 2D input signal.
- a detailed description of the Min-Max detector unit is given below.
- the unit is basically examining the content of a 3x3 window centered on the current pixel of interest and analyzing, using adaptive thresholding, if the center pixel is significantly larger or smaller relative to its eight surrounding neighbors. If so, the center pixel is regarded to be a peak (if larger) or valley (if smaller) respectively. By counting the number of peaks and valleys per unit area, a measure of the local frequency is obtained.
- the MM3 unit output 32 has only 1 bit of precision, but is scaled by a configuration factor DotGain prior to the first subsequent stage of filtering.
- the unit operates on one or more color channels of the input signal. However, in this embodiment only one channel, the luminance channel is used. Note the scaling of the filter output can be postponed to the normalization step of the first subsequent filter by adjusting that stage's normalization factor.
- the output from the MM3 Min-Max detector 32 is passed through different averaging and sub-sampling filters.
- the spatial filter span in each case is twice the sub-sampling ratio minus one.
- the single channel MM3 32 output is applied to a cascade of two triangular 2D subsampling filters - the F31/16 filter 42 and F3/2 filter 46.
- the output from the cascaded filtering units is sub-sampled by a factor of 32x in each direction (16x in the first filter and 2x in the second).
- a sample of the 1/16 resolution signal is passed to MX3 unit 44.
- This unit performs a 3x3 Max operation (gray dilation).
- the output is sent to the b input of the Bilinear Interpolation unit BIU 54, respectively.
- the single channel contains an additional smoothing/averaging F5 unit 64 stage to further reduce spatial noise.
- the F5 unit 64 is a 5x5 triangular weight (non-subsampling) filter.
- the filtered output from this unit is sent to the input of the Bilinear Interpolation units BIU 54.
- the output is also passed through the C3 contrast unit 48 which searches for the maximum difference in a 3x3 window centered on the current pixel.
- the C3 output becomes the c input to the BIU unit 54.
- the three signals produced by the single channel 40 are sent to the BIU unit 54.
- This unit performs bilinear interpolation to bring the sub-sampled input resolution back to the original source resolution.
- the a and c BIU inputs are at 1/32 resolution and the b inputs are at 1/16 resolution.
- the output bandwidth from the interpolation unit is substantially higher than the input. For example, with the factor of 32x above, the interpolation unit produces 1024 output pixels for each input pixel.
- the output of the Bilinear Interpolation Unit 54 is the 8-bit estimated screen magnitude signal Scm 72.
- the estimated screen frequency signal Scm 72 is exported to the De-Screen Module DSC 58 and to the Segmentation Module SEG 56.
- DSC 58 De-Screen Module DSC 58
- SEG 56 Segmentation Module
- FIG. 2 illustrates one-dimensional filter responses of various filter units and FIGS. 3-5 illustrates two-dimensional filter responses of various units.
- These Filtering Units are used for the purpose of smoothing or averaging the input signals to remove high frequencies.
- Each filter unit implements a square, separable and symmetric 2D FIR (Finite impulse response) filter.
- the filter response is identical in the horizontal and vertical directions. If the input to the filter is a color signal, the same filter response is independently applied on each one of the color components.
- the 1D filter 60 response has a symmetric triangular shape with integer coefficients as illustrated in FIG. 2. The particular filter shape (but any other filter shapes are covered) was chosen for ease of implementation.
- the general filter form is referred to as an Fn/k filter, where n is the filter size (overall span in either x or y) and k is the amount of sub-sampling that is applied to the filtered output in each direction.
- FIGS. 1 and 2D filter response Examples for the 1D and 2D filter response are illustrated in FIGS. 1 and 2.
- FIG. 2 shows the non-normalized 1D filter 60 response for F3 and F11
- FIGS. 3 through 5 shows the resulting non-normalized 2-D coefficients for F3 62, F5 64, and F7 66, respectively.
- the 2D filter response can be implemented by cascading two 1D filters in the horizontal and vertical directions.
- the filters are all operating at the full input data rate, but the output may be sub-sampled by a factor of k in each direction.
- the subsampling filters F3/2 F15/8 F31/16 and F63/32 all have power of 2 1D weights: 4,64,256 and 1024 respectively. So normalization is just a rounding right shift.
- the MX3 Max unit 32 used in the single channel searches for the maximum value in a 3x3 window centered on the current pixel 74 of interest.
- the input is an 8-bit signal.
- the search for the max value is performed over the 9 pixels of the 3x3 window.
- This gray dilation module produces an 8-bit output that is made up of the largest pixel value 76 found within the boundaries of the search window.
- the MX3 max algorithm is illustrated in FIG. 6B.
- these C3 Contrast module 48 is designed for measuring the amount of local contrast at the input.
- the contrast is defined as the difference between the largest and smallest pixel values within a window centered on the current pixel 74 of interest.
- the C3 Contrast unit 48 utilizes a window size of 3x3, centered on the current pixel 74 of interest.
- the input to the contrast units is an 8-bit signal.
- the contrast module 48 produces an 8-bit monochrome output (single channel) 84.
- the operation of the C3 Contrast Unit 48 is illustrated in FIG. 7B. The operation is as following: for each pixel location, the content of a 3x3 window is independently searched for the minimum and maximum pixel values.
- the contrast is guaranteed to be in the range [0...255], and no special normalization is necessary.
- the Min-Max Detection module 32 is used for finding peaks and valleys in the input signal. By counting the number of peaks and valleys per unit area, a measure of the local frequency is obtained.
- the MM3 unit 32 operates on a one component gray source.
- the unit utilizes 3x3 window to indicate when the center pixel is at an extreme value (either peak or valley) relative to its 8 neighbors, following the logic below.
- the output from the Min-Max Detection unit32 is a 1-bit signal indicating that the corresponding Src pixel is in an extreme value state (can be extended to other color channels as well).
- the MM3 Min-Max Detection structure is depicted in FIG. 8. For each pixel, the outer ring of 8 pixels surrounding it (the current pixel of interest) is first analyzed. The 8 outer pixels are further divided into two sets of 4 pixels each as shown in FIG. 8. The partitioning of the outer ring into two sets is useful for reducing the likelihood of false alarms in detecting straight-line segments as halftones (since most commonly encountered halftones are likely to be clustered dots).
- the center pixel 74 value X is defined to be at a peak if it is [significantly] larger than the maximum pixel value of either set: If [(A max + Noise ⁇ X) AND (B max ⁇ X)] return(1)
- center pixel 74 value X is defined to be at a valley if it is [significantly] smaller than the minimum pixel value from either set: If [(A min > X + Noise) AND (B min ⁇ X)] return(1)
- the above equations determine the two conditions where the output from the 3x3 detection window are set to 1; in all other cases the output will be set to 0.
- the single channel screen estimator module SEM makes use of a Bilinear Interpolation Unit BIU.
- the Bilinear Interpolation Unit interpolates (up-samples) the signal back to the source resolution.
- the input signals are up-sampled by a factor of 32 in each direction to restore it to the original resolution.
- the step size of the bilinear interpolation is 1/32 nd of the original pixel grid.
- the structure of one of the Bilinear Interpolation Unit BIU 54 is shown in FIG. 10.
- the Bilinear Interpolation Unit operates on 3 signals 94, 96 and 98 generated in the single channel 40.
- the Bilinear Interpolation Unit 54 is composed of two interpolation stages 100 and 102, respectively.
- the first stage includes the interpolation 100 of the A 5 94 and C 5 98 inputs by 2x in each direction.
- the interpolation 100 uses a simple bi-linear interpolation technique.
- the A 5 input 94 corresponds to the output of the F5 filter 64 units.
- Note the subscripts in FIG. 10 correspond to the level of subsampling.
- the subscript 5 indicates that the signal has been subsampled 5 times by a factor of 1/2 (1/32 total).
- the C 5 input 98 corresponds to the output of the 3x3 contrast units. As indicated in FIG.
- the MagFineBlenVsCon function 106 above is a programmable function.
- the equations below incorporate this typical configuration value of MagFineBlenVsCon 106.
- BmA 4 B 4 - A 4
- BmAxC 4 (BmA 4 * MFB 4 ) >> 8
- the functional relationship defined above for MFB 4 is helpful in insuring the successful operation of the single channel 40.
- the relationship defines a linear curve starting at 16, with a slope of 12, and cutting off to zero at 192. This relationship insures that the control signal adjusts the blend of a and b, such that as the contrast increases, the proportion of B which is derived from the MX3 44 and is therefore a measure of the frequency occurring within a 3x3 pixel window, also increases.
- the Bilinear Interpolation module outputs a signal based on the A input, which is the heavily filtered image signal. If the contrast is larger, the output signal is more weighted toward the B component, which is the frequency measurement. Therefore, the output signal Scm can be used alone, without the additional magnitude estimate, because when it is small, it indicates that a relatively small amount of halftone noise is present and a precise measurement of its frequency will not be needed by downstream processing. However, when it is larger, it is based primarily on the frequency measurement, and so it is a reliable estimate of the halftone frequency present in the image.
Landscapes
- Engineering & Computer Science (AREA)
- Multimedia (AREA)
- Signal Processing (AREA)
- Image Processing (AREA)
- Image Analysis (AREA)
- Facsimile Image Signal Circuits (AREA)
Applications Claiming Priority (2)
| Application Number | Priority Date | Filing Date | Title |
|---|---|---|---|
| US776612 | 2004-02-12 | ||
| US10/776,612 US7365882B2 (en) | 2004-02-12 | 2004-02-12 | Halftone screen frequency and magnitude estimation for digital descreening of documents |
Publications (2)
| Publication Number | Publication Date |
|---|---|
| EP1564984A2 true EP1564984A2 (fr) | 2005-08-17 |
| EP1564984A3 EP1564984A3 (fr) | 2007-08-22 |
Family
ID=34701363
Family Applications (1)
| Application Number | Title | Priority Date | Filing Date |
|---|---|---|---|
| EP05100845A Withdrawn EP1564984A3 (fr) | 2004-02-12 | 2005-02-07 | Estimation de la fréquence et de l'amplitude d'une trame en demi-teintes pour le détramage de documents |
Country Status (5)
| Country | Link |
|---|---|
| US (1) | US7365882B2 (fr) |
| EP (1) | EP1564984A3 (fr) |
| JP (1) | JP4663349B2 (fr) |
| CN (1) | CN100481868C (fr) |
| TW (1) | TWI358228B (fr) |
Families Citing this family (11)
| Publication number | Priority date | Publication date | Assignee | Title |
|---|---|---|---|---|
| US7375856B2 (en) * | 2002-07-01 | 2008-05-20 | Xerox Corporation | Halftone screen frequency and magnitude estimation for digital descreening of documents |
| JP4115999B2 (ja) * | 2005-01-11 | 2008-07-09 | シャープ株式会社 | 画像処理装置、画像形成装置、画像読取処理装置、画像処理方法、画像処理プログラムおよびコンピュータ読み取り可能な記録媒体 |
| JP4118886B2 (ja) * | 2005-01-21 | 2008-07-16 | シャープ株式会社 | 画像処理装置、画像形成装置、画像読取処理装置、画像処理方法、画像処理プログラムおよびコンピュータ読み取り可能な記録媒体 |
| US8248660B2 (en) * | 2007-12-14 | 2012-08-21 | Qualcomm Incorporated | Efficient diffusion dithering using dyadic rationals |
| CN102567957B (zh) * | 2010-12-30 | 2014-06-25 | 北京大学 | 去除图像中网纹的方法与系统 |
| US8983218B2 (en) | 2012-04-11 | 2015-03-17 | Texas Instruments Incorporated | Virtual boundary processing simplification for adaptive loop filtering (ALF) in video coding |
| CN103561194B (zh) * | 2013-09-16 | 2016-01-20 | 湖南大学 | 一种基于自适应滤波的扫描图像去网纹方法 |
| US9147262B1 (en) | 2014-08-25 | 2015-09-29 | Xerox Corporation | Methods and systems for image processing |
| KR102091141B1 (ko) | 2015-01-14 | 2020-04-14 | 삼성전자주식회사 | 주파수 적응적 디스크리닝 방법 및 이를 수행하기 위한 장치 |
| US9288364B1 (en) | 2015-02-26 | 2016-03-15 | Xerox Corporation | Methods and systems for estimating half-tone frequency of an image |
| US9628635B1 (en) * | 2016-06-30 | 2017-04-18 | Xerox Corporation | Systems and methods for halftone frequency detection |
Citations (3)
| Publication number | Priority date | Publication date | Assignee | Title |
|---|---|---|---|---|
| US6011538A (en) * | 1997-06-18 | 2000-01-04 | Paradise Electronics, Inc. | Method and apparatus for displaying images when an analog-to-digital converter in a digital display unit is unable to sample an analog display signal at a desired high sampling frequency |
| US6229923B1 (en) * | 1998-01-21 | 2001-05-08 | Xerox Corporation | Method and system for classifying and processing of pixels of image data |
| EP1379074A2 (fr) | 2002-07-01 | 2004-01-07 | Xerox Corporation | Détramage digital de signaux d'images |
Family Cites Families (19)
| Publication number | Priority date | Publication date | Assignee | Title |
|---|---|---|---|---|
| US4849914A (en) | 1987-09-22 | 1989-07-18 | Opti-Copy, Inc. | Method and apparatus for registering color separation film |
| IL115166A (en) * | 1991-04-30 | 1997-02-18 | Scitex Corp Ltd | Apparatus and method for descreening |
| US5515452A (en) | 1992-12-31 | 1996-05-07 | Electroglas, Inc. | Optical character recognition illumination method and system |
| US5583659A (en) | 1994-11-10 | 1996-12-10 | Eastman Kodak Company | Multi-windowing technique for thresholding an image using local image properties |
| US5745596A (en) | 1995-05-01 | 1998-04-28 | Xerox Corporation | Method and apparatus for performing text/image segmentation |
| US5900953A (en) | 1997-06-17 | 1999-05-04 | At&T Corp | Method and apparatus for extracting a foreground image and a background image from a color document image |
| US6058214A (en) | 1998-01-20 | 2000-05-02 | At&T Corp. | Compression of partially masked still images |
| US6101285A (en) * | 1998-03-23 | 2000-08-08 | Xerox Corporation | Filter for producing continuous tone images from halftone digital images data |
| US6324305B1 (en) | 1998-12-22 | 2001-11-27 | Xerox Corporation | Method and apparatus for segmenting a composite image into mixed raster content planes |
| US6400844B1 (en) | 1998-12-02 | 2002-06-04 | Xerox Corporation | Method and apparatus for segmenting data to create mixed raster content planes |
| US6246776B1 (en) * | 1999-01-19 | 2001-06-12 | Xerox Corporation | Image recording media determination system, apparatus and method for an image processing device |
| US6734991B1 (en) * | 1999-09-24 | 2004-05-11 | Xerox Corporation | Method and apparatus for determining halftone line frequency estimates using MIN/MAX detection |
| US6633670B1 (en) | 2000-03-31 | 2003-10-14 | Sharp Laboratories Of America, Inc. | Mask generation for multi-layer image decomposition |
| US7433084B2 (en) * | 2002-07-01 | 2008-10-07 | Xerox Corporation | Digital de-screening technique for scanned documents |
| US7031518B2 (en) | 2002-07-01 | 2006-04-18 | Xerox Corporation | Segmentation method and system for Multiple Raster Content (MRC) representation of documents |
| US6983076B2 (en) * | 2002-07-01 | 2006-01-03 | Xerox Corporation | Control system for digital de-screening of documents |
| US7532363B2 (en) * | 2003-07-01 | 2009-05-12 | Xerox Corporation | Apparatus and methods for de-screening scanned documents |
| JP2005198219A (ja) * | 2004-01-05 | 2005-07-21 | Xerox Corp | ドキュメントのデジタルスクリーニング解除のためのハーフトーン・スクリーンの周波数と大きさの推定 |
| JP2005217761A (ja) * | 2004-01-29 | 2005-08-11 | Fuji Photo Film Co Ltd | 網点解析装置、網点解析プログラム、および網点解析方法 |
-
2004
- 2004-02-12 US US10/776,612 patent/US7365882B2/en not_active Expired - Fee Related
-
2005
- 2005-02-05 TW TW094103886A patent/TWI358228B/zh not_active IP Right Cessation
- 2005-02-07 EP EP05100845A patent/EP1564984A3/fr not_active Withdrawn
- 2005-02-08 CN CNB2005100080793A patent/CN100481868C/zh not_active Expired - Fee Related
- 2005-02-10 JP JP2005035187A patent/JP4663349B2/ja not_active Expired - Fee Related
Patent Citations (3)
| Publication number | Priority date | Publication date | Assignee | Title |
|---|---|---|---|---|
| US6011538A (en) * | 1997-06-18 | 2000-01-04 | Paradise Electronics, Inc. | Method and apparatus for displaying images when an analog-to-digital converter in a digital display unit is unable to sample an analog display signal at a desired high sampling frequency |
| US6229923B1 (en) * | 1998-01-21 | 2001-05-08 | Xerox Corporation | Method and system for classifying and processing of pixels of image data |
| EP1379074A2 (fr) | 2002-07-01 | 2004-01-07 | Xerox Corporation | Détramage digital de signaux d'images |
Also Published As
| Publication number | Publication date |
|---|---|
| JP4663349B2 (ja) | 2011-04-06 |
| CN1655579A (zh) | 2005-08-17 |
| TWI358228B (en) | 2012-02-11 |
| EP1564984A3 (fr) | 2007-08-22 |
| US20050179948A1 (en) | 2005-08-18 |
| US7365882B2 (en) | 2008-04-29 |
| CN100481868C (zh) | 2009-04-22 |
| JP2005228333A (ja) | 2005-08-25 |
| TW200537916A (en) | 2005-11-16 |
Similar Documents
| Publication | Publication Date | Title |
|---|---|---|
| US7218418B2 (en) | Digital de-screening of documents | |
| Kite et al. | A fast, high-quality inverse halftoning algorithm for error diffused halftones | |
| US6983076B2 (en) | Control system for digital de-screening of documents | |
| US6347153B1 (en) | Method and system for classifying and processing of pixels of image data | |
| US7391933B2 (en) | Method and apparatus for image interpolation based on adaptive polyphase filters | |
| US7375856B2 (en) | Halftone screen frequency and magnitude estimation for digital descreening of documents | |
| US6185328B1 (en) | Method and system for classifying and processing of pixels of image data | |
| US6689060B2 (en) | System and method for re-orderable nonlinear echo processing | |
| US6229923B1 (en) | Method and system for classifying and processing of pixels of image data | |
| EP1230805B1 (fr) | Estimateur de niveau de bruit video | |
| KR100532121B1 (ko) | 이미지 세부묘사 향상 방법 및 장치 | |
| US20040001624A1 (en) | Separation system for Multiple Raster Content (MRC) representation of documents | |
| US7031518B2 (en) | Segmentation method and system for Multiple Raster Content (MRC) representation of documents | |
| EP1564984A2 (fr) | Estimation de la fréquence et de l'amplitude d'une trame en demi-teintes pour le détramage de documents | |
| US6185336B1 (en) | Method and system for classifying a halftone pixel based on noise injected halftone frequency estimation | |
| US20040001648A1 (en) | Dynamic threshold system for multiple raster content (MRC) representation of documents | |
| US8619330B2 (en) | Image processing apparatus and image processing method | |
| Rantanen et al. | Color video signal processing with median filters | |
| KR100565065B1 (ko) | 필터 뱅크를 이용한 이미지 세부묘사 향상 방법 및 장치 | |
| EP1912173A1 (fr) | Dispositif de traitement d'image | |
| US7433084B2 (en) | Digital de-screening technique for scanned documents | |
| JPH06309452A (ja) | 解像度変換処理装置 | |
| JP2005198219A (ja) | ドキュメントのデジタルスクリーニング解除のためのハーフトーン・スクリーンの周波数と大きさの推定 | |
| JPH10248016A (ja) | 復元画像生成フィルタリング方法 | |
| Póth et al. | Spatial and frequency domain comparison of interpolation techniques in digital image processing |
Legal Events
| Date | Code | Title | Description |
|---|---|---|---|
| PUAI | Public reference made under article 153(3) epc to a published international application that has entered the european phase |
Free format text: ORIGINAL CODE: 0009012 |
|
| AK | Designated contracting states |
Kind code of ref document: A2 Designated state(s): AT BE BG CH CY CZ DE DK EE ES FI FR GB GR HU IE IS IT LI LT LU MC NL PL PT RO SE SI SK TR |
|
| AX | Request for extension of the european patent |
Extension state: AL BA HR LV MK YU |
|
| PUAL | Search report despatched |
Free format text: ORIGINAL CODE: 0009013 |
|
| AK | Designated contracting states |
Kind code of ref document: A3 Designated state(s): AT BE BG CH CY CZ DE DK EE ES FI FR GB GR HU IE IS IT LI LT LU MC NL PL PT RO SE SI SK TR |
|
| AX | Request for extension of the european patent |
Extension state: AL BA HR LV MK YU |
|
| 17P | Request for examination filed |
Effective date: 20080222 |
|
| AKX | Designation fees paid |
Designated state(s): DE FR GB |
|
| 17Q | First examination report despatched |
Effective date: 20080916 |
|
| STAA | Information on the status of an ep patent application or granted ep patent |
Free format text: STATUS: THE APPLICATION IS DEEMED TO BE WITHDRAWN |
|
| 18D | Application deemed to be withdrawn |
Effective date: 20190123 |