EP1566757A1 - Verwaltungssystem für Maschinen und Nachrichtenserver zur Verwaltung von Maschinen - Google Patents
Verwaltungssystem für Maschinen und Nachrichtenserver zur Verwaltung von Maschinen Download PDFInfo
- Publication number
- EP1566757A1 EP1566757A1 EP05003603A EP05003603A EP1566757A1 EP 1566757 A1 EP1566757 A1 EP 1566757A1 EP 05003603 A EP05003603 A EP 05003603A EP 05003603 A EP05003603 A EP 05003603A EP 1566757 A1 EP1566757 A1 EP 1566757A1
- Authority
- EP
- European Patent Office
- Prior art keywords
- machine
- display
- diagnosis result
- anomaly
- processes
- Prior art date
- Legal status (The legal status is an assumption and is not a legal conclusion. Google has not performed a legal analysis and makes no representation as to the accuracy of the status listed.)
- Ceased
Links
Images




Classifications
-
- G—PHYSICS
- G06—COMPUTING OR CALCULATING; COUNTING
- G06Q—INFORMATION AND COMMUNICATION TECHNOLOGY [ICT] SPECIALLY ADAPTED FOR ADMINISTRATIVE, COMMERCIAL, FINANCIAL, MANAGERIAL OR SUPERVISORY PURPOSES; SYSTEMS OR METHODS SPECIALLY ADAPTED FOR ADMINISTRATIVE, COMMERCIAL, FINANCIAL, MANAGERIAL OR SUPERVISORY PURPOSES, NOT OTHERWISE PROVIDED FOR
- G06Q10/00—Administration; Management
- G06Q10/06—Resources, workflows, human or project management; Enterprise or organisation planning; Enterprise or organisation modelling
-
- G—PHYSICS
- G05—CONTROLLING; REGULATING
- G05B—CONTROL OR REGULATING SYSTEMS IN GENERAL; FUNCTIONAL ELEMENTS OF SUCH SYSTEMS; MONITORING OR TESTING ARRANGEMENTS FOR SUCH SYSTEMS OR ELEMENTS
- G05B23/00—Testing or monitoring of control systems or parts thereof
- G05B23/02—Electric testing or monitoring
- G05B23/0205—Electric testing or monitoring by means of a monitoring system capable of detecting and responding to faults
- G05B23/0259—Electric testing or monitoring by means of a monitoring system capable of detecting and responding to faults characterized by the response to fault detection
- G05B23/0267—Fault communication, e.g. human machine interface [HMI]
- G05B23/0272—Presentation of monitored results, e.g. selection of status reports to be displayed; Filtering information to the user
-
- G—PHYSICS
- G06—COMPUTING OR CALCULATING; COUNTING
- G06Q—INFORMATION AND COMMUNICATION TECHNOLOGY [ICT] SPECIALLY ADAPTED FOR ADMINISTRATIVE, COMMERCIAL, FINANCIAL, MANAGERIAL OR SUPERVISORY PURPOSES; SYSTEMS OR METHODS SPECIALLY ADAPTED FOR ADMINISTRATIVE, COMMERCIAL, FINANCIAL, MANAGERIAL OR SUPERVISORY PURPOSES, NOT OTHERWISE PROVIDED FOR
- G06Q10/00—Administration; Management
-
- G—PHYSICS
- G05—CONTROLLING; REGULATING
- G05B—CONTROL OR REGULATING SYSTEMS IN GENERAL; FUNCTIONAL ELEMENTS OF SUCH SYSTEMS; MONITORING OR TESTING ARRANGEMENTS FOR SUCH SYSTEMS OR ELEMENTS
- G05B2219/00—Program-control systems
- G05B2219/30—Nc systems
- G05B2219/35—Nc in input of data, input till input file format
- G05B2219/35391—Sort, order entered data hierarchical
Definitions
- This invention relates to a machine management system for managing machines existing in a plant and a message server used for the machine management.
- a machine management system can manage machines systematically according to a tree structure called a plant hierarchy. It also has a function of displaying the diagnosis result of each machine.
- FIG. 1 is a drawing to show a display screen example of a machine management system in a related art.
- the machines existing in a plant are classified under a multilevel hierarchy and are displayed on a screen as a true structure.
- an icon " ⁇ " represents a plant hierarchy level and an icon “ ⁇ ” represents a machine.
- An icon representing the diagnosis result is displayed for each machine on the tree.
- the diagnosis result is displayed as an icon for machines A to H. If the diagnosis result is normal, the icon " ⁇ " is displayed; if the diagnosis result is abnormal, a mark "! is displayed in the icon " ⁇ ".
- the letter in the icon " ⁇ " represents the type of plant hierarchy level.
- the correspondence between the letters and the plant hierarchy levels is as follows:
- Each machine is assigned to the hierarchy level of Equipment Module on the tree structure of the plant hierarchy.
- the user can switch between display and non-display modes of subordinate hierarchy levels to each node as desired.
- the diagnosis result of each machine is displayed in the node of the machine on the tree.
- JP-A-2004-29897 discloses a machine management system for managing machines existing in a plant.
- the diagnosis result of one machine is displayed only in the node of the machine on the screen.
- the user cannot see on the screen that the diagnosis result of a machine at a lower level not displayed on the screen is abnormal.
- the object of the invention is to provide a machine management system and a message server that can prevent oversights of machine management.
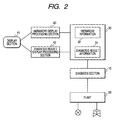
- FIG. 2 is a block diagram to show a first embodiment of the invention.
- a diagnosis section 10 diagnoses each machine existing in a plant 20.
- the plant 20 is a plant of petrochemistry, steel, paper and pulp, foods, chemicals, electric power, etc., for example.
- the machines existing in the plant 20 are sensor machines for detecting the process values of temperature, pressure, liquid level, etc., valve positioners for controlling valves, and the like.
- a storage section 30 stores diagnosis result information 31 of the diagnosis section 10, hierarchy information 32 systematically indicating a plant hierarchy as a tree structure, and the like.
- a hierarchy display processing section 40 classifies the machines existing in the plant 20 under a multilevel hierarchy and processes to display them on a screen of a display section 41 as a tree structure.
- a diagnosis result display processing section 42 processes to display the diagnosis result of each machine displayed on the screen of the display section 41 and also processes to display a summary of the diagnosis results of one or more nondisplayed machines which is not displayed on the screen of the display section 41 and is classified to a level lower than that of the machines displayed on the screen of the display section 41.
- FIG. 3 is a drawing to show a display screen example of the machine management system in FIG. 2.
- FIG. 3 the tree structure is displayed in a similar manner to that in FIG. 1.
- FIG. 3 an icon representing the diagnosis result is displayed in each node of the tree. In the node of each machine, the diagnosis result of the machine is displayed.
- a summary of the diagnosis results of the machines existing at the lower levels is displayed. If the diagnosis results of all machines belonging to the lower levels of the plant hierarchy are normal, a normal icon is displayed. If the diagnosis result of one of the machines belonging to the lower levels of the plant hierarchy is abnormal, an abnormal icon is displayed. Even if all displayed machines are normal, if a machine not displayed at the lower level is abnormal, an abnormal icon is displayed in the plant hierarchy. Such icon display is produced by the diagnosis result display processing section 42.
- an icon " ⁇ " is displayed in the icon displayed in the plant hierarchy node. If the diagnosis result of one of the machines belonging to the lower levels of the plant hierarchy is abnormal, a mark "! is displayed in the icon " ⁇ ". Even if all displayed machines are normal, if a machine not displayed at the lower level is abnormal, the mark "! is displayed in the icon " ⁇ ".
- node B the diagnosis result of machine B is abnormal and therefore an abnormal icon is displayed.
- node E an abnormal icon of the diagnosis result does not exist and therefore a normal icon is displayed.
- node F the diagnosis results of machines D and E are abnormal and therefore an abnormal icon is displayed.
- node G the diagnosis results of machines D and E are abnormal and therefore an abnormal icon is displayed.
- node H an abnormal icon of the diagnosis result does not exist and therefore a normal icon is displayed.
- node I an abnormal icon of the diagnosis result does not exist and therefore a normal icon is displayed.
- node J an abnormal icon of the diagnosis result does not exist and therefore a normal icon is displayed.
- node K an abnormal icon of the diagnosis result does not exist and therefore a normal icon is displayed.
- node L an abnormal icon of the diagnosis result does not exist and therefore a normal icon is displayed.
- node M an abnormal icon of the diagnosis result does not exist and therefore a normal icon is displayed.
- the user can see the fact that the diagnosis result of one machine at the lower level is abnormal. Accordingly, even when the machines are not displayed, the user can easily see the fact that the diagnosis result of one machine is abnormal.
- the user can easily trace the plant hierarchy with an abnormal icon in order to the lower levels, thereby reaching the machine whose diagnosis result is abnormal.
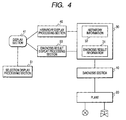
- FIG. 4 is a block diagram to show a second embodiment of the invention. Parts identical with those previously described with reference to FIG. 2 are denoted by the same reference numerals in FIG. 4.
- a diagnosis result display processing section 50 processes to display the level of an alarm occurring in each machine displayed on a screen and also processes to display the alarm level at the higher level of the plant hierarchy to which the machines not displayed on the screen are connected.
- the diagnosis result display processing section 50 processes to display the level of an alarm occurring in each machine displayed on a screen and also displays the highest level of the alarm levels of all machines containing the machines not displayed at the lower levels of the plant hierarchy displayed on the screen.
- a selection display processing section 51 processes to selectively display the machines whose alarm level is equal to or greater than a predetermined level.
- FIGs. 5A and 5B are drawings to show a display screen example of the machine management system in FIG. 4.
- the alarm level is displayed as an icon and the machines at the predetermined level or more are selectively displayed.
- FIG. 5A shows a display screen before selection and FIG. 5B shows a display screen after selection.
- an icon representing the alarm level is displayed in each node of the tree.
- the alarm level of the machine is displayed.
- the highest level of the alarm levels occurring in the machines existing at the lower levels of the hierarchy is displayed.
- the numeric value indicated in the icon represents the alarm level. The larger the numeric value, the higher the alarm level.
- each machine is provided with the state of the alarm level.
- the highest level of the alarm levels occurring in all machines belonging to the lower levels of the hierarchy is displayed.
- FIG. 4A shows the whole tree structure and FIG. 4B shows a state in which only the nodes and machines whose alarm level is 3 or more are displayed.
- the selective display function of the tree based on the alarm level is provided, so that it is made possible for the user furthermore easily to visually check the plant hierarchy node and the machine where a highly important alarm occurs.
- FIG. 6 is a block diagram to show a third embodiment of the invention.
- a diagnosis result display processing section 60 processes to display the state of each node displayed on a screen and also displays a summary of the states of all nodes containing the nodes not displayed at the lower levels than an intermediate hierarchy level.
- “remaining amount of raw material” is linked with “state.”
- “fact that remaining amount becomes small” or “fact that remaining amount has run out” can be represented as “state.”
- “Fact that remaining amount becomes small” or “fact that remaining amount has run out” is set to "special state,” whereby the remaining amount of the raw material in the manufacturing line can be represented as a tree structure.
- the alarm state and the abnormal state are displayed in an easy-to-understand manner.
- the normal state can also be displayed in an easy-to-understand manner.
- FIG. 7 is a drawing to show a display screen example of the machine management system in FIG. 6.
- an icon representing the state is displayed in each node of the tree.
- the state of the node is displayed.
- a summary of the states of the nodes positioned at the lower levels than the node is displayed.
- an icon " ⁇ " is displayed in the icon displayed in the plant hierarchy node. If the states of all machines contained in the lower levels of the hierarchy are usual, an icon " ⁇ " is displayed. If the state of one of the machines contained in the lower levels of the hierarchy is special, a mark "! is displayed in the icon " ⁇ ". Even if all displayed nodes are usual state, if the state of a node not displayed at the lower level is special, the mark "! is displayed in the icon " ⁇ ".
- the end node of the tree has one state.
- the node at an intermediate level of the hierarchy has the state provided by combining the states of the nodes at the lower levels than the node according to one condition.
- a node at an intermediate level is provided with a summary of the nodes at the lower levels, so that it is made possible for the user to know the state of each node at the lower levels by seeing the node at the higher level. Accordingly, to search for a node in the special state at the lower levels, the user can trace the nodes placed in the special state in order to the lower levels, thereby easily reaching the node in the special state.
- the plant hierarchy node and the machine where a highly important alarm occurs can be displayed in an easy-to-understand manner.
- the alarm levels of the nondisplayed machines can be recognized easily.
- the selective display function of the tree based on the alarm level is provided, so that it is made possible for the user furthermore easily to visually check the plant hierarchy node and the machine where a highly important alarm occurs.
- a node at an intermediate level is provided with a summary of the nodes at the lower levels, so that it is made possible for the user to know the state of each node at the lower levels by seeing the node at the higher level. Accordingly, to search for a node in the special state at the lower levels, the user can trace the nodes placed in the special state in order to the lower levels, thereby easily reaching the node in the special state.
- the invention can be applied to general tree display. Accordingly, the operability of tree display can be enhanced.
- FIG. 8 is a block diagram to show a fourth embodiment of the invention.
- a diagnosis section 110 diagnoses each machine existing in a plant 120.
- the plant 120 is a plant of petrochemistry, steel, paper and pulp, foods, chemicals, electric power, etc., for example.
- the machines existing in the plant 120 are sensor machines for detecting the process values of temperature, pressure, liquid level, etc., valve positioners for controlling valves, and the like.
- a machine display processing section 140 classifies the machines existing in the plant 120 under a multilevel hierarchy and processes to display them on a screen of a display section 141 as a tree structure.
- a storage section 150 stores diagnosis result information 151 of the diagnosis section 110, machine information 132 indicating the tag names, the machine IDs, the communication modes, etc., of the machines existing in the plant, hierarchy information systematically indicating a plant hierarchy as a tree structure, and the like.
- An operation section 160 is a section for the user to perform anomaly check operation on a screen for the machine whose diagnosis result is abnormal.
- the operation section 160 is a mouse, a keyboard, etc., for example.
- a diagnosis result display processing section 170 processes to display the diagnosis result of each machine on the screen of the display section 141.
- the diagnosis result display processing section 170 changes the anomaly display modes of the machine whose anomaly is not yet checked and the machine whose anomaly has been checked through the operation section 160. That is, when the diagnosis result of a machine becomes abnormal, the diagnosis result display processing section 170 processes to display the anomaly of the machine whose anomaly is not yet checked in a predetermined display mode and when the user performs anomaly check operation through the operation section 160 for the machine whose anomaly is not yet checked, the diagnosis result display processing section 170 changes the anomaly display mode.
- the diagnosis result information 151 is information made up of entries of a machine ID, a flag indicating the presence or absence of machine anomaly, and a flag indicating "to be checked” for each machine as shown in FIG. 8.
- the machine anomaly flag is "1," the machine is abnormal; when the machine anomaly flag is "0,” the machine is normal.
- the "to be checked” flag is set to "1," when the abnormal state has been checked, the "to be checked” flag is set to "0.”
- the diagnosis section 110 sets the machine anomaly flag to "0" and when abnormal, "1."
- the "to be checked” flag is set to "0."
- the "to be checked” flag is set to "1.”
- the diagnosis result display processing section 170 processes to display the machine diagnosis result on the display section 141 based on the machine anomaly flag and the "to be checked” flag.
- FIG. 9 is a drawing to show a display screen example of the machine management system in FIG. 8.
- the user does not yet perform check operation and therefore an exclamation mark "! added to the icon of the machine blinks as shown in anomaly display 180.
- FIG. 10 is a schematic representation to show a display procedure of the machine management system in FIG. 8.
- diagnosis section 110 Upon detection of an anomaly in a machine, the diagnosis section 110 sets the "machine anomaly” and “to be checked” flags of the machine to ON (in the example in FIG. 10, "1").
- diagnosis result display processing section 170 processes to blink a mark "! on the screen.
- diagnosis result display processing section 170 processes to light the mark "!.”
- diagnosis section 110 again sets the "to be checked” flag of the machine to ON.
- the mark "! displayed in the icon part of the machine blinks, so that the user can find the new machine anomaly.
- the machine state is thus managed in three categories of "normal,” “anomaly (not yet checked),” and “anomaly (checked).”
- the machine state may be displayed in any other display mode.
- FIG. 11 is a drawing to show another display screen example of the machine management system in FIG. 8 and
- FIG. 12 is a drawing to show variation of the display state with time.
- the mark blinked for the machine reaching the date the designated number of days before the scheduled inspection date and the mark blinked for the machine reaching the scheduled inspection date are thus displayed in different colors.
- the marks are thus displayed, whereby oversights of inspection can be decreased.
- the inspection state can be determined easily.
- An unchecked machine anomaly can be represented in the tree view displayed as a tree structure provided by classifying the machines as a plant hierarchy.
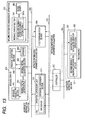
- FIG. 13 is a functional block diagram to show an embodiment of a message server of the invention applied to a distributed control system wherein a client of the message server is a machine integrated management apparatus.
- the invention is characterized by the fact that a general purpose environment is constructed wherein an equivalent function to a device viewer installed in a machine integrated management apparatus as standard equipment is constructed in a message server and a client of the message server can be provided with detailed information of machine anomaly in real time.
- An operation supervisory unit 301 in a distributed control system includes an operation supervisory section 311 for executing plant operation supervision and an OPC server 312 having a standard interface for data reference to collect messages sent from subordinate units and sending the messages to a superior client.
- the operation supervisory unit 301 and a controller 303 for performing plant control are connected to a control bus 302.
- the operation supervisory unit 301 and the controller 303 communicate with each other through the control bus 302.
- the controller 303 and a field machine 305 are connected to a field bus 304.
- the controller 303 and the field machine 305 communicate with each other through the field bus 304.
- the field machine 305 is a machine conforming to Foundation Fieldbus-H1 (simply FF-H1) standard, a sensor anomaly, a fatal anomaly, and the like are set in a parameter of BLOCK_ERR as bit information as the FF-H1 specifications.
- a vendor-proper self-diagnosis anomaly not included in the FF-H1 specifications is set in an "other" bit of the BLOCK_ERR parameter as aggregate information of machine anomaly.
- An aggregate parameter storage section 351 stores an aggregate parameter of machine anomaly.
- the FF-H1 machine sets detailed error code indicating the description of self-diagnosis in a vendor-proper machine parameter.
- the detailed error code is set in a parameter of XD_ERROR of a transducer block.
- a detailed parameter storage section 352 stores a detailed parameter of machine anomaly.
- the field machine 305 sends a field bus message of "Machine anomaly: Other occurred" to a superior unit as aggregate information. This information is collected in the OPC server 312 of the operation supervisory unit 301 via the controller 303.
- a general purpose communication bus 306 is a bus typified by Ethernet (registered trademark).
- the operation supervisory unit 301, a message server 400, and a machine integrated management apparatus 308 are connected to the general purpose communication bus 306.
- a message collection section 401 of the message server 400 collects aggregate information concerning each machine anomaly through the general purpose communication bus 306 from the OPC server 312 of the operation supervisory unit 301 and stores the aggregate information in a database 402 as history data.
- a message display section 381 acquires the aggregate information concerning machine anomaly stored in the database 402 of the message server 400 via the general purpose communication bus 306 and displays the aggregate information on a screen 381a. If the tag name of the field machine 305 is FI100, a message of "FI100 machine anomaly (other occurred)" is displayed. The user can recognize that some machine error occurred in FI100 according to the message.
- the message "machine anomaly” is displayed on the screen 381a, informing the user that a machine anomaly occurred.
- the user cannot be provided with detail information indicating what occurred in the machine from the message indicating "Other" only.
- the machine integrated management apparatus 308 includes a device viewer 382 for referencing detailed information as standard equipment.
- a field communication server 309 has an OPC interface, is connected between the general purpose communication bus 306 and the control bus 302, accesses the detailed parameter storage section 352 of the field machine 305 via the controller 305, and collects the error code of the detailed parameter concerning the machine anomaly set therein at regular time intervals.
- an anomaly detail acquisition section 403 When the message collection section 401 receives new aggregate information sent from the field machine 305, an anomaly detail acquisition section 403 is automatically called.
- the anomaly detail acquisition section 403 has an equivalent function to that of an anomaly detail acquisition section 382a of the device viewer 382, and acquires the error code of the detailed parameter of the machine from the field communication server 309 based on anomaly occurrence machine (FI100) information collected by the message collection section 401.
- FI100 anomaly occurrence machine
- the anomaly detail acquisition section 403 references an anomaly detail definition file 404 storing defined character string information for interpreting the error code of the parameter for each machine type, acquires the character string information corresponding to the error code of the parameter acquired from the field communication server 309, and passes the character string information to a message formatting section 405 together with aggregate information.
- the anomaly detail definition file 404 is an equivalent function to an anomaly detail definition file 82b of the device viewer 382.
- the message formatting section 405 again formats the aggregate information passed from the anomaly detail acquisition section 403, for example, "FI100 machine anomaly (other occurred)" and detailed information obtained by referencing the anomaly detail definition file 404 based on the error code set in the detailed parameter storage section 352, for example, "EPROM anomaly” and stores the information in the database 402.
- the machine anomaly information stored in the database 402 is reflected on the message display section 381 of the machine integrated management apparatus 308.
- "FI100 machine anomaly (other occurred) EPROM anomaly” is displayed on the machine integrated management apparatus 308; the information into which the aggregate information and the detailed information are combined in real time can be displayed on the screen 381a.
- the message collection section 401 Upon reception of aggregate information "FI100 machine anomaly (other occurred)" from the OPC server 312 of the operation supervisory unit 301, the message collection section 401 calls the anomaly detail acquisition section 403 to add detailed information.
- the anomaly detail acquisition section 403 references the anomaly detail definition file 404 and acquires the character string information corresponding to the error code of the parameter of the machine.
- the anomaly detail acquisition section 403 acquires the parameter stored in the detailed parameter storage section 352 of machine anomaly of the field machine 305 online via the field communication server 309 to acquire detailed information.
- the anomaly detail acquisition section 403 passes the character string provided by interpreting the error code of the acquired parameter based on the definition information in the anomaly detail definition file 404 to the message formatting section 405.
- the message formatting section 405 adds detailed character string information to the original aggregate information to provide message information and stores the reformatted message information in the database 402.
- the message with the detailed information added to the aggregate information is displayed on the screen 381a of the message display section 381 of the machine integrated management apparatus 308 reflecting the information.
- the anomaly detail acquisition section 403 and the message formatting section 405 are separate functional blocks, but the function of the message formatting section 405 can also be built in the anomaly detail acquisition section 403 to form one functional block.
- the machine integrated management apparatus 308 is illustrated as the client of the message server 400, but the message server of the invention has general versatility for acquiring detailed information of machine anomaly and therefore the client is not limited to the machine integrated management apparatus.
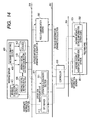
- FIG. 14 is a functional block diagram to show a sixth embodiment of the invention.
- a client of a message server is an operation supervisory unit 301. That is, a message to which detailed information stored in a database 402 of a message server 400 is added is reflected on a message display screen of the operation supervisory unit 301 through a general purpose communication bus 306.
- the message server 400 is shown as an independent apparatus connected to the general purpose communication bus 306, but anomaly detail acquisition section 403, an anomaly detail definition file 404, and the message formatting section 405 can also be formed in the operation supervisory unit 301.
- the message server has general versatility capable of acquiring detailed information of machine anomaly
- the clients are not limited. For example, if an operation supervisor unit of a distributed control system is a client, detailed information of machine anomaly can also be displayed on a message screen of the supervisory unit for the operator to supervise the operation of each machine.
Landscapes
- Engineering & Computer Science (AREA)
- Business, Economics & Management (AREA)
- General Physics & Mathematics (AREA)
- Strategic Management (AREA)
- Physics & Mathematics (AREA)
- Entrepreneurship & Innovation (AREA)
- Economics (AREA)
- Human Resources & Organizations (AREA)
- Quality & Reliability (AREA)
- Marketing (AREA)
- Operations Research (AREA)
- Tourism & Hospitality (AREA)
- General Business, Economics & Management (AREA)
- Theoretical Computer Science (AREA)
- Game Theory and Decision Science (AREA)
- Educational Administration (AREA)
- Development Economics (AREA)
- Human Computer Interaction (AREA)
- Automation & Control Theory (AREA)
- Testing And Monitoring For Control Systems (AREA)
- User Interface Of Digital Computer (AREA)
Priority Applications (1)
| Application Number | Priority Date | Filing Date | Title |
|---|---|---|---|
| EP06007034.9A EP1679647B1 (de) | 2004-02-20 | 2005-02-18 | Verwaltungssystem für eine Maschine und Nachrichtenserver zur Verwendung für die Maschinenverwaltung |
Applications Claiming Priority (6)
| Application Number | Priority Date | Filing Date | Title |
|---|---|---|---|
| JP2004043902 | 2004-02-20 | ||
| JP2004043902A JP4099824B2 (ja) | 2004-02-20 | 2004-02-20 | メッセージサーバ |
| JP2004165827A JP2005346444A (ja) | 2004-06-03 | 2004-06-03 | 機器管理システム |
| JP2004165827 | 2004-06-03 | ||
| JP2004173297 | 2004-06-11 | ||
| JP2004173297A JP2005352797A (ja) | 2004-06-11 | 2004-06-11 | 機器管理システム |
Related Child Applications (1)
| Application Number | Title | Priority Date | Filing Date |
|---|---|---|---|
| EP06007034.9A Division EP1679647B1 (de) | 2004-02-20 | 2005-02-18 | Verwaltungssystem für eine Maschine und Nachrichtenserver zur Verwendung für die Maschinenverwaltung |
Publications (1)
| Publication Number | Publication Date |
|---|---|
| EP1566757A1 true EP1566757A1 (de) | 2005-08-24 |
Family
ID=34714159
Family Applications (2)
| Application Number | Title | Priority Date | Filing Date |
|---|---|---|---|
| EP06007034.9A Expired - Lifetime EP1679647B1 (de) | 2004-02-20 | 2005-02-18 | Verwaltungssystem für eine Maschine und Nachrichtenserver zur Verwendung für die Maschinenverwaltung |
| EP05003603A Ceased EP1566757A1 (de) | 2004-02-20 | 2005-02-18 | Verwaltungssystem für Maschinen und Nachrichtenserver zur Verwaltung von Maschinen |
Family Applications Before (1)
| Application Number | Title | Priority Date | Filing Date |
|---|---|---|---|
| EP06007034.9A Expired - Lifetime EP1679647B1 (de) | 2004-02-20 | 2005-02-18 | Verwaltungssystem für eine Maschine und Nachrichtenserver zur Verwendung für die Maschinenverwaltung |
Country Status (3)
| Country | Link |
|---|---|
| US (1) | US7295887B2 (de) |
| EP (2) | EP1679647B1 (de) |
| CN (1) | CN100383780C (de) |
Cited By (11)
| Publication number | Priority date | Publication date | Assignee | Title |
|---|---|---|---|---|
| WO2014151574A1 (en) * | 2013-03-15 | 2014-09-25 | Fisher-Rosemount Systems, Inc. | Navigating within a graphical depiction of a process control plant |
| US9983575B2 (en) | 2013-04-09 | 2018-05-29 | Fisher-Rosemount Systems, Inc. | Systems and methods to graphically display process control system information |
| US10013149B2 (en) | 2013-03-15 | 2018-07-03 | Fisher-Rosemount Systems, Inc. | Graphical process variable trend monitoring for a process control system |
| US10180681B2 (en) | 2013-03-15 | 2019-01-15 | Fisher-Rosemount Systems, Inc. | Graphical process variable trend monitoring with zoom features for use in a process control system |
| GB2568783A (en) * | 2017-10-02 | 2019-05-29 | Fisher Rosemount Systems Inc | Method and apparatus for assessing the collective health of multiple process control systems |
| US10438144B2 (en) | 2015-10-05 | 2019-10-08 | Fisher-Rosemount Systems, Inc. | Method and apparatus for negating effects of continuous introduction of risk factors in determining the health of a process control system |
| US10481595B2 (en) | 2015-10-05 | 2019-11-19 | Fisher-Rosemount Systems, Inc. | Method and apparatus for assessing the collective health of multiple process control systems |
| US10514668B2 (en) | 2013-03-15 | 2019-12-24 | Fisher-Rosemount Systems, Inc. | Graphical process variable trend monitoring in a process control system using a navigation pane |
| EP2726948B1 (de) * | 2011-06-30 | 2020-06-24 | ABB Schweiz AG | Erzeugung von summenalarmen in der prozesssteuerung |
| US10803636B2 (en) | 2013-03-15 | 2020-10-13 | Fisher-Rosemount Systems, Inc. | Graphical process variable trend monitoring, predictive analytics and fault detection in a process control system |
| CN114202197A (zh) * | 2021-12-09 | 2022-03-18 | 成都轨道交通集团有限公司 | 一种报警消息排序的方法与系统 |
Families Citing this family (27)
| Publication number | Priority date | Publication date | Assignee | Title |
|---|---|---|---|---|
| JP2008123427A (ja) * | 2006-11-15 | 2008-05-29 | Mitsubishi Electric Corp | 監視制御システムの表示方式 |
| JP5400678B2 (ja) * | 2010-03-19 | 2014-01-29 | シャープ株式会社 | 太陽光発電プラント監視システム |
| US20120306620A1 (en) * | 2011-05-31 | 2012-12-06 | General Electric Company | Systems and methods for alert visualization |
| CN104731648B (zh) * | 2012-09-28 | 2017-12-12 | 北京搜狐新媒体信息技术有限公司 | 一种分布式系统中心节点构建、提交、监控方法及装置 |
| CN104570976A (zh) * | 2013-10-22 | 2015-04-29 | 富泰华工业(深圳)有限公司 | 监控系统及方法 |
| JP6295113B2 (ja) * | 2014-03-17 | 2018-03-14 | ルネサスエレクトロニクス株式会社 | 自己診断装置及び自己診断方法 |
| CN104408883B (zh) * | 2014-10-15 | 2017-05-31 | 深圳沈鼓测控技术有限公司 | 设备报警状态判断及显示方法 |
| SG11201704188TA (en) * | 2014-11-26 | 2017-06-29 | Tlv Co Ltd | Device management system and maintenance work method using the system |
| CN105515817A (zh) * | 2015-01-21 | 2016-04-20 | 上海北塔软件股份有限公司 | 一种将管理对象进行等级化运维的方法及系统 |
| US20160292895A1 (en) * | 2015-03-31 | 2016-10-06 | Rockwell Automation Technologies, Inc. | Layered map presentation for industrial data |
| US10528021B2 (en) | 2015-10-30 | 2020-01-07 | Rockwell Automation Technologies, Inc. | Automated creation of industrial dashboards and widgets |
| CN105488128A (zh) * | 2015-11-24 | 2016-04-13 | 北京中电普华信息技术有限公司 | 一种树状结构的展现方法及系统 |
| US10313281B2 (en) | 2016-01-04 | 2019-06-04 | Rockwell Automation Technologies, Inc. | Delivery of automated notifications by an industrial asset |
| US10318570B2 (en) | 2016-08-18 | 2019-06-11 | Rockwell Automation Technologies, Inc. | Multimodal search input for an industrial search platform |
| US10319128B2 (en) | 2016-09-26 | 2019-06-11 | Rockwell Automation Technologies, Inc. | Augmented reality presentation of an industrial environment |
| US10545492B2 (en) | 2016-09-26 | 2020-01-28 | Rockwell Automation Technologies, Inc. | Selective online and offline access to searchable industrial automation data |
| US10401839B2 (en) | 2016-09-26 | 2019-09-03 | Rockwell Automation Technologies, Inc. | Workflow tracking and identification using an industrial monitoring system |
| US10388075B2 (en) | 2016-11-08 | 2019-08-20 | Rockwell Automation Technologies, Inc. | Virtual reality and augmented reality for industrial automation |
| US10735691B2 (en) | 2016-11-08 | 2020-08-04 | Rockwell Automation Technologies, Inc. | Virtual reality and augmented reality for industrial automation |
| US10866631B2 (en) | 2016-11-09 | 2020-12-15 | Rockwell Automation Technologies, Inc. | Methods, systems, apparatuses, and techniques for employing augmented reality and virtual reality |
| JP2018097659A (ja) * | 2016-12-14 | 2018-06-21 | 株式会社デンソーテン | 出力処理装置および出力処理方法 |
| CN107391710B (zh) * | 2017-07-28 | 2020-04-14 | 深圳增强现实技术有限公司 | 机器操作监督系统及服务器 |
| US10445944B2 (en) | 2017-11-13 | 2019-10-15 | Rockwell Automation Technologies, Inc. | Augmented reality safety automation zone system and method |
| US10659484B2 (en) * | 2018-02-19 | 2020-05-19 | Cisco Technology, Inc. | Hierarchical activation of behavioral modules on a data plane for behavioral analytics |
| EP3804951B1 (de) | 2018-03-02 | 2022-11-09 | ENGEL AUSTRIA GmbH | Visualisierungsvorrichtung und beurteilungsvorrichtung für eine produktionsanlage, die mindestens eine zyklisch arbeitende formgebungsmaschine enthält |
| CN110097723A (zh) * | 2019-04-17 | 2019-08-06 | 南京砺剑光电技术研究院有限公司 | 基于计算机视觉的外破行为识别与告警方法 |
| US12450534B2 (en) * | 2020-07-20 | 2025-10-21 | Georgia Tech Research Corporation | Heterogeneous graph attention networks for scalable multi-robot scheduling |
Citations (3)
| Publication number | Priority date | Publication date | Assignee | Title |
|---|---|---|---|---|
| US5657460A (en) * | 1995-04-11 | 1997-08-12 | Data View, Inc. | System and method for storing and displaying data |
| EP0905634A2 (de) * | 1997-09-24 | 1999-03-31 | Canon Kabushiki Kaisha | Informationssystem und Verfahren zum Verwalten von Stückgut und Speichermedium |
| JP2004029897A (ja) * | 2002-06-21 | 2004-01-29 | Yokogawa Electric Corp | 管理システム |
Family Cites Families (10)
| Publication number | Priority date | Publication date | Assignee | Title |
|---|---|---|---|---|
| JPH06266727A (ja) * | 1990-10-24 | 1994-09-22 | Osaka Gas Co Ltd | 診断表示方法及び表示装置 |
| CN1086028A (zh) | 1992-09-28 | 1994-04-27 | 普拉塞尔技术有限公司 | 知识基础上的诊断报告系统和方法 |
| JPH10161733A (ja) | 1996-11-28 | 1998-06-19 | Mitsubishi Electric Corp | プラント監視制御装置 |
| JPH10320031A (ja) | 1997-05-21 | 1998-12-04 | Komatsu Koki Kk | 設備の点検案内表示方法 |
| US6108444A (en) * | 1997-09-29 | 2000-08-22 | Xerox Corporation | Method of grouping handwritten word segments in handwritten document images |
| JPH11149312A (ja) | 1997-11-19 | 1999-06-02 | Yokogawa Electric Corp | プラント監視装置及びプラント監視プログラムを記録した記録媒体 |
| JP3550060B2 (ja) | 1999-11-08 | 2004-08-04 | 株式会社日立製作所 | プラント運転支援システム |
| CN2429385Y (zh) | 2000-03-31 | 2001-05-09 | 汪义彬 | 汽车及摩托车的减速告警装置 |
| JP2002010302A (ja) | 2000-06-23 | 2002-01-11 | Furukawa Electric Co Ltd:The | 監視装置およびその方法 |
| KR100941558B1 (ko) * | 2001-05-29 | 2010-02-10 | 웨스팅하우스 일렉트릭 컴퍼니 엘엘씨 | 복합 플랜트의 안정성 모니터링 디스플레이 시스템 |
-
2005
- 2005-02-17 US US11/061,170 patent/US7295887B2/en not_active Expired - Lifetime
- 2005-02-18 EP EP06007034.9A patent/EP1679647B1/de not_active Expired - Lifetime
- 2005-02-18 EP EP05003603A patent/EP1566757A1/de not_active Ceased
- 2005-02-18 CN CNB200510007435XA patent/CN100383780C/zh not_active Expired - Fee Related
Patent Citations (3)
| Publication number | Priority date | Publication date | Assignee | Title |
|---|---|---|---|---|
| US5657460A (en) * | 1995-04-11 | 1997-08-12 | Data View, Inc. | System and method for storing and displaying data |
| EP0905634A2 (de) * | 1997-09-24 | 1999-03-31 | Canon Kabushiki Kaisha | Informationssystem und Verfahren zum Verwalten von Stückgut und Speichermedium |
| JP2004029897A (ja) * | 2002-06-21 | 2004-01-29 | Yokogawa Electric Corp | 管理システム |
Non-Patent Citations (1)
| Title |
|---|
| PATENT ABSTRACTS OF JAPAN vol. 2003, no. 12 5 December 2003 (2003-12-05) * |
Cited By (15)
| Publication number | Priority date | Publication date | Assignee | Title |
|---|---|---|---|---|
| EP2726948B1 (de) * | 2011-06-30 | 2020-06-24 | ABB Schweiz AG | Erzeugung von summenalarmen in der prozesssteuerung |
| US10013149B2 (en) | 2013-03-15 | 2018-07-03 | Fisher-Rosemount Systems, Inc. | Graphical process variable trend monitoring for a process control system |
| GB2532859B (en) * | 2013-03-15 | 2020-11-25 | Fisher Rosemount Systems Inc | Graphical process variable trend monitoring in a process control system using a navigation pane |
| WO2014151574A1 (en) * | 2013-03-15 | 2014-09-25 | Fisher-Rosemount Systems, Inc. | Navigating within a graphical depiction of a process control plant |
| US10180681B2 (en) | 2013-03-15 | 2019-01-15 | Fisher-Rosemount Systems, Inc. | Graphical process variable trend monitoring with zoom features for use in a process control system |
| US10803636B2 (en) | 2013-03-15 | 2020-10-13 | Fisher-Rosemount Systems, Inc. | Graphical process variable trend monitoring, predictive analytics and fault detection in a process control system |
| GB2532859A (en) * | 2013-03-15 | 2016-06-01 | Fisher Rosemount Systems Inc | Navigating within a graphical depiction of a process control plant |
| US10514668B2 (en) | 2013-03-15 | 2019-12-24 | Fisher-Rosemount Systems, Inc. | Graphical process variable trend monitoring in a process control system using a navigation pane |
| US9983575B2 (en) | 2013-04-09 | 2018-05-29 | Fisher-Rosemount Systems, Inc. | Systems and methods to graphically display process control system information |
| US10481595B2 (en) | 2015-10-05 | 2019-11-19 | Fisher-Rosemount Systems, Inc. | Method and apparatus for assessing the collective health of multiple process control systems |
| US10438144B2 (en) | 2015-10-05 | 2019-10-08 | Fisher-Rosemount Systems, Inc. | Method and apparatus for negating effects of continuous introduction of risk factors in determining the health of a process control system |
| GB2568783A (en) * | 2017-10-02 | 2019-05-29 | Fisher Rosemount Systems Inc | Method and apparatus for assessing the collective health of multiple process control systems |
| GB2568783B (en) * | 2017-10-02 | 2023-06-28 | Fisher Rosemount Systems Inc | Method and apparatus for assessing the collective health of multiple process control systems |
| CN114202197A (zh) * | 2021-12-09 | 2022-03-18 | 成都轨道交通集团有限公司 | 一种报警消息排序的方法与系统 |
| CN114202197B (zh) * | 2021-12-09 | 2024-06-04 | 成都轨道交通集团有限公司 | 一种报警消息排序的方法与系统 |
Also Published As
| Publication number | Publication date |
|---|---|
| EP1679647B1 (de) | 2016-05-18 |
| EP1679647A2 (de) | 2006-07-12 |
| CN100383780C (zh) | 2008-04-23 |
| CN1658106A (zh) | 2005-08-24 |
| EP1679647A3 (de) | 2006-09-06 |
| US7295887B2 (en) | 2007-11-13 |
| US20050188376A1 (en) | 2005-08-25 |
Similar Documents
| Publication | Publication Date | Title |
|---|---|---|
| US7295887B2 (en) | Machine management system and message server used for machine management | |
| JP4436046B2 (ja) | プロセス制御システムにおけるhartデバイス用機能強化型アラート | |
| JP4125137B2 (ja) | プロセス制御システムにおけるFieldbusデバイス用機能強化型アラート | |
| US7113085B2 (en) | Enhanced device alarms in a process control system | |
| US8321790B2 (en) | System management user interface providing user access to status information for process control system equipment including a search function | |
| EP1895376A2 (de) | Dynamisches Wartungsverwaltungssystem | |
| US6774786B1 (en) | Integrated alarm display in a process control network | |
| JP4856951B2 (ja) | プロセスプラントのためのデータ統合システム、及び方法 | |
| US7023440B1 (en) | Methods and apparatus for integrated display of process events and trend data | |
| US7103427B2 (en) | Delivery of process plant notifications | |
| US6202158B1 (en) | Detection method of illegal access to computer system | |
| JP4856163B2 (ja) | 建設機械の診断情報提供装置 | |
| US7729887B2 (en) | System management user interface providing user access to status information for process control system equipment including a status monitor | |
| CN113703400A (zh) | 一种支持远程协同的设备状态监测系统及其状态上报方法 | |
| US7729886B2 (en) | System management user interface providing user access to status information for process control system equipment | |
| JP2009510601A (ja) | 監視データおよび修正措置データを用いてプロセスプラントにおける監視および修正措置を行う方法および装置 | |
| JP2006512671A (ja) | プロセスプラントにおける統合ナビゲーションツリーのインポートおよび生成 | |
| RU2667032C2 (ru) | Информационно-поисковые система и способ | |
| TW201804326A (zh) | 運轉資訊分析裝置 | |
| CN109643483A (zh) | 用于呈现系统状态的可定制的图形视图以识别系统故障的系统和方法 | |
| JPH10124134A (ja) | 診断システム | |
| WO2007121212A2 (en) | System management human-machine interface | |
| JP2005352797A (ja) | 機器管理システム |
Legal Events
| Date | Code | Title | Description |
|---|---|---|---|
| PUAI | Public reference made under article 153(3) epc to a published international application that has entered the european phase |
Free format text: ORIGINAL CODE: 0009012 |
|
| AK | Designated contracting states |
Kind code of ref document: A1 Designated state(s): AT BE BG CH CY CZ DE DK EE ES FI FR GB GR HU IE IS IT LI LT LU MC NL PL PT RO SE SI SK TR |
|
| AX | Request for extension of the european patent |
Extension state: AL BA HR LV MK YU |
|
| 17P | Request for examination filed |
Effective date: 20050913 |
|
| AKX | Designation fees paid |
Designated state(s): DE NL |
|
| STAA | Information on the status of an ep patent application or granted ep patent |
Free format text: STATUS: THE APPLICATION HAS BEEN REFUSED |
|
| 18R | Application refused |
Effective date: 20070126 |
|
| R18R | Application refused (corrected) |
Effective date: 20061129 |