EP1669729A1 - Analyseur de spectre optique cohérent à diversité de phase - Google Patents
Analyseur de spectre optique cohérent à diversité de phase Download PDFInfo
- Publication number
- EP1669729A1 EP1669729A1 EP04029252A EP04029252A EP1669729A1 EP 1669729 A1 EP1669729 A1 EP 1669729A1 EP 04029252 A EP04029252 A EP 04029252A EP 04029252 A EP04029252 A EP 04029252A EP 1669729 A1 EP1669729 A1 EP 1669729A1
- Authority
- EP
- European Patent Office
- Prior art keywords
- signal
- optical
- phase
- input signal
- output signal
- Prior art date
- Legal status (The legal status is an assumption and is not a legal conclusion. Google has not performed a legal analysis and makes no representation as to the accuracy of the status listed.)
- Withdrawn
Links
- 230000003287 optical effect Effects 0.000 title claims abstract description 220
- 230000001427 coherent effect Effects 0.000 title claims abstract description 72
- 238000001228 spectrum Methods 0.000 title claims abstract description 62
- 238000012545 processing Methods 0.000 claims abstract description 28
- 238000000034 method Methods 0.000 claims abstract description 15
- 238000005259 measurement Methods 0.000 claims description 17
- 230000009466 transformation Effects 0.000 claims description 17
- 230000001131 transforming effect Effects 0.000 claims description 4
- 238000001914 filtration Methods 0.000 claims 8
- 238000010408 sweeping Methods 0.000 claims 2
- 230000008569 process Effects 0.000 abstract description 6
- 230000003595 spectral effect Effects 0.000 description 14
- 230000004044 response Effects 0.000 description 10
- 238000004891 communication Methods 0.000 description 9
- 238000010183 spectrum analysis Methods 0.000 description 8
- 238000010586 diagram Methods 0.000 description 7
- 230000008901 benefit Effects 0.000 description 3
- 230000035559 beat frequency Effects 0.000 description 2
- 238000001514 detection method Methods 0.000 description 2
- 230000015572 biosynthetic process Effects 0.000 description 1
- 238000004364 calculation method Methods 0.000 description 1
- 238000010276 construction Methods 0.000 description 1
- 230000001419 dependent effect Effects 0.000 description 1
- 238000013461 design Methods 0.000 description 1
- 230000009977 dual effect Effects 0.000 description 1
- 230000000694 effects Effects 0.000 description 1
- 230000008030 elimination Effects 0.000 description 1
- 238000003379 elimination reaction Methods 0.000 description 1
- 238000004134 energy conservation Methods 0.000 description 1
- 239000000835 fiber Substances 0.000 description 1
- 238000012986 modification Methods 0.000 description 1
- 230000004048 modification Effects 0.000 description 1
- 238000000926 separation method Methods 0.000 description 1
- 238000012546 transfer Methods 0.000 description 1
Images


Classifications
-
- G—PHYSICS
- G01—MEASURING; TESTING
- G01J—MEASUREMENT OF INTENSITY, VELOCITY, SPECTRAL CONTENT, POLARISATION, PHASE OR PULSE CHARACTERISTICS OF INFRARED, VISIBLE OR ULTRAVIOLET LIGHT; COLORIMETRY; RADIATION PYROMETRY
- G01J9/00—Measuring optical phase difference; Determining degree of coherence; Measuring optical wavelength
- G01J9/04—Measuring optical phase difference; Determining degree of coherence; Measuring optical wavelength by beating two waves of a same source but of different frequency and measuring the phase shift of the lower frequency obtained
Definitions
- Various embodiments in accordance with the invention relate to the field of optical spectral analysis.
- High-resolution optical spectrometers are used to observe spectral features of an unknown signal.
- Some high-resolution optical spectrometers implement a heterodyne architecture, based upon principles of coherent optical spectral analysis, to achieve very fine measurement resolution.
- current high-resolution spectrometers utilize a 2x2 optical coupler to combine the unknown signal with a local oscillator signal generated by a local oscillator that is intentionally set to oscillate at a known frequency or to sweep across a range of frequencies.
- the two outputs of the coupler are detected through a nonlinear detector, such as a photodiode, and the resulting electrical signals subtracted from one another to produce the desired heterodyne signal. From this, the spectral features of the unknown signal can be obtained.
- a nonlinear detector such as a photodiode
- One of the principle uses of a high-resolution optical spectrometer is to map out the spectral amplitude of the unknown signal as a function of wavelength.
- the local oscillator signal is swept across different wavelengths, while the heterodyne signal due to mixing with the unknown signal is acquired.
- the current receiver architecture which is based on a 2x2 optical coupler, is unable to measure the precise phase of the heterodyne signal. Since the phase of the heterodyne signal varies throughout the scan, as well as from scan to scan, amplitude uncertainty is introduced into the spectral measurement. This amplitude uncertainty is especially evident when intermediate frequency (IF) receivers with lowpass filters are employed.
- IF intermediate frequency
- H ( t ) V ( t ) cos ( 2 ⁇ ⁇ f t + ⁇ ( t ) ) as shown in Equation 1, where ⁇ f represents a frequency difference between the local oscillator and unknown signals, and ⁇ (t) represents the relative phase of the heterodyne beat signal.
- ⁇ f represents a frequency difference between the local oscillator and unknown signals
- ⁇ (t) represents the relative phase of the heterodyne beat signal.
- a single measurement of H(t) is unable to resolve V(t), the desired heterodyne amplitude, since there are two unknowns (V(t) and ⁇ (t)).
- H(t) The unambiguous nature of this phase computation can easily be understood by drawing H(t) as a vector in the complex plane.
- H(t) There are three main benefits to the vector representation of H(t), over the scalar. Firstly, it becomes completely clear whether the heterodyne frequency ⁇ f is positive or negative. Secondly, the relative phase ⁇ (t) can be determined without ambiguity. Finally, the phase measurement is now completely decoupled from variations in the heterodyne amplitude V(t) - and conversely, measurements of V(t) are insensitive to variations in the phase angle of the heterodyne signal.
- phase-diverse any system that generates or operates on a vector heterodyne signal, which in turn may be resolved into an orthogonal basis.
- phase-diverse With regard to coherent optical spectral analysis, the use of phase-diverse techniques translates directly to spectral image elimination and improved amplitude accuracy.
- phase-diversity has been addressed in the field of coherent optical communications.
- phase-diverse receivers in coherent communication systems has enabled a number of advances, such as eliminating crosstalk effects from adjacent data channels.
- phase-diverse receiver techniques have found some application in coherent communications, little has been carried over to the realm of optical spectral analysis. Since optical spectral analysis is focused on measurements in the frequency-domain, rather than time-domain, the receiver requirements are often very different from those in time-domain communications applications.
- a phase-diverse coherent optical spectrum analyzer isolates the In-phase and Quadrature (e.g., Real and Imaginary) heterodyne components of the output signals, such that the phase-diverse coherent optical spectrum analyzer achieves phase diversity of the heterodyne signal.
- a method for spectral analysis of an optical signal is provided. Two optical input signals are received, and at least three phase-diverse output signals are produced based on mixing of the input signals.
- phase-diverse heterodyne output signals From these phase-diverse heterodyne output signals the quadrature components of the output signals are isolated, wherein the quadrature components comprise two signals with a 90-degree relationship. In this way the phase-diverse coherent optical spectrum analyzer achieves phase diversity of the heterodyne mixing between the input signals.
- phase-diverse coherent optical spectrum analyzer By utilizing a 3x3 optical coupler, phase diversity is achieved, such that the accuracy and certainty of an amplitude reading is improved. Furthermore, the phase-diverse coherent optical spectrum analyzer provides for appropriate signal processing such that the positive and negative frequency images can be separated, improving spectral resolution. Following such signal processing, the phase-diverse coherent optical spectrum analyzer may include a measurement unit whose purpose is to calculate and display spectral amplitude, chirp, or other measurements as a function of wavelength. The use of phase diversity improves amplitude accuracy and resolution in the coherent optical spectrum analyzer, and may enable additional measurements such as chirp or frequency modulation.
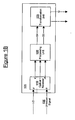
- FIG. 1A is a diagram illustrating a phase-diverse coherent optical spectrum analyzer 100 of an embodiment in accordance with the invention.
- Phase-diverse coherent optical spectrum analyzer 100 comprises local oscillator 102 for producing a local oscillator signal (LO) and providing the LO to an input A of receiver unit 105.
- local oscillator 102 is a laser source, such as a tunable external cavity laser diode.
- the LO is continuously swept.
- Optical signal path 104 is coupled to input B of receiver unit 105 for providing an input signal to input B.
- the input signal is unknown signal 106.
- unknown signal 106 is output from an optical network.
- the components of phase-diverse coherent optical spectrum analyzer 100 are fiber based.
- receiver unit 105 is illustrated of an embodiment in accordance with the invention.
- Receiver unit 105 comprises optical receiver 110, processing unit 120, and transformation unit 125.
- Optical receiver 110 comprises two inputs A and B and at least three outputs K, L and M.
- optical receiver 110 comprises a 3x3 optical coupler (e.g., optical coupler 210 of FIG. 2) for producing three output signals.
- Output signals K, L, and M are produced based on LO and unknown signal 106.
- embodiments in accordance with the invention may be implemented using an optical coupler other than a 3x3 optical coupler.
- a 4x4 optical coupler is used.
- a series of 2x2 optical couplers is used to produce at least three output signals.
- embodiments in accordance with the invention are described comprising a 3x3 optical coupler.
- optical couplers e.g., a 4x4 optical coupler.
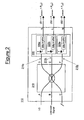
- FIG. 2 is a diagram illustrating an optical receiver 110 of an embodiment in accordance with the invention.
- Optical receiver 110 comprises 3x3 optical coupler 210 and detecting unit 220.
- 3x3 optical coupler 210 comprises two optical inputs A and B and three optical outputs D, E and F.
- input C is shown as unconnected and not receiving any signal. It should be appreciated that there are only two optical inputs, and that input C is not necessary.
- 3x3 optical coupler 210 receives a local oscillator signal LO at input A and an optical input signal from the signal path 104 at input B.
- the optical input signal is unknown signal 106.
- 3X3 optical coupler 210 is a fiber-optic coupler.
- 3x3 optical coupler 210 is a balanced optical coupler that has a splitting ratio of one-third to each output.
- 3x3 optical coupler 210 combines the optical signals received at inputs A and B, and outputs summed optical signals via optical outputs D, E and F. More particularly, a portion of each of LO and unknown signal 106 presented to the inputs A and B, respectively, of optical receiver 110 will be distributed to each of the optical outputs D, E and F. The portion of the signal distributed will be dependent upon the splitting ratio of the 3x3 optical coupler 210.
- optical coupler 210 provides an equal one-third of the combined unknown signal 106 and LO to optical outputs D, E and F.
- 3x3 optical coupler 210 may have a different split ratios such as, for example, but not limited to, a 25/25/50 split ratio.
- Detector unit 220 comprises detector 225a and amplifier 228a that are coupled to optical output D of 3x3 optical coupler 210 via optical lead 215a, detector 225b and amplifier 228b that are coupled to optical output E of 3x3 optical coupler 210 via optical lead 215b, and detector 225c and amplifier 228c that are coupled to optical output F of 3x3 optical coupler 210 via optical lead 215c.
- Detector 225a produces a signal proportional to the sum of the power in the LO (P LO ), the power in the unknown signal 106 (P unknown ), and an electrical mixing (or heterodyne beat) signal S1 in response to an optical signal at output D.
- Detector 225b produces a similar signal with electrical mixing signal S2 in response to an optical signal at output E
- detector 225c produces a similar signal with electrical mixing signal S3 in response to an optical signal at output F.
- detectors 225a-c respond to the intensity of an optical signal at outputs D, E and F, respectively.
- detectors 225a-c are photodiodes, which exhibit a square-law detection response; however it should be appreciated that any nonlinear detection device may be used. Photodiodes allow the LO signal and unknown signal to mix producing a heterodyne beat (e.g., S1, S2 and S3).
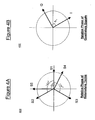
- FIG. 4A is a graph 400 illustrating the relative phase angles of the heterodyne beat frequencies of an embodiment in accordance with the invention. As shown in graph 400, S1, S2 and S3, the heterodyne terms produced upon mixing at detectors 225a-c, differ in phase by 120 degrees.
- phase-diverse coherent optical spectrum analyzer 100 also comprises processing unit 120 for discarding the noise portions (e.g., R unkown and P LO ) and outputting output signals S4 and S5.
- Processing unit 120 can also compensate for any imbalances or noise in the response/transfer characteristics of K, L and M. It should be appreciated that in certain situation, the noise portions are small enough so that processing unit 120 is not required to account for the noise portion, and outputs output signals S4 and S5 as any two of K, L and M.
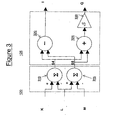
- Transformation unit 125 transforms S4 and S5 into two quadrature signals that differ in phase by 90 degrees with respect to each other.
- FIG. 3 is a diagram illustrating a processing unit 120 and a transformation unit 125 of an embodiment in accordance with the invention.
- Processing unit 120 comprises summing circuits 310 and 315.
- noise subtraction is performed on K, L and M, where L is used as a common-mode channel. It should be appreciated that any of signals K, L and M can be used as a common-mode channel.
- the photocurrents detected at detectors 225a-c comprise power contributions from light intensity passing through optical receiver 110 as well as contributions from the mixing, or interference, of unknown signal 106 (unknown signal light) with LO (LO light).
- processing unit 120 is not required to perform noise subtraction.
- K ⁇ L S 4 ⁇ P L O P unknown cos ( 2 ⁇ ⁇ f t + ⁇ )
- P LO represents the power in the LO
- P unknown represents the power in the unknown signal 106
- ⁇ f represents the difference in frequencies between local oscillator frequency LO and unknown signal 106
- t represents the time
- ⁇ represents the relative phase between the LO and unknown frequencies.
- L ⁇ M S 5 ⁇ P L O P unknown cos ( 2 ⁇ ⁇ f t + ⁇ + 120 ° ) wherein P LO represents the power in the LO, P unknown represents the power in the unknown signal 106, ⁇ f represents the difference in frequencies between local oscillator frequency LO and unknown signal 106, t represents the time, and ⁇ represents the phase.
- processing unit 120 is implemented as electronic circuitry coupled to optical receiver 110.
- processing unit 120 is implemented as computer code resident within a computer readable medium for receiving inputs representing signals K, L and M and isolating the heterodyne signal by producing signals S4 and S5.
- processing unit 120 can be tailored to account for a non-ideal coupler and/or photodetectors. For example, if the loss of the 3x3 coupler is different in each path, processing unit 120 may include gain elements to balance the subtraction. Also, for example, if the photodetectors in detector unit 220 have different frequency responses, processing unit 120 may include filters to equalize the response of the channels before the subtraction is performed.
- Transformation unit 125 operates on the assumption that signals S1, S2 and S3 are derived from an ideal 3x3 coupler which has a 120 degree phase relation between the various outputs. This is a consequence of energy conservation within the coupler. It should be appreciated that transformation unit 125 can be tailored to account for a non-ideal coupler. For example, if the phase relation of the 3x3 coupler is not exactly 120 degrees, the root 3 can be altered slightly to account for the difference.
- quadrature signal Q 3 ( S 1 ⁇ S 3 )
- transformation unit 125 is implemented as electronic circuitry coupled to processing unit 120.
- transformation unit is implemented as computer code resident within a computer readable medium for transforming inputs representing signals S4 and S5 into quadrature values.
- transformation unit 125 may not be required in particular embodiments in accordance with the invention.
- the heterodyne terms vary from each other by multiples of 90 degrees.
- the functionality of transformation unit 125 is performed at processing unit 120.
- FIG. 4B is a graph 450 illustrating the relative phase of the quadrature signals I and Q of an embodiment in accordance with the invention.
- the quadrature signals produced from phase-diverse coherent optical spectrum analyzer 100 differ in phase by 90 degrees. Since I and Q are phase-diverse, the amplitude accuracy of phase-diverse coherent optical spectrum analyzer 100 is improved. Furthermore, appropriate signal processing allows for the separation of positive and negative frequency images, thereby improving spectral resolution.
- phase-diverse coherent optical spectrum analyzer 100 further comprises complex signal producion unit 140 for producing a complex signal comprising quadrature signals I and Q.
- Complex signal S by construction, has a determined amplitude and phase ⁇ . This amplitude is proportional to the unknown signal power (P unknown ) and allows its accurate measurement independently of the value of the phase ⁇ .
- complex signal S can be filtered with complex filter 150 to isolate negative and/or positive frequencies as needed.
- complex filter 150 is constructed according to some appropriately windowed complex impulse response based on e ⁇ i2 ⁇ ft , to isolate negative and/or positive frequencies, wherein f is the desired filter center frequency.
- I and Q have been bandpass filtered by receiver unit 105, the negative and positive images which result can be individually isolated with complex filter 150. This improves spectral resolution and may have other advantages such as allowing for chirp or frequency modulation (FM) measurements.
- FM frequency modulation
- phase-diverse receivers for use in coherent communications are concerned with the time domain response of a data channel, and are not directly concemed with the spectral domain of a signal.
- the wide-band operating requirements of phase-diverse receivers used in coherent communications are generally not applicable to narrow-band operation for use in spectral analysis.
- the performance requirements for a narrow-band receiver are different from the requirements for a wide-band communication system.
- FIG. 5 is a flowchart illustrating a process for analyzing an optical signal of an embodiment in accordance with the invention.
- process 500 is performed at a phase-diverse coherent optical spectrum analyzer (e.g., phase-diverse coherent optical spectrum analyzer 100 of FIG. 1A).
- phase-diverse coherent optical spectrum analyzer e.g., phase-diverse coherent optical spectrum analyzer 100 of FIG. 1A.
- a first optical input signal is received.
- the first optical input signal is a local oscillator signal LO (e.g., local oscillator signal LO of FIG. 1A).
- local oscillator signal LO is received from a laser source, such as a tunable external cavity laser diode.
- a second optical input signal is received.
- the second optical input signal is an unknown signal (e.g., unknown signal 106 of FIG. 1A).
- unknown signal 106 is an optical output signal from an optical network.
- At block 530 at least a first output signal, a second output signal, and a third output signal are produced based on the first optical input signal and the second optical input signal. It should be appreciated that any number of output signals can be produced depending on the characteristics of the optical coupler.
- the optical coupler is a 3x3 optical coupler.
- the optical coupler is a 4x4 optical coupler wherein the output signals differ in phase by multiples of ninety degrees.
- the heterodyne signals are isolated from the first output signal, the second output signal and the third output signal.
- the non-heterodyne signals are removed by subtracting the second output signal from the first output signal and subtracting the third output signal from the second output signal.
- the heterodyne signals are phase-diverse.
- two of the three outputs may be used to isolate the heterodyne signals.
- the heterodyne signals may be resolved on an orthogonal basis.
- the heterodyne signals are transformed into an orthogonal basis by constructing a first quadrature signal and a second quadrature signal.
- the first quadrature signal and second quadrature signal differ in phase by 90 degrees, such that phase diversity of the original heterodyne beat is resolved into an orthogonal basis by the phase-diverse coherent optical spectrum analyzer.
- step 550 may not be necessary in various embodiments in accordance with the invention.
- the optical coupler is a 4x4 optical coupler
- the heterodyne signals as determined at block 540 will vary in phase by 90 degrees, providing their orthogonal basis.
- the amplitude and phase of the heterodyne signal is determined based on the first quadrature signal and the second quadrature signal. It should be appreciated that block 560 is optional.
- the first quadrature signal and second quadrature signal are filtered with a complex filter to isolate negative and/or positive frequencies as needed (e.g., for bandpass architectures).
- complex filter 150 filters according to e ⁇ i2 ⁇ ft to isolate negative and/or positive frequencies.
- a phase-diverse coherent optical spectrum analyzer is provided.
- phase diversity is achieved, thereby improving the accuracy and certainty of an amplitude reading.
- the positive and negative frequency images can be separated by appropriate signal processing, improving spectral resolution.
- implementing a 3x3 optical coupler provides greater flexibility in optical receiver design.
Landscapes
- Physics & Mathematics (AREA)
- Spectroscopy & Molecular Physics (AREA)
- General Physics & Mathematics (AREA)
- Optical Communication System (AREA)
Priority Applications (1)
| Application Number | Priority Date | Filing Date | Title |
|---|---|---|---|
| EP04029252A EP1669729A1 (fr) | 2004-12-09 | 2004-12-09 | Analyseur de spectre optique cohérent à diversité de phase |
Applications Claiming Priority (1)
| Application Number | Priority Date | Filing Date | Title |
|---|---|---|---|
| EP04029252A EP1669729A1 (fr) | 2004-12-09 | 2004-12-09 | Analyseur de spectre optique cohérent à diversité de phase |
Publications (1)
| Publication Number | Publication Date |
|---|---|
| EP1669729A1 true EP1669729A1 (fr) | 2006-06-14 |
Family
ID=34927720
Family Applications (1)
| Application Number | Title | Priority Date | Filing Date |
|---|---|---|---|
| EP04029252A Withdrawn EP1669729A1 (fr) | 2004-12-09 | 2004-12-09 | Analyseur de spectre optique cohérent à diversité de phase |
Country Status (1)
| Country | Link |
|---|---|
| EP (1) | EP1669729A1 (fr) |
Cited By (2)
| Publication number | Priority date | Publication date | Assignee | Title |
|---|---|---|---|---|
| WO2007132030A1 (fr) * | 2006-05-17 | 2007-11-22 | Fibercom, S.L. | Procédé et dispositif d'analyse complexe de spectres optiques |
| DE102007058038A1 (de) * | 2007-11-30 | 2009-06-04 | Deutsche Telekom Ag | Hochauflösende Phasenmessung an einem optischen Signal |
Citations (5)
| Publication number | Priority date | Publication date | Assignee | Title |
|---|---|---|---|---|
| GB2197461A (en) * | 1986-10-24 | 1988-05-18 | Plessey Co Plc | Method and apparatus for spectral measurement |
| US5365185A (en) * | 1992-08-05 | 1994-11-15 | Technion Research & Development Foundation | Frequency controlled loop for demodulating OOK and PSK signals |
| US20030146743A1 (en) * | 2002-02-05 | 2003-08-07 | Derek Truesdale | Very fast swept spectrum analyzer |
| US20040114939A1 (en) * | 2002-12-11 | 2004-06-17 | Taylor Michael George | Coherent optical detection and signal processing method and system |
| EP1519171A1 (fr) * | 2003-09-25 | 2005-03-30 | Agilent Technologies, Inc. | Systèmes et procédés pour déterminer le contenu spectral d'un signal optique |
-
2004
- 2004-12-09 EP EP04029252A patent/EP1669729A1/fr not_active Withdrawn
Patent Citations (5)
| Publication number | Priority date | Publication date | Assignee | Title |
|---|---|---|---|---|
| GB2197461A (en) * | 1986-10-24 | 1988-05-18 | Plessey Co Plc | Method and apparatus for spectral measurement |
| US5365185A (en) * | 1992-08-05 | 1994-11-15 | Technion Research & Development Foundation | Frequency controlled loop for demodulating OOK and PSK signals |
| US20030146743A1 (en) * | 2002-02-05 | 2003-08-07 | Derek Truesdale | Very fast swept spectrum analyzer |
| US20040114939A1 (en) * | 2002-12-11 | 2004-06-17 | Taylor Michael George | Coherent optical detection and signal processing method and system |
| EP1519171A1 (fr) * | 2003-09-25 | 2005-03-30 | Agilent Technologies, Inc. | Systèmes et procédés pour déterminer le contenu spectral d'un signal optique |
Cited By (2)
| Publication number | Priority date | Publication date | Assignee | Title |
|---|---|---|---|---|
| WO2007132030A1 (fr) * | 2006-05-17 | 2007-11-22 | Fibercom, S.L. | Procédé et dispositif d'analyse complexe de spectres optiques |
| DE102007058038A1 (de) * | 2007-11-30 | 2009-06-04 | Deutsche Telekom Ag | Hochauflösende Phasenmessung an einem optischen Signal |
Similar Documents
| Publication | Publication Date | Title |
|---|---|---|
| CN113218518B (zh) | 基于集成光路的正弦-余弦光频率检测装置及其应用 | |
| US9923631B1 (en) | Optical signal processing characterization of microwave and electro-optic devices | |
| CN113376446B (zh) | 基于微波频率梳的里德堡原子微波电场传感器及探测方法 | |
| WO1987007014A2 (fr) | Detection spatiale considerablement amelioree de retrodiffusion optique appliquee a des detecteurs | |
| Flaminio et al. | Longitudinal control of an interferometer for the detection of gravitational waves | |
| CN119245829B (zh) | 一种被动的激光外差双平衡光谱探测方法及装置 | |
| EP1253730B1 (fr) | Procédé et système pour analyse spectrale optique et détection utilisant un filtre apparié | |
| US7466929B2 (en) | Method and system for superheterodyne detection of an optical input signal | |
| US7068374B2 (en) | Phase-diverse coherent optical spectrum analyzer | |
| US7388673B2 (en) | Heterodyne optical spectrum analyzer | |
| US7054012B2 (en) | Spectral phase measurement using phase-diverse coherent optical spectrum analyzer | |
| US7265849B2 (en) | Systems and methods for determining the spectral content of an optical signal | |
| EP1669729A1 (fr) | Analyseur de spectre optique cohérent à diversité de phase | |
| JP3496878B2 (ja) | 波長分散及び損失波長依存性測定装置 | |
| US20140111804A1 (en) | Heterodyne Optical Spectrum Analyzer | |
| CN117664531A (zh) | 基于单参考信号的激光信号特性测量方法及装置 | |
| CN119906479A (zh) | 信号接收装置、发射装置及光纤传感装置 | |
| US6646746B1 (en) | Method and system for optical heterodyne detection of an optical signal | |
| RU2284017C2 (ru) | Способ измерения угла поляризации оптического излучения | |
| RU2340879C1 (ru) | Устройство измерения параметров поляризации оптического излучения | |
| EP4239280B1 (fr) | Atténuation de bruit de phase dans des chaînes de photodétection avec une tonalité pilote optique | |
| JP7380382B2 (ja) | 測距計 | |
| CN118392326B (zh) | 一种单频激光的噪声测量装置及测量方法 | |
| Michel | How to detect complex modulated optical signals | |
| Lapointe-Leclerc et al. | Local Oscillator Phase and Frequency Monitoring for Coherent Optical Spectrum Analyzer on a Chip |
Legal Events
| Date | Code | Title | Description |
|---|---|---|---|
| PUAI | Public reference made under article 153(3) epc to a published international application that has entered the european phase |
Free format text: ORIGINAL CODE: 0009012 |
|
| AK | Designated contracting states |
Kind code of ref document: A1 Designated state(s): AT BE BG CH CY CZ DE DK EE ES FI FR GB GR HU IE IS IT LI LT LU MC NL PL PT RO SE SI SK TR |
|
| AX | Request for extension of the european patent |
Extension state: AL BA HR LV MK YU |
|
| STAA | Information on the status of an ep patent application or granted ep patent |
Free format text: STATUS: THE APPLICATION HAS BEEN WITHDRAWN |
|
| 18W | Application withdrawn |
Effective date: 20061114 |