EP1914238A2 - Procédés de mesure de caractéristiques physiques d'acides nucléiques par imagerie de microscopique - Google Patents
Procédés de mesure de caractéristiques physiques d'acides nucléiques par imagerie de microscopique Download PDFInfo
- Publication number
- EP1914238A2 EP1914238A2 EP07023766A EP07023766A EP1914238A2 EP 1914238 A2 EP1914238 A2 EP 1914238A2 EP 07023766 A EP07023766 A EP 07023766A EP 07023766 A EP07023766 A EP 07023766A EP 1914238 A2 EP1914238 A2 EP 1914238A2
- Authority
- EP
- European Patent Office
- Prior art keywords
- nucleic acid
- acid molecule
- molecules
- elongated
- molecule
- Prior art date
- Legal status (The legal status is an assumption and is not a legal conclusion. Google has not performed a legal analysis and makes no representation as to the accuracy of the status listed.)
- Ceased
Links
- 238000000034 method Methods 0.000 title claims abstract description 418
- 150000007523 nucleic acids Chemical class 0.000 title claims abstract description 344
- 102000039446 nucleic acids Human genes 0.000 title claims abstract description 341
- 108020004707 nucleic acids Proteins 0.000 title claims abstract description 341
- 238000003384 imaging method Methods 0.000 title claims description 81
- 238000009396 hybridization Methods 0.000 claims abstract description 62
- 239000007787 solid Substances 0.000 claims abstract description 59
- 239000011521 glass Substances 0.000 claims abstract description 53
- 238000006243 chemical reaction Methods 0.000 claims abstract description 21
- 238000000151 deposition Methods 0.000 claims abstract description 17
- 230000002255 enzymatic effect Effects 0.000 claims abstract description 8
- 230000009881 electrostatic interaction Effects 0.000 claims abstract description 6
- 239000000126 substance Substances 0.000 claims abstract description 6
- 108020004414 DNA Proteins 0.000 claims description 261
- 230000003287 optical effect Effects 0.000 claims description 152
- 238000013507 mapping Methods 0.000 claims description 141
- 239000000523 sample Substances 0.000 claims description 81
- 108091008146 restriction endonucleases Proteins 0.000 claims description 67
- 102000004190 Enzymes Human genes 0.000 claims description 44
- 108090000790 Enzymes Proteins 0.000 claims description 44
- 238000012163 sequencing technique Methods 0.000 claims description 42
- WYTZZXDRDKSJID-UHFFFAOYSA-N (3-aminopropyl)triethoxysilane Chemical compound CCO[Si](OCC)(OCC)CCCN WYTZZXDRDKSJID-UHFFFAOYSA-N 0.000 claims description 35
- 239000011543 agarose gel Substances 0.000 claims description 26
- 230000000694 effects Effects 0.000 claims description 25
- PEDCQBHIVMGVHV-UHFFFAOYSA-N Glycerine Chemical compound OCC(O)CO PEDCQBHIVMGVHV-UHFFFAOYSA-N 0.000 claims description 24
- 102000053602 DNA Human genes 0.000 claims description 18
- 239000002773 nucleotide Substances 0.000 claims description 13
- 125000003729 nucleotide group Chemical group 0.000 claims description 13
- 230000008859 change Effects 0.000 claims description 11
- 238000006911 enzymatic reaction Methods 0.000 claims description 10
- 108091034117 Oligonucleotide Proteins 0.000 claims description 8
- -1 or a polymerase Proteins 0.000 claims description 7
- KDXKERNSBIXSRK-RXMQYKEDSA-N D-lysine Chemical compound NCCCC[C@@H](N)C(O)=O KDXKERNSBIXSRK-RXMQYKEDSA-N 0.000 claims description 5
- 108060002716 Exonuclease Proteins 0.000 claims description 3
- 108090000364 Ligases Proteins 0.000 claims description 3
- 102000003960 Ligases Human genes 0.000 claims description 3
- 108060004795 Methyltransferase Proteins 0.000 claims description 3
- 102000013165 exonuclease Human genes 0.000 claims description 3
- 108091027568 Single-stranded nucleotide Proteins 0.000 claims 4
- 239000007795 chemical reaction product Substances 0.000 claims 2
- 230000006835 compression Effects 0.000 claims 1
- 238000007906 compression Methods 0.000 claims 1
- 230000000379 polymerizing effect Effects 0.000 claims 1
- 238000007790 scraping Methods 0.000 claims 1
- 239000012634 fragment Substances 0.000 description 224
- 238000005259 measurement Methods 0.000 description 201
- 239000000499 gel Substances 0.000 description 148
- 238000004458 analytical method Methods 0.000 description 81
- 238000004513 sizing Methods 0.000 description 76
- 229920000936 Agarose Polymers 0.000 description 73
- 230000029087 digestion Effects 0.000 description 72
- 210000000349 chromosome Anatomy 0.000 description 64
- 239000000243 solution Substances 0.000 description 55
- 238000013459 approach Methods 0.000 description 52
- 239000000203 mixture Substances 0.000 description 48
- 238000003776 cleavage reaction Methods 0.000 description 45
- 230000007017 scission Effects 0.000 description 45
- 108010039918 Polylysine Proteins 0.000 description 43
- 229920000656 polylysine Polymers 0.000 description 43
- 238000001962 electrophoresis Methods 0.000 description 42
- 238000012545 processing Methods 0.000 description 40
- 230000005684 electric field Effects 0.000 description 35
- 240000004808 Saccharomyces cerevisiae Species 0.000 description 32
- 235000014680 Saccharomyces cerevisiae Nutrition 0.000 description 32
- DGVVWUTYPXICAM-UHFFFAOYSA-N β‐Mercaptoethanol Chemical compound OCCS DGVVWUTYPXICAM-UHFFFAOYSA-N 0.000 description 30
- 230000008569 process Effects 0.000 description 29
- 210000001106 artificial yeast chromosome Anatomy 0.000 description 27
- 239000000872 buffer Substances 0.000 description 26
- 238000005286 illumination Methods 0.000 description 26
- PFNFFQXMRSDOHW-UHFFFAOYSA-N spermine Chemical group NCCCNCCCCNCCCN PFNFFQXMRSDOHW-UHFFFAOYSA-N 0.000 description 24
- 239000011159 matrix material Substances 0.000 description 23
- 239000011324 bead Substances 0.000 description 22
- 239000013611 chromosomal DNA Substances 0.000 description 21
- 238000001212 derivatisation Methods 0.000 description 21
- 229920000642 polymer Polymers 0.000 description 21
- 230000003068 static effect Effects 0.000 description 21
- 102000001218 Rec A Recombinases Human genes 0.000 description 20
- 108010055016 Rec A Recombinases Proteins 0.000 description 20
- 238000009792 diffusion process Methods 0.000 description 20
- 238000009826 distribution Methods 0.000 description 20
- 238000012935 Averaging Methods 0.000 description 19
- JLVVSXFLKOJNIY-UHFFFAOYSA-N Magnesium ion Chemical compound [Mg+2] JLVVSXFLKOJNIY-UHFFFAOYSA-N 0.000 description 19
- 229910001425 magnesium ion Inorganic materials 0.000 description 19
- 238000000386 microscopy Methods 0.000 description 19
- 238000010276 construction Methods 0.000 description 17
- GTSMOYLSFUBTMV-UHFFFAOYSA-N ethidium homodimer Chemical compound [H+].[H+].[Cl-].[Cl-].[Cl-].[Cl-].C12=CC(N)=CC=C2C2=CC=C(N)C=C2C(C)=[N+]1CCCNCCNCCC[N+](C1=CC(N)=CC=C1C1=CC=C(N)C=C11)=C1C1=CC=CC=C1 GTSMOYLSFUBTMV-UHFFFAOYSA-N 0.000 description 17
- 238000000799 fluorescence microscopy Methods 0.000 description 17
- 230000006870 function Effects 0.000 description 17
- 238000001879 gelation Methods 0.000 description 17
- GRRMZXFOOGQMFA-UHFFFAOYSA-J YoYo-1 Chemical compound [I-].[I-].[I-].[I-].C12=CC=CC=C2C(C=C2N(C3=CC=CC=C3O2)C)=CC=[N+]1CCC[N+](C)(C)CCC[N+](C)(C)CCC[N+](C1=CC=CC=C11)=CC=C1C=C1N(C)C2=CC=CC=C2O1 GRRMZXFOOGQMFA-UHFFFAOYSA-J 0.000 description 16
- 238000005520 cutting process Methods 0.000 description 16
- 239000012530 fluid Substances 0.000 description 16
- 238000001502 gel electrophoresis Methods 0.000 description 16
- 238000003906 pulsed field gel electrophoresis Methods 0.000 description 16
- 210000004027 cell Anatomy 0.000 description 15
- 238000001514 detection method Methods 0.000 description 15
- 238000002474 experimental method Methods 0.000 description 15
- TWRXJAOTZQYOKJ-UHFFFAOYSA-L Magnesium chloride Chemical compound [Mg+2].[Cl-].[Cl-] TWRXJAOTZQYOKJ-UHFFFAOYSA-L 0.000 description 14
- 150000001875 compounds Chemical class 0.000 description 14
- BFMYDTVEBKDAKJ-UHFFFAOYSA-L disodium;(2',7'-dibromo-3',6'-dioxido-3-oxospiro[2-benzofuran-1,9'-xanthene]-4'-yl)mercury;hydrate Chemical compound O.[Na+].[Na+].O1C(=O)C2=CC=CC=C2C21C1=CC(Br)=C([O-])C([Hg])=C1OC1=C2C=C(Br)C([O-])=C1 BFMYDTVEBKDAKJ-UHFFFAOYSA-L 0.000 description 14
- KCXVZYZYPLLWCC-UHFFFAOYSA-N EDTA Chemical compound OC(=O)CN(CC(O)=O)CCN(CC(O)=O)CC(O)=O KCXVZYZYPLLWCC-UHFFFAOYSA-N 0.000 description 13
- 230000005284 excitation Effects 0.000 description 13
- 108090000623 proteins and genes Proteins 0.000 description 13
- FAPWRFPIFSIZLT-UHFFFAOYSA-M Sodium chloride Chemical compound [Na+].[Cl-] FAPWRFPIFSIZLT-UHFFFAOYSA-M 0.000 description 12
- 238000004364 calculation method Methods 0.000 description 12
- 230000000875 corresponding effect Effects 0.000 description 12
- 238000010586 diagram Methods 0.000 description 12
- 230000001976 improved effect Effects 0.000 description 12
- 238000000691 measurement method Methods 0.000 description 12
- 238000002844 melting Methods 0.000 description 12
- 230000008018 melting Effects 0.000 description 12
- 229940063675 spermine Drugs 0.000 description 12
- 239000013598 vector Substances 0.000 description 12
- 230000027455 binding Effects 0.000 description 11
- 239000003795 chemical substances by application Substances 0.000 description 11
- 238000004132 cross linking Methods 0.000 description 11
- 230000008021 deposition Effects 0.000 description 11
- 238000002073 fluorescence micrograph Methods 0.000 description 11
- 239000000463 material Substances 0.000 description 11
- 238000002360 preparation method Methods 0.000 description 11
- 238000012546 transfer Methods 0.000 description 11
- LENZDBCJOHFCAS-UHFFFAOYSA-N tris Chemical compound OCC(N)(CO)CO LENZDBCJOHFCAS-UHFFFAOYSA-N 0.000 description 11
- XLYOFNOQVPJJNP-UHFFFAOYSA-N water Substances O XLYOFNOQVPJJNP-UHFFFAOYSA-N 0.000 description 11
- 238000003705 background correction Methods 0.000 description 10
- 230000008901 benefit Effects 0.000 description 10
- ZMMJGEGLRURXTF-UHFFFAOYSA-N ethidium bromide Chemical group [Br-].C12=CC(N)=CC=C2C2=CC=C(N)C=C2[N+](CC)=C1C1=CC=CC=C1 ZMMJGEGLRURXTF-UHFFFAOYSA-N 0.000 description 10
- 229960005542 ethidium bromide Drugs 0.000 description 10
- 241001515965 unidentified phage Species 0.000 description 10
- 108700028369 Alleles Proteins 0.000 description 9
- 230000015572 biosynthetic process Effects 0.000 description 9
- 238000004422 calculation algorithm Methods 0.000 description 9
- 150000001768 cations Chemical class 0.000 description 9
- 239000006059 cover glass Substances 0.000 description 9
- 238000011534 incubation Methods 0.000 description 9
- 102000004169 proteins and genes Human genes 0.000 description 9
- 238000010008 shearing Methods 0.000 description 9
- 238000005516 engineering process Methods 0.000 description 8
- 230000036961 partial effect Effects 0.000 description 8
- 238000010791 quenching Methods 0.000 description 8
- 238000000926 separation method Methods 0.000 description 8
- 238000012800 visualization Methods 0.000 description 8
- 239000003109 Disodium ethylene diamine tetraacetate Substances 0.000 description 7
- ZGTMUACCHSMWAC-UHFFFAOYSA-L EDTA disodium salt (anhydrous) Chemical compound [Na+].[Na+].OC(=O)CN(CC([O-])=O)CCN(CC(O)=O)CC([O-])=O ZGTMUACCHSMWAC-UHFFFAOYSA-L 0.000 description 7
- 229920004890 Triton X-100 Polymers 0.000 description 7
- 239000013504 Triton X-100 Substances 0.000 description 7
- JLCPHMBAVCMARE-UHFFFAOYSA-N [3-[[3-[[3-[[3-[[3-[[3-[[3-[[3-[[3-[[3-[[3-[[5-(2-amino-6-oxo-1H-purin-9-yl)-3-[[3-[[3-[[3-[[3-[[3-[[5-(2-amino-6-oxo-1H-purin-9-yl)-3-[[5-(2-amino-6-oxo-1H-purin-9-yl)-3-hydroxyoxolan-2-yl]methoxy-hydroxyphosphoryl]oxyoxolan-2-yl]methoxy-hydroxyphosphoryl]oxy-5-(5-methyl-2,4-dioxopyrimidin-1-yl)oxolan-2-yl]methoxy-hydroxyphosphoryl]oxy-5-(6-aminopurin-9-yl)oxolan-2-yl]methoxy-hydroxyphosphoryl]oxy-5-(6-aminopurin-9-yl)oxolan-2-yl]methoxy-hydroxyphosphoryl]oxy-5-(6-aminopurin-9-yl)oxolan-2-yl]methoxy-hydroxyphosphoryl]oxy-5-(6-aminopurin-9-yl)oxolan-2-yl]methoxy-hydroxyphosphoryl]oxyoxolan-2-yl]methoxy-hydroxyphosphoryl]oxy-5-(5-methyl-2,4-dioxopyrimidin-1-yl)oxolan-2-yl]methoxy-hydroxyphosphoryl]oxy-5-(4-amino-2-oxopyrimidin-1-yl)oxolan-2-yl]methoxy-hydroxyphosphoryl]oxy-5-(5-methyl-2,4-dioxopyrimidin-1-yl)oxolan-2-yl]methoxy-hydroxyphosphoryl]oxy-5-(5-methyl-2,4-dioxopyrimidin-1-yl)oxolan-2-yl]methoxy-hydroxyphosphoryl]oxy-5-(6-aminopurin-9-yl)oxolan-2-yl]methoxy-hydroxyphosphoryl]oxy-5-(6-aminopurin-9-yl)oxolan-2-yl]methoxy-hydroxyphosphoryl]oxy-5-(4-amino-2-oxopyrimidin-1-yl)oxolan-2-yl]methoxy-hydroxyphosphoryl]oxy-5-(4-amino-2-oxopyrimidin-1-yl)oxolan-2-yl]methoxy-hydroxyphosphoryl]oxy-5-(4-amino-2-oxopyrimidin-1-yl)oxolan-2-yl]methoxy-hydroxyphosphoryl]oxy-5-(6-aminopurin-9-yl)oxolan-2-yl]methoxy-hydroxyphosphoryl]oxy-5-(4-amino-2-oxopyrimidin-1-yl)oxolan-2-yl]methyl [5-(6-aminopurin-9-yl)-2-(hydroxymethyl)oxolan-3-yl] hydrogen phosphate Polymers Cc1cn(C2CC(OP(O)(=O)OCC3OC(CC3OP(O)(=O)OCC3OC(CC3O)n3cnc4c3nc(N)[nH]c4=O)n3cnc4c3nc(N)[nH]c4=O)C(COP(O)(=O)OC3CC(OC3COP(O)(=O)OC3CC(OC3COP(O)(=O)OC3CC(OC3COP(O)(=O)OC3CC(OC3COP(O)(=O)OC3CC(OC3COP(O)(=O)OC3CC(OC3COP(O)(=O)OC3CC(OC3COP(O)(=O)OC3CC(OC3COP(O)(=O)OC3CC(OC3COP(O)(=O)OC3CC(OC3COP(O)(=O)OC3CC(OC3COP(O)(=O)OC3CC(OC3COP(O)(=O)OC3CC(OC3COP(O)(=O)OC3CC(OC3COP(O)(=O)OC3CC(OC3COP(O)(=O)OC3CC(OC3COP(O)(=O)OC3CC(OC3CO)n3cnc4c(N)ncnc34)n3ccc(N)nc3=O)n3cnc4c(N)ncnc34)n3ccc(N)nc3=O)n3ccc(N)nc3=O)n3ccc(N)nc3=O)n3cnc4c(N)ncnc34)n3cnc4c(N)ncnc34)n3cc(C)c(=O)[nH]c3=O)n3cc(C)c(=O)[nH]c3=O)n3ccc(N)nc3=O)n3cc(C)c(=O)[nH]c3=O)n3cnc4c3nc(N)[nH]c4=O)n3cnc4c(N)ncnc34)n3cnc4c(N)ncnc34)n3cnc4c(N)ncnc34)n3cnc4c(N)ncnc34)O2)c(=O)[nH]c1=O JLCPHMBAVCMARE-UHFFFAOYSA-N 0.000 description 7
- 230000004071 biological effect Effects 0.000 description 7
- KGBXLFKZBHKPEV-UHFFFAOYSA-N boric acid Chemical compound OB(O)O KGBXLFKZBHKPEV-UHFFFAOYSA-N 0.000 description 7
- 239000004327 boric acid Substances 0.000 description 7
- 238000009833 condensation Methods 0.000 description 7
- 230000005494 condensation Effects 0.000 description 7
- 235000019301 disodium ethylene diamine tetraacetate Nutrition 0.000 description 7
- 238000001035 drying Methods 0.000 description 7
- 238000001704 evaporation Methods 0.000 description 7
- 230000008020 evaporation Effects 0.000 description 7
- 238000002372 labelling Methods 0.000 description 7
- 229910001629 magnesium chloride Inorganic materials 0.000 description 7
- 239000002480 mineral oil Substances 0.000 description 7
- 235000010446 mineral oil Nutrition 0.000 description 7
- 239000003068 molecular probe Substances 0.000 description 7
- 238000006116 polymerization reaction Methods 0.000 description 7
- 230000005855 radiation Effects 0.000 description 7
- 230000002829 reductive effect Effects 0.000 description 7
- 150000003839 salts Chemical class 0.000 description 7
- 102000002260 Alkaline Phosphatase Human genes 0.000 description 6
- 108020004774 Alkaline Phosphatase Proteins 0.000 description 6
- 108091003079 Bovine Serum Albumin Proteins 0.000 description 6
- 108091028043 Nucleic acid sequence Proteins 0.000 description 6
- 239000007983 Tris buffer Substances 0.000 description 6
- 230000008827 biological function Effects 0.000 description 6
- 229940098773 bovine serum albumin Drugs 0.000 description 6
- 239000003153 chemical reaction reagent Substances 0.000 description 6
- 238000010367 cloning Methods 0.000 description 6
- 230000000295 complement effect Effects 0.000 description 6
- 230000003247 decreasing effect Effects 0.000 description 6
- 239000000975 dye Substances 0.000 description 6
- 238000000605 extraction Methods 0.000 description 6
- 238000007654 immersion Methods 0.000 description 6
- 230000000670 limiting effect Effects 0.000 description 6
- 230000033001 locomotion Effects 0.000 description 6
- 229920002521 macromolecule Polymers 0.000 description 6
- 230000011987 methylation Effects 0.000 description 6
- 238000007069 methylation reaction Methods 0.000 description 6
- 230000000877 morphologic effect Effects 0.000 description 6
- 230000007935 neutral effect Effects 0.000 description 6
- 239000011148 porous material Substances 0.000 description 6
- 230000002028 premature Effects 0.000 description 6
- 230000000171 quenching effect Effects 0.000 description 6
- 230000035945 sensitivity Effects 0.000 description 6
- 239000011780 sodium chloride Substances 0.000 description 6
- 238000010561 standard procedure Methods 0.000 description 6
- 238000003860 storage Methods 0.000 description 6
- 238000012360 testing method Methods 0.000 description 6
- YTMLLNPQZXFMLZ-UHFFFAOYSA-N 2-(4-aminophenyl)-1H-indol-6-amine dihydrochloride Chemical compound Cl.Cl.C1=CC(N)=CC=C1C1=CC2=CC=C(N)C=C2N1 YTMLLNPQZXFMLZ-UHFFFAOYSA-N 0.000 description 5
- 238000003556 assay Methods 0.000 description 5
- 238000005266 casting Methods 0.000 description 5
- 230000001276 controlling effect Effects 0.000 description 5
- 230000007423 decrease Effects 0.000 description 5
- 230000002939 deleterious effect Effects 0.000 description 5
- 230000001419 dependent effect Effects 0.000 description 5
- 108010030074 endodeoxyribonuclease MluI Proteins 0.000 description 5
- 239000007850 fluorescent dye Substances 0.000 description 5
- 150000002605 large molecules Chemical class 0.000 description 5
- 230000007246 mechanism Effects 0.000 description 5
- 239000012528 membrane Substances 0.000 description 5
- 239000003921 oil Substances 0.000 description 5
- 238000005457 optimization Methods 0.000 description 5
- 238000006303 photolysis reaction Methods 0.000 description 5
- 230000015843 photosynthesis, light reaction Effects 0.000 description 5
- 125000002924 primary amino group Chemical group [H]N([H])* 0.000 description 5
- 230000002040 relaxant effect Effects 0.000 description 5
- 238000010186 staining Methods 0.000 description 5
- 230000000007 visual effect Effects 0.000 description 5
- YBJHBAHKTGYVGT-ZKWXMUAHSA-N (+)-Biotin Chemical compound N1C(=O)N[C@@H]2[C@H](CCCCC(=O)O)SC[C@@H]21 YBJHBAHKTGYVGT-ZKWXMUAHSA-N 0.000 description 4
- 108010042407 Endonucleases Proteins 0.000 description 4
- 102000004533 Endonucleases Human genes 0.000 description 4
- LFQSCWFLJHTTHZ-UHFFFAOYSA-N Ethanol Chemical compound CCO LFQSCWFLJHTTHZ-UHFFFAOYSA-N 0.000 description 4
- QTANTQQOYSUMLC-UHFFFAOYSA-O Ethidium cation Chemical compound C12=CC(N)=CC=C2C2=CC=C(N)C=C2[N+](CC)=C1C1=CC=CC=C1 QTANTQQOYSUMLC-UHFFFAOYSA-O 0.000 description 4
- VEXZGXHMUGYJMC-UHFFFAOYSA-N Hydrochloric acid Chemical compound Cl VEXZGXHMUGYJMC-UHFFFAOYSA-N 0.000 description 4
- 241001354471 Pseudobahia Species 0.000 description 4
- 208000030555 Pygmy Diseases 0.000 description 4
- 108010090804 Streptavidin Proteins 0.000 description 4
- 239000004809 Teflon Substances 0.000 description 4
- 229920006362 Teflon® Polymers 0.000 description 4
- 239000007984 Tris EDTA buffer Substances 0.000 description 4
- 230000002238 attenuated effect Effects 0.000 description 4
- 238000012512 characterization method Methods 0.000 description 4
- 238000004925 denaturation Methods 0.000 description 4
- 230000036425 denaturation Effects 0.000 description 4
- 238000010790 dilution Methods 0.000 description 4
- 239000012895 dilution Substances 0.000 description 4
- 238000011331 genomic analysis Methods 0.000 description 4
- 238000010191 image analysis Methods 0.000 description 4
- 230000006872 improvement Effects 0.000 description 4
- 230000010354 integration Effects 0.000 description 4
- 230000003993 interaction Effects 0.000 description 4
- 230000001404 mediated effect Effects 0.000 description 4
- 230000004048 modification Effects 0.000 description 4
- 238000012986 modification Methods 0.000 description 4
- 230000003094 perturbing effect Effects 0.000 description 4
- 230000008832 photodamage Effects 0.000 description 4
- 238000003672 processing method Methods 0.000 description 4
- 238000001853 pulsed-field electrophoresis Methods 0.000 description 4
- 230000008707 rearrangement Effects 0.000 description 4
- 238000011160 research Methods 0.000 description 4
- 230000002441 reversible effect Effects 0.000 description 4
- 230000011218 segmentation Effects 0.000 description 4
- 238000007619 statistical method Methods 0.000 description 4
- 230000009897 systematic effect Effects 0.000 description 4
- IAZDPXIOMUYVGZ-UHFFFAOYSA-N Dimethylsulphoxide Chemical compound CS(C)=O IAZDPXIOMUYVGZ-UHFFFAOYSA-N 0.000 description 3
- CZMRCDWAGMRECN-UGDNZRGBSA-N Sucrose Chemical compound O[C@H]1[C@H](O)[C@@H](CO)O[C@@]1(CO)O[C@@H]1[C@H](O)[C@@H](O)[C@H](O)[C@@H](CO)O1 CZMRCDWAGMRECN-UGDNZRGBSA-N 0.000 description 3
- 229930006000 Sucrose Natural products 0.000 description 3
- 239000007864 aqueous solution Substances 0.000 description 3
- 239000002738 chelating agent Substances 0.000 description 3
- 230000009918 complex formation Effects 0.000 description 3
- 238000012937 correction Methods 0.000 description 3
- 238000013480 data collection Methods 0.000 description 3
- 238000013461 design Methods 0.000 description 3
- 238000001914 filtration Methods 0.000 description 3
- 239000007789 gas Substances 0.000 description 3
- 230000002068 genetic effect Effects 0.000 description 3
- 239000000710 homodimer Substances 0.000 description 3
- 230000002209 hydrophobic effect Effects 0.000 description 3
- 238000007901 in situ hybridization Methods 0.000 description 3
- 238000007689 inspection Methods 0.000 description 3
- 230000014759 maintenance of location Effects 0.000 description 3
- 238000004519 manufacturing process Methods 0.000 description 3
- 239000002245 particle Substances 0.000 description 3
- 239000011541 reaction mixture Substances 0.000 description 3
- 230000010076 replication Effects 0.000 description 3
- 230000000717 retained effect Effects 0.000 description 3
- 239000002904 solvent Substances 0.000 description 3
- 230000003595 spectral effect Effects 0.000 description 3
- 238000004611 spectroscopical analysis Methods 0.000 description 3
- 230000007480 spreading Effects 0.000 description 3
- 238000003892 spreading Methods 0.000 description 3
- 239000005720 sucrose Substances 0.000 description 3
- 210000001519 tissue Anatomy 0.000 description 3
- 239000012498 ultrapure water Substances 0.000 description 3
- FKXGYESXGMKAKC-UHFFFAOYSA-N 2-[[2-[bis(carboxymethyl)amino]-2-(4,5-dimethoxy-2-nitrophenyl)ethyl]-(carboxymethyl)amino]acetic acid Chemical compound COC1=CC(C(CN(CC(O)=O)CC(O)=O)N(CC(O)=O)CC(O)=O)=C([N+]([O-])=O)C=C1OC FKXGYESXGMKAKC-UHFFFAOYSA-N 0.000 description 2
- 241000238876 Acari Species 0.000 description 2
- HRPVXLWXLXDGHG-UHFFFAOYSA-N Acrylamide Chemical compound NC(=O)C=C HRPVXLWXLXDGHG-UHFFFAOYSA-N 0.000 description 2
- 230000005653 Brownian motion process Effects 0.000 description 2
- 108010077544 Chromatin Proteins 0.000 description 2
- 108010066072 DNA modification methylase EcoRI Proteins 0.000 description 2
- 230000004568 DNA-binding Effects 0.000 description 2
- BVTJGGGYKAMDBN-UHFFFAOYSA-N Dioxetane Chemical compound C1COO1 BVTJGGGYKAMDBN-UHFFFAOYSA-N 0.000 description 2
- SXRSQZLOMIGNAQ-UHFFFAOYSA-N Glutaraldehyde Chemical compound O=CCCCC=O SXRSQZLOMIGNAQ-UHFFFAOYSA-N 0.000 description 2
- OAICVXFJPJFONN-UHFFFAOYSA-N Phosphorus Chemical compound [P] OAICVXFJPJFONN-UHFFFAOYSA-N 0.000 description 2
- 102000055027 Protein Methyltransferases Human genes 0.000 description 2
- 241000235347 Schizosaccharomyces pombe Species 0.000 description 2
- XUIMIQQOPSSXEZ-UHFFFAOYSA-N Silicon Chemical compound [Si] XUIMIQQOPSSXEZ-UHFFFAOYSA-N 0.000 description 2
- 238000002105 Southern blotting Methods 0.000 description 2
- ULHRKLSNHXXJLO-UHFFFAOYSA-L Yo-Pro-1 Chemical compound [I-].[I-].C1=CC=C2C(C=C3N(C4=CC=CC=C4O3)C)=CC=[N+](CCC[N+](C)(C)C)C2=C1 ULHRKLSNHXXJLO-UHFFFAOYSA-L 0.000 description 2
- 239000002253 acid Substances 0.000 description 2
- 150000007513 acids Chemical class 0.000 description 2
- 230000006978 adaptation Effects 0.000 description 2
- 238000000246 agarose gel electrophoresis Methods 0.000 description 2
- 230000002776 aggregation Effects 0.000 description 2
- 238000004220 aggregation Methods 0.000 description 2
- 210000004436 artificial bacterial chromosome Anatomy 0.000 description 2
- 229960002685 biotin Drugs 0.000 description 2
- 235000020958 biotin Nutrition 0.000 description 2
- 239000011616 biotin Substances 0.000 description 2
- 238000009835 boiling Methods 0.000 description 2
- 238000005537 brownian motion Methods 0.000 description 2
- 150000007942 carboxylates Chemical class 0.000 description 2
- 230000009920 chelation Effects 0.000 description 2
- 210000003483 chromatin Anatomy 0.000 description 2
- 230000002759 chromosomal effect Effects 0.000 description 2
- 238000007796 conventional method Methods 0.000 description 2
- 230000002596 correlated effect Effects 0.000 description 2
- 230000006378 damage Effects 0.000 description 2
- 239000003599 detergent Substances 0.000 description 2
- 201000010099 disease Diseases 0.000 description 2
- 208000037265 diseases, disorders, signs and symptoms Diseases 0.000 description 2
- 238000006073 displacement reaction Methods 0.000 description 2
- 230000005782 double-strand break Effects 0.000 description 2
- 230000001747 exhibiting effect Effects 0.000 description 2
- 239000004519 grease Substances 0.000 description 2
- 230000036541 health Effects 0.000 description 2
- 238000002955 isolation Methods 0.000 description 2
- 239000004816 latex Substances 0.000 description 2
- 229920000126 latex Polymers 0.000 description 2
- 239000007788 liquid Substances 0.000 description 2
- 230000002934 lysing effect Effects 0.000 description 2
- 210000000415 mammalian chromosome Anatomy 0.000 description 2
- 230000037230 mobility Effects 0.000 description 2
- 238000007479 molecular analysis Methods 0.000 description 2
- BASFCYQUMIYNBI-UHFFFAOYSA-N platinum Chemical compound [Pt] BASFCYQUMIYNBI-UHFFFAOYSA-N 0.000 description 2
- 229920002401 polyacrylamide Polymers 0.000 description 2
- 102000054765 polymorphisms of proteins Human genes 0.000 description 2
- 230000000750 progressive effect Effects 0.000 description 2
- 238000007894 restriction fragment length polymorphism technique Methods 0.000 description 2
- 238000009738 saturating Methods 0.000 description 2
- 150000004756 silanes Chemical class 0.000 description 2
- 229910052710 silicon Inorganic materials 0.000 description 2
- 239000010703 silicon Substances 0.000 description 2
- 150000003384 small molecules Chemical class 0.000 description 2
- ATHGHQPFGPMSJY-UHFFFAOYSA-N spermidine Chemical compound NCCCCNCCCN ATHGHQPFGPMSJY-UHFFFAOYSA-N 0.000 description 2
- 239000000758 substrate Substances 0.000 description 2
- 230000001360 synchronised effect Effects 0.000 description 2
- 238000013519 translation Methods 0.000 description 2
- 238000007794 visualization technique Methods 0.000 description 2
- 238000005406 washing Methods 0.000 description 2
- KPZGRMZPZLOPBS-UHFFFAOYSA-N 1,3-dichloro-2,2-bis(chloromethyl)propane Chemical compound ClCC(CCl)(CCl)CCl KPZGRMZPZLOPBS-UHFFFAOYSA-N 0.000 description 1
- OSBLTNPMIGYQGY-UHFFFAOYSA-N 2-amino-2-(hydroxymethyl)propane-1,3-diol;2-[2-[bis(carboxymethyl)amino]ethyl-(carboxymethyl)amino]acetic acid;boric acid Chemical compound OB(O)O.OCC(N)(CO)CO.OC(=O)CN(CC(O)=O)CCN(CC(O)=O)CC(O)=O OSBLTNPMIGYQGY-UHFFFAOYSA-N 0.000 description 1
- QKNYBSVHEMOAJP-UHFFFAOYSA-N 2-amino-2-(hydroxymethyl)propane-1,3-diol;hydron;chloride Chemical compound Cl.OCC(N)(CO)CO QKNYBSVHEMOAJP-UHFFFAOYSA-N 0.000 description 1
- VKWMGUNWDFIWNW-UHFFFAOYSA-N 2-chloro-1,1-dioxo-1,2-benzothiazol-3-one Chemical compound C1=CC=C2S(=O)(=O)N(Cl)C(=O)C2=C1 VKWMGUNWDFIWNW-UHFFFAOYSA-N 0.000 description 1
- 108091023043 Alu Element Proteins 0.000 description 1
- QGZKDVFQNNGYKY-UHFFFAOYSA-N Ammonia Chemical compound N QGZKDVFQNNGYKY-UHFFFAOYSA-N 0.000 description 1
- 108090001008 Avidin Proteins 0.000 description 1
- IVRMZWNICZWHMI-UHFFFAOYSA-N Azide Chemical compound [N-]=[N+]=[N-] IVRMZWNICZWHMI-UHFFFAOYSA-N 0.000 description 1
- 241000894006 Bacteria Species 0.000 description 1
- 241001474374 Blennius Species 0.000 description 1
- 239000004215 Carbon black (E152) Substances 0.000 description 1
- 102000014914 Carrier Proteins Human genes 0.000 description 1
- 206010068051 Chimerism Diseases 0.000 description 1
- 239000004971 Cross linker Substances 0.000 description 1
- 230000007035 DNA breakage Effects 0.000 description 1
- 229920001917 Ficoll Polymers 0.000 description 1
- 241000233866 Fungi Species 0.000 description 1
- 108010042546 GCGGCCGC-specific type II deoxyribonucleases Proteins 0.000 description 1
- 108010010803 Gelatin Proteins 0.000 description 1
- 208000026350 Inborn Genetic disease Diseases 0.000 description 1
- 206010028347 Muscle twitching Diseases 0.000 description 1
- KWYHDKDOAIKMQN-UHFFFAOYSA-N N,N,N',N'-tetramethylethylenediamine Chemical compound CN(C)CCN(C)C KWYHDKDOAIKMQN-UHFFFAOYSA-N 0.000 description 1
- 108091061960 Naked DNA Proteins 0.000 description 1
- 108020004711 Nucleic Acid Probes Proteins 0.000 description 1
- 238000012408 PCR amplification Methods 0.000 description 1
- 241000935974 Paralichthys dentatus Species 0.000 description 1
- 108091005804 Peptidases Proteins 0.000 description 1
- 239000004365 Protease Substances 0.000 description 1
- 108700040121 Protein Methyltransferases Proteins 0.000 description 1
- 101000702488 Rattus norvegicus High affinity cationic amino acid transporter 1 Proteins 0.000 description 1
- 108091081062 Repeated sequence (DNA) Proteins 0.000 description 1
- 102100037486 Reverse transcriptase/ribonuclease H Human genes 0.000 description 1
- 244000178231 Rosmarinus officinalis Species 0.000 description 1
- 241000700584 Simplexvirus Species 0.000 description 1
- 239000008051 TBE buffer Substances 0.000 description 1
- GYDJEQRTZSCIOI-UHFFFAOYSA-N Tranexamic acid Chemical compound NCC1CCC(C(O)=O)CC1 GYDJEQRTZSCIOI-UHFFFAOYSA-N 0.000 description 1
- 241000700605 Viruses Species 0.000 description 1
- 230000002378 acidificating effect Effects 0.000 description 1
- 230000009471 action Effects 0.000 description 1
- 230000003213 activating effect Effects 0.000 description 1
- 230000002411 adverse Effects 0.000 description 1
- 150000001298 alcohols Chemical class 0.000 description 1
- BFNBIHQBYMNNAN-UHFFFAOYSA-N ammonium sulfate Chemical compound N.N.OS(O)(=O)=O BFNBIHQBYMNNAN-UHFFFAOYSA-N 0.000 description 1
- 229910052921 ammonium sulfate Inorganic materials 0.000 description 1
- 235000011130 ammonium sulphate Nutrition 0.000 description 1
- 230000003321 amplification Effects 0.000 description 1
- 238000000137 annealing Methods 0.000 description 1
- 230000003042 antagnostic effect Effects 0.000 description 1
- XKRFYHLGVUSROY-UHFFFAOYSA-N argon Substances [Ar] XKRFYHLGVUSROY-UHFFFAOYSA-N 0.000 description 1
- 229910052786 argon Inorganic materials 0.000 description 1
- 238000003491 array Methods 0.000 description 1
- 210000004507 artificial chromosome Anatomy 0.000 description 1
- 238000004630 atomic force microscopy Methods 0.000 description 1
- 238000000376 autoradiography Methods 0.000 description 1
- 230000009286 beneficial effect Effects 0.000 description 1
- 108091008324 binding proteins Proteins 0.000 description 1
- 238000005842 biochemical reaction Methods 0.000 description 1
- 230000000903 blocking effect Effects 0.000 description 1
- 238000011088 calibration curve Methods 0.000 description 1
- 239000013592 cell lysate Substances 0.000 description 1
- ZYVSOIYQKUDENJ-WKSBCEQHSA-N chromomycin A3 Chemical compound O([C@@H]1C[C@@H](O[C@H](C)[C@@H]1OC(C)=O)OC=1C=C2C=C3C[C@H]([C@@H](C(=O)C3=C(O)C2=C(O)C=1C)O[C@@H]1O[C@H](C)[C@@H](O)[C@H](O[C@@H]2O[C@H](C)[C@@H](O)[C@H](O[C@@H]3O[C@@H](C)[C@H](OC(C)=O)[C@@](C)(O)C3)C2)C1)[C@H](OC)C(=O)[C@@H](O)[C@@H](C)O)[C@@H]1C[C@@H](O)[C@@H](OC)[C@@H](C)O1 ZYVSOIYQKUDENJ-WKSBCEQHSA-N 0.000 description 1
- 238000000576 coating method Methods 0.000 description 1
- 229910017052 cobalt Inorganic materials 0.000 description 1
- 239000010941 cobalt Substances 0.000 description 1
- GUTLYIVDDKVIGB-UHFFFAOYSA-N cobalt atom Chemical compound [Co] GUTLYIVDDKVIGB-UHFFFAOYSA-N 0.000 description 1
- 239000003086 colorant Substances 0.000 description 1
- 239000002299 complementary DNA Substances 0.000 description 1
- 238000004590 computer program Methods 0.000 description 1
- 230000008094 contradictory effect Effects 0.000 description 1
- 230000036461 convulsion Effects 0.000 description 1
- 238000001816 cooling Methods 0.000 description 1
- 230000008878 coupling Effects 0.000 description 1
- 238000010168 coupling process Methods 0.000 description 1
- 238000005859 coupling reaction Methods 0.000 description 1
- 230000005574 cross-species transmission Effects 0.000 description 1
- 230000009089 cytolysis Effects 0.000 description 1
- 238000013016 damping Methods 0.000 description 1
- 238000007405 data analysis Methods 0.000 description 1
- 238000013075 data extraction Methods 0.000 description 1
- 238000013500 data storage Methods 0.000 description 1
- 230000002950 deficient Effects 0.000 description 1
- 238000012217 deletion Methods 0.000 description 1
- 230000037430 deletion Effects 0.000 description 1
- 238000011161 development Methods 0.000 description 1
- 230000018109 developmental process Effects 0.000 description 1
- 229960000633 dextran sulfate Drugs 0.000 description 1
- 238000002405 diagnostic procedure Methods 0.000 description 1
- 238000000502 dialysis Methods 0.000 description 1
- 230000004069 differentiation Effects 0.000 description 1
- 230000010339 dilation Effects 0.000 description 1
- 239000012470 diluted sample Substances 0.000 description 1
- 239000012153 distilled water Substances 0.000 description 1
- 239000002019 doping agent Substances 0.000 description 1
- 229920001971 elastomer Polymers 0.000 description 1
- 230000006862 enzymatic digestion Effects 0.000 description 1
- 238000001976 enzyme digestion Methods 0.000 description 1
- 238000001317 epifluorescence microscopy Methods 0.000 description 1
- 238000011067 equilibration Methods 0.000 description 1
- 230000003628 erosive effect Effects 0.000 description 1
- 238000012869 ethanol precipitation Methods 0.000 description 1
- 238000011156 evaluation Methods 0.000 description 1
- 230000004438 eyesight Effects 0.000 description 1
- 239000000835 fiber Substances 0.000 description 1
- 238000011049 filling Methods 0.000 description 1
- MHMNJMPURVTYEJ-UHFFFAOYSA-N fluorescein-5-isothiocyanate Chemical compound O1C(=O)C2=CC(N=C=S)=CC=C2C21C1=CC=C(O)C=C1OC1=CC(O)=CC=C21 MHMNJMPURVTYEJ-UHFFFAOYSA-N 0.000 description 1
- 238000001215 fluorescent labelling Methods 0.000 description 1
- 239000008273 gelatin Substances 0.000 description 1
- 229920000159 gelatin Polymers 0.000 description 1
- 235000019322 gelatine Nutrition 0.000 description 1
- 235000011852 gelatine desserts Nutrition 0.000 description 1
- 208000016361 genetic disease Diseases 0.000 description 1
- 238000009499 grossing Methods 0.000 description 1
- 238000010438 heat treatment Methods 0.000 description 1
- 239000000833 heterodimer Substances 0.000 description 1
- 239000004312 hexamethylene tetramine Substances 0.000 description 1
- 235000010299 hexamethylene tetramine Nutrition 0.000 description 1
- VKYKSIONXSXAKP-UHFFFAOYSA-N hexamethylenetetramine Chemical compound C1N(C2)CN3CN1CN2C3 VKYKSIONXSXAKP-UHFFFAOYSA-N 0.000 description 1
- 210000003917 human chromosome Anatomy 0.000 description 1
- 229930195733 hydrocarbon Natural products 0.000 description 1
- 150000002430 hydrocarbons Chemical class 0.000 description 1
- 238000003702 image correction Methods 0.000 description 1
- 239000012535 impurity Substances 0.000 description 1
- 238000010348 incorporation Methods 0.000 description 1
- 239000004615 ingredient Substances 0.000 description 1
- 230000000977 initiatory effect Effects 0.000 description 1
- 238000003780 insertion Methods 0.000 description 1
- 230000037431 insertion Effects 0.000 description 1
- 150000008040 ionic compounds Chemical class 0.000 description 1
- 150000002500 ions Chemical class 0.000 description 1
- 230000001788 irregular Effects 0.000 description 1
- 230000000155 isotopic effect Effects 0.000 description 1
- 230000002045 lasting effect Effects 0.000 description 1
- 230000003902 lesion Effects 0.000 description 1
- 210000004962 mammalian cell Anatomy 0.000 description 1
- 239000003550 marker Substances 0.000 description 1
- 238000013178 mathematical model Methods 0.000 description 1
- 230000028161 membrane depolarization Effects 0.000 description 1
- 230000005499 meniscus Effects 0.000 description 1
- 229960000901 mepacrine Drugs 0.000 description 1
- QSHDDOUJBYECFT-UHFFFAOYSA-N mercury Chemical compound [Hg] QSHDDOUJBYECFT-UHFFFAOYSA-N 0.000 description 1
- 229910052753 mercury Inorganic materials 0.000 description 1
- 239000010445 mica Substances 0.000 description 1
- 229910052618 mica group Inorganic materials 0.000 description 1
- 238000007431 microscopic evaluation Methods 0.000 description 1
- 230000010070 molecular adhesion Effects 0.000 description 1
- 230000009149 molecular binding Effects 0.000 description 1
- 238000012544 monitoring process Methods 0.000 description 1
- ZIUHHBKFKCYYJD-UHFFFAOYSA-N n,n'-methylenebisacrylamide Chemical compound C=CC(=O)NCNC(=O)C=C ZIUHHBKFKCYYJD-UHFFFAOYSA-N 0.000 description 1
- 239000006225 natural substrate Substances 0.000 description 1
- 238000010606 normalization Methods 0.000 description 1
- 238000003199 nucleic acid amplification method Methods 0.000 description 1
- 102000044158 nucleic acid binding protein Human genes 0.000 description 1
- 108700020942 nucleic acid binding protein Proteins 0.000 description 1
- 238000007899 nucleic acid hybridization Methods 0.000 description 1
- 239000002853 nucleic acid probe Substances 0.000 description 1
- 238000001821 nucleic acid purification Methods 0.000 description 1
- 230000003647 oxidation Effects 0.000 description 1
- 238000007254 oxidation reaction Methods 0.000 description 1
- 238000012856 packing Methods 0.000 description 1
- 230000000737 periodic effect Effects 0.000 description 1
- 239000008363 phosphate buffer Substances 0.000 description 1
- 230000000704 physical effect Effects 0.000 description 1
- INAAIJLSXJJHOZ-UHFFFAOYSA-N pibenzimol Chemical compound C1CN(C)CCN1C1=CC=C(N=C(N2)C=3C=C4NC(=NC4=CC=3)C=3C=CC(O)=CC=3)C2=C1 INAAIJLSXJJHOZ-UHFFFAOYSA-N 0.000 description 1
- 229910052697 platinum Inorganic materials 0.000 description 1
- 102000040430 polynucleotide Human genes 0.000 description 1
- 108091033319 polynucleotide Proteins 0.000 description 1
- 239000002157 polynucleotide Substances 0.000 description 1
- 229920001296 polysiloxane Polymers 0.000 description 1
- 238000011176 pooling Methods 0.000 description 1
- 230000003389 potentiating effect Effects 0.000 description 1
- 238000010944 pre-mature reactiony Methods 0.000 description 1
- 238000004321 preservation Methods 0.000 description 1
- 238000003825 pressing Methods 0.000 description 1
- 108090000765 processed proteins & peptides Proteins 0.000 description 1
- 102000004196 processed proteins & peptides Human genes 0.000 description 1
- 238000005086 pumping Methods 0.000 description 1
- 238000006862 quantum yield reaction Methods 0.000 description 1
- GPKJTRJOBQGKQK-UHFFFAOYSA-N quinacrine Chemical compound C1=C(OC)C=C2C(NC(C)CCCN(CC)CC)=C(C=CC(Cl)=C3)C3=NC2=C1 GPKJTRJOBQGKQK-UHFFFAOYSA-N 0.000 description 1
- 230000002285 radioactive effect Effects 0.000 description 1
- 238000000163 radioactive labelling Methods 0.000 description 1
- 101150079601 recA gene Proteins 0.000 description 1
- 230000009467 reduction Effects 0.000 description 1
- 238000009877 rendering Methods 0.000 description 1
- 230000004044 response Effects 0.000 description 1
- 239000012898 sample dilution Substances 0.000 description 1
- 238000005070 sampling Methods 0.000 description 1
- 238000007480 sanger sequencing Methods 0.000 description 1
- 238000004621 scanning probe microscopy Methods 0.000 description 1
- 238000004574 scanning tunneling microscopy Methods 0.000 description 1
- 239000012453 solvate Substances 0.000 description 1
- 241000894007 species Species 0.000 description 1
- 230000009870 specific binding Effects 0.000 description 1
- 238000012306 spectroscopic technique Methods 0.000 description 1
- 229940063673 spermidine Drugs 0.000 description 1
- 230000006641 stabilisation Effects 0.000 description 1
- 238000011105 stabilization Methods 0.000 description 1
- 230000002194 synthesizing effect Effects 0.000 description 1
- 230000002123 temporal effect Effects 0.000 description 1
- JGVWCANSWKRBCS-UHFFFAOYSA-N tetramethylrhodamine thiocyanate Chemical compound [Cl-].C=12C=CC(N(C)C)=CC2=[O+]C2=CC(N(C)C)=CC=C2C=1C1=CC=C(SC#N)C=C1C(O)=O JGVWCANSWKRBCS-UHFFFAOYSA-N 0.000 description 1
- 230000001960 triggered effect Effects 0.000 description 1
- 238000011144 upstream manufacturing Methods 0.000 description 1
- 229940099259 vaseline Drugs 0.000 description 1
- 238000012795 verification Methods 0.000 description 1
- 230000004304 visual acuity Effects 0.000 description 1
- 238000003260 vortexing Methods 0.000 description 1
Images



















Classifications
-
- C—CHEMISTRY; METALLURGY
- C12—BIOCHEMISTRY; BEER; SPIRITS; WINE; VINEGAR; MICROBIOLOGY; ENZYMOLOGY; MUTATION OR GENETIC ENGINEERING
- C12Q—MEASURING OR TESTING PROCESSES INVOLVING ENZYMES, NUCLEIC ACIDS OR MICROORGANISMS; COMPOSITIONS OR TEST PAPERS THEREFOR; PROCESSES OF PREPARING SUCH COMPOSITIONS; CONDITION-RESPONSIVE CONTROL IN MICROBIOLOGICAL OR ENZYMOLOGICAL PROCESSES
- C12Q1/00—Measuring or testing processes involving enzymes, nucleic acids or microorganisms; Compositions therefor; Processes of preparing such compositions
- C12Q1/68—Measuring or testing processes involving enzymes, nucleic acids or microorganisms; Compositions therefor; Processes of preparing such compositions involving nucleic acids
- C12Q1/6806—Preparing nucleic acids for analysis, e.g. for polymerase chain reaction [PCR] assay
-
- C—CHEMISTRY; METALLURGY
- C12—BIOCHEMISTRY; BEER; SPIRITS; WINE; VINEGAR; MICROBIOLOGY; ENZYMOLOGY; MUTATION OR GENETIC ENGINEERING
- C12Q—MEASURING OR TESTING PROCESSES INVOLVING ENZYMES, NUCLEIC ACIDS OR MICROORGANISMS; COMPOSITIONS OR TEST PAPERS THEREFOR; PROCESSES OF PREPARING SUCH COMPOSITIONS; CONDITION-RESPONSIVE CONTROL IN MICROBIOLOGICAL OR ENZYMOLOGICAL PROCESSES
- C12Q1/00—Measuring or testing processes involving enzymes, nucleic acids or microorganisms; Compositions therefor; Processes of preparing such compositions
- C12Q1/68—Measuring or testing processes involving enzymes, nucleic acids or microorganisms; Compositions therefor; Processes of preparing such compositions involving nucleic acids
- C12Q1/6813—Hybridisation assays
- C12Q1/6834—Enzymatic or biochemical coupling of nucleic acids to a solid phase
-
- C—CHEMISTRY; METALLURGY
- C12—BIOCHEMISTRY; BEER; SPIRITS; WINE; VINEGAR; MICROBIOLOGY; ENZYMOLOGY; MUTATION OR GENETIC ENGINEERING
- C12Q—MEASURING OR TESTING PROCESSES INVOLVING ENZYMES, NUCLEIC ACIDS OR MICROORGANISMS; COMPOSITIONS OR TEST PAPERS THEREFOR; PROCESSES OF PREPARING SUCH COMPOSITIONS; CONDITION-RESPONSIVE CONTROL IN MICROBIOLOGICAL OR ENZYMOLOGICAL PROCESSES
- C12Q1/00—Measuring or testing processes involving enzymes, nucleic acids or microorganisms; Compositions therefor; Processes of preparing such compositions
- C12Q1/68—Measuring or testing processes involving enzymes, nucleic acids or microorganisms; Compositions therefor; Processes of preparing such compositions involving nucleic acids
- C12Q1/6813—Hybridisation assays
- C12Q1/6841—In situ hybridisation
-
- C—CHEMISTRY; METALLURGY
- C12—BIOCHEMISTRY; BEER; SPIRITS; WINE; VINEGAR; MICROBIOLOGY; ENZYMOLOGY; MUTATION OR GENETIC ENGINEERING
- C12Q—MEASURING OR TESTING PROCESSES INVOLVING ENZYMES, NUCLEIC ACIDS OR MICROORGANISMS; COMPOSITIONS OR TEST PAPERS THEREFOR; PROCESSES OF PREPARING SUCH COMPOSITIONS; CONDITION-RESPONSIVE CONTROL IN MICROBIOLOGICAL OR ENZYMOLOGICAL PROCESSES
- C12Q1/00—Measuring or testing processes involving enzymes, nucleic acids or microorganisms; Compositions therefor; Processes of preparing such compositions
- C12Q1/68—Measuring or testing processes involving enzymes, nucleic acids or microorganisms; Compositions therefor; Processes of preparing such compositions involving nucleic acids
- C12Q1/6869—Methods for sequencing
-
- G—PHYSICS
- G01—MEASURING; TESTING
- G01N—INVESTIGATING OR ANALYSING MATERIALS BY DETERMINING THEIR CHEMICAL OR PHYSICAL PROPERTIES
- G01N15/00—Investigating characteristics of particles; Investigating permeability, pore-volume or surface-area of porous materials
- G01N15/10—Investigating individual particles
- G01N15/14—Optical investigation techniques, e.g. flow cytometry
- G01N15/149—Optical investigation techniques, e.g. flow cytometry specially adapted for sorting particles, e.g. by their size or optical properties
-
- G—PHYSICS
- G01—MEASURING; TESTING
- G01N—INVESTIGATING OR ANALYSING MATERIALS BY DETERMINING THEIR CHEMICAL OR PHYSICAL PROPERTIES
- G01N15/00—Investigating characteristics of particles; Investigating permeability, pore-volume or surface-area of porous materials
- G01N2015/0038—Investigating nanoparticles
-
- G—PHYSICS
- G01—MEASURING; TESTING
- G01N—INVESTIGATING OR ANALYSING MATERIALS BY DETERMINING THEIR CHEMICAL OR PHYSICAL PROPERTIES
- G01N15/00—Investigating characteristics of particles; Investigating permeability, pore-volume or surface-area of porous materials
- G01N15/10—Investigating individual particles
- G01N2015/1021—Measuring mass of individual particles
-
- G—PHYSICS
- G01—MEASURING; TESTING
- G01N—INVESTIGATING OR ANALYSING MATERIALS BY DETERMINING THEIR CHEMICAL OR PHYSICAL PROPERTIES
- G01N15/00—Investigating characteristics of particles; Investigating permeability, pore-volume or surface-area of porous materials
- G01N15/10—Investigating individual particles
- G01N2015/1022—Measurement of deformation of individual particles by non-optical means
-
- G—PHYSICS
- G01—MEASURING; TESTING
- G01N—INVESTIGATING OR ANALYSING MATERIALS BY DETERMINING THEIR CHEMICAL OR PHYSICAL PROPERTIES
- G01N15/00—Investigating characteristics of particles; Investigating permeability, pore-volume or surface-area of porous materials
- G01N15/10—Investigating individual particles
- G01N15/14—Optical investigation techniques, e.g. flow cytometry
- G01N2015/1493—Particle size
- G01N2015/1495—Deformation of particles
Definitions
- This invention relates to methods and compositions for manipulating and characterizing individual polymer molecules, especially nucleic acid molecules, according to, for example, size and/or nucleotide sequence.
- nucleic acid molecules at the genome level is an extremely complex endeavor which requires accurate, rapid characterization of large numbers of often very large nucleic acid molecules via high throughput DNA mapping and sequencing.
- the construction of physical maps, and ultimately of nucleotide sequences, for eukaryotic chromosomes currently remains laborious and difficult. This is due, in part, to the fact that current procedures for mapping and sequencing DNA were originally designed to analyze nucleic acid at the gene, rather than at the genome, level ( Chumakov, I. et al., 1992, Nature 359:380 ; Maier, E. et al., 1992, Nat. Genet. 1:273 ).
- Such techniques require the preparation of DNA in bulk amounts.
- preparative procedures may require sources such as genomic DNA or DNA from yeast artificial chromosomes (YACs; Burke, D.T. et al., 1987, Science 236:806 ; Barlow, et al., 1987, Trends in Genetics 3:167-177 ; Campbell et al., 1991, Proc. Natl. Acad. Sci. USA 88:5744 ).
- YACs yeast artificial chromosomes
- optimal techniques can often require the use of several different gel matrix compositions and/or alternative electrophoresis procedures, depending upon the sizes of the molecules of interest.
- the separation of large molecules of DNA may require such techniques as pulse field electrophoresis (see, e.g. , U.S. Patent No. 4,473,452 ).
- standard gel electrophoresis techniques involve the separation of populations of molecules according to size, making it impossible to separate individual molecules within a polydisperse mixture. In summary, therefore, the accurate, rapid, practical, high throughput separation of individual DNA molecules, especially those of highly disparate sizes, which would often be required for genomic mapping purposes, is impossible via gel electrophoresis.
- FISH fluorescence in situ hybridization
- Single molecule tethering techniques generally involve individual nucleic acid molecules which have, first, been immobilized onto a surface via one or both of their ends, and, second, have been manipulated such that the molecules are stretched out. These techniques, however, are not suited to genome analysis. First, the steps involved are time consuming and can only be accomplished with a small number of molecules per procedure. Further, in general, the tethered molecules cannot be stored and used again.
- a combination of the sizing capability of gel electrophoresis and the ordering capability of certain single molecule techniques such as, for example, FISH, would, therefore, be extremely useful for genomic analyses such as genomic mapping. Such analyses would be further aided by the ability to manipulate the single molecules being analyzed. Additionally, an ability to reuse the nucleic acid samples of interest would increase the efficiency and throughput capability of the analysis.
- single technology which embodies, in a practical manner, each of these elements.
- the present invention relates to methods and compositions for characterizing and manipulating individual nucleic acid molecules, including mammalian chromosome-sized individual nucleic acid molecules.
- the methods and compositions described herein can be used for the accurate, rapid, high throughput analysis of nucleic acid molecules at the genome level. This analysis may, for example, include the construction of high resolution physical maps, referred to herein as "optical mapping,” and the detection of specific nucleotide sequences within a genome, referred to herein as "optical sequencing.”
- the molecules are elongated in a flow of a molten or unpolymerized gel composition.
- the elongated molecules become fixed as the gel composition becomes hardened or polymerized.
- the gel composition is preferably an agarose gel composition. The elongated molecules became fixed as the agarose hardens.
- the single nucleic acid molecules are elongated and fixed in a controllable manner directly onto a solid, planar surface.
- This solid, planar surface contains a positive charge density that has been controllably modified such that the single nucleic acid molecules will exhibit an optimal balance between the critical parameters of nucleic acid elongation state, degree of relaxation stability and biological activity. Further, methods, compositions and assays are described by which such an optimal balance can precisely and reproducibly be achieved.
- the single nucleic acid molecules are elongated via flow-based techniques.
- a single nucleic acid molecule is elongated, manipulated (via, for example, a regio-specific restriction digestion), and/or analyzed in a laminar flow elongation device.
- the present invention further relates to and describes such a laminar flow elongation device.
- the elongated, individual nucleic acid molecules can then be used in a variety of ways which have applications for the analysis of nucleic acid at the genome level.
- such nucleic acid molecules may be used to generate ordered, high resolution single nucleic acid molecule restriction maps. This method is referred to herein as “optical mapping” or “optical restriction mapping.”
- optical mapping or “optical restriction mapping.”
- methods are presented by which specific nucleotide sequences present within the elongated nucleic acid molecules can be identified. Such methods are referred to herein as "optical sequencing.”
- the optical mapping and optical sequencing techniques can be used independently or in combination on the same individual nucleic acid molecules.
- the elongated nucleic acid molecules of the invention can be manipulated using any standard procedure.
- the single nucleic acid molecules may be manipulated by any enzymes which act upon nucleic acid molecules, and which may include, but are not limited to, restriction endonucleases, exonucleases, polymerases, ligases or helicases.
- imaging techniques may, for example, include the use of fluorochromes, microscopy and/or image processing computer software and hardware.
- sizing methods include both static and dynamic measuring techniques.
- high throughput methods for utilizing such single nucleic acid molecules in genome analysis are presented.
- rapid optical mapping approaches are described for the creation of high-resolution restriction maps.
- single nucleic acid molecules are elongated, fixed and gridded to high density onto a solid surface. These molecules can then be digested with appropriate restriction enzymes for the map construction.
- the single nucleic acid molecules can be elongated, fixed and gridded at high density onto a solid surface and utilized in a variety of optical sequencing-based diagnostic methods. Notably, such diagnostic grids can also be reused.
- the high throughput and methods can be used to generate rapidly information derived from procedures that combine optical mapping and optical sequencing methods.
- the present invention provides techniques, including high throughput techniques, that reproducibly and rapidly generate populations of individual, elongated nucleic acid molecules that not only retain biological function but are accessible to manipulation and make possible rapid genome analysis.
- Described herein are methods and compositions for characterizing and manipulating individual nucleic acid molecules, including mammalian chromosome-sized individual nucleic acid molecules.
- the methods and compositions described herein can be utilized for optical mapping and optical sequencing purposes to generate accurate, rapid, high throughput analyses of nucleic acid molecules at the genome level.
- Section 5.1 describes methods for the elongation and fixation of single nucleic acid molecules. Such methods include both agarose-based (Section 5.1.1) and solid surface-based (Section 5.1.2) techniques. Section 5.1 also describes assays for the optimization of parameters important to the production of the solid, planar surfaces used herein. Further, Section 5.1 also describes flow-based elongation techniques (Section 5.1.3) in which a single nucleic acid molecule is elongated, manipulated and/or analyzed in a laminar flow elongation device.
- Section 5.2 describes methods for the imaging and sizing of single nucleic acid molecules.
- the Section includes, for example, nucleic acid staining, microscopy and photography techniques (Section 5.2.1) useful for imaging single nucleic acid molecules.
- the Section describes methods for the sizing of single nucleic acid molecules including both static and dynamic measurement techniques (Section 5.2.2).
- Section 5.3 describes genome analysis applications to which the single nucleic acid molecule techniques of the invention may be put. Such applications include, for example, optical mapping and optical sequencing techniques.
- Section 5.4 discusses methods for rapid, high throughput utilization of the single nucleic acid techniques of the invention.
- a variety of methods can be utilized for the rapid, controllable and reproducible elongation of single nucleic acid molecules in such a manner that allows rapid, efficient analysis and/or manipulation of the molecules.
- These techniques can include, for example, gel-based (Section 5.1.1), solid surface-based (Section 5.1.2) and flow-based techniques (Section 5.1.3), each of which will be separately described below.
- Gel-based techniques can be utilized for the elongation of single nucleic acid molecules.
- the gel-based techniques described herein maintain the biological function of the nucleic acid molecules and, further, allow for the manipulation and/or accurate analysis of the elongated single nucleic acid molecules.
- Nucleic acid molecules which can be rapidly, efficiently analyzed via such gel-based techniary include nucleic acid molecules which range in length from about 20 kb up to mammalian chromosome-sized lengths ( i.e. , greater than 1000 kb). Further, such gel-based techniques make possible the utilization of dynamic measurement procedures, may generate a lower level of nucleic acid shearing and make possible the utilization of a wide range of biochemical activities with which the manipulate the elongated nucleic acid molecules.
- gel-based techniques involve elongating single nucleic acid molecules within a molten or nonpolymerized gel composition such that upon cooling or polymerization, the elongated nucleic acid molecules are maintained in a relatively stationary position, while remaining accessible to, for example, enzymatic manipulation and/or hybridization to complementary nucleic acid molecules or binding to sequence-specific proteins or peptides. Further, the gelation process restrains elongated nucleic acid molecules from appreciably relaxing to a random coil conformation after, for example, their enzymatic cleavage.
- the amount which the single nucleic acid molecules are elongated within the gel composition is critical. Excessive elongation or stretching causes the molecule to become difficult to visualize. For example, too much stretching presents too little fluorochrome per imaging pixel, lending the intensities generated by the measured molecular intensities to approach background values. Insufficient stretching, however, generates too low a level of tension, which can interfere with an analysis of single nucleic acid molecule manipulations. For example, when restriction mapping, enough elongation must occur such that, upon digestion, the newly formed nucleic acid fragments pull away from each other, thus revealing restriction sites. An additional requirement for optimal gel-based elongation requires that care be taken to preserve the moisture within the gel, such that the maximum biological function of the nucleic acid can be retained.
- nucleic acid molecule For optimal imaging/manipulation potential, the extent to which a nucleic acid molecule is elongated within a gel must be great enough to generate a sufficient level of intramolecular tension while not being so great that the elongated molecule becomes difficult to image. In general, elongation methods which produce single nucleic acid molecules that span approximately 20% to 60% of their curvilnear contour lengths are preferred.
- the elongated nucleic acid molecules within the gel must lie within a shallow plane of focus for successful imaging. With respect to larger nucleic acid molecules, for example, it is additionally important for the molecules to lie within a plane approximately 0.2 ⁇ m in thickness for focused visualization.
- parameters which affect the rate of gelation include, for example, the gel concentration and/or temperature at which the gel is formed. A higher gel concentration or gelation at a low temperature hastens gel formation.
- parameters which affect the rate of polymerization include, for example, the acrylamide/bisacrylamide concentration and ratio, the temperature at which polymerization takes place, and the ammonium sulfate and TEMED concentrations used.
- an agarose gel composition is preferred, with an agarose composition exhibiting a low gelling temperature being especially preferred.
- Such low gelling temperature agarose compositions are the most optically clear agarose compositions available and, further, because such compositions can remain molten at 37°C, the biological activity of enzymes, such as restriction enzymes, within the molten agarose can easily be maintained. Additionally, such agarose compositions are useful in that rapid gelation is often desired for fixation of the elongated nucleic acid molecules.
- a gel composition comprising from about 0.1% to about 3.0%, with 0.1-1.5% being preferred.
- an elongating external force may include an electrical or mechanical force. While the exact amount of external force required for optimal elongation may vary according to, for example, the specific gel composition and nucleic acid molecules being elongated, the optimization of gel parameters can easily and without undue experimentation be assayed by, for example, utilizing the visualization and measurement techniques described in Section 5.2, below.
- Elongation may, for example, be accomplished by generating a flow force within a molten agarose gel containing single nucleic acid molecules.
- a flow force may be set up by placing the nucleic acid/molten gel composition between two solid surfaces, such as, for example, between a slide and a coverslip.
- a hole preferably exists in the slide through which reagents for the manipulation of the elongated nucleic acid molecules can be introduced into the gel.
- molecules may be elongated by pressing the nucleic acid/molten gel composition under, for example, a teflon stamp, as described in Section 5.4, below.
- An electrical force may, additionally, be generated via any standard electrophoretic method, including, for example, pulsed field ( U.S. Patent No. 4,695,548 ) and pulsed oriented (POE) electrophoresis.
- pulsed field U.S. Patent No. 4,695,548
- POE pulsed oriented electrophoresis
- devices which are suitable for visualization by microscopy techniques are preferred.
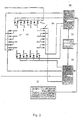
- One such embodiment is the miniature POE device shown in FIGS. 1 and 2 and in Example 4, below.
- POE improves separation of polydisperse polymer molecules in a sample by using short electric pulses to create and vary field angles, with the effective field angle being defined by the vector sum of a series of pulses which may vary in duration, intensity and direction. Pulse times and pulse intensities are modulated to effect separation. POE is also useful for creating effective field angles during imaging. The needed instrumentation is readily adapted to the microscope.
- FIG. 1 An exemplary laboratory instrument for POE is illustrated in FIG. 1 and a schematic view is shown in FIG. 2.
- the instrument exemplified in FIG. 1 is similar to a miniature version of that described in U.S. Patent No. 4,473,452 , but differs in that the POE instrument has two sets of diodes 34 which enable bipolar operation of the discrete electrode array.
- the diodes 34 can be replaced by a multiganged relay (not shown) to provide similar electrical isolation. However, it is best to use the diodes 34 when very fast (less than 1 second) pulsing is needed.
- the miniature electrophoresis chamber 50 used in this invention measures about the size of a standard coverslip. It has electrodes 42', which are connected to diodes 34 (FIG. 2). In order to generate the desired electric fields, platinum electrodes 42' are interconnected as shown in FIG. 2.
- d-c power supply 28 supplies d-c power to relays 30, which are controlled by a computer 32 to connect selected outputs to the d-c power from power supply 28. Computer 32 also controls d-c power supply 28 so that the potential of the power supply can be varied.
- Outputs to relays 30 are connected to electrodes 42' through respective diodes 34 for each electrode.
- the miniature POE apparatus has a holder 52, which fits on a microscope stage.
- a slide 54 which holds an agarose gel, is placed into the holder and the electrodes 42 make electrical contact with the slide/gel/cover-slip sandwich placing drops of 30% glycerol-agarose at the agarose electrical connecting wicks 44.
- the glycerol prevents drying out of the gel.
- the electrical connector 46 which is part of the holder 52, provides a link to the bipolar diodes 34 and pulsing instrumentation shown in FIG. 2.
- the presently exemplified instrument generates electrical fields which are orthogonal to each other, which alternate between high and low intensities out of phase with each other according to the chosen pulsing routine as described below and which translate the molecules undergoing separation incrementally through the gel matrix in an overall direction transverse to the respective directions of the generated electrical fields. Due to the novel bipolar nature of the electrode design, it is possible to change polarities, simultaneously if desired, in addition to alternating high and low intensities without any significant electrode induced field distortions.
- gel-based techniques can successfully analyze single nucleic acid molecules ranging in size from approximately 20 kb up to chromosome-sized (i.e. , greater than 1000 kb).
- techniques for the preparation of the single nucleic acid molecules to be elongated should be chosen which avoid excessive shearing.
- Such techniques are well known to those of skill in the art and may include, for example, techniques such as those described below.
- agarose-embedded cell lysate techniques such as those described in U.S. Patent No. 4,695,548 , for preparing large DNA molecules without breakage can be adapted for use with the gel-based elongation techniques of the present invention.
- cells may be washed, mixed with molten low melt agarose, which is then allowed to harden.
- the resulting block is then placed into a lysis solution containing EDTA, protease and detergent, which diffuses into block, lysing the cells and rendering intact naked DNA molecules stripped of their associated proteins.
- the absence of physical manipulation keeps the DNA essentially intact.
- the agarose can then be melted and subjected to external elongating forces such as those described above.
- chromosomal DNA can first be resolved into chromosomal populations via standard methods such as, for example, pulsed field electrophoresis.
- the resolved DNA populations which may, for example, consist of populations of copies of the same chromosome, can then be subjected to the gel-based elongation methods described above.
- a condensation agent may be used to collapse gel-bound nucleic acid molecules into small, shear-resistant balls, that can be unfolded with the addition of an ionic compound, such as, for example, sodium chloride or magnesium chloride, when appropriate.
- the condensation agent is spermine.
- the spermine protocol which is described further in Example 10, permits the mounting of extremely long DNA molecules with no detectable shear-mediated breakage. Nucleic acid molecules of extremely long length ( i.e. , about 5.6 Mb) have been successfully condensed by such a technique with no appreciable shearing. In fact, it is conceivable that any size of nucleic acid can be inserted into a gel with no substantial shearing.
- spermine While the use of spermine is preferred, other suitable materials for collapsing such nucleic acid molecules include any material which can cause a particular nucleic acid molecule to collapse, e.g., any condensation agent which causes nucleic acid molecules to preferentially solvate themselves. Additional examples of such materials include, but are not limited to, spermidine, alcohol and hexamine cobalt.
- Spermine-condensed DNA can be added to molten agarose, decondensed, and elongated according to the techniques described herein. Further, large nucleic acid molecules may initially be separated electrophoretically using, for example standard pulsed field electrophoresis techniques. The portion of the gel containing the separated molecules of interest may then be excised.
- the excised portion of the gel can then be used as part of the gel-based techniques of this Section. Additionally, nucleic acid molecules in solution can be gently mixed with a molten agarose solution and utilized as part of the techniques of this Section.
- Solid surface-based techniques can be utilized for the rapid, controllable and reproducible elongation and fixation of single nucleic acid molecules, as described in this Section. Upon elongation and fixation of the single nucleic acid molecules onto the solid surfaces as described herein, any of the analysis and/or manipulation techniques discussed, below, in Section 5.3, may easily be performed.
- Such solid surface-based elongation/fixation techniques yield a number of advantages for single nucleic acid analysis/manipulation applications.
- the nucleic acid molecule images are very sharp and bright. This is due, in part, to the absence of gel-based image scattering, and to less extraneous fluorescence background in the field.
- fixation techniques can be more precisely controlled and may, for example, be made somewhat tighter than those described, above, in Section 5.1.1, for gel-based techniques.
- the solid surface-based techniques described herein make possible the rapid generation of high resolution nucleic acid analysis information from single nucleic acid molecules, including single nucleic acid molecules of much shorter lengths than currently available using the gel-based techniques described, above, in Section 5.1.1.
- a wide size range of nucleic acid molecules i.e. , from about 300 bp to mammalian chromosome-size (that is greater than 1000 kb) can efficiently be elongated and stably fixed onto the solid surfaces described herein.
- These techniques feature gentle fixation approaches which maintain the biological function of the nucleic acid molecules being elongated and, further, allow for the manipulation and/or accurate analysis of the elongated single nucleic acid molecules.
- the solid surface-based techniques described herein make possible the storage and reuse of the elongated nucleic acid molecules. Further, such solid surface-based techniques described herein can easily be adapted for high throughput methods, as described in Section 5.4, below.
- the elongation procedures described in this Section utilize solid surfaces which exhibit a positive charge density, as described, below, in Section 5.1.2.2, below. As discussed, below, in Section 5.1.2.1, however, the density of the solid surface positive charge must be optimized to achieve a balance between elongation, relaxation, stability and biological activity parameters.
- the controlled, reproducible solid surface elongation/fixation techniques described herein utilize surfaces, especially glass surfaces, which reproducibly elongate and fix single nucleic acid molecules.
- the surfaces described herein exhibit a positive charge density.
- the solid surfaces of the invention should exhibit a positive charge density which achieves an optimal balance between several parameters, including elongation, relaxation, stability and biological activity. Assays are described in this Section which make surface optimization possible.
- the solid surface must allow the molecule to be as completely elongated as possible, while allowing for a small degree of relaxation.
- small degree of relaxation refers to a level of relaxation which yields a gap of between about 0.5 microns and about 5.0 microns when the elongated nucleic acid molecule is cut.
- An optimal balance between these two parameters yields improved imaging capability. For example, an efficient balance between elongation and relaxation capability facilitates the imaging of newly formed, growing gaps as they develop at restriction enzyme cleavage sites.
- the biological activity retained by the elongated nucleic acid molecule must be taken into account when optimizing the positive charge density of the elongation/fixation solid surface. Further, the stability of the elongated nucleic acid molecules on the surface must be considered. In the case of a restriction digest ( i.e. , as part of an optical mapping procedure), "stability" refers to how well the restriction fragments formed are retained on the solid surface.
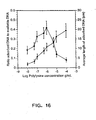
- the positive charge density (e.g. , the level of surface derivatization; see Section 5.1.2.2, below) may be titrated against the measured average molecular length of the nucleic acid molecules which are deposited on the surface. Molecule counts (i.e. , the number of countable molecules which have been deposited) on the surface can also be measured.
- the average molecular extension on the surface is low. This may be due to the fact that, at this charge concentration, not enough nucleic acid binding sites exist to hold an extended molecule with stability. As the positive charge density (e.g. , the level of derivatization) increases, the average nucleic acid molecular extension also increases, eventually peaking. As the positive charge density (e.g. , the amount of derivatization) continues to further increase, the average amount of molecular extension then begins to decrease. This may be due to the presence of such an abundance of nucleic acid binding sites that any flow forces which are present and would drive elongation are overwhelmed and, therefore, molecular extension is, to some extent, quenched.
- positive charge density e.g. , derivatization
- the elongation parameters must be tested within the context of the specific imaging or analysis procedure for which the single molecules are to be used. Such testing involves an evaluation of the biological activity of the nucleic acid molecule as well as a determination of the relaxation level of the elongation nucleic acid. For example, in instances whereby the elongated nucleic acid molecules are to be used for optical restriction mapping, the level of elongation/fixation must allow for cutting by the restriction enzyme as well as providing a level of relaxation which makes possible the ready imaging of nascent restriction enzyme cleavage sites.
- a positive charge density e.g. , a derivatization level
- one such test would include the digestion of the elongated nucleic acid molecule and a determination of, first, the enzyme's cutting efficiency, and, second, a measurement of the size of the nascent gap formed at the new cleavage sites (thus measuring relaxation).
- a cutting efficiency of at least about 50% is an acceptable level of biological activity retention. Acceptable relaxation levels are as described above.
- stability refers to the retention level of newly formed restriction fragments on the surface.
- an acceptable stability level is one in which at least about 80% of the newly formed restriction fragments.
- Solid planar surfaces may be prepared for optimal elongation and fixation of single nucleic acid molecules via a variety of simple manipulations.
- the surfaces may be derivatized to yield a positive charge density, which can be optimized by utilizing the assays described in Section 5.1.2.1, above.
- simple manipulations may be performed to reversibly modulate the surface positive charge density to more precisely optimize surface charge density at each step of the nucleic acid elongation, fixation analysis and/or manipulation steps.
- Such reversible charge density modulation is referred to herein as "facultative fixation", as discussed below.
- additional methods for further affecting the elongation/fixation of the single nucleic acid molecules are discussed. These include, for example, methods for controlled drying, for the generation of gradients of positive charge density and for crosslinking of the elongated nucleic acid molecules.
- Surfaces may be derivatized using any procedure which creates a positive charge density which, presumably, favors an interaction with a nucleic acid molecule. Any compound which absorbs to or covalently binds the surface of interest and, further, introduces a positive charge density onto the surface can be utilized as a derivatizing agent. Such compounds should not, preferably fluoresce.
- surfaces may be derivatized with amino moiety-containing compounds that absorb to or covalently bind the surface of interest.
- Such amino-containing compounds can, for example, include amino-containing silane compounds, which are capable of covalently binding to surfaces such as glass.
- amino-containing silane compounds are 3-aminopropyltriethoxysilane (APTES) 3-methylaminosilane.
- APTES 3-aminopropyltriethoxysilane
- APTES can be useful in that it may be crosslinked, while the use of 3-methylaminosilane may, in certain instances, be advantageous in that the compound resists oxidation.
- poly-D-lysine poly-D-lysine
- Polylysine binds glass via electrostatic interactions.
- Polylysine may be especially advantageous for pressure-based elongation techniques (see Section 5.1.2.3, below).
- the size of the polymeric polylysine is to be taken into account.
- low molecular weight polylysine e.g. , mw less than 200,000; with about 90,0000 being preferred
- appears to fix elongated nucleic acids more tightly than high molecular weight polylysine e.g.
- mw greater than 200,000, with 500,000 being preferred.
- a low molecular weight polylysine would be preferred for tighter fixation, e.g. , for the fixation of smaller nucleic acid fragments.
- Surface derivatization may be achieved by utilizing simple, reproducible techniques.
- a clean surface such as a glass surface, may be incubated in an acidic APTES solution for a given period of time. Increasing the incubation time will increase the resulting charge density of the surface. It is preferred that conditions should be chosen such that the single nucleic acid molecules are elongated to approximately 50-100% of their polymer contour length.
- a clean glass surface can be incubated for an appropriate period of time in an APTES concentration of about 0.10 M, pH 3.5 at a temperature of about 65° C. Incubation times for such an embodiment can range from about 3 to about 18 hours.
- the surfaces need only be removed from the APTES solution and repeatedly rinsed in highly pure water. The clean, derivatized surfaces are then air dried.
- a clean surface such as a glass surface
- a polylysine solution can be derivatized in a polylysine solution.
- concentration and molecular weight of the polylysine used for derivatization affect the level of derivatization achieved per incubation time. Increasing the polylysine concentration increases the resulting surface charge density which forms.
- conditions should be chosen such that single nucleic acid molecules are extended up to about 100% of their polymer contour length.
- a clean glass surface can be incubated overnight, at room temperature, in a solution of polylysine having a molecular weight of about 350,000, at a concentration of about 10 -6 to 10 -7 grams per milliliter. After incubation, the derivatized glass surface is rinsed in highly pure water and either air dried or wiped dry with lens tissue paper. Such conditions are expected to achieve nucleic acid elongation levels which are suitable for, say, optical restriction mapping.
- a positive charge density may be introduced onto a surface by a number of alternate means.
- Such a positive charge density may, for example successfully be applied to a surface via plasma derivatization, an electrostatic generator (to create electrical charge) or corona discharge, just to name a few.
- Described herein are methods for the reversible modulation of solid surface positive charge density. Such methods are designed to optimize solid surface charge density at each step of the elongation, fixation and analysis/manipulation steps described herein.
- Such methods include changes in the salt concentration, divalent cation concentration, effective water concentration, and/or pH.
- the surface positive charge density can be tailored to suit each step of the single nucleic acid techniques described herein. For example, it may be desirable to fix the nucleic acid molecule under reversible conditions which favor a loose charge density, leading to a higher degree of nucleic acid molecule spreading. The charge density may then, for example, be increased for a restriction digest step. Additionally, it may be desirable to digest a molecule so tightly fixed that no relaxation gaps form upon cleavage and then to subsequently lower the charge density such that the gaps are allowed to form. Finally, a very high charge density may then be chosen if the sample is to be stored ( i.e. , such that the newly formed restriction fragments do not detach from the surface during storage).
- the surface positive charge density decreases.
- divalent cation e.g. , Mg 2+ , Ca 2+
- the surface positive charge density decreases.
- the effective water concentration is decreased, due to the addition of an increasing concentration of non-aqueous material, the surface positive charge density increases.
- Changing the pH represents a gentle and fast method to reversibly modulate the charge density of a surface.
- a low pH promotes positively charged environment, while a high pH promotes a less positively charged, more neutral environment.
- an aminosilane compound for example, a pH of approximately 6 yields a positive charge density. Raising the pH lowers the charge density until the charge is essentially neutral at a pH of 9-10.
- a variety of simple methods may be utilized to produce pH-based facultative fixation.
- the surface can be exposed to buffers, such as Tris or phosphate buffers, of varying pH.
- buffers such as Tris or phosphate buffers
- gas-induced pH changes can be made.
- CO 2 gas can be introduced over the buffer in which the derivatized surface is submerged such that the buffer is acidified, thereby increasing the overall charge density on the surface.
- ammonia gas may be introduced over the buffer, raising the buffer pH, thereby lowering the overall surface charge density.
- Derivatization gradients In addition to a uniform, controllable derivatization of an entire solid surface, it is also possible to reproducibly form a gradient of derivatization.
- a derivatization gradient can be formed by, for example, the use of drops of derivatizing agents deposited on the solid surface. Upon deposition, such a drop would form a meniscus, leading to a greater concentration of derivatizing agent available to the solid surface at the perimeter of the drop than within its interior section. This, in turn, leads to a gradient.of derivatization, with the outer portion of the solid surface where the drop had been exhibiting a higher level of derivatization than that within the interior.
- the single elongated nucleic acid molecules of the invention may, additionally, be crosslinked to the solid surface.
- Such crosslinking serves to permanently fix the molecules to the surface, which can be advantageous for a variety of reasons.
- crosslinking may be useful when working with very large nucleic acid molecules.
- the surface properties of the solid may be modulated with no possibility-of nucleic acid loss. Additionally, the possibility of unacceptable nucleic acid fragment loss or relaxation which could occur over the course of, for example, storage or a long reaction, would not exist with crosslinking.
- Crosslinking is to be performed in conjunction with the elongation/fixation techniques described in these Sections. First, the desired level of elongation is determined and achieved, and subsequent to this, the elongated nucleic acid is crosslinked for permanent fixation.
- Glutaraldehyde crosslinking may be performed using, for example, a 5 minute incubation in a 10 mM glutaraldehye solution.
- UV crosslinking may be accomplished using, for example, a Stratalinker (Stratagene) crosslinker, following standard protocols.
- Additional compounds may be added to the aqueous solution by which the nucleic acids may be deposited onto the solid surfaces (see below for deposition techniques) which yield drying characteristics that promote the production of a greater percentage of fully elongated nucleic acid molecules and which exhibit a lower level of intermolecular overlap or tangling, both features of which are extremely useful for analysis purposes.
- Compounds which may be added for such a controlled drying aspect of the elongation methods include, but are not limited to glycerol, DMSO, alcohols, sucrose, neutral polymers such as Ficoll, and dextran sulfate. While their mechanism is not known, it is possible that these compounds promote a liquid crystalline state which promotes the above-described features.
- Hydrophobic microwells may be introduced onto portions of the solid surfaces which can serve as, essentially, "microwells". These hydrophobic regions create closed boundaries, which make possible the introduction of different reagents onto different portions of the solid surface, such that a number of different reactions may be performed simultaneously on the same solid surface.
- the solid surfaces of the invention may be prefixed with agents, proteins for example, of interest, prior to the introduction of the nucleic acid molecules to be elongated. Proteins may be fixed onto the solid surfaces by routine means, such as crosslinking means, which are well known to the skilled artisan.
- proteins which may be prefixed onto the solid surfaces of the invention are enzymes, such as restriction enzymes, which are used to manipulate nucleic acid molecules or any other nucleic acid-binding proteins.
- nucleic acid molecules upon elongation of nucleic acid molecules onto the solid surfaces containing such prefixed enzymes and the addition of whatever additional agents, such as certain divalent ions, which are necessary for the enzymes to act upon nucleic acids, the single nucleic acid molecules can be manipulated, e.g. , cleaved at appropriate restriction sites. Using such a prefixation technique, a number of different reactions may be performed simultaneously on the same surface.
- nucleic acid molecules may be deposited onto the derivatized solid surfaces described herein. Specifically, nucleic acid molecules from about 300 base pairs to greater than 1000 kb can be analyzed using such solid surfaces. Smaller nucleic acid molecules, which are relatively shear resistant, can be isolated using standard nucleic acid purification techniques well known to those of skill in the art. These smaller nucleic acid molecules may be less than about 150 kb and, generally, are less than about 20 kb. Larger nucleic acid molecules, which are subject to breakage by shearing events, can be isolated by utilizing, for example, the nucleic acid molecule isolation techniques described, above, in Section 5.1. Such shear-sensitive nucleic acid molecules are generally greater than 150 kb, but may include molecules greater than about 20 kb.
- nucleic acid molecules i.e. , those greater than about 90 kb
- these larger nucleic acid molecules are deposited onto the surfaces in molten agarose.
- molten agarose containing nucleic acid molecules can be spread onto surfaces under conditions which generate a flow force that facilitates elongation.
- drops or droplets of molten agarose containing nucleic acid molecules are deposited onto the surface. The force generated when the drop hits the surface is sufficient to provide the required elongation.
- the agarose is scraped off the surface, leaving behind intact, elongated, fixed nucleic acid molecules.
- nucleic acid molecules i.e. , ones ranging from about 300 bp to about 90 kb
- the above gel techniques can be utilized.
- the nucleic acid molecules can be deposited onto the surface in an aqueous solution. Elongation can then be achieved via various methods. For example, molecules can be sandwiched between two surfaces, one of which is the derivatized surface. In such a procedure, one of the two surfaces should contain a hole through which reagents may be introduced.
- the solution on the derivatized surface containing the nucleic acid molecules can be pressed with, for example, a teflon stamp.
- the nucleic acid molecules deposited in such an aqueous fashion can be elongated by merely allowing the aqueous solution to dry.
- single nucleic acid molecules can efficiently, successfully and rapidly generate stably elongated and fixed nucleic acid molecules suitable for imaging and/or further manipulation.
- such a technique is especially suited to high throughput analysis techniques.
- the single nucleic acid molecules of the invention may be elongated manipulated and/or analyzed in flow-based techniques such as those described in this Section. Such techniques may be especially useful in instances whereby only low concentrations of the nucleic acid molecules of interest are available.
- such a flow-based technique involves the introduction of a single nucleic acid molecule into a laminar flow elongation device.
- Gentle solvent flow fields are generated within the device which cause the nucleic acid molecules to be elongated without significant shearing.
- the elongated nucleic acid molecule flows through the laminar flow elongation device, it can be imaged via, for example an attached microscope and camera.
- the methods described herein make possible the controlled, regio-specific restriction digests of the elongated nucleic acid molecules which, coupled with the flow aspect of the device, makes possible the generation of real-time restriction maps.
- FIG. 25 A preferred embodiment of such a laminar flow elongation device is illustrated in FIG. 25.
- a laminar flow elongation device which is designed to liberate and elongate nucleic acid molecules out of gel inserts, comprises a laminar flow chamber to which are attached an extraction area and a viewing/manipulation area. While the device diagrammed in FIG. 25 depicts a single laminar flow chamber, a multiplexing laminar flow elongation device may also be utilized. Such a device may contain, for example, a branched laminar flow chamber, such that multiple analyses of copies of identical single nucleic acids can be accomplished rapidly.
- the laminar flow chamber should contain a thin space, for example, a space generated via a 10-20 micron opening.
- the solvent flow generated within the chamber should be gentle enough to avoid significant shearing of the nucleic acid molecules. For example, one acceptable flow would be approximately 5 x 10 -2 nl/sec at 100 x 20 micron opening.
- the fluid flow may be generated by a pumping means attached to the chamber upstream of the extraction and the viewing/manipulation areas or, alternatively, may be generated by a vacuum means attached to the chamber downstream of the extraction and the viewing/manipulation areas.
- the extraction chamber through which the laminar flow chamber passes, serves to simultaneously liberate the nucleic acid from a gel insert and to move the nucleic acid into the flow of the device.
- Such an extraction chamber comprises electrodes which set up an electric field through which the nucleic acid moves out of the insert and into the flow of the laminar flow chamber.
- the viewing/manipulation chamber comprises a microscope/light source mounted chamber through which the laminar flow chamber passes.
- the microscope is preferably an epifluoresence microscope containing an oil immersion objective, to which is attached a camera, preferably a video camera.
- the elongated nucleic acid molecules can be visualized and, optionally, their images can be recorded, as the molecule passes through the viewing/manipulation chamber.
- the nucleic acid molecules are enzymatically manipulated as they pass through the viewing/manipulation chamber.
- the elongated, flowing nucleic acid molecules can be digested with restriction enzymes as they pass through the viewing/manipulation chamber.
- the fluid in the laminar flow chamber can contain restriction enzymes and each of the reagents necessary for digesting the nucleic acid molecule flowing through the chamber, except that the divalent cation (usually Mg 2+ ) which is necessary for enzyme activity is present in a reversibly chelated form.
- the nucleic acid is protected from digestion until the divalent cations are liberated.
- a light-inactivated chelator such as, for example, DM-nitrophen, as described below in Section 5.3, the cations can be released within the viewing/manipulation chamber as the fluid passes through the microscope light source.
- the nucleic acid molecule first becomes subject to digestion as it passes through the viewing/manipulation chamber. Further, as digestion occurs, the flow maintains the order of the resulting restriction fragments, which are imaged and which, therefore, instantly produce restriction maps which have been generated in real time.
- An example of such a photo-inactivated chelator is described, below, in Section 5.3.
- elongated and possibly fixed single nucleic acid molecules can be imaged and sized using a number of different techniques to obtain estimates of various molecular parameters of interest.
- molecules being imaged are first stained with fluorochromes which are absorbed by the molecules generally in proportion to their size.
- Digital images of the molecules are next generated for subsequent processing.
- the size of the imaged molecules can be determined from measurements of the fluorescent intensity of the molecule when it is illuminated with an appropriate light source, from measurements of the contour of the digitized molecule, or from the dynamics of molecular relaxation measured using a series of digitized images.
- the first processing step in accordance with the present invention is to stain the molecules of interest in order to make them available for subsequent imaging.
- the following table summarizes fluorochromes used in a preferred embodiment of the present invention for imaging purposes. Fluorochromes Excitation max Emission max A) DNA counter stains (PI) 330 and 520 620 DAPI 350 460 Hoechst 33258 360 470 Quinacrine 455 495 Chromomycin 430 470 B) Hybridization site labels FITC 490 520 TRITC 554 573 XTRITC 580 600 TR 596 620 AMCA 350 450 CY5 c 646 663
- molecules can be imaged using fluorescent beads and chemiluminescent tagging employing alkaline phosphatase.
- fluorescent beads including the smallest ones with a diameter of just 0.01 microns are easily imaged with fluorescence microscopy.
- Fluorescent beads provide a reliable way to label single DNA molecules for image processing purposes because individual beads are intensely fluorescent, morphologically distinctive, available in wide range of fluorochromes of differing spectral qualities, and are easily attached to oligonucleotides. (It should be noted, however, that in practice, if the Rayleigh limit is exceeded a bead would appear as a bright spot which is inadequate for image processing).
- Latex beads are sold, for example, by Molecular Probes, Inc., and are available with coatings of carboxylate, avidin or streptavidin in six spectral ranges (colors) and sizes varying from 0.01 to 2 microns. Carboxylate modified and streptavidin coated beads provide a number of alternatives for binding the beads to DNA molecules.
- synthesizing oligonucleotides can be covalently attached to a series of differently sized fluorescent beads (0.01-0.05 microns) to optimize RARE conditions.
- RARE stands for RecA-assisted restriction endonuclease.
- the RARE technique is described in more detail in Section 5.3.1. Briefly, this technique involves the generation of restriction endonuclease cleavage events that occur solely within the specific hybridization product). Smaller beads are generally preferable because they diffuse more readily through agarose gel. On the other hand, larger beads are easier to derivatize due to their larger surface area. Fluorescent beads of similar size can be imaged electrophoresing through gels by fluorescence. Forming RecA filaments using these modified oligonucleotides and assaying their formation by functionality in a RARE test system can also be used for imaging purposes.
- Chemiluminescent labeling of oligonucleotides for non-isotopic detection in Southern blots is a popular labeling technique especially because of its high sensitivity.
- the method consists of attaching alkaline phosphatase to oligonucleotides (using commercially available systems), and then hybridizing to target DNA.
- a chemiluminescent substrate is added, usually 1,2 dioxetane, which rapidly decomposes into a chemiluminescence generating compound.
- Light is next emitted with a maximum at 470 nm and a half life of 2-30 minutes, depending upon the chemical environment.
- chemiluminescence can be used in accordance with the present invention to optically detect RARE on single DNA molecules.
- alkaline phosphatase can be covalently linked to oligonucleotides or DNA can be linked a to biotin-streptavidin attachment.
- the conjugated oligonucleotides are then formed into RecA filaments and tested for RARE effectiveness.
- Excess biotinylated alkaline phosphatase can be easily dialyzed out of the system to reduce stray chemiluminescence using biotin-streptavidin mediated alkaline phosphatase linkages.
- a chemiluminescent detection system can be used with RARE and basic optical mapping.
- the RecA-oligonucleotide (linked to alkaline phosphatase)-target DNA complex is placed in molten agarose gel and then mounted for optical mapping.
- dioxetane is diffused in a preferred embodiment, as required by the chemiluminescence system for visualization of RARE sites.
- the chemiluminescence activity can then be visualized through a microscope using an ICCD camera, with no illumination necessary.
- DNA-fluorochrome fluorescence and different fluorochromes can be used if the initial compounds quench or interfere with chemiluminescence.
- an alternative approach to molecular imaging is to use energy transfer between the fluorochrome-labeled DNA and a bead attached to the oligonucleotide. Excitation can be selected to make the DNA-fluorochrome complex the donor and the bead the acceptor. In this case the bead could fluoresce only when it is within 100 angstroms or less of the donor, however, the efficiency of energy transfer falls off rapidly with distance. Energy transfer imaging using fluorescence microscopy with different microscope filter combinations allows visualization of the donor, acceptor, and the donor-acceptor pair; these are conveniently slid in and out of the illumination path.
- a good energy transfer donor to use is ethidium bromide or homodimer, since these fluorochromes bind tightly and the fluorescence yield increases dramatically upon binding. It should be noted that a potential problem using this method is that free fluorochrome can act as a donor, though probably not an effective one. If the presence of free chromophore does in fact become a problem, the filament being imaged can be split into two parts and fluorescent beads can be attached in a head-to-head configuration to serve as an acceptor-donor pair for energy transfer imaging.
- Another concern when using this method is that latex beads are prone to aggregation.
- This problem can be solved using an appropriate selection of chromophores as provided by, for example, Molecular Probes, Inc., Portland, Ore. Additional measures to be used against aggregation include maintaining some charge on beads through careful attention to ionic strength, and use of Triton X-100 detergent or BSA.
- the molten RecA-bead-DNA mixture is stained with 6-diamino-2 phenylindole dihydrochloride (DAPI) and spread on a microscope slide for optical mapping.
- DAPI 6-diamino-2 phenylindole dihydrochloride
- length and intensity measurements are used to map the bead positions, as discussed in the following sections.
- "Red" beads such as those supplied by Molecular Probes, Inc., can be used to provide contrast to DAPI's blue fluorescence.
- RecA filaments A large number of labeled RecA filaments can become another concern in optically based methods, because too many free fluorescent beaded filaments can obscure imaging beads present in the complex with target molecules.
- the following steps can be taken to eliminate this problem, if it occurs:
- nucleic acid molecules are broadly classified into two groups: (a) techniques in which the measured molecule remains static during the measurement period; and (b) techniques in which the size of the molecule is determined using dynamic measurements that require molecular perturbation.
- Static sizing techniques in accordance with the present invention generally include measurements of the relative fluorescence intensity of imaged molecules and measurements of their apparent length. Static sizing is convenient to use because it does not require very sophisticated equipment and is well suited for high-throughput parallel measurements. (See Section 5.4). On the other hand, dynamic, or perturbation-based sizing techniques, while at present being less suited for high-throughput measurements, sometimes provide superior results in terms of information content, precision and resolution.
- Static molecular sizing techniques are based on fixing the molecule to be measured on a plane surface, staining it with fluorescent dye, obtaining an image of the molecule and measuring parameters of the imaged molecule which have known correlation to the parameters of interest.
- molecules to be sized are first elongated and fixed on a plane surface using any of the methods described in Section 5.1 above. Restriction enzymes can also be added, if required, to enable the digestion of the fixed molecule. In such case, magnesium ions are diffused in, triggering digestion, after which restriction sites can be visualized as growing gaps in the elongated DNA molecules. This imaging approach is simple, effective, and has excellent sensitivity, since molecules can be visualized directly.
- the molecules are elongated and fixed using the spotting approach described in more detail in Section 5.4, in which small droplets of solution are deposited in a regular grid manner onto a plane derivative surface and let dry. As shown, for example, in Fig. 26 A, B and C, after a spot dries, molecules remain elongated and fixed onto the surface in a "sunburst" pattern.
- molecular sizing can be performed using measurements of the intensity of fluorescently stained molecules. This measurement approach is based on the observation that the size of a molecule is proportional to the amount of fluorescent dye it can absorb, which amount can be estimated by imaging the molecule. In a specific embodiment, the amount of fluorescent dye, and thus the size of the molecule, is determined using a measurement of the absolute fluorescent intensity. In this approach, however, the illumination source has to provide very stable and reproducible light output for the measurements to be accurate.
- the size of the molecule is preferably determined by measuring its relative intensity compared to the intensity of a standard, i.e., a molecule of known size within the image field.
- a standard frequently consists simply of a portion of the imaged molecule.
- the accuracy of fluorecscence intensity sizing can further be increased by providing a series of standards of different sizes and comparing the measured molecule to each individual standard.
- the size of the molecule being measured can thus be determined by combining all congruent size measurements, i.e., homologous restriction fragments within different molecules, and averaging the results. As known in the art, this operation reduces the standard deviation of the sizing error in proportion to the square root of the number of measurements taken.
- restriction enzymes can be used to cleave a known molecule into a sequence of fragments with physical dimensions which can be known to within a single base pair.
- a relative intensity sizing measurement involves obtaining of a digital image of the molecule being sized and of a standard, as defined above.
- High resolution i.e., 1K x 1K images with 16 bit gray level resolution are used in a preferred embodiment. If necessary, flat field correction of the digital image can be used to equalize the illumination intensity level over the image field.
- the method further involves the following steps: applying median filtering or an equivalent filtering operation to remove spot noise, if necessary; thresholding the resulting image to obtain binary images corresponding to the contours of the imaged molecules; applying background correction to remove the pixel intensity which corresponds to the background level of illumination for the image field; and measuring the relative intensity of the molecules to be sized with respect to the intensity of the known standard. More specifically, the intensity of the molecule to be sized is measured by adding the intensities of all pixels within the molecular contours obtained in the binarization step. Comparing the intensity measurement of the molecule being sized to the intensity of the standard(s) determines the relative molecular size. Thus; if the underlying size of the standard is known, the absolute size of the molecule can be determined directly.
- the functional relationship between the relative image intensities and the molecular mass is approximately linear ( i.e. , the relative intensity is proportional to M 1 ).
- a drawback associated with the relative intensity sizing approach of the present invention is that, depending on the fixation, the measurement errors often tend to be absolute instead of being relative. This means that, for example, a 20 kb standard deviation applies to a 60 kb fragment as well as to a 900 kb sized one. In other words, the coefficient of variation (the ratio between the mean size and the estimated standard deviation) can vary enormously and, as a result, the accuracy of measuring small fragments is reduced disproportionately compared to measuring larger fragments.
- the use of improved fluorochromes and better camera equipment, as described in Section 5.4 next, can help alleviate this problem.
- the lower size limit of the relative intensity optical mapping is about 300 bp, which limit can further be extended to smaller fragments by using sample averaging over a series of identical measurements.
- the accuracy of the method using fluorescence microscopy of DNA fragments can be increased to a single bp.
- sequence-specific fluorochromes such as DAPI (which prefer AT sequences) or ethidium bromide (which favor GC regions)
- DAPI sequence-specific fluorochromes
- ethidium bromide which favor GC regions
- another way of measuring the size of static nucleic acid molecules is to image the molecules and estimate their contour length by measuring the length of the corresponding digitized images. As discussed below, the length of an imaged molecule provides an adequate estimate of the size of the molecule.
- Morphological processing in the context of this invention refers to operations where the imaged molecule is represented as a set of structural elements, such as lines and arcs, and thereby can be represented by a simplified but more revealing shape.
- the parameter of interest is the length of the imaged molecule which may not be entirely stretched.
- algorithms known as "thinning" can be used to reduce the imaged molecule into a set of simple digital lines and arcs, which lie roughly along the medial axes of the molecule.
- the medial axis of an object is defined as the set of points which are equidistant from the nearest boundary point of the object).
- the digital image of a molecule being sized can be thinned using an image processing operation known as erosion, which consists of deleting border pixels that have more than one neighbor pixel which belongs to the object.
- erosion an image processing operation known as erosion, which consists of deleting border pixels that have more than one neighbor pixel which belongs to the object.
- the apparent length of the imaged molecule is next used to derive additional molecular parameters of interest by comparing it, for example, to the length of a known standard.
- the length of the digital image of the molecule can be converted directly to kb measurements.
- Contour length measurements have been found in some cases to be more accurate than the relative intensity measurements described in section 5.2.2.1.1 above, especially for small size molecules.
- fluorescence microscopy can image single polymer molecules stained with an appropriate chromophore and provide a distinguishable outline of the molecule being imaged.
- the molecular diameter dimension may only be about 20 angstroms, single molecules can still be visualized easily on the basis of their apparent contour.
- the intensity of the fluorescent light from the molecule may not be sufficiently distinguishable from the background intensity, in which case the relative intensity measurement method will give less accurate results.
- size measurements using the contour length approach vary approximately linearly (i.e. , proportional to M 1 ) and are less sensitive compared to the dynamic measurement methods discussed below, which can have M 1.5-3.3 .
- molecular measurements using static approaches are particularly suitable for high throughput systems and can be used for fast sizing and ordering of DNA fragments, such as restriction digests, as described in detail in Example 10, since the measurement time is essentially limited to the length of the imaging process.
- static measurements are simple to implement because they do not require complex molecular perturbation techniques, and require no specific flow and/or electrical field arrangements.
- image measurements can be performed using digital images having 16 bit gray level resolution.
- the original raw digital image is displayed in an enlarged format using, for example, pixel replication, and an overlay image is prepared by manually tracking the DNA contour.
- the contour length map in accordance with the embodiment described in Section 5.2.2.1.2. above can be prepared from this overlay directly.
- the fluorescence intensity measurement approach (Section 5.2.2.1.1.)
- the 13-bit raw image data is smoothed and the overlay image is dilated five times to cover all foreground pixels.
- a synthetic background level is calculated as the weighted average of the surrounding pixels, with weight factors decreasing with distance, and equal to zero for the marked pixels.
- a 3x3 or a 5x5 window can be used for this purpose, with coefficients determined to add up to unity, as known in the art.
- the intensity of a particular molecule or DNA fragment can be determined by subtracting the sum of the matching background pixel intensities from the sum of all pixel intensities which belong to the fragment. This measurement can be repeated for each frame of raw image data that had an overlay image, excluding those frames with poorly focused images. To increase the accuracy of the experiment, intensity measurements are averaged over several images (e.g., over 5 images). The same measurement approach can also be used to measure the relative sizes of two different fragments.
- fragment u u / u + v ⁇ y / x + y ;
- the relative size of each segment is computed in accordance with the present invention analogously as the ratio of the segment measurement (x) over the sum of all fragment measurements.
- OCM Optical Contour Maximization
- the OCM molecule sizing method of the present invention is based on the observation that when a linear DNA molecule snags an obstacle during electrophoresis in a loose gel matrix it elongates nearly completely to form a metastable hook that can persist for several seconds.
- Such loose matrix can be formed, for example, at the coverslip-agarose gel interface, as described in Section 5.1.1.
- the gel-coverslip interface in this case consists of a loose matrix, a few microns deep, which is ideal for OCM sizing use because it provides a convenient series of "pegs" for DNA molecules to ensnare and form hooks upon ( See Fig. 9).
- a relatively weak electrical field e.g., 5-30, volts/cm
- the hook arms are similarly sized, the molecule can be stretched out to nearly its full contour length which can then be measured easily using standard imaging techniques.
- the longest observed hook contour length is determined from a set of rapidly collected images and digitally processing the resulting images to determine the length of the molecule.
- the degree of molecular elongation using OCM is optimal.
- the maximal contour lengths determined in this method show linear correlation to the reported size in the 240-680 kb interval.
- OCM sizing accuracy and precision is very high, as good as or even better than pulsed electrophoresis based measurements.
- a disadvantage of this approach is, however, that in order to complete the measurements, a series of consecutive images must be taken in order to capture the optimum molecule elongation before it leaves the visual field due to the applied electrical field.
- Viscoelastic measurement techniques used in accordance with a preferred embodiment of the present invention are based on perturbing the coil conformation and measuring the time it takes the molecules to return to random states.
- the measured relaxation times are quite sensitive to molecular weight and vary approximately as M 1.66 . In this measurement approach, within a given size distribution the largest molecules dominate the measured relaxation, so that size mixtures typically cannot be fully analyzed.
- coil relaxation is measured in gels and in free solution for size determination of heterogeneous samples.
- fluorescence microscopy can be used to monitor coil conformational relaxation kinetics to rapidly size large single molecules (in gels).
- coil conformational dynamics can be measured in a solution, yielding reliable average molecular dimensions that can be related easily to size.
- coil relaxation can be measured in agarose using morphological image analysis.
- the coil relaxation size dependency in gels is superior to that in a solution, in particular it is proportional to M 2-3 (as predicted by reptation theory).
- DNA molecules from mammalian chromosomes can be difficult to measure because their relaxation times are extraordinarily long, even in a solution. For example, if a 100 Mb sized molecule has a measured relaxation time of over 7 hours, a whole day will be needed to collect all the necessary data. It is estimated that the relaxation times are increased 10 to 50 fold in gels as compared to solution, in which case the experiment can last several weeks or even months. In order to increase the accuracy of the measurements and speed up the experiments, typically one can perform parallel experiments which can be averaged out.
- the time to return to a random conformation can be shortened using a "twitch" technique to distort the molecule only slightly.
- the measured relaxation time using twitching has been shown to be the same as if the coil was fully distorted. Essentially, in this preferred embodiment the total relaxation time is equal to the perturbation time and thus takes much less time to measure.
- free solution measurements can be made using relatively mild electrical field strengths (40 volts/cm) to perturb conformation.
- molecules are suspended in solution, mounted on the microscope, electrically perturbed, and the resulting relaxations are monitored by fluorescence microscopy and digitally recorded by an image processor. Morphological analysis of these images can be used to track the relaxation process by automatically characterizing molecular shapes, i.e., by fitting ellipsoids around the image of the relaxing coil, as described next.
- fast coil relaxation times that correspond to Zimm-Rouse relations normally encountered in solution can be initially measured.
- L(t) in the formula above can be interpreted as the apparent molecular length as imaged by the microscope.
- Le is the equilibrium molecular tube length and is measured as a plateau region in an exponential decay. L forms the basis of the baseline sizing methodology, as discussed below.
- Image collection procedures for the visco-elastic sizing methods are virtually identical to those described in the previous sections so that the same images can be used for both length and relaxation measurements.
- the morphological analysis uses image processing routines to fit ellipsoids around the image of the relaxing coil mass.
- the associated major and minor axes of the fitting ellipsoids are used to estimate the relaxation progress.
- a set of molecules can be used to benchmark and establish relaxation dependent sizing conditions.
- Statistical analysis can be used to determine the precision and accuracy of these measurements.
- the functional dependence of the molecular size to the relaxation time is approximately M 1.5 .
- single molecule sizing can be performed using what is known as "baseline” measurements.
- baseline measurements Specifically, typical DNA relaxation plots showing apparent length versus time dependencies provide plotted points that are averages of several (usually 4-5) relaxation measurements. Such plots show that the measured length of the molecule decreases in an exponential fashion and, importantly, that the molecule does not fully relax to a spherical random conformation. Instead, a quasi-equilibrium structure is formed which resembles a thickened, short rod-like object. The formation of such object signals an end of the exponential decay. Very slow relaxation processes are still happening, but they are of a different nature and develop on a different time scale, which could be proportional to the cube of the molecular size, i.e. , to M 3 .
- relaxation measurements yield molecular size estimates in two independent ways: (1) by determination of the relaxation time, ⁇ , and (2) by length measurements for baseline determination.
- the two measurement approaches could be used simultaneously to derive different, independent estimates of the molecular size.
- the method steps above can be implemented in a specific embodiment of the present invention using a Zeiss Axioplan epifluorescence microscope with #15 filter cube (green excitation, red observation), and Pol Plan-Neofluar 100xz and 63x 1.30 numerical aperture objectives (for larger molecules).
- the distance per pixel can be calibrated using a USAF-1951 resolution target, and was determined in a specific embodiment to be 0.217 ⁇ m and 0.345 ⁇ m respectively.
- a 6115A precision power supply Hewlett-Packard
- Hewlett-Packard can be used to provide potential across the chamber electrodes.
- Frames from a C2400-SIT camera can be averaged by PixelPipeline (Perceptics), digitized (480 ⁇ 512 ⁇ 8 bits) and stored in a Macintosh IIfx computer. Averaged images are preferably processed to remove background, reduce noise, and simulate shadowing (some images) using NIH Image program, available from wayne@helix.nih.gov and NCSA Image software for Macintosh (available from softdev@ncsa.uiuc.edu), and photographed by a Polaroid film recorder.
- Sample preparation using the baseline measurement method of the present invention generally is prone to variations that can affect the results. For example, small gel samples are melted and reformed within a thin region between a slide and a coverslip. Evaporation can also be a problem. Despite these concerns, measurements made using this approach were found to be reproducible, particularly if fluid adhering to the gel slices containing DNA is removed prior to melting. Uniform gelation conditions must also be stringently followed.
- yeast chromosomal DNA can be resolved by Pulsed Oriented Electrophoresis in 1% Seakem low melting agarose (FMC), 1/2x TBE (42.5 mM Tris, 44.5 mM boric acid, 1.25 mM disodium EDTA).
- FMC Seakem low melting agarose
- 1/2x TBE 42.5 mM Tris, 44.5 mM boric acid, 1.25 mM disodium EDTA.
- excised gel bands or alternatively a synthetic matrix, are repeatedly equilibrated in TE (10 mM tris, 1 mM EDTA, pH 8.0)(19). Bands are further equilibrated in TE containing 10 mM NaCl, melted 72°C, 10-15 min and equilibrated to 37°C.
- Ethidium bromide (final concentration 1 ⁇ g/mL) and 2-mercaptoethanol (final concentration 10 ⁇ L/mL) for minimizing photodamage are added to melted sample, equilibrated at 37°C from 10 min to a few hours.
- 10 ⁇ L (cutoff yellow pipette tip used) is cast onto a preheated slide with 1.8 cm x 1.8 cm coverslip and applied to a stage electrophoresis chamber, with 2 cm electrode spacing. The edges of the coverslip are sealed with mineral oil to prevent evaporation. Coverslips and slides are cleaned by boiling in 0.075M HCl for about one hour, rinsed with distilled water several times, and stored in 100% ethanol before use. Mounted samples are incubated at 4°C for at least 15 min before image collection at 37°C.
- relaxation time determinations can be made more accurate by averaging about 3 to 8 measurements.
- the length L i is determined from the last 15 data points, which are then used along with the first 20 or 30 data points to extract the relaxation time ⁇ .
- the distribution of the measured Li is relatively narrow and the standard deviation is less than ⁇ L>-1/2.
- Figure 27 A and B show relaxation measurements as a function of molecular size (245-980 kb) and the parameters extracted from each. All curves can be seen to fit reasonably well a single exponential decay. Disengagement from the tube is not significantly observed from the figures.
- Figure 28 A and B are plots of relaxation vs. size respectively.
- ⁇ L> has a negative intercept after fitting data for a wide range of molecular sizes.
- molecular sizing is performed by measuring the reorientation time of a molecule subject to at least one external force using, for example, sequential electric fields applied in different directions. This approach is described in Example 6 below and is illustrated in Figs. 4A and 5J. Using the process as described below in the Examples, it has been determined that during pulsed field electrophoresis, the blob train of a DNA molecule orients with the applied electric field in a very complicated manner and during this process, electrophoretic mobility is retarded until alignment is complete, e.g., until the molecule is aligned with the applied field.
- the blob train moves in several new directions simultaneously (i.e. , the blobs appear to be moving somewhat independently). Eventually, some part of the blob train dominates in reorienting with the applied field and pulls the rest of the blobs along its created path through the gel.
- Another embodiment of this invention involves measurement of the rotation time of a molecule subject to sequential electric fields in different directions. Rotation of a molecules using this approach requires a series of incremental reorientation steps, each of which causes the molecule to rotate further in the same direction, until the molecule has undergone a rotation of a specified angular increment, for example, 360°.
- This embodiment is particularly well suited to characterize stiff, rod-like molecules, such as small DNA molecules, which do not significantly change conformation upon application of an external force.
- large molecules can also be sized using this method if the conformation of the molecules is kept relatively constant, preferably in a rod-like or elongated conformation.
- keeping the conformation of large molecules is accomplished by applying a pulsing routine which is appropriate to the size, shape and perhaps also the composition of the molecule.
- molecules are rotated in the presence of sinusoidally varying electrical fields applied at 90° to each other.
- Stiff, rod-shaped molecules or stretched molecules are rotated about their long or short axis. Rotation about the long axis has the greatest molecular weight dependence, with rotation diffusion being proportional to about M 3 .
- Rotational motion of a rod-shaped molecule immersed in a gel or any other confining can be difficult if an attempt is made to simply rotate the molecule as a boat propeller rotates in water.
- the matrix affects the rotation of the molecule much as seaweed affects the rotation of a boat propeller.
- a pulsing routine is applied which also provides back and forth motion of the molecule, thereby facilitating rotation.
- an algorithm defining the pulsing routine can depend on variables such as the angle increment, time, electric field intensity, etc., and these may in turn be functions of different variables.
- variables such as the angle increment, time, electric field intensity, etc.
- numerous types of algorithms can be used in accordance with this embodiment of the present invention.
- a molecule to which appropriate pulses are applied rotates about ( ⁇ i+1 - ⁇ i ) radians or degrees when each set of pulses P are initiated. Also, the molecule is translated, moving laterally in the directions of E (t) and - E (t), thereby facilitating rotation.
- E may be a function of one or more variables.
- E may be a function of total elapsed time and/or angle increment.
- the sum of all the angular increments need not be 360°, and may be any number of partial or total rotations which provide measurements of sufficient accuracy.
- a specific set of conditions for measuring the rotation rate of molecules are set forth in Example 7.
- sizing involves measuring the diameter of a relaxed molecule. Measurements of the molecular diameter are made according to the same procedure of staining molecules, placing the molecules in a medium, etc., as in the case of the curvilinear length measurements described above. However, in this embodiment of the invention it is not necessary to perturb the molecules before the measurement. Instead, the molecules are measured when they are in a relaxed state and generally have a spherical or elongated elliptical shape.
- volume of a sphere is proportional to R 3 where R is the radius of the sphere
- volume of an ellipsoid is proportional to ab 2 where a is the radius of the major axis, and b is the radius of the shorter axis
- resolution for this technique varies functionally approximately as M .53 Molecules measured by this technique need not be deformable.
- the technique can be used for all sizes of DNA molecules and in particular is useful for sizing both large DNA molecules on a microscope slide, and densely packed molecules.
- molecules can also be sized by measuring rotational diffusion in free solutions.
- the rod rotational diffusion coefficient is remarkably sensitive to size -- approximately length 3 .
- rod rotational diffusion coefficients are determined using fluorescence dichroism, as measured by microscopy, of small (100-3,000 bp) single, ethidium bromide stained DNA molecules. Fluorescence dichroism tracks orientation as a function of time, providing the necessary kinetics information for coefficient determinations. Orientation analysis utilizes the equations above.
- the experimental setup in accordance with a specific embodiment of the present invention consists of a Zeiss microscope fitted with an ethidium bromide filter pack, illuminated by an argon ion laser source, providing 488 nm polarized radiation, a Hinds photoelastic modulator and detection by a microchannel plate detector interfaced to a CCD video camera. Camera output is provided to the image processor for data storage and analysis.
- a Fluke, high power/speed amplifier provides +/-1500 volts at the required frequency for alignment. Since the thin sample films used for microscopy draw little power, temperature control in this embodiment is relatively simple. Molecular alignment can be done tried using both AC or DC electrical fields. AC fields have the advantage of zero net translation during an experiment. If increased field strength is required, the sample cell can be reduced in size, bringing the electrodes closer together.
- an electrical field is applied briefly to orient molecules and shut off, allowing Brownian motion to relax the molecules.
- Depolarization is next tracked by gathering the total fluorescence decay output of each molecule in the field by a microchannel plate/CCD video camera. As the molecule tumbles and falls out of plane with the exciting radiation, its fluorescence intensity changes in an exponential fashion with a characteristic time given by the rotational diffusion coefficient. Since video cameras operate at a frame rate of 30 frames per second, fluorescence intensities are recorded every 1/30 second by the image processor. The whole process is repeated several times and the results are averaged.
- An advantage offered by a video camera detection system is that an ensemble of individual molecules can be measured distinctly and simultaneously, resulting in parallel data collection and processing.
- the calculated relaxation time for a 300 bp DNA molecule is about 4 microseconds in water, too fast for our detection system. But since the rotational diffusion constant increases linearly with viscosity, substituting 98% glycerol can be used to boost the viscosity, and chilling the sample on the stage can further increase viscosity by a factor of 10 5 . If high glycerol concentration causes DNA denaturation at low temperature, sucrose can be tried. Either approach should provide a viscosity boost sufficient to bring the rate into range for video data collection.
- averaging a series of measurements to increase the accuracy of the molecular size estimates is used in all cases, whenever possible.
- the 90% confidence interval on the mean measurement value is calculated using the t distribution with n-1 d.f. and the sample standard deviation. (See, for example, Bendat et al., Random Data: Analysis and Measurement Procedures, John Wiley, 1986 ). This calculation assumes that the measurement data represents random samples from a normal distribution and means that there is a 90% chance that the population mean falls within the confidence interval. The midpoint of this interval is used to estimate the standard deviation of the population.
- the coefficient of variation (CV) for the measurements can be obtained as the estimated population standard deviation divided by the sample mean.
- the pooled standard deviation for the measurement is computed in accordance with the present invention using the functional expression sqrt (the average of the variances).
- sqrt the average of the variances.
- the relative measurement error of the measurements in accordance with the present invention is computed as the difference between the measurement value and the reported value divided by the reported value.
- elongated and possibly fixed single nucleic acid molecules can be imaged using a number of techniques to generate digital images of the molecules. These images can then be processed to obtain quantitative measurements of molecular parameters of interest.
- the molecules being imaged are first stained with fluorochromes which are absorbed by the molecules generally in proportion to their size. The size of the stained molecules can later be determined from measurements of the fluorescent intensity of the molecule which is illuminated with an appropriate light source.
- Described herein are methods whereby the single elongated molecules of the invention may be utilized for the rapid generation of high resolution genome analysis information. Such methods include, as described below, both optical mapping and optical sequencing techniques.
- the optical mapping techniques of the invention allow direct, ordered mapping of restriction sites for the rapid generation of high resolution restriction maps.
- mapping techniques involve the elongation and fixation of single nucleic acid molecules, digestion of the molecules with one or more restriction enzymes and the visualization and measuring of the resulting restriction fragments. Because the single nucleic acid molecules which are being digested are fixed, the resulting restriction fragments remain in register, such that their order is immediately apparent and a rapid restriction map is instantly generated.
- optical mapping techniques described herein have a variety of important applications, which include, for example the efficient generation of genomic physical maps, which, until the present invention, had proven to be time consuming, costly, difficult and error prone.
- the approaches described herein make possible the creation of ordered, complex high resolution restriction maps of, for example, eukaryotic, including human chromosomes without a need for analytical electrophoresis, cloned libraries, probes, or PCR primers.
- nucleic acid from individuals may be tested for polymorphisms which may be associated with certain disease alleles.
- polymorphisms may represent restriction fragment length polymorphisms, rearrangements, insertions, deletions and/or VNTR (variable number tails repeats).
- Nucleic acid molecules of from about 500 bp to well over 1000 kb can efficiently be mapped by utilizing the techniques described herein.
- the single nucleic acid molecule-based techniques can easily be utilized in high throughput applications such as are described, below, in Section 5.4.
- single nucleic acid molecules are elongated and fixed according to the techniques described in Section 5.1, above. While either agarose or solid surface-based elongation/fixation methods may be utilized, solid surface techniques are, generally, preferred. As discussed in Section 5.1, the elongation/fixation techniques should be optimized to yield a balance between elongation capability, relaxation capability and retention of biological function. By'appropriate elognation and fixation, the single nucleic acid molecules relax somewhat, with the fragments, therefore, moving apart upon cutting.
- Cleavage sites are, therefore, visualized as growing gaps in imaged molecules.
- the molecules are restrained, however, from fully relaxing to a random coil conformation, which would make accurate fragment measurement impossible.
- cleavage is also signaled by the appearance of bright condensed pools or "balls" of DNA on the fragment ends at the cut site. These balls form shortly after cleavage and result from coil relaxation which is favored at ends (see Figs. 13 and 15).
- Cleavage is scored more reliably by both the appearance of growing gaps and enlarging bright pools of segments at the cut site. Otherwise, it is possible that what appears to be a gap may, in fact, be a single molecule, part of which is out of the plane of focus.
- Optical mapping restriction digests may be performed by utilizing standard reaction mixtures and conditions (e.g., incubation times and temperatures). Because the technique relies on the fixed nature of the nucleic acid molecules being digested, however, it is critical that the elongation/fixation process be completed prior to the initiation of restriction digestion. There exist a number of methods by which the start of restriction digestion can be controlled, a number of which involve keeping the restriction enzyme apart from whatever cofactor (e.g. , Mg 2+ ) is necessary for that particular enzyme's activity until the initiatin of digestion is desired.
- cofactor e.g. , Mg 2+
- the nucleic acid when using agarose-based elongation/fixation techniques, may be mixed into molten (preferably low melting) agarose along with restriction enzyme and appropriate buffer, but without cofactor.
- the cofactor can be added, thus activating the restriction enzyme.
- the cofactor can be mixed into the agarose in the absence of restriction enzyme. In order to begin digestion, the enzyme can be added and allowed to diffuse into the gel.
- restriction digestion reaction mixture in the absence of either restriction enzyme or cofactor, can be put into contact with the solid surface.
- the missing component i.e., either the restriction enzyme or the cofactor
- a complete reaction mixture can be introduced onto the solid surface, with digestion beginning once the mixture comes into contact with the elongated/fixed nucleic acid molecules.
- a necessary divalent cation can be introduced in a chelated fashion wherein the chelation is a photo-labile chelation, such as, for example, DM-nitrophen.
- the molecules being restricted and analyzed via such techniques may be visualized via techniques including those described, above, in Section 5.2.
- the resulting fragments can be sized according to techniques such as those described in Section 5.2. Such techniques can include, for example, a measure of relative fluorescence intensities of the products and by measuring the fragments' relative apparent molecular lengths. Averaging a small number of molecules rather than utilizing only one improves accuracy and permits rejection of unwanted molecules or fragments. Maps are then constructed by simply recording the order of the sized fragments.
- mapping techniques described thus far function in the efficient generation of single nucleic acid molecule restriction maps.
- a variety of techniques may be utilized to distinguish or diferentially identify one end of a molecule, thereby marking its orientation or polarity.
- mapping vectors may be produced and used in conjunction with the mapping techniques described herein.
- Such vectors can serve to introduce a "tag" to one end of a molecule being analyzed.
- a tag can comprise, for example, a rare restriction enzyme cutting site, a protein binding site (which; for example, can be tagged by a labeled version of the protein) or a region of DNA tending to kink (and which would, therefore, serve as a visual tag requiring no further manipulation), just to name a few.
- such vectors may include a nucleotide sequence to which a labeled nucleotide probe may hybridize via, for example, techniques such as those described, below, in Section 5.3.2.
- Size standards may additionally facilitate the accurate measurement of the restriction fragments which are generated herein.
- Such standards may, for example, be engineered into mapping vectors such as those described above. Methods, such as the methylation of the mapping vector, can be utilized to ensure that the siing standards remain intact during restriction.
- sizing standards may comprise fluorescent beads of different sizes which exhibit a known level of fluorescence.
- Figure 12 illustrates three types of ordered restriction maps produced by optical mapping of the present invention. These maps are compared with published restriction maps. Additionally, Fig. 13A-F, shows selected corresponding processed fluorescence micrographs of different yeast chromosomal DNA molecules digested with the restriction enzyme Not I. These images clearly show progressive digestion by the appearance of growing gaps in the fixed molecules. From such data, the order of fragments can be determined by, for example, inspection of time-lapse images obtained at every time interval, e.g. , 0.07-200s, or any range or value therein, e.g., 1-30s.
- the third type of restriction map combines length- and intensity-derived data; small restriction fragments can be sized by length, whereas intensity measurements can provide the remaining fragment sizes needed to complete the maps.
- the elongated, fixed single nucleic acid molecules of the invention can be utilized as part of methods designed to identify specific, known nucleotide sequences present on the fixed nucleic acid molecules. Such methods are referred to herein as "optical sequencing" methods. In part because these methods involve the analysis of naked nucleic acid molecules (e.g. , ones which are not in a chromatin state), optical sequencing is capable of providing a level of resolution not possible with chromatin-based detection schemes such as in situ hybridization.
- Optical sequencing methods in general, comprise the specific hybridization of single stranded nucleic acid molecules to at least one nucleotide sequence present within the single elongated fix nucleic acid molecules of the invention in a manner whereby the position of the hybridized nucleic acid molecule can be imaged and, therefore, identified.
- Imaging can be performed using, for example, techniques such as those described, above, in Section 5.2.
- the position of the imaged hybridization product can be identified using, for example, the sizing techniques described, above, in Section 5.2.
- the optical sequencing technique comprises the hybridization of nucleic acid molecules to the elongated, fixed single nucleic acid molecules of the invention such that specific hybridization products are formed, in a manner which can be imaged, between at least a portion of the elongated, fixed single nucleic acid molecules and the hybridizing nucleic acid molecules. Because the hybridization is based on sequence complementarity between the hybridizing nucleic acid molecule and at least a portion of the elongated single nucleic acid, imaging of the hybridization product, coupled with the precise sizing techniques described in Section 5.2, above, optical sequencing rapidly identifies a nucleic acid region according to its specific nucleotide sequence.
- optical sequencing techniques described herein have a variety of important applications.
- First, such techniques can be used to generate complex physical maps, by, for example, facilitating the alignment of nucleic acid molecules with overlapping nucleotide sequences.
- optical sequencing techniques make it possible to rapidly identify and locate specific genes of interest. For example, in instances where at least a portion of the nucleotide sequence of a gene is known, optical sequencing techniques can rapidly locate the specific genomic position of the gene, and further, can rapidly identify cDNA molecules which contain sequences complementary to the nucleotide sequence. Further, such optical sequencing methods have numerous diagnostic applications, such as, for example, the rapid identification of nucleic acid molecules containing specific alleles, such as genetic disease-causing alleles. For example, single elongated, fixed nucleic acid molecules from one or more individuals can be hybridized with a single stranded nucleic acid molecule probe which is specific for ( i.e., , will specifically hybridize to) an allele of interest. Such an allele may, for example, be a disease-causing allele. A positive hybridization signal would indicate that the individual from whom the nucleic acid sample was taken contains the allele of interest. ,
- the single elongated fixed nucleic acid molecules may represent nucleic acid molecules which are specific for ( i.e., will specifically hybridize to) an allele of interest.
- a nucleic acid sample can be obtained from an individual and hybridized to the elongated fixed nucleic acid molecules. The presence of specific hybridization products would indicate that the individual from whom the nucleic acid sample was obtained carries the allele of interest.
- the sample nucleic acid may be labelled via standard methods, e.g., by PCR amplification in the presence of at least one labelled nucleotide.
- the hybridization product need not be labeled, but can be identified by the imaging of a site-specific restriction cleavage event within the hybridization product. Further, as described, below, the hybridization product can be identified via indirect labeling, by hybridization product-specific binding of a labeled compound to the product.
- Specific refers to nucleotide sequence specificity
- a “specific hybridization product” refers to a stable nucleic acid complex which is formed between at least a portion of the elongated nucleic acid molecule and at least a portion of the introduced nucleic acid molecule which is complentary to the elongated nucleic acid molecule.
- the sequence complentarity between these two hybridizing portions of the nucleic acid molecules is at least about 80%, with at least 90% being preferred, and at least about 98-100% being most preferred.
- Hybridization conditions which can successfully yield the specific hybridization products described above are well known to those of skill in the art.
- the fixed, elongated nucleic acid molecules must be denatured (made single stranded) such that hybridization to the introduced single stranded nucleic acid molecule is possible, by following standard denaturation protocols which are well known to those of skill in the art.
- the specific hybridization products formed must be imaged in order to, first, identify that such products have formed, and, in some cases, to identify the postion along the elongated fixed nucleic acid molecule at which such hybridization products have formed.
- a variety of methods may be utilized for the imaging of the specific hybridization products formed during the optical sequencing techniques described herein.
- the nucleic acid molecules which are hybridized to the elongated, fixed single nucleic acid molecules of the invention can be labeled in a manner whereby the hybridization products they contribute to can be imaged.
- Any of a number of standard labeling techniques which are well known to those of skill in the art may be utilized. These include, but are not limited to, colorimetric, fluorescent, radioactive, biotin/streptavidin and chemiluminescent labeling techniques, with fluorescent labeling being preferred.
- the labeled nucleic acid which hybridizes to the elongated molecule should be labeled in a manner which produces a different color or fluorescence than the stained elongated molecule.
- the labeled nucleic acid will generally be at least about 20 nucleotides in length, with about 100 to about 150 nuelcotides being preferred. Specific hybridization products can be imaged by imaging the labeled nucleic acid within the hybridization product.
- methods_ may be utilized which obviate the need to label the nucleic acid which hybridizes to the elongated, fixed single nucleic acid molecules of the invention.
- optical sequencing methods may be used in conjunction with a technique known as the RecA-assisted restriction endonuclease (RARE) technique ( Koob, M. et al., 1990, Science 250:271 ; Ferrin, L.J. et al., 1991, Science 254:1494 ; Koob, M. et al., 1992, Nucleic Acids Res. 20:5831 ).
- RARE RecA-assisted restriction endonuclease
- the RARE technique involves the generation of restriction endonuclease cleavage events that occur solely within the specific hybridization product.
- sequence-specific RARE methods By combining sequence-specific RARE methods with the ability to visualize the formation of restriction cleavage sites, as described for optical mapping, above, in Section 5.3.1, specific hybridization products can be detected without prior labeling of the nucleic acid being hybridizaed to the elongated, fixed single nucleic acid molecules of the invention.
- the RARE technique makes hybridization product-specific restriction possible by selectively blocking methylase, such as EcoRI methylase, enzymes from acting upon the specific hybridization products.
- Methylases are enzymes which methylate nucleic acid molecules in a sequence specific manner, and nucleic acid which has been methylated is no longer subject to restriction endonuclease action. For example, EcoRI methylase methylates nucleic acid molecules at the EcoRI recognition site such that EcoRI will no longer cut at that site.
- restriction digestion is performed. The only resulting cleavage sites are those within the region where specific hybridization had occurred, thereby identifying the position of such hybridization.
- RARE uses RecA protein to block methylase activity in a site specific manner.
- the RecA protein exhibits an ability to pair a nucleic acid molecule to its complementary, homologous sequence within duplex DNA such that a triple stranded nucleic acid/RecA complex is formed. Such a complex is protected from methylase activity.
- a nucleic acid molecule which will hybridize to at least a portion of the elongated, fixed single nucleic acid molecules of the invention, together with a RecA protein (and necessary RecA cofactor reagents) under conditions, such as those described, above, which will yield specific hybridization products, generates a triple stranded complex at the site of such specific hybridization.
- nucleic acid molecule After formation of such a triple helix complex, the nucleic acid molecule is methyated. After methylation, enzymes and introduced nucleic acid molecules are removed, leaving duplex DNA which has been methylated at all positions except those within the site of hybridization.
- the triple stranded complex formation and and subsequent methylation steps can be performed either before or after the elongation/fixation of the single nucleic acid molecules. In instances wherein these steps are performed prior to elongation, care must be taken with large nucleic acid molecules to avoid shearing of the molecules.
- One method which can successfully avoid such shearing is to perform the steps in agarose gel blocks or "chops". "Chops" refer to agarose gel blocks containing nucleic acid molecules, in which the gel blocks have been cut into small pieces.
- nucleic acid molecules After removal of excess non-hybridized nucleic acid molecules and reagents, the nucleic acid molecules can be elongated and fixed according to the gel-based or solid-surfaced based techniques described, above, in Section 5.1.
- Elongated fixed single nucleic acid molecules which have been treated as above are then subjected to restriction digestion with a restriction enzyme that cannot act upon (i.e., , cannot cleave) the methylated DNA.
- Restriction digestion and cleavage site visualization can be performed according to the methods described for optical mapping described above in Section 5.3.1.
- the only cleavage sites which form are those within the site of specific hybridization.
- Sizing techniques such as those described, above, in Section 5.2, may be utilized to ascertain position. Such sizing techniques are not necessary in cases where the mere occurence of hybridization, rather than position, of hybridization is being assayed.
- a modified RARE method is utilized.
- Such a modified RARE technique involves, as described above, the generation of a triple stranded nucleic acid/RecA complex. Because no subsequent restriction will take place, no methylation is necessary after the generation of the complex.
- complex generation should take place after the elongation/fixation of the single nucleic acid molecule of interest.
- the nucleic acid molecule which hybridizes to the elongated fixed single nucleic acid molecule is labeled, as, for example, described, above, in this Section. Because RecA is being used to promote triple stranded complex formation, no prior denaturation of the elongated duplex DNA is necessary.
- the site of the specific hybridization is identified by imaging the labeled nucleic acid molecule with the complex.
- Such techniques involve the binding of a labeled component to a site containing a specific nucleotide sequence, such as the site of a specific hybridization product such that this site is, in effect, indirectly labeled.
- the bound component is imaged, thereby identifying, first, that hybridization has taken place, and second, making possible the identification of the position of such hybridizaton.
- Techniques such as this may be especially useful, for example, in diagnostic instances wherein the nucleic acid which is introduced to hybridize to the elongated single nucleic acid molecules is scarce. Further, these techniques make unecessary a need for amplification of such scarce material prior to hybridization, thus avoiding potential amplification-generated artifacts.
- a modified RARE procedure is followed. Specifically, a triple stranded/RecA protein complex is formed, as decribed above, however, in this case, the RecA which is utilized is labeled. Once again, because no restriction will take place, ho methylation step is necessary. The RecA protein must be labeled in a manner which retains its activity while allowing for its imaging.
- Such techniques are well known to those of skill in the art, and may include, for example, addition of epitope tags, biotin, streptavidin, and the like.
- the site of specific hybridization is identified by merely imaging the bound RecA protein.
- the labeled component is a labeled compound, such as a protein, which binds nucleic acid in a nucleotide sequence-specific manner.
- a labeled compound such as a protein
- the presence and positon of such a binding protein could be identified.
- optical mapping and optical sequencing techniques described herein may be combined such that mapping may be performed in a directed fashion. Such technique is referred to herein as "directed optical mapping". Such techniques function to target specific portions of a genome for further high resolution mapping analysis. Specifically, single nucleic acid molecules which contain specific sequences of interest may be identified from among the total single nucleic acids present in a population of single nucleic acid molecules. Once the specific nucleic acid molecules containing the sequences of interest are singled out, such nucleic acid molecules may be further analyzed.
- Such directed optical sequencing can serve a number of important applications, which include, but are not limited to diagnostic applications which can directly image, for specific loci, any genetic lesion which can be imaged via optical mapping. Additionally, fingerprints of specific genetic loci can rapidly be obtained for individuals or populations.
- each of the nucleic acid molecules which may contain the specific sequences of interest can be elongated and fixed, utilizing techniques such as those described, above, in Section 5.2.
- the single nucleic acid molecules to be further analyzed can be identified by using the optical sequencing techniques described in Section 5.3.2.
- those single nucleic acid molecules which hybridize via optical sequencing can be mapped at high resolution via, for example, the optical mapping techniques described in Section 5.3.1.
- nucleic acid molecules which will hybridize to the sequences of interest can be elongated and fixed on the solid surfaces of the invention. Once mounted onto a surface, all nucleic acid molecules which may contain the sequences of interest are contacted with and hybridized to the nucleic acid molecules fixed on the surface. Those single nucleic acid molecules which contain sequences complentary to those fixed on the surface will become bound to the surface. Once bound to the complementary nucleic acid molecules, the entire single nucleic acid molecule which contains such hybridizing sequences will become fixed onto the surface.
- the nucleic acid molecules which are to be further analyzed are not only identified, but are additionally elongated and fixed in a manner which makes them amenable to the optical mapping techniques described, above, in Section 5.3.1.
- the high throughput automated system and method of the present invention are based on the optical mapping and sequencing approaches described above and are capable of providing high speed, high resolution mapping and sequencing of PCR products, clones and YACs, requiring little or no input from human operators.
- Reliable, high speed molecular sizing is at the heart of any high throughput molecular analysis method.
- High throughput analysis methods can be classified accordingly into static and dynamic. Static methods generally involve simple equipment and are thus more suitable for high throughput measurements at present.
- dynamic methods are typically more accurate but at present are less well adapted to high throughput measurements because of the more sophisticated equipment they require.
- high throughput molecular analysis is performed using high speed processing of digitized images of stationary or dynamically perturbed molecules. Both approaches are considered next.
- a novel system is developed for static molecular measurements using automated, high speed surface-based methods for molecular spotting and fixation.
- desirable DNA fixation attributes include: a high degree of molecular extension, preservation of biochemical activity and reproducibility at high deposition rates. Furthermore, the development of high-throughput systems for genomic analysis requires that the fixation approach provides high sample deposition rates, high gridded sample densities and simplified access to the arrayed samples. Inadequate attention to any of these fixation aspects is likely to unduly complicate the analysis and increase its cost.
- the spotting and fixation equipment of the system includes an automated Eppendorf Micro-Manipulator Model 5171, and Injector capable of depositing a large number of clone DNA molecules on a derivatized glass surface while maintaining molecular extension and biochemical accessibility.
- a small capillary tube about 100 microns
- a blunt-ended glass rod are used to draw DNA samples and transfer them to the surface by contact as small droplets of DNA solution.
- the solution droplets can be mixed with a variety of dopants to produce different types of elongation conditions, as described above in Section 5.1.
- the solution droplets are spotted on the surface in ordered arrays with spacing and deposition conditions controlled by an electronic Ludl Mac 2000 interface box connected to the computer.
- Spot diameter is controlled, for example, by adjusting the inner diameter of the capillary tube and ranges between about 40-1000 microns.
- smaller-size, high grid density spots are used for optimal throughput.
- Figs. 16 (A,B and C) smaller size spots seem to increase the efficiency of the fixation technique because of the relatively large number of molecules which are stretched on the periphery of each spot after it dries.
- each spot is about 100 microns in diameter, the variation between spots being about +/- 20 microns.
- the center-to-center spacing between adjacent spots is on the order of 150 microns, but smaller or larger spacings can also be used, if desired.
- the deposition of spots is controlled by computer program settings of the Micro-Manipulator and a x-y table connected to microstepped motors. Typical deposition rate for this equipment is one spot in less than about every 2 seconds.
- a very large number of clones can be deposited on a derivatized surface using a Beckman Biomek 2000 robot programmed for sample spotting.
- the use of the robot completely obviates the need for human intervention and results in approximately ten times faster deposition rates compared to standard deposition techniques.
- the robot-aided fixation approach can result in reliable deposition of very closely spaced DNA samples (20 microns with spot-to-spot spacing of about 35 microns) which further improves the efficiency of the method.
- a vision controlled pick-and-place robot manufactured, for example, by Research Genetics or Sci-Tech (Switzerland) can be used to completely automate the spotting process by selecting objects randomly distributed on a plane surface and spotting them in a controlled manner on the derivatized surface.
- spotted DNA molecules can be "sandwiched" with a coverslip between two glass surfaces which, when pressed together, stretch the DNA molecules positioned in between. This approach gives acceptable mapping results; however, it is serial in nature so that only one sample can be measured at a time and is thus not effective for high-throughput processing.
- a teflon block stamp is pressed onto the DNA spots, causing them to spread and fix on the sticky, derivatized surface.
- Figure 29 shows an enlarged view of a DNA spot and the use of a teflon block in accordance with this embodiment of the present invention to spread the molecules onto the derivatized surface.
- the deposited droplets of DNA solution are simply let dry on the derivatized surface.
- the droplets dry most of the fixed DNA remains fully elongated, aligned, and primarily deposited within the spot periphery in a characteristic "sunburst" pattern, clearly observable in Figs. 26 A, B and C.
- Addition of glycerol to the spotting solution results in well elongated DNA molecules which are more uniformly distributed.
- the rehydration of spotted DNA samples with restriction endonuclease buffer effectively restores the biochemical activity of the spotted molecules.
- the sunburst fixation pattern of elongated molecules in accordance with the present invention is a completely unexpected discovery which provides the basis for novel high throughput analysis methods, and has implications which are impossible to predict at this time.
- surface-fixed molecules are next digested by adding 20-40 ⁇ l of 1x commercial restriction buffer (manufacturer recommended) containing about 10-20 units of the corresponding restriction endonuclease per spotted coverslip; surfaces are then incubated in a humidified chamber for about 5-20 minutes. After digestion the overlaying buffer is removed by washing in a beaker of TE (10 mM Tris-Cl, 0.1 mM EDTA, pH 7.4) buffer. Excess TE buffer is removed with an aspirator. The surface is then stained, for example, with YOYO-1 (100nM) fluorochrome provided by Molecular Probes, and sealed with immersion oil to prevent drying. Preferably, Cargille Immersion Oil for Microscopy can be used to this end. The surface-fixed molecules are then ready for optical mapping.
- 1x commercial restriction buffer manufactured
- Excess TE buffer is removed with an aspirator.
- TE 10 mM Tris-Cl, 0.1 mM EDTA, pH 7.4
- Figure 30 illustrates in a block diagram form the method of the present invention for high throughput optical mapping of lambda or cosmid clones.
- the figure illustrates the sequence of steps of robot-aided spotting of clones onto a rectangular derivatized glass plate 100; adding restriction enzyme; and image processing analysis in computer 200 after digestion.
- Figure 31 is a simplified block diagram of the system of the present invention used for high throughput optical mapping of gridded YAC DNA.
- the system in Fig. 31 is an adaptation of a clone spotting system for YAC analysis and restriction mapping that readily interfaces with existing automated equipment, yet is useful in laboratories lacking sophisticated sample handling technologies.
- Fig. 31 shows a method for spotting YACs as intact chromosomal DNA molecules prepared in microtiter plates 100.
- yeast chromosomal DNA prepared in agarose can be used.
- a coated surface 110 such as polylysine-, or APTES-coated glass.
- Experimental results indicate that approximately 30-75% of dropped molecules on the surface show little breakage, even for megabased-sized molecules.
- Restriction enzyme is then added, and digestion proceeds for a pre-defined period.
- a high-contrast fluorochrome such as ethidium homodimer, is added and only imaged molecules fixed on the surface are taken for analysis. Note that fluorochrome is added after fixation and digestion, thus avoiding possible fluorochrome-restriction enzyme conflicts. Imaging is also done post-digestion.
- surface mounted DNA can be analyzed for map formation by adding restriction enzyme to the yeast chromosomal DNA molecules in the microtitre plate. Products are then analyzed after mounting. Analysis techniques in this case would include first end-labeling YACs.
- the high throughput method of the prsent invention employs imaging restriction digestion products post digestion.
- YAC-sized DNA molecules suspended in molten agarose can be elongated and fixed when gridded onto the surface as small droplets.
- the mounting procedure can be described as follows: a small amount of DNA embedded in agarose is dropped onto a treated surface 110. After this step the droplet flows, DNA molecules stick to the surface and elongate. This technique is similar to spreading procedures used for karyotyping mammalian cells.
- DNA concentration is varied systematically, changing pipetting variables (orifice size, delivery time, etc.), gel concentration, surface conditions (polylysine composition, and other compounds such as APTES), the temperature of surfaces and fluids and others. Coated glass surfaces are scored in a defined direction to provide sticky grooves for molecules to adhere to.
- the analysis next uses fluorescence microscopy to measure the number of fixed molecules, the distributions of apparent molecular lengths and the biochemical activities. Biochemical activity is assayed by measuring the restriction digestion activity of previously mapped molecules bound on the surface. Importantly, this work does not involve molecules above the surface, trapped in the agarose gel layer.
- the Eppendorf Micro-Manipulator/Injector instrument described above is adequate for this purpose.
- the injector unit of the device which is interfaced with the Micro-Manipulator, provides a very reproducible pipetting rate, as well as pipette filling time. In this specific measurement it is not possible to perform high-volume gridding, although micromanipulation is reproducible down to a fraction of a micron.
- Optimal mount conditions for high throughput processing also depend on a number of factors, molecular size being a major one. Approximately 5-10 500 kb molecules can be imaged simultaneously using a 100x objective and the camera/digitizing system. If the restriction digestion efficiencies are approximately 20% (for full digestion), accurate maps can be created from about 50 to 100 molecules. This means that approximately 5-20 fields are necessary to produce one to ten fully digested, scorable molecules. In terms of space, this translates to a maximum of about (0.5 mm) 2 per spot.
- spots can be placed on a (2 cm) 2 coverslip, assuming a 1 mm center-to-center spacing between spots.
- a final consideration is preventing agarose spots from drying out during the gridding process. Possible solutions to this problem include performing gridding under high humidity, adding glycerol to the agarose and pipetting through buffer covered with a layer of a light hydrocarbon.
- molecules can be tagged and discriminated by changing fluorescence microscopy filter packs using a computer-controlled filter wheel.
- tags are designed with spectral characteristics that differ from that of the bulk-stained molecule.
- Other molecular tagging approaches that are compatible with optical mapping can also be used.
- imaging of the pretreated surface-fixed molecules is performed using a Zeiss Axioplan or Axiovert 135 microscope equipped for epi-fluorescence (filter pack for green excitation and red emission, or preferably a YOYO filter pack, 490 nm excitation, 510 nm emission) and Plan-Neofluar objectives (16x, 100x; made by Zeiss).
- the microscope is coupled to a Hamamatsu C2400 SIT focusing camera and an imaging Photometrics PXL Cooled CCD camera.
- the spatial resolution of the image processing equipment is 1032x1316 pixels per image, with 12 bits/pel raw image gray-level resolution and 16 bits operating resolution.
- the output of the focusing SIT camera is used in a feedback loop for auto-focus control and positioning to adjust the x-y position of the spot being imaged.
- the electronic auto-focus unit and a stepping motor unit connected to the microscope focus control are provided by Ludl Electronics and are known in the art. This system acts as an automated microscope capable of automatically moving from one imaged spot to,another.
- the processing computer is a SUN workstation with 128 MB RAM and 32 GB hard drive space enabling continuous processing of large volumes of image data.
- the digitized images are stored for subsequent processing using a Macintosh computer.
- a modified version of the commercial software package Ip Lab distributed from Signal Analytic, or a modified version of the NIH commercial software for Macintosh computers can be used.
- Figure 32 is a block diagram of another embodiment of a system for optical mapping in accordance with the present invention which preferably includes a cooled CCD camera (Photometrics, AZ). While the equipment in Fig. 32 is less suitable for high throughput measurements than the one described above, it can be used in certain applications which require the use of fluorescent lifetime microscope, whenever it is necessary to distinguish life molecules.
- a cooled CCD camera Photometrics, AZ
- microscope 20 is used to image sample 10 which is placed on computer controlled x-y table. Illumination for the microscope is provided by illumination source 30 which can be a mercury lamp or, in a preferred embodiment, a laser source.
- illumination source 30 can be a mercury lamp or, in a preferred embodiment, a laser source.
- Computer 40 is connected to controller 50 which controls the operation gate pulser 60.
- gate pulser 60 is connected to illumination source 30 and triggers a illumination pulse which results in a fluorescence emissions from the sample 40.
- ICCD camera 70 synchronously under the control of a gate pulse from gate pulser 60.
- Figure 33 illustrates a method of optimizing the image collection process and maximizing the signal-to-noise ratio in accordance with the embodiment of the present invention which is illustrated in Fig. 32.
- the method is based on limiting the interval during which the camera can collect and record images to a time slot when the intensity of the illumination source has gone down to zero, as to eliminate stray light and scattering from this source.
- the heart of the imaging fluorescence lifetime microscope is the coiled image intensified charge coupled device (ICCD).
- ICCD coiled image intensified charge coupled device
- the intensification stage on this camera consists of a microchannel plate, which functions like a bundle of photomultiplier tubes, so that a small number of photons trigger an avalanche of electrons that hit a phosphor screen and produce a bright image.
- the phosphor screen image is sensed by a CCD chip attached to the intensifier by a fiber optic coupler, and the chip-born image is transferred into the camera controller and digitized.
- the intensifier is gated so it can be opened and closed, just like a camera shutter. This "shutter", however, is very fast and has a gating ratio of better than 5x10 6 :l.
- the ICCD is a preferred imaging system for quantitative work using fluorescent lifetime microscopy.
- the gating feature of the ICCD is used to open the shutter only after the excitation pulse is finished, thus substantially eliminating stray light and scattering from the illumination source.
- the emission photons for image collection are generated exclusively from fluorescence under controlled timing, which enables the system to distinguish bound from unbound emissions and stray fluorescence on the basis of fluorescence lifetimes.
- the dye lasers are tuned to 525 nm, and the gate widths are set to 63 ns which is about three times the lifetime of the bound species.
- the lifetime of unbound ethidium bromide fluorescence in water is only about 1.6 ns, so that free fluorochrome emission closely follows the excitation profile and can be excluded. Emissions from other sources of background fluorescence, such as the immersion oil, glass slides and sample impurities can also be attenuated using this technique.
- gated pulses can be timed and synchronized with fluorescence decay.
- the gating pulser is timed to produce a high voltage signal during the fluorescence lifetime of the fluorochrome-DNA complex.
- the high voltage pulse opens and closes the electronic shutter.
- Illumination is pulsed with a 8 ns FWHM duration, so that excitation is present only when the shutter is closed. Eliminating filters using this approach results in increasing the light throughput and removing sources of unwanted fluorescence.
- the laser excitation repetition rate is variable (1-100 Hz), and the fluorescence emissions accumulate as charge on the ICCD head; a resultant image builds up consisting of bright spots with intensities proportional to molecular mass.
- Two nanosecond lasers such as the Continuum Corporation Nd-YAG pumped TiSaphire tunable solid state laser and the Lambda Physik excimer pumped dye laser, are appropriate for use with these method.
- the sensitivity and size resolution of the system can be evaluated using EcoRI digests of lambda bacteriophage DNA stained with ethidium bromide.
- images are generated and the spot intensities corresponding to single molecules are tabulated by image processing routines. These intensities are subsequently used to obtain histograms depicting intensity populations which correspond to fragment size populations.
- the precision and accuracy of the measurements can be calculated and used to set proper bin widths for the histogram analysis. This sort of analysis can be done on DNA molecules flowing through a synthetic silicon matrix.
- DNA fragments are preferably in optimal focus because out-of-focus fragments have intensity values that can vary for same sized molecules.
- surface mounting techniques described herein.
- Other methods can also include the use of centrifugal forces to spread DNA fragments in solution or gel out on a glass surface.
- non-uniform illumination can be corrected by a combination of careful illumination adjustments and by use of processing routines developed for relative intensity measurements in optical mapping. Essentially, this routine locates local surrounding pixels and uses their intensity values to calculate local background values. As described in more detail next, local background values compensate for uneven illumination and act as shading correction.
- fluorochromes can be used, e.g. , having varying degrees of sequence specificity and, if appropriate, fluorochromes with complementary sequence biases, such as ethidium homodimer and ethidium-acridine orange heterodimer.
- the image contrast can be improved further by eliminating unbound fluorochrome.
- ethidium monoazide Molecular Probes, Inc.
- Molecular Probes, Inc. is a fluorochrome that covalently attaches to DNA in high yield by photochemical means, and unbound compound can be readily extracted from the labeled DNA before mounting.
- a series of well-defined DNA fragments can be added to the sample as internal fluorescent size standards.
- concentration of fluorescence intensity standards is adjusted so that they are readily identifiable in any histogram analysis.
- Fluorescence lifetime microscopes can also be used to improve intensity based sizing for larger fragments (50-1,000 kb) or 1-1,000,000 kb.
- the results of the above sizing analysis obtained for a restriction digest of a pure sample can be an optical fingerprint and analogous to a fingerprint (without the hybridization step) derived from gel electrophoretic methods.
- Ancillary methods can use this advanced sizing methodology to produce ordered maps from genomic DNA and YACs of particular individuals or populations or subpopulations at high speed.
- Figure 34 is a block diagram of the high throughput image processing method in accordance with a preferred embodiment of the present invention.
- step A1 of the method is a flat field correction of the raw image.
- the flat field correction is used to provide an image in which pixel values are proportional to the amount of dye present at each pixel location of the sample plane. This operation is typically required in cases when the illumination is not uniform over the entire field of view. It may also be used to eliminate the effects of imperfect image filters which may cause visible beat patterns similar to the Moire effect at the sampling frequencies of the system.
- the correction is based on the assumptions that the emitted fluorescence depends linearly on the amount of illumination in the field of view and that the camera response is linear.
- auxiliary images Two auxiliary images are used to perform the flat field correction: a dark image (no input signal from the field of view) and the image of interest (an illumination image) Both images should be collected under identical conditions with no saturation of the video signal in which case the gray-level histogram of both images is distributed normally.
- the dark image is subtracted on a pixel-by-pixel basis from the illumination image to generate a difference signal which is proportional to the level of illumination at the corresponding pixel of the image generated from the light striking the camera.
- the resulting difference signal at each pixel is then normalized by the value of the corresponding pixel in the illumination image to generate an image in which pixel values are proportional to the amount of dye in the sample.
- the second step A2 of the image processing method in accordance with the present invention is to generate binary images which roughly correspond to and thus identify the contours of the desired molecule fragments.
- thresholding is automated on the basis of constructing a histogram of the image and setting the threshold level for binarization equal to the computed midpoint between gray levels corresponding to background (no light) pixels and gray levels corresponding to foreground (the molecular fragments).
- This step is well known in the art and will not be considered in further detail.
- the step of generating binary images is preceded by a filtering operation designed to remove spot noise or other artifacts that may affect the accuracy of the method.
- spot noise can be eliminated by the use of a 2-D median filter of size 5x5 or 7x7, as known in the art.
- step A3 of the method the imaged molecules are segmented on the basis of the thresholded images. Morphological operation of this type were described in some detail in Section 5.2.
- a seed fragment is selected first by pointing near a desired fragment.
- An overlay image of the selected portion of the image field is next presented after a four-time dilation using pixel replication. Background correction may be used prior to the step of segmentation to reduce the effects of unbound dye or imperfect emission filters.
- the average background pixel value is simply subtracted from each pixel of the image.
- segmentation of the image including for example the computation of the medial axis of the imaged molecule, and the definition and storage of connectivity information is done automatically.
- the segmentation step A3 is complete with the identification of the DNA fragments.
- the identification of fragments is followed by the step of boundary extraction and edge linking as part of a computer routine connecting molecule fragments into complete reconstructed molecules.
- the last step of the high throughput image processing involves sizing of the molecules which have been imaged followed by optical mapping, or possibly optical sequencing, as described in more detail next.
- high throughput optical mapping is used to generate clone maps.
- the method comprises the following steps:
- the proposed optical mapping approach in accordance with a preferred embodiment of the present invention is simple to implement and can thus easily be automated. Furthermore, due to the fact that a large number of measurements can be made in parallel, the method can provide very high throughput and also because of its high accuracy, is expected to provide an extremely valuable analysis tool for all kinds of practical applications.
- Optical sequencing is a genomic analysis technique which is likely to become especially important when used in connection with high speed optical measurements.
- high speed measurements may be utilized in connection with de novo sequencing techniques.
- de novo sequencing techniques For example, such measurements may be used to quickly analyze the size distribution of a Sanger dideoxy sequencing ladder.
- trimmed molecules are labeled or stained according to standard techniques, mounted on the microscope stage and sized using the rotational diffusion methods described above.
- the Sanger sequencing technology provides the ideal substrates (i.e. , stiff, rod-like duplex DNA molecules) for determining rotational diffusion coefficients. Since the dependence of rotational diffusion coefficients on length 3 has been experimentally determined for molecules in this size range (50- 500 bp), a resolution of one base pair difference in size can be achieved. For example a 200 vs. a 199 bp molecule will show a relative rotational diffusion coefficient ratio of 1.025; while a 100 vs. 99 bp molecule will exhibit a ratio of 1.0360. Thus, even when dealing with moderately long polynucleotides, an adequate level of resolving power still exists. Furthermore, the data measured can be expected to be very accurate despite some errors in measurement, since the determined length varies as the time 1/3 measured.
- the total number of chromoforms, and, therefore, the total fluorescence is low.
- Sufficient sensitivity can be achieved by, for example, utilizing a microchannel plate detector that can detect single photons. Further, connecting the microchannel plate detector to a sensitive SIT camera, and averaging using image processing techniques, proper data can be obtained.
- Primer length must also be optimized in order to achieve maximum size differentiation. Specificaly, the primer must be long enough to carry sufficient chromophore for detection of the smallest molecule in the ladder but not so long as to show random coil behavior. Preferably, the minimum primer length which can detect the smallest molecule in the ladder should be utilized.
- a group of discrete molecules is used and analyzed. Size population histograms are obtained from the analysis and statistical analysis is used to fully characterize a given sequencing ladder.
- the image processing equipment can measure many objects in parallel. Since the measured molecules are small, it is possible to image intensity changes of thousands of molecules simultaneously.
- the de novo optical sequencing data rate is, in principle, many times faster than gel-based methods. It is estimated that with millisecond relaxation times and multiple alignment/size determinations lasting 30 cycles/sequence and fast computers, a 300 base pair ladder can be sized in 120 seconds, assuming 4 reactions per sequence, yielding a final rate of 9,000 bp/hour. This rate is approximately fifteen times faster than the automated sequencer rate presented in the National Academy report on mapping and sequencing the human genome.
- OCM dynamic molecule sizing as described in Section 5.2.2.2.1., can be modified to provide high throughput methodology by using a new physical effect to elongate molecules and new image processing methods to measure molecular lengths in real time.
- fluid-gel interfaces provide optimal conditions for differential frictional forces to act on an electrophoresing molecule and elongate it to nearly its full contour length which can be imaged.
- the net elongation force on the molecule is determined by the difference between the value of the DNA frictional coefficient in the gel matrix versus its value the fluid phase.
- the fluid frictional forces are much less than those present in the gel matrix. Typically these forces are at least tenfold less, but differences can vary with gel concentration.
- molecular conformation is dynamic but on the average it is relatively compact.
- this process can be imaged by taking a series of digital images. Next, the apparent length of the molecule can be measured as it is elongated across the boundary between the gel matrix and the fluid; measurements can then be averaged as many times as needed depending upon the desired accuracy.
- high throughput relaxation time measurements are performed by electrophoresing molecules through the gel-fluid interface described above, and estimating the molecular relaxation by measuring the optical length of the molecule at periodic intervals to quantitate the degree of relaxation.
- the changes of the apparent molecular lengths as a function of time can be fitted to a single exponential decay function to obtain the relaxation time.
- solution relaxation mechanisms are somewhat different than gel-based ones, in that coil segments are not confined to move within a tube, or a series of connected gel pores. Rather, in a free solution, elongated DNA molecules relax by evolving from a drawn-out prolate ellipsoid to a more symmetric, spherical conformation. Relaxation times are also shorter in free solution (generally 10-fold less): for example, a 500 kb molecule has a relaxation time of 4 seconds.
- solution relaxation times are inversely proportional to the solution viscosity, measurements on small molecules can be made on a convenient time scale by simply adding glycerol or sucrose to increase the viscosity of the solution. It is significant to note that the shorter relaxation times manifested by solution based relaxation measurements are advantageous for any high throughput approach because they can enable automated collection of images at regular intervals which can then be used to determine automatically the desired relaxation times.
- the high throughput dynamic size measurement techniques of the present invention can be performed by electrophoresing molecules through the interface at a rate of approximately 20-50 molecules/minute. Contour lengths can be measured and tabulated from stored data by the same techniques and computer algorithms developed for optical mapping and coil relaxation measurements. Images, such as those obtained from a SIT camera are rapidly digitized, frame averaged and stored as 16 bit resolution files at a rate of 30 frames/sec. In a specific example, 120 file frame buffers can be used in the analyzing computer. This means that 120, 512x512 pixel images can be digitized and stored in about 4 seconds. More rapid image storage is available by simply reducing the image size, in which case the same hardware can store 480 128x128 pixel images.
- Processing algorithms can thus size 5-10 molecules simultaneously by gathering approximately ten images (by averaging 4-16 frames together) in a 20 second interval.
- One gigabyte hard disk provides storage space for close to 2,000 full frame images or sizing data for 1,000-2,000 molecules.
- Processing algorithms can be set up to work in a batch mode and require approximately 3-5 hours to process one gigabyte worth of image data into 1,000-2,000 sizes tabulated on a spreadsheet. These processing times are based on unattended operation, but operator interfaces can also be used that permit convenient manual identification and marking of molecules for analysis.
- Fluorescence images of DNAs obtained in fluid are generally brighter, sharper and relatively free of fluorescing artifacts compared to those obtained in gel. Consequently, these images are preferred for unattended image processing because they can be transformed reliably into digital or binary images.
- This sizing methodology can be tested and benchmarked by using a series of Not I digested yeast chromosomes mixtures (containing DNAs 30-900 kb), of increasing complexity. Statistical analysis can be performed to calculate the precision of single measurements and to determine the accuracy of the used methodology. Confidence intervals can then be determined to establish the minimum number of molecules necessary for adequate analysis of complex mixtures. This analysis helps determine the usable size resolution and size discrimination levels for the particular equipment and method being used.
- a lower size limit of 5-20 kb and an increased upper size limit are provided in accordance with the present invention due tothe fact that molecules with contour lengths greater than the microscope viewing field are sized by offsetting a known distance from the interface and by monitoring only coil ends.
- G bacteria was grown as described by Fangman, W.L., Nucl. Acids Res., 5, 653-665 (1978) , and DNA was prepared by lysing the intact virus in 1/2 X TBE buffer (1X: 85 mM Trizma Base (Sigma Chemical Co., St. Louis MO), 89 mM boric acid and 2.5 mM disodium EDTA) followed by ethanol precipitation; this step did not shear the DNA as judged by pulsed electrophoresis and microscopic analysis.
- 1/2 X TBE buffer (1X: 85 mM Trizma Base (Sigma Chemical Co., St. Louis MO), 89 mM boric acid and 2.5 mM disodium EDTA) followed by ethanol precipitation; this step did not shear the DNA as judged by pulsed electrophoresis and microscopic analysis.
- DNA solutions (0.1 microgram/microliter in 1/2 X TBE) were diluted (approximately 0.1-0.2 nanogram/al agarose) with 1.0% low gelling temperature agarose (Sea Plague, FMC Corp., Rockport ME) in 1/2 X TBE, 0.3 micrograms/ml DAPI (Sigma Chemical Co.), 1.0% 2-mercaptoethanol and held at 65°C. All materials except the DNA were passed through a 0.2 micron filter to reduce fluorescent debris. Any possible DNA melting due to experimental conditions was checked using pulsed electrophoresis analysis and found not to be a problem.
- Example 1 The sample of Example 1 was placed on a microscope slide. To mount the sample, approximately 3 microliters of the DNA-agarose mixture were carefully transferred to a preheated slide and cover slip using a pipetteman and pipette tips with the ends cut off to reduce shear. Prepared slides were placed in a miniature pulsed electrophoresis apparatus as shown in Figures 1 and 2. All remaining steps were performed at room temperature. Samples were pre-electrophoresed for a few minutes and allowed to relax before any data was collected.
- Pulsed fields were created with either a chrontrol time (Chrontrol Corp., San diego, CA) or an Adtron data generating board (Adtron Corp., Gilbert, AZ) housed in an IBM AT computer and powered by a Hewlett Packard 6115A precision power supply. Field Strength was measured with auxiliary electrodes connected to a Fluke digital multimeter (J. Fluke Co., Everett, WA).
- a Zeiss Axioplan microscope Carl Zeiss, West Germany
- epifluorescence optics suitable for DAPI fluorescence and a Zeiss 1OOx Plan Neofluar oil immersion objective was used for visualizing samples. Excitation light was attenuated using neutral density filters to avoid photodamage to the fluorescently labeled DNA.
- a C2400 silicon intensified target (SIT) camera (Hamamatsu Corp., Middlesex, NJ) was used in conjunction with an IC-1 image processing system (Inovision Corp., Research Triangle Park, NC) to obtain and process video images from the microscope. Images were obtained continuously at the rate of one every five or six seconds, and as many as 200 digitized images could be stored per time course. Each digitized time-lapse image benefitted from the integration of 8 frames obtained at 30 Hz, which was fast enough to avoid streaking due to coil motion. After the time-lapse acquisition was complete, the microscope was brought out-of-focus and a background image was obtained.
- Each time-lapse image was processed by first attenuating a copy of the background image, so that the average background intensity was 82% of the average time-lapse image intensity. The attenuated background was subtracted from the timelapse image and the resultant image was then subjected to a linear-stretch contrast enhancement algorithm. Photographs of the processed images were obtained using a Polaroid Freeze Frame video image recorder (Polaroid Corp., Cambridge, MA).
- Example 2 The molecules of Example 2 were perturbed by POE. POE was accomplished by using a series of relatively short normal pulses of a chosen ratio and then after a longer time period, the polarity of one of the fields was switched.
- the switch time and normal field ratio are analogous to the pulsed electrophoresis variables of pulse time and field angle.
- the image processor is used to quantify and automate the imaging of the relaxation process, for example, through "feature analysis". Feature analysis works after successive images have been digitized and stored, as shown in Fig. 3(a).
- the image processor then identifies discrete objects in the images, numbers them, and characterizes them according to shape. For example, the computer determines the effective ellipsoid axes (long and short) for a collection of distorted coils and calculate these features as a function of time as the coil approaches a spherical conformation during the relaxation process. Other types of computerized measurements also can be made to characterize the DNA.
- the images displayed in Fig. 5, obtained at 12 second intervals, show the relaxation of several molecules over a 96 second time span.
- (a) several coils are shown 3 seconds after the applied field was turned off. The coils appear to relax through the same corrugated staircase path defined by the applied electrical pulses (see molecules marked by arrows) as determined by the limits of microscopic resolution.
- (c) a molecule is shown splitting into two, and by (j), all coils have relaxed to a round, unelongated conformation.
- the bar shown in (j) is 10 microns in length
- Molecules of known molecular weight are prepared for imaging according to the procedures of Examples 1-3, and the relaxation time of the molecules is determined by the methods of Examples 1-4.
- Relaxation time data is collected by imaging and is used to calculate a mathematical relationship between molecular weight and relaxation time of DNA molecules of similar composition.
- the relaxation time of a sample of molecules of unknown size is then measured, and the size of the molecules is calculated using the mathematical relationship determined on the basis of molecules of known size.
- Polymers of any size, but particularly those that are too small to image (less than approximately 0.1 micron), are sized in a matrix such as agarose or polyacrylamide gel by measuring the reorientation rate as induced by an applied electrical field. Although a reorientation measurements could be done in free solution, a matrix is preferred because it prevents unnecessary polymer convection and movement. Additionally the presence of a matrix may enhance the size sensitivity, partly because the orientation mechanism is different. POE is particularly useful for measuring reorientation time because of its experimental versatility and very high size resolution of perhaps 15 to 20 megabases.
- Stiff polymers such as DNA molecules (sized less than 150 base pairs) exist in solution as rods and the rotational diffusion coefficient (the friction felt by the rod as you try to spin about its long axis) varies as M3.
- the rotational diffusion coefficient the friction felt by the rod as you try to spin about its long axis
- M3 the rotational diffusion coefficient
- the reorientation time of each rod in the field of view is preferably measured by spectroscopic methods. Two such methods are described in detail below, namely fluorescence dichroism and birefringence:
- birefringence measurements are made by determining the phase difference of two orthogonally polarized planes of laser radiation (red light) differing by a small frequency difference (supplied by the two frequency laser).
- the refractive index changes with molecular alignment.
- Light is detected by detector 76, and results.in a phase difference in the transmitted radiation, which is measured by the phase detector 78 (Fig. 3(b)) by comparing the value to a standard, sourced at laser 70.
- the phase difference data obtained as a function of time (the period of field application) is digitized and stored on computer 80 for later retrieval and analysis.
- Figs. 1 and 2 applies the necessary fields to cause molecular reorientation. Many different rotational schemes can be described to optimally size molecules in the field. For example, the rotating field frequency can be swept to find resonant frequencies with the polymer sample.
- Molecules in the shape of rods or stiff coils are prepared and observed as in Examples 1-4, except that an acrylamide, rather than agarose gel optionally may be used.
- the rate of rotation of a coil or a rod is measured with a microscope-based system using any one of the techniques described above in Example 6. Measurements are made of a sinusoidally varying signal as the molecule spins about its center.
- the sinusoidal signal is used to determine the polymer size or molecular weight by fitting the period of the sinusoidal signal to the rotational frictional coefficient, which varies as the cube power of the rod length.
- the measured angular velocity as measured from the sinusoidal signal radians/sec.
- the measured angular velocity as measured from the sinusoidal signal radians/sec.
- pairs, triplets or other sets of pulses of 5 volts/cm are successively applied for .1 millisecond in opposite directions, with the direction of the first of each successive set of pulses increasing by 10 degrees in a clockwise direction away from the starting point.
- Molecules of known molecular weight are placed in a gel, and their rotation rate is determined when the above-described electric fields are applied. Rotation time data is collected and is used to calculate a mathematical relationship between molecular weight and rotation time of G bacteriophage DNA molecules in a particular gel. The rotation time of molecules of unknown size is then measured, preferably using a similar electric field, and the size of the molecules is calculated using the mathematical relationship determined on the basis of molecules of known size.
- Examples 1-4 The procedure of Examples 1-4 is followed for molecules of known molecular weight. Measurements of the curvilinear length of the molecules while they are in a perturbed state is collected by visualizing the molecules and is used to calculate a mathematical relationship between molecular weight and length. The curvilinear length of perturbed molecules of similar composition and unknown size is then measured using the procedures of Examples 1-4, and the size of the molecules is calculated using the mathematical relationship determined on the basis of molecules of known size. Figs. 4 and 5 show perturbed molecules for which curvilinear length measurements can be made.
- Examples 1-4 The procedure of Examples 1-4 is followed for molecules of known molecular weight, except that measurements are made when the molecules are in a completely relaxed state. Measurements of the diameter or diameters of the substantially spherical or ellipsoidal G bacteriophage DNA molecules are collected and are used to calculate a mathematical relationship between molecular weight and diameter of G bacteriophage DNA molecules in the gel. The diameter of molecules of unknown size is then measured, and the size of the molecules is calculated using the mathematical relationship determined on the basis of molecules of known size. Figs. 4(a) and 5(j) show relaxed molecules for which diameter measurements can be made.
- Chromosomal DNA molecules from Saccharomyces cerevisiae were prepared and isolated using the insert method and pulsed electrophoresis.
- Low gelling temperature agarose gel FMC Corp. Rockland Maine
- UV radiation can break DNA molecules, desired bands were cut out of the gel, guided by ethidium stained flanking edge sections that were cut out of the gel, which were then photographed on a 301 nm transilluminator apparatus. The bands were then weighed and equilibrated with a 10-fold excess of 10mM spermine in water for 3 hours at room temperature.
- spermine requires a very low ionic strength environment to condense DNA and, notably, the buffers used in electrophoresis are low ionic strength, thus eliminating the need for an equilibration step.
- the equilibrated samples were then melted in an oven at 74°C for two hours and after melting DAPI (1 microgram/ml) and 2-mercaptoethanol (1%) were added. 3 microliters of the melted agarose/DNA mixture were carefully applied to a pre-heated microscope slide and a cover slip was placed on top before the mixture gelled. The slide was then viewed using a Zeiss Axioplan epifluorescence microscope fitted with a 100X Plan Neofluar objective and showed small intensely bright balls which could be decondensed by the addition of salt, through the edges of the coverslip sandwich.
- spermine is particularly useful in an environment of low ionic strength.
- DNA molecules are placed in a highly ionic environment, the same type of condensation effect are accomplished with alcohol. Neither of these examples are to be construed as limiting the scope of the invention.
- the DNA of Schizosaccharomyces pombe a fungus with a genome size of about 17-19 megabases distributed on three chromosomes 3, 6 and 8-10 megabases in size, is prepared for microscopy by condensation and uncollapsing, according to the method of Example 10.
- the 3-5 microliter agarose mixture contains approximately 0.1 nanograms of DNA, 0.5% b-mercaptoethanol, 1 microgram/ml DAPI, 100 micrograms/ml bovine serum albumin (acetylated; Bethesda Research Laboratories, Gaithersburg, MD) and 10-20 units of an appropriate restriction enzyme. This mixture is briefly held at 37°C and carefully deposited on a microscope slide and then topped with a coverslip.
- the DNA Prior to digestion with restriction enzymes the DNA is stretched by one of two ways: (1) the liquid slide/agarose/coverslip sandwich is optionally sheared slightly by moving the coverslip or (2) an electrical field is applied using, for example, the POE instrument described in Fig. 3. A 10 mM magnesium chloride solution is then diffused into the sandwich once the gel has set. When the magnesium ions reach the DNA/enzyme complex, the enzyme cleaves the DNA molecule.
- the positions of the restriction cutting sites are determined by following the DNA strand from one end to the other using the microscope setup and noting cut sites. These sites appear as gaps in the strand, which is continuous before enzymatic digestion.
- the size of each of the fragments is then determined by the microscopic methods of this invention, including, (1) measuring the curvilinear length of each fragment, (2) allowing the fragments to relax and measuring their diameter, (3) perturbing the conformation of each fragment with an applied electrical field or flow field (as generated by moving solvent through a gel) and measuring the relaxation kinetics with direct visual detection of conformational and positional changes or microscopy combined with spectroscopy. Direct visual observation is preferred for larger molecules, while the other methods are well suited for fragments too small to image.
- the resulting sample when viewed using a fluorescence microscope shows a number of bright balls of three different-sizes, with diameters varying as M.33, which is based upon the formula for the volume of a sphere, 4/3R3.
- the gel also contains a restriction enzyme which is active only when magnesium ions are present.
- Nucleic acids are prepared for microscopy as described in Examples 1-4 above.
- the agarose medium containing the nucleic acid molecules also contains labelled probes and a recombinational enzyme, recA, which mediates strand displacement of the target molecule by the probe. Strand displacement and pairing occurs by D-looping (see Radding, C., Ann.Rev.Genet. 16:405-37 (1982) ).
- ATP and magnesium ions are added to begin the reactions. These ingredients are diffused into the slide/gel/ coverslip sandwich as described in Example 11. The reaction is incubated at 37°C. Many different target molecules are simultaneously analyzed, using probes with different labels.
- Variations of the method of this invention other than those specifically described above are within the scope of the invention.
- other parameters of the molecules can be measured, and various types of microscopes and spectroscopic equipment may be used.
- the pulsing routines for effecting molecule rotation can be varied.
- Combinations of the above-described techniques are also contemplated.
- combinations of various types of external forces, mediums and spectroscopic techniques are within the scope of the invention.
- a measuring technique may be repeated several times, and the measurements from each trial may be averaged.
- Optical mapping e.g, as shown in figure 6
- images are made stained, single, deproteinized DNA molecules during restriction enzyme digestion, allowing direct, ordered mapping of restriction sites.
- a flow field or in principle, or other kinds of electrical field
- yeast chromosomal DNA yeast strain AB972
- yeast strain AB972 was resolved by pulsed electrophoresis ( Schwartz et al., Cell 37:67 (1984 )) using 1.00% Seakem low melting agarose (FMC), 1/2x TBE(42.5mM Trizma base, 44.5mM boric acid, 1.25mM disodium EDTA). Cut gel bands were repeatedly equilibrated in TE (10mM Tris-Cl, 1mM EDTA, pH8.0).
- the gel embedded, purified chromosomes were then equilibrated overnight at 4°C in magnesium-free restriction buffer containing 0.1 mg/ml acetylated bovine serum albumin, 1% ⁇ -mercaptoethanol, 0.1% Triton X-100 (Boehringer Manheim, membrane quality), and 0.2 ⁇ g/ml 4', 6-diamino-2 phenylindole dihydrochloride (DAPI) with slow shaking.
- Equilibrated samples ranging in volume from 50 to 100 ul were melted at 72°C for 5 minutes, and then cooled to 37°C. Approximately 0.3 - 0.5ul of enzyme (2 to 14 units/ ⁇ l) was spread on a slide. Enzyme reaction temperatures were as recommended by manufacturers.
- ⁇ -mercaptoethanol was added to discourage photolysis M. Yanagida et al. in Applications of Fluorescence in the Biomedical Sciences, D.L. Taylor et al., Eds. (Alan R. Liss, New York, 1986), pp. 321-345 . and was tested at this concentration for any deleterious effects on digestion using electrophoresis.
- a 7 ⁇ l volume of the melted sample was typically pipetted (slowly) using a wide bore pipette tip onto an 18X18 mm cover glass and rapidly deposited onto a slide. Timing and quenching of the gel is critical for controlling elongation.
- the reaction chamber was then sealed with mineral oil to avoid evaporation, and the agarose was allowed to gel for at least 30 minutes at 4°C, prior to diffusion of 50mM MgCl 2 through an open space.
- chromosome I(240kb) and III (345kb) slides were in a cold desiccator (4°C) prior to casting to hasten gelling avoiding premature molecular relaxation.
- slides were kept at room temperature. The slide was placed on a temperature controlled microscope stage at 37°C (except CspI, 30°C). The gelatin process restrains elongated molecules from appreciably relaxing to a random coil conformation during enzymatic cleavage.
- a restriction enzyme is added to the molten agarose-DNA mixture and cutting is triggered by magnesium ions diffused into the gelled mixture (mounted on a microscope slide). Cleavage sites are visualized as growing gaps in imaged molecules.
- DNA molecules were imaged using a Zeiss Axioplan or Axiovert 135 microscope equipped for epi-fluorescence (487901 filter pack for UV excitation and Blue emission) and a 100X or 63X Plan-Neofluar objective (Zeiss) coupled to Hammamatsu C2400 SIT cameras. Care was taken to adjust the camera controls to avoid saturating the digitizer at either end of the intensity range.
- Length and relative fluorescence intensity were calculated to 16-bit precision using a modified version of NIH Image for Macintosh by Wayne Rasband, available upon request from the authors (e-mail huff@ mcclb0.med.nyu.edu). Briefly, the original unprocessed image was displayed in an enlarged format and an overlay image was prepared by manually tracing the DNA. The length map was made directly from this overly. For intensity calculations, the 13-bit raw data image was smoothed and the overlay image was dilated five times to cover all foreground pixels. For each pixel marked on the overlay, a synthetic background value was calculated as the weighted average of surrounding pixels, with a weight that decreased with distance, but was zero for all marked pixels.
- the intensity of a particular DNA fragment was the sum of all pixels of the fragment minus the matching background pixels.
- the are of the fragment was the original overlay dilated twice. This process was repeated for each frame of raw data which had an overlay image, excluding those with poor focus. Intensity results were averaged for five images following a cut, and the relative sizes of the two fragments were calculated as x/(x+y) and y/(x+y). If fragment y later cuts into u and v, then (y/(x+y))(u(u+v)) is used for the size of u. The resulting numbers constitute a single sample for the purposes of subsequent analysis.
- Averaging a small number of molecules rather than utilizing only one improves accuracy and permits rejection of unwanted molecules.
- the samples were averaged and the 90% confidence interval on the mean was calculated using the t distribution with n-1 d.f. and the sample standard deviation. This calculation is valid if the data represent random samples from a normal distribution. There is a 90% chance that the population mean falls within the confidence interval.
- the reported confidence interval was found by taking the lower bound from the short fragments and upper bound from the long fragments.
- the 90% confidence interval for the population standard deviation was calculated using the sample standard deviation, the number of samples, and the chi-square distribution with n-1 d.f. The midpoint of this interval was used to estimate the population standard deviation.
- the coefficient of variation is the estimated population standard deviation divided by the sample mean.
- the pooled standard deviation is the square root of the average of the variances.
- the relative error is the differences between value obtained hrein and the reported value divided by the reported value.
- Optical map production is very rapid because of the combination of restriction fragment ordering in real time with fast accurate sizing techniques.
- Optical mapping is a powerful new technology for rapidly creating ordered restriction maps of eucaryotic chromosomes or YACs, without the need for analytical electrophoresis, cloned libraries, probes, or PCR primers. Incremental technical improvements should enable the rapid high resolution mapping of mammalian chromosomes and ordering of YACs.
- Yeast chromosomal DNA (yeast strain AB972) was resolved by pulsed electrophoresis ( D. C. Schwartz and C.R. Cantor, Cell 37,67 (1984 )) using 1.00% Seakem low melting agarose (FMC), 1/2x TBE(42.5mM Trizma base, 44.5mM boric acid, 1.25mM disodium EDTA). Cut gel bands were repeatedly equilibrated in TE (10mM Tris-Cl, 1mM EDTA, pH8.0).
- the gel embedded, purified chromosomes were then equilibrated overnight at 4°C in magnesium-free restriction buffer containing 0.1 mg/ml acetylated bovine serum albumin, 1% ⁇ -mercaptoethanol, 0.1% Triton X-100 (Boehringer Manheim, membrane quality), and 0.2 ⁇ g/ml 4', 6-diamino-2 phenylindole dihydrochloride (DAPI) with slow shaking.
- Equilibrated samples ranging in volume from 50 to 100 ul were melted at 72°C for 5 minutes, and then cooled to 37°C. Approximately 0.3 - 0.5ul of enzyme (2 to 14 units/ ⁇ l) was spread on a slide. Enzyme reaction temperatures were as recommended by manufacturers.
- ⁇ -mercaptoethanol was added to discourage photolysis M. Yanagida et al. in Applications of Fluorescence in the Biomedical Sciences, D.L. Taylor et al., Eds. (Alan R. Liss, New York, 1986), pp. 321-345 . and was tested at this concentration for any deleterious effects on digestion using electrophoresis.
- a 7 ⁇ l volume of the melted sample was typically pipetted (slowly) using a wide bore pipette tip onto an 18X18 mm cover glass and rapidly deposited onto a slide. Timing and quenching of the gel is critical for controlling elongation.
- the reaction chamber was then sealed with mineral oil to avoid evaporation, and the agarose was allowed to gel for at least 30 minutes at 4°C, prior to diffusion of 50mM MgCl2 through an open space.
- chromosome I(240kb) and III (345kb) slides were in a cold desiccator (4°) prior to casting to hasten gelling avoiding premature molecular relaxation.
- slides were kept at room temperature. The slide was placed on a temperature controlled microscope stage at 37°C (except CspI, 30°C). Experimentally, the kinetics of gelation are controlled by temperature, and optimization of the annealing conditions.
- Yeast chromosomal DNA (yeast strain AB972) was resolved by pulsed electrophoresis ( D. C. Schwartz and C.R. Cantor, Cell 37,67 (1984 )) using 1.00% Seakem low melting agarose (FMC), 1/2x TBE(42.5mM Trizma base, 44.5mM boric acid, 1.25mM disodium EDTA). Cut gel bands were repeatedly equilibrated in TE (10mM Tris-Cl, 1mM EDTA, pH8.0).
- the gel embedded, purified chromosomes were then equilibrated overnight at 4°C in magnesium-free restriction buffer containing 0.1 mg/ml acetylated bovine serum albumin, 1% ⁇ -mercaptoethanol, 0.1% Triton X-100 (Boehringer Manheim, membrane quality), and 0.2 ug/ml 4', 6-diamino-2 phenylindole dihydrochloride (DAPI) with slow shaking.
- Equilibrated samples ranging in volume from 50 to 100 ul were melted at 72°C for 5 minutes, and then cooled to 37°C. Approximately 0.3 - 0.5ul of enzyme (2 to 14 units/ ⁇ l) was spread on a slide. Enzyme reaction temperatures were as recommended by manufacturers.
- ⁇ -mercaptoethanol was added to discourage photolysis M. Yanagida et al. in Applications of Fluorescence in the Biomedical Sciences, D.L. Taylor et al., Eds. (Alan R. Liss, New York, 1986), pp. 321-345 . and was tested at this concentration for any deleterious effects on digestion using electrophoresis.
- a 7 ⁇ l volume of the melted sample was typically pipetted (slowly) using a wide bore pipette tip onto an 18X18 mm cover glass and rapidly deposited onto a slide. Timing and quenching of the gel is critical for controlling elongation.
- the reaction chamber was then sealed with mineral oil to avoid evaporation, and the agarose was allowed to gel for at least 30 minutes at 4°C, prior to diffusion of 50mM MgCl2 through an open space.
- slides were in a cold desiccator (4°) prior to casting to hasten gelling avoiding premature molecular relaxation.
- slides were kept at room temperature. The slide was placed on a temperature controlled microscope stage at 37°C (except CspI, 30°C). Excessively stretched molecules present too little fluorochrome per imaging pixel, so that measured molecular intensities approach background values. Additionally, the fixation process has to be gentle enough to permit some coil slippage to reveal cut sites. Taking these and other considerations into account, the present fixation conditions were optimized to produce molecules spanning approximately 20% of their curvilinear contour lengths.
- Gaps appear because a molecule experiences an effective tension since the configurational entropy of the elongated polymer is lower than that of the relaxed state.
- the process can be compared to watching the relaxation of a stretched-out thick rubber band encased in a tight tube, with holes in the sides. Cleavage accelerates relaxation by creating new ends within a molecule, and possibly also by causing a mechanical perturbation that releases trapped fragments from local energy minima.
- a high numerical aperture microscope objective can produce bright, high contrast images of stained DNA molecules, but with a very shallow depth of focus.
- Our method of gel fixation reproducibly allows visualization of molecules that are within this 0.2 micron tolerance as measured optically. This remarkable degree of optical flatness results from a laminar, parabolic fluid flow pattern generated between the glass surfaces, prior to gelation.
- dissolved agarose and DNA molecules may potentiate this effect by facilitating laminar flow, while preventing onset of turbulence.
- gel fixation of large DNA molecules is convenient enough to be broadly applicable to other systems, especially when biochemical reactions can be coupled to visualizable events.
- Yeast chromosomal DNA (yeast strain AB972) was resolved by pulsed electrophoresis ( D. C. Schwartz and C.R. Cantor, Cell 37, 67 (1984 )) using 1.00% Seakem low melting agarose (FMC), 1/2x TBE(42.5mM Trizma base, 44.5mM boric acid, 1.25mM disodium EDTA). Cut gel bands were repeatedly equilibrated in TE (10mM Tris-Cl, 1mM EDTA, pH8.0).
- the gel embedded, purified chromosomes were then equilibrated overnight at 4°C in magnesium-free restriction buffer containing 0.1 mg/ml acetylated bovine serum albumin, 1% ⁇ -mercaptoethanol, 0.1% Triton X-100 (Boehringer Manheim, membrane quality), and 0.2 ug/ml 4', 6-diamino-2 phenylindole dihydrochloride (DAPI) with slow shaking.
- Equilibrated samples ranging in volume from 50 to 100 ul were melted at 72°C for 5 minutes, and then cooled to 37°C. Approximately 0.3 - 0.5ul of enzyme (2 to 14 units/ ⁇ l) was spread on a slide. Enzyme reaction temperatures were as recommended by manufacturers.
- ⁇ -mercaptoethanol was added to discourage photolysis M. Yanagida et al. in Applications of Fluorescence in the Biomedical Sciences, D.L. Taylor et al., Eds. (Alan R. Liss, New York, 1986), pp. 321-345 . and was tested at this concentration for any deleterious effects on digestion using electrophoresis.
- a 7 ⁇ l volume of the melted sample was typically pipetted (slowly) using a wide bore pipette tip onto an 18X18 mm cover glass and rapidly deposited onto a slide. Timing and quenching of the gel is critical for controlling elongation.
- the reaction chamber was then sealed with mineral oil to avoid evaporation, and the agarose was allowed to gel for at least 30 minutes at 4°C, prior to diffusion of 50mM MgCl2 through an open space.
- chromosome I(240kb) and III (345kb) slides were in a cold desiccator (4°C) prior to casting to hasten gelling avoiding premature molecular relaxation.
- slides were kept at room temperature. The slide was placed on a temperature controlled microscope stage at 37°C (except CspI, 30°C). Aside from gaps, cleavage is also signaled by the appearance of bright condensed pools or "balls" of DNA on the fragment ends at the cut site.
- a typical mounted sample contains approximately 3-5 molecules within a single viewing field and overall, roughly 50-95% of them show evidence of one or more cuts by the criteria described here.
- the histograms in Fig. 7 show that the overall number of cut sites exceeding published results is quite low.
- the cutting frequency results (Fig. 7B) for chromosome V digested with Not I show that the number of fully cut molecules is approximately half that of all singly cut molecules: the value corresponding to complete digestion is caculated by assuming that an equal distribution of identically sized chromosome V and VIII DNA molecules are present in the mounted sample.
- the Not I restriction maps for these chromosomes reveal that chromosome V has 3 cut sites, while VIII has only 2. Chromosome XI cutting frequency data (Fig.
- the maximum number of cuts determined by histogram analysis is the bin containing the largest number of cut sites whose molecules can be properly averaged by intensity and length measurements for size.
- the ends of chromosome I embedded in agarose are behaving as a sort of molecular rivet (Fig. 9), reacting to the tension developed between it and the intervening molecular segments to provide ideal mechanical conditions for cut detection. It seems likely that short-range interactions will predominate so that the amount of relaxed coil present at the ends of elongated molecules will not vary much with molecular mass above some threshold in size. Consequently, a relatively short molecule, such as chromosome I, will contain a greater proportion of relaxed coil segments at its end than longer ones, such as chromosomes XIII and XVI.
- the second step is to size the resulting restriction fragments.
- two complementary approaches can be used, one based on relative fragment fluorescence intensity and the second on apparent relative length measurements.
- neither approach provides absolute values, but each can be standardized readily.
- the gel fixation technique described above produces a natural substrate for intensity measurements since an entire molecule can be brought into focus. Gel fixation is able to flatten molecules spanning as much as 250 ⁇ m. Segments of molecules that are out of focus cannot be used for intensity measurements because their intensities are not proportional to mass in any simple way.
- the absolute fluorescence intensity of a DNA fragment in the microscope is determined by many variables, such as the camera gain control and lamp brightness, and therefore is not a desirable quantity to measure.
- Relative intensities are converted to kb by multiplying by the know or independently determined chromosome size. Length and relative fluorescence intensity were calculated to 16-bit precision using a modified version of NIH Image for Macintosh by Wayne Rasband, available upon request from the authors (e-mail huff @ mcclb0.med.nyu.edu).
- the original unprocessed image was displayed in an enlarged format and an overlay image was prepared by manually tracing the DNA.
- the length map was made directly from this overlay.
- the 13-bit raw data image was smoothed and the overlay image was dilated five times to cover all foreground pixels.
- a synthetic background value was calculated as the weighted average of surrounding pixels, with a weight that decreased with distance, but was zero for all marked pixels. These values are intended to approximate those which would have been measured had the DNA been absent.
- the intensity of a particular DNA fragment was the sum of all pixels of the fragment minus the matching background pixels. The area of the fragment was the original overlay dilated twice.
- FIG. 10A shows intensity values for a series of yeast chromosome Not I restriction fragments measured optically and plotted against published values derived from electrophoresis based measurements ( Link, Genetics, 127, 681, 1991 ). Points close to the diagonal line are in good agreement. Disregarding the chromosome V and VIII results, which were based on low precision (8-bit) intensity data, and disregarding the two short fragments less than 60kb, the pooled standard deviation is 36kb (Fig. 10A inset) and the average of the coefficients of variation is 16%, comparable to routine pulsed electrophoresis size determinations.
- the correlation with published results is excellent: the average of the relative errors is 5% whereas the published errors average 4% ( Link, Genetics, 127, 681, 1991 ).
- the samples were averaged and the 90% confidence interval on the mean was calculated using the t distribution with n-1 d.f. and the sample standard deviation. This calculation is valid if the data represent random samples from a normal distribution. There is a 90% chance that the population mean falls within the confidence interval.
- the reported confidence interval was found by taking the lower bound from the short fragments and the upper bound from the long fragments.
- the 90% confidence interval for the population standard deviation (Fig. 10 inset graphs) was calculated using the sample standard deviation, the number of samples, and the chi-square distribution with n-1 d.f.
- the midpoint of this interval was used to estimate the population standard deviation.
- the coefficient of variation (CV) is the estimated population standard deviation divided by the sample mean.
- the pooled standard deviation is the square root of the average of the variances.
- the relative error is the differences between our value and the reported value divided by the reported value. Due in part to the intensity normalization procedure, the precision becomes lower for very small fragments, and size agreement is poor for the 30 and 55 kb measurements. Fluorescence intensity measurements size these fragments at almost twice the established values as described below. Changes in the algorithm for correcting the backgrounds of these measurements and the data collection process should improve the precision significantly.
- Fig. 11 shows the results of absolute intensities versus molecular length measurements for three typical sizes. These results show that intensities remain relatively constant over a wide size range despite a 3-4 fold change in measured molecular length. This beneficial effect is attributed in part to the mild fixation conditions, so that Brownian motion can dither the elongated coil along the z-axis; this motion is clearly observed on the live video monitor as digestion proceeds. By averaging frames over a 1 second interval most of the DNA is observed as it moves through the focal plane and within the gel pores.
- the original unprocessed image was displayed in an enlarged format and an overlay image was prepared by manually tracing the DNA.
- the length map was made directly from this overlay.
- the 13-bit raw data image was smoothed and the overlay image was dilated five times to cover all foreground pixels.
- a synthetic background value was calculated as the weighted average of surrounding pixels, with a weight that decreased with distance, but was zero for all marked pixels. These values are intended to approximate those which would have been measured had the DNA been absent.
- the intensity of a particular DNA fragment was the sum of all pixels of the fragment minus the matching background pixels. The area of the fragment was the original overlay dilated twice.
- Apparent molecular length measurements are more robust than intensity measurements, but are less precise, and consequently require additional measurements to achieve an equivalent degree of accuracy. But good length measurements can be obtained from slightly out-of-focus fragments, whereas blurry, out of focus images will confound intensity based measurements. Size determination of small fragments by length were better than intensity. The 30kb fragment was sized at 44kb by length vs. 70kb by intensity, and the 55kb fragment was sized at 49kb vs. 88kb. Given the limited sample number inherent to optical mapping, having two sizing methods for cross-checking results is extremely important for successful map making.
- FIG. 12 illustrates three types of ordered restriction maps produced by optical mapping compared with ( Link, Genetics 127, 681, 1991 ). The bars shown correspond to sizing analysis results of the Not I restriction fragment as plotted in Fig. 10.
- Fig. 13 shows selected processed fluorescence micrographs of different yeast chromosomal DNA molecules digested with Not I. Yeast chromosomal DNA (yeast strain AB972) was resolved by pulsed electrophoresis ( D. C. Schwartz and C.R.
- the gel embedded, purified chromosomes were then equilibrated overnight at 4°C in magnesium-free restriction buffer containing 0.1 mg/ml acetylated bovine serum albumin, 1% ⁇ -mercaptoethanol, 0.1% Triton X-100 (Boehringer Manheim, membrane quality), and 0.2 ug/ml 4', 6-diamino-2 phenylindole dihydrochloride (DAPI) with slow shaking.
- Equilibrated samples ranging in volume from 50 to 100 ul were melted at 72°C for 5 minutes, and then cooled to 37°C. Approximately 0.3 - 0.5ul of enzyme (2 to 14 units/ ⁇ l) was spread on a slide. Enzyme reaction temperatures were as recommended by manufacturers.
- ⁇ -mercaptoethanol was added to discourage photolysis ( M. Yanagida et al. in Applications of Fluorescence in the Biomedical Sciences, D.L. Taylor et al., Eds. (Alan R. Liss, New York, 1986), pp. 321-345 .) and was tested at this concentration for any deleterious effects on digestion using electrophoresis.
- a 7 ⁇ l volume of the melted sample was typically pipetted (slowly) using a wide bore pipette tip onto an 18X18 mm cover glass and rapidly deposited onto a slide. Timing and quenching of the gel is critical for controlling elongation.
- the reaction chamber was then sealed with mineral oil to avoid evaporation, and the agarose was allowed to gel for at least 30 minutes at 4°C, prior to diffusion of 50mM MgCl2 through an open space.
- chromosome I(240kb) and III (345kb) slides were in a cold desiccator (4°) prior to casting to hasten gelling avoiding premature molecular relaxation.
- slides were kept at room temperature. The slide was placed on a temperature controlled microscope stage at 37°C (except CspI, 30°C). These images clearly show progressive digestion by the appearance of growing gaps in the fixed molecules. From such data fragment, order was determined from inspection of time-lapse images obtained every 20 seconds.
- DNA molecules were imaged using a Zeiss Axioplan or Axiovert 135 microscope equipped for epi-fluorescence (487901 filter pack for UV excitation and Blue emission) and a 100X or 63X Plan-Neoflua objective (Zeiss) coupled to Hammamatsu C2400 SIT cameras. Care was taken to adjust the camera controls to avoid saturating the digitizer at either end of the intensity range. Every 20 seconds, 32 video frames were digitized to 8 bits and integrated to give 13 bit precision by a Macintosh based Biovision image processor or a Pixel pipeline digitizer (Perceptics Corp.). A computer controlled shutter was used to limit illumination to 1.5 seconds per image giving a total of about 135 to 255 seconds for typical experiments.
- Fig. 14 shows the ordered restriction maps created from Rsr II digestion of chromosome III and XI and Asc I digestion of chromosome XI by optical mapping
- Fig. 15 shows the corresponding fluorescence micrographs of typical digests. Relative apparent length results, using the pooled population standard deviation of 47kb to calculate confidence intervals. Chromosome, enzyme, mean +/- 90% confidence kb (number of samples). Ch. III Rsr II 264 +/- 27(8), 8.6 +/- 27(8). Ch. XI Asc I 42 +/- 55(2), 195 +/- 55(2), 242 +/- 55(2). Ch.
- Relative fluorescence intensity results, using the pooled population standard deviation of 36kb to calculate confidence intervals.
- Ch. III Rsr II 256 +/- 21(8).
- a new set of analytical approaches to physical mapping of very long molecules, such as DNA molecules, is thus provided according to the present invention, that is simple and intrinsically very rapid.
- a nearly real time mapping procedure for chromosomes of yeast has been implemented, but this is far from the ultimate capability of the methodology. Since most traditional tools of genomic analysis are bypassed, including cloning, electrophoresis, Southern analysis and PCR, additional speed increases in optical mapping are not predicated on advances in robotics or automation ( Chumakov, Nature 359:380, 1992 ).
- the size resolution of the optical mapping technique is greatly improved upon by the imaging individual DNA molecules elongated and fixed onto derivatized glass surfaces. Averaged fluorescence intensity and apparent length measurements accurately determined the mass of restriction fragments 800 base pairs long. Specifically, such a solid surface bsed optical mapping technique has been used to create ordered restriction maps for lambda clones derived from the mouse Pygmy locus.
- DNA molecules were imaged by a Zeiss Axiovert 35 microscope equipped for epifluorescence and a 100X Plan-Neofluar objective (Zeiss).
- Zeiss a 100X Plan-Neofluar objective
- a Hammatsu C2400 SIT camera was used to focus a cooled digital CCD camera (1032 x 1316 pixels) controlled by standard, commercially available software running on a Quadra 900 computer.
- Analyzed clones come from a lambda FIX II library constructed from a YAC, mapped to the mouse Pygmy locus. Cells were grown and infected with plate grown phage using standard protocols and DNA was prepared using a commercially available kit (Qiagen, Germany) with small modifications. Restriction digests were performed as per manufacturers directions and analyzed using conventional and pulsed field gel electrophoresis. Gels were stained with ethidium bromide and documented with Polaroid film and a UV transilluminator.
- the length and number of DNA molecules from different locations were averaged.
- the number of molecules available on per image view were calculated from the DNA concentration, sample volume and the image area.
- the ratios of the average number of molecules to the available molecules, present in solution, were calculated and plotted against the polylysine concentration.
- Map construction Maps were constructed from optical data using techniques described in Example 13, above, with some modifications. Briefly, the image processing steps were flat field correction, background correction, segmentation, pixel value integration, and intensity ratio calculation. The relative intensities of the fragments were calculated and the size in kb was found by multiplying by the known total size. The empirical calibration function was applied to eliminate a systematic underestimate of small fragments sizes. Fragments less than 6.5 kb were divided by 0.665. Larger fragments are adjusted to preserve the known total size.
- Relative apparent lengths were calculated by magnifying the image fourfold by pixel replication and using a mouse to place a segmented line along each fragment. Fragment ends are placed at the center of the gap between fragments. The length of each fragment was the sum of the lengths of the straight line segments. The size in kb was found by dividing by the sum of all fragments and multiplying by the known total size.
- Polylysine has long been used to fix cells to glass surfaces ( Williams, Proc. Natl. Acad. Sci. USA 74:2311-2315, 1977 ). Extensive measurements of polylysine coated mica surfaces by refractive index measurements ( Luckham and Klein, Chem. Soc., Faraday Trans. I, 80:865-878, 1984 ) showed that polylysine coils can be compressed onto the surface and thus alter its properties. Given the extensive history of polylysine use in cell biology, it was reasoned that polylysine coated glass would be simple to control and be biochemically compatible.
- the molecular weight and concentration of polylysine used for surface derivitization is critical: too much and the molecules are severely fixed and biochemically inert; too little, and the elongated DNA. molecules relax quickly to a random coil conformation. These are precisely the concerns successfully dealt with in the previous agarose-based optical mapping methodology.
- the polylysine concentration was optimized by plotting the average molecular extension and count found on the surface versus polylysine concentration. Fluorescence microscopy was used to image labeled molecules on the surface.
- the average molecular extension increased with polylysine concentration and peaked at 10 -6 g/ml; further increase of polylysine concentration reduced the molecular extension. Predictably, the molecule count on the surface increased.
- Molecules were first fixed onto the polylysine coated surface by sandwiching a sample between a treated coverslip and a slide.
- the DNA sample consisted of DNA, restriction buffer minus magnesium ions, ⁇ -mercaptoethanol and a fluorochrome. It was found that ethidium homodimer ( Glazer et al., Proc. Natk. Acad. Sci. USA. 87:3851-3855, 1990 ) was compatible with most restriction endonucleases. Coverslips were sealed and a small hole in the slide was used as an inlet for restriction enzyme and magnesium ions.
- Restriction digests were originally imaged using a SIT camera and a 512 x 512 pixel digitizing system housed in a Macintosh computer3.
- a cooled CCD was later obtained having higher spatial resolution (1032 x 1316 pixel), which produced images with less noise, less spatial distortion, and better linearity. It is the preferred instrument for imaging small DNA molecules (below 20 kb). Starting with high contrast, noise-free images simplifies image processing procedures and streamlines data extraction techniques.
- Fig. 17 shows typical images of lambda clone DNA molecules. 800 bp DNA fragments were easily imaged (Fig. 17w). Generally 20-80 x 62 micron microscope fields were imaged, containing approximately 100 suitable molecules.
- fixation conditions chosen optimized molecular extension and provided a reasonable number of surface-bound molecules. Fixation conditions, however, are not perfect so that not all molecules were optimally extended, as indicated by the data shown in Fig. 16, and some molecules intersected. Imperfectly fixed molecules were not selected for map-making. Fig. 17 shows typical molecules selected for map-making.
- the size resolution of fluorescence microscopy is approximately 0.1 microns which translates into approximately 300 bp of B-DNA. Theoretically, smaller molecules can be detected, but with no spatial resolution.
- the usable size range of the system described here extends from 28 kb to 800 bp (see Figs. 17 and 18) and is based on measuring relative apparent lengths and relative fluorescence intensities of restriction endonuclease fragments from the same parental molecule. This is similar to the technique used in Example 13, above, to construct restriction maps of Saccharomyces cerevisiae.
- Fig. 20B shows a separate plot of fluorescence intensity determined masses versus gel electrophoresis data. The best fit line through the origin was used as a calibration curve to correct small fragments. Large fragments were adjusted to maintain the total size.
- Fig. 20C shows the results after correction.
- Fig. 20D shows the relative apparent length results.
- Fig. 19 shows the EcoRI and BamH I maps constructed by Optical Mapping, of Lambda FIX II clones derived from the mouse Pygmy locus19.
- Table 1 shows the fragment sizes.
- Fig. 20 shows typical cleavage patterns by enzymes which cut at the polylinker site and therefore permit absolute size calculations based on the known size of the vector arms rather than on PFGE measurements of uncut clones.
- Table 2 shows results from PFGE, fluorescence intensity, and apparent length measurements of digests with enzymes (Sal I, NotI or SstI) which cut at the polylinker site.
- Optical mapping with these enzymes permits calculation of the total size of the clone. This value can then be used to calculate sizes for Optical Mapping with enzymes that do not cut the polylinker.
- Ordered restriction endonuclease maps were constructed using procedures developed in Example 13, above. Briefly, the correct number of fragments by constructing a histogram for each clone consisting of the number of imaged restriction fragments per parental molecule, and its frequency. Generally 100 molecules of each clone were analyzed, and 5-10 molecules were selected for map construction based fragment number and map content. Usually these molecules originated from histogram bins containing the maximum number of restriction fragments. Studying molecule images after digestion provided fragment order, and relative fragment masses were assigned by relative fluorescence intensity and relative apparent length measurements. Fragment lengths were measured starting at the midpoint of the gap between fragments. The final map is reported as an average of restriction fragment sizes derived from similar molecules. Molecules were considered similar if the fragment number agreed and homologous fragment sizes were within the stated measurement precision.
- the maps were first constructed by optical mapping and then confirmed by gel electrophoresis data generated in this laboratory and compared to the previously constructed contig maps.
- Optical lapping requires an internal size standard: the uncut clone or clearly identifiable fragments such as the vector arms.
- gel data was used to size the uncut clone.
- Pulsed field gel electrophoresis was performed on an ED apparatus ( Schwartz et al., Nature 342:575-576, 1989 ). YAC sizes were measured by comparing relative electrophoretic mobilities to lambda DNA concatamers and yeast chromosomes.
- PFGE maps of 7H6 and 314 were constructed by Southern blotting YAC DNAs cut with different restriction enzymes. Blots were hybridized ( Church and Gilbert, Proc. Natl. Acad. Sci. USA 81:1991, 1984 ) with radiolabelled human Alu repeat probe. Ordered maps of 3H5, 5L5 and 6H3 were constructed by partial digestion ( Smith and Birnstiel, Nucleic Acids Res. 3:2387-2399, 1976 ) using probes derived from the right and left cloning arms.
- Chambers were resealed and incubated 1-2 hours at 37°C. After digestion, samples were stained either with ethidium homodimer (Molecular Probes, 0.1 ng/ml ethidium homodimer, 15 mM EDTA (pH 7.5) and 10% 2-mercaptoethanol) or oxazole yellow homodimer (YOYO-1) (Molecular Probes, 0.1ng/ml YOYO-1, 15 mM EDTA, pH 7.5, and 20% 2-mercaptoethanol). Dilution of high molecular weight DNA. It is important to control DNA concentration when mounting DNA molecules for optical mapping.
- DNA molecules excised as bands from low melting temperature PFGE gels often must be diluted before mounting, as follows: Incubate gel band for 2 hours in 0.01 mM spermine tetrachloride (Sigma) in TE buffer (10 mM Tris, pH 7.6; 1 mM EDTA). This step condenses the gel-embedded DNA molecules into shear resistant particles, protecting them during dilution. Next melt gel bands at 72°C for 7 minutes and mix with additional molten low melt agarose containing 0.01 mM spermine. Vortexing at this step causes little apparent breakage.
- Diluted samples are made into gel inserts ( Schwartz and Cantor, Cell 37:67-75, 1984 ) which are then washed 5 times, 30 minutes each with shaking, with TE buffer to remove the spermine and thereby decondense the DNA particles.
- the first wash is in TE supplemented with 100 mM NaCl.
- Gel inserts were stored in 10 mM Tris, 0.5 mM EDTA, pH 7.6.
- DNA molecules were imaged using a Zeiss Axioplan or Axiovert 135 microscope equipped for epi-fluorescence (filter pack for green excitation and red emission) and a 100X Plan-Neofluar objective (Zeiss) coupled to a Hamamatsu C2400 SIT camera (Example 13).
- a typical 100 micron microscopic field contained three to five molecules suitable for analysis.
- Efficiency of restriction endonuclease digestion was scored by counting gaps in molecules with known restriction maps. Digestion efficiencies did not differ among the enzymes used in this study. Restriction maps were constructed as described in Example 13.
- Fig. 21 shows a plot of APTES concentration versus average molecular extension and number of molecules per 100 m 2 field. At low APTES concentration, the average molecular extension as well as the number of molecules detected on the surface was minimal.
- the average molecular extension increased with APTES concentration and peaked at 3 hours; further increase in APTES concentration reduced molecular extension and, predictably, increased the number of molecules on the surface. It is not known exactly how large DNA molecules interact with an APTES modified surface. One may speculate that attractive electrostatic forces between DNA and the charged surface are balanced, to some extent, by the molecular flow forces generated during the mounting procedure. The surface charge density increases as more APTES is deposited, while flow forces remain constant. Thus, minimum molecular extension should be measured at high and low APTES surface densities. Based on the data shown in Fig. 21, it was initially decided to use glass surfaces incubated in APTES for 3 hours.
- a shear-free dilution protocol was developed based on spermine condensation ( Gosule and Schellman, J. Mol. Biol. 121:311-326, 1978 ). The protocol successfully collapses DNA coils embedded within agarose so that molten agarose can even be vortexed without significant DNA breakage.
- the spermine DNA condensation/sample dilution step was used for all YAC samples. After dilution, spermine was removed by washing gel inserts in excess TE buffer.
- the overall relative error with surface mounted molecules was 4%, identical to results obtained by standard methods ( Link and Olson, Genetics 127:681, 1991 ) and the average of the coefficients of variation was 12%, indicating precision comparable to routine PFGE analysis. Mass determination by measuring length of surface mounted molecules is also superior to previous results with gel mounted molecules. The length measurements showed a pooled SD of 32 kb vs. 47 kb and the average of the coefficients of variation was 29%. The relative error was 7%, which was not as accurate as the fluorescence intensity data. These fragment sizing studies show that fluorescence intensity is more accurately and reliably correlated to mass than length. Overall, the images of surface mounted molecules were consistently in one focal plane.
- Oxazole yellow homodimer (YOYO-1) vs. ethidium homodimer were tested to optically map YAC clones 3H5, 5L5 and 6H3.
- the YOYO-1 images were brighter and of higher contrast than those made with ethidium homodimer.
- high salt conditions diminish the fluorescence emission of ethidium stained molecules
- YOYO-1 stained molecules retain luminosity in high salt and under severe fixation conditions.
- serious photodamage to DNA was observed in solution with YOYO-1, manifested as double strand breaks, even in the presence of 2-mercaptoethanol.
- YACs Five YACs were optically mapped with restriction endonucleases MluI, EagI, NruI and NotI using the optimized APTES fixation and YOYO-1 staining conditions described above. In general, images were clear and high contrast. Maps were constructed using previously described procedures (Example 13), with minor modifications to exploit the potential of high contrast imaging. The analysis necessary for map construction was simplified, in comparison to the previous approach, since molecules were imaged after digestion. Long image integration times were used, and only one image was collected per microscope field. Previous procedures (Example 13) required the examination of a series of time lapse images and the analysis of 4-5 contiguous (temporal) images.
- the cleavage sites of surface mounted molecules were flagged by the appearance of gaps, and fragment ends occasionally displayed bright regions of condensed DNA.
- the YACs were further characterized by double digests. Some of the resulting maps include as many as 6 fragments ranging in size from 40-180 kb. The overall agreement between optical and PFGE maps was excellent, in terms of both fragment sizing and ordering.
- Optical restriction mapping of DNA molecules is a new alternative to conventional gel and hybridization based methods for producing restriction maps of large DNA molecules.
- Optical mapping is an attractive technology based on the following considerations: i) it is rapid and safe, not requiring time consuming procedures such as gel electrophoresis, preparation and radiolabelling of probes, nucleic acid hybridization and autoradiography. Further, it is an easy and inexpensive technique to perform, requiring - apart from the microscope and camera - very small quantities of very simple materials. ii) The technique yields consistent results, the accuracy of which has been proven by direct comparison with standard methods. iii) The technique, because it analyzes individual DNA molecules, holds enormous potential for miniaturization and automation and consequent order of magnitude increases in throughput and decreases in cost.
- This example describes several important improvements to optical mapping that derive from the ability to analyze DNA molecules adhered to APTES derivatized glass surfaces.
- restriction endonucleases 85% of sites are cut (vs. 50% previously).
- a third benefit of surface mounting compared to agarose gel fixation is that small DNA fragments are more readily detected because surface mounting restrains their tendency to relax back into the gel matrix and disappear from view. Reliable measurements are now possible for molecules as small as 30 kb (vs. 60 kb previously).
- a fourth improvement results from the superior performance of the fluorochrome YOYO-1 compared to ethidium homodimer. YOYO-1 produces clearer images of higher contrast and, unlike ethidium homodimer, is unimpeded by high salt. The improved images contribute to more reliable DNA fragment sizing as measured by lower standard deviations on mean restriction fragment sizes.
- YAC contigs a large fraction of the human genome is covered by YAC contigs ( Cohen and Weissenbach, Nature 366:698-701, 1993 ).
- the information content of most contigs consists of a list of sequence tagged sites or other markers, the YACs associated with each marker and in some cases the sizes of the YACs.
- YAC libraries because nearby markers will often be contained in identical sets of YACs, or YAC rearrangements may give contradictory data.
- Restriction mapping is unique among the techniques available for YAC characterization in providing a truly linear, sequence based representation of DNA content. Restriction maps of overlapping YACs are also useful for sorting out YAC overlap, DNA rearrangement and chimerism. Finally, an ordered restriction map (or maps, using several enzymes) can be treated as a complex fingerprint and used as a tool in map construction, similar to the use of cosmid fingerprinting ( Stallings et al., Proc. Natl. Acad. Sci. USA 87:6218-22, 1990 ). Such a fingerprint is considerably more complex and reproducible than fingerprints generated by hybridizing digested YAC DNA with repeat sequences.
- Optical mapping is likely to be equally useful in analyzing other large insert clones such as P1, P1 artificial chromosome (PAC) and bacterial artificial chromosome (BAC) clones and ultimately in generating accurate detailed restriction maps for large portioins of the human genome.
- PAC P1, P1 artificial chromosome
- BAC bacterial artificial chromosome
Landscapes
- Chemical & Material Sciences (AREA)
- Organic Chemistry (AREA)
- Life Sciences & Earth Sciences (AREA)
- Zoology (AREA)
- Wood Science & Technology (AREA)
- Proteomics, Peptides & Aminoacids (AREA)
- Health & Medical Sciences (AREA)
- Engineering & Computer Science (AREA)
- Analytical Chemistry (AREA)
- Biophysics (AREA)
- Biochemistry (AREA)
- Microbiology (AREA)
- Molecular Biology (AREA)
- Biotechnology (AREA)
- Physics & Mathematics (AREA)
- Genetics & Genomics (AREA)
- Immunology (AREA)
- Bioinformatics & Cheminformatics (AREA)
- General Engineering & Computer Science (AREA)
- General Health & Medical Sciences (AREA)
- Chemical Kinetics & Catalysis (AREA)
- Measuring Or Testing Involving Enzymes Or Micro-Organisms (AREA)
- Apparatus Associated With Microorganisms And Enzymes (AREA)
Applications Claiming Priority (3)
| Application Number | Priority Date | Filing Date | Title |
|---|---|---|---|
| US08/415,710 US5720928A (en) | 1988-09-15 | 1995-04-03 | Image processing and analysis of individual nucleic acid molecules |
| US08/415,839 US6147198A (en) | 1988-09-15 | 1995-04-03 | Methods and compositions for the manipulation and characterization of individual nucleic acid molecules |
| EP96912538A EP0871640A4 (fr) | 1995-04-03 | 1996-04-03 | Procede permettant de mesurer des caracteristiques physiques d'acides nucleiques par imagerie microscopique |
Related Parent Applications (1)
| Application Number | Title | Priority Date | Filing Date |
|---|---|---|---|
| EP96912538A Division EP0871640A4 (fr) | 1995-04-03 | 1996-04-03 | Procede permettant de mesurer des caracteristiques physiques d'acides nucleiques par imagerie microscopique |
Publications (2)
| Publication Number | Publication Date |
|---|---|
| EP1914238A2 true EP1914238A2 (fr) | 2008-04-23 |
| EP1914238A3 EP1914238A3 (fr) | 2008-11-05 |
Family
ID=27023073
Family Applications (2)
| Application Number | Title | Priority Date | Filing Date |
|---|---|---|---|
| EP20070023766 Ceased EP1914238A3 (fr) | 1995-04-03 | 1996-04-03 | Procédés de mesure de caractéristiques physiques d'acides nucléiques par imagerie de microscopique |
| EP96912538A Ceased EP0871640A4 (fr) | 1995-04-03 | 1996-04-03 | Procede permettant de mesurer des caracteristiques physiques d'acides nucleiques par imagerie microscopique |
Family Applications After (1)
| Application Number | Title | Priority Date | Filing Date |
|---|---|---|---|
| EP96912538A Ceased EP0871640A4 (fr) | 1995-04-03 | 1996-04-03 | Procede permettant de mesurer des caracteristiques physiques d'acides nucleiques par imagerie microscopique |
Country Status (4)
| Country | Link |
|---|---|
| EP (2) | EP1914238A3 (fr) |
| JP (2) | JP4511636B2 (fr) |
| AU (1) | AU5532196A (fr) |
| WO (1) | WO1996031522A1 (fr) |
Families Citing this family (17)
| Publication number | Priority date | Publication date | Assignee | Title |
|---|---|---|---|---|
| CA2235762A1 (fr) * | 1995-11-14 | 1997-05-22 | Genometrix Genomics, Inc. | Dispositifs integres d'hybridation d'acides nucleiques dont la fonction est fondee sur la chimie des surfaces actives |
| EP0996854A1 (fr) * | 1997-07-10 | 2000-05-03 | Ruprecht-Karls-Universität Heidelberg | Microscope a champ d'ondes, procedee de microscopie a champ d'ondes servant egalement au sequencage d'adn et procede d'etalonnage utilise en microscopie a champ d'ondes |
| WO2000009757A1 (fr) * | 1998-08-13 | 2000-02-24 | U.S. Genomics, Inc. | Polymeres caracterises optiquement |
| EP2465943A3 (fr) * | 2001-03-16 | 2012-10-03 | Kalim Mir | Affichage de polymère linéaire |
| WO2002099133A1 (fr) * | 2001-05-31 | 2002-12-12 | Fuso Pharmaceutical Industries, Ltd. | Procede ameliore de detection et d'identification de micro-organismes causes d'infections |
| JP4999171B2 (ja) * | 2007-08-06 | 2012-08-15 | 日本電信電話株式会社 | タンパク質機能解析装置 |
| US8951731B2 (en) | 2007-10-15 | 2015-02-10 | Complete Genomics, Inc. | Sequence analysis using decorated nucleic acids |
| US9637776B2 (en) * | 2008-02-19 | 2017-05-02 | Opgen, Inc. | Methods of identifying an organism |
| GB0818609D0 (en) | 2008-10-10 | 2008-11-19 | Univ Hull | apparatus and method |
| US8597879B2 (en) * | 2009-10-08 | 2013-12-03 | Opgen, Inc. | Methods of characterizing small nucleic acid molecules |
| WO2011043077A1 (fr) * | 2009-10-09 | 2011-04-14 | 川崎重工業株式会社 | Procédé et appareillage de discrimination de cellules souches pluripotentes non différenciées, et procédé et appareil de culture automatique |
| WO2011161962A1 (fr) | 2010-06-25 | 2011-12-29 | 川崎重工業株式会社 | Procédé et dispositif de distinction de colonie de cellules souches pluripotentes, et procédé et dispositif de culture automatique de cellules souches pluripotentes |
| US9671344B2 (en) * | 2010-08-31 | 2017-06-06 | Complete Genomics, Inc. | High-density biochemical array chips with asynchronous tracks for alignment correction by moiré averaging |
| US20150247190A1 (en) * | 2012-10-05 | 2015-09-03 | California Institute Of Technology | Methods and systems for microfluidics imaging and analysis |
| WO2018078967A1 (fr) * | 2016-10-27 | 2018-05-03 | シャープ株式会社 | Système de test par fluorescence, méthode de test moléculaire et méthode de test par fluorescence |
| WO2019026413A1 (fr) * | 2017-08-01 | 2019-02-07 | シャープ株式会社 | Système d'analyse de microparticules dans un liquide et procédé d'analyse de microparticules dans un liquide |
| JP7843019B2 (ja) * | 2021-10-21 | 2026-04-09 | 国立大学法人東海国立大学機構 | Dna分子のサイズ測定方法、dna分子のサイズ測定デバイス及びdna分子のサイズ測定システム |
Citations (4)
| Publication number | Priority date | Publication date | Assignee | Title |
|---|---|---|---|---|
| US4473452A (en) | 1982-11-18 | 1984-09-25 | The Trustees Of Columbia University In The City Of New York | Electrophoresis using alternating transverse electric fields |
| US4695548A (en) | 1982-11-18 | 1987-09-22 | The Trustees Of Columbia University In The City Of New York | Gel inserts useful in electrophoresis |
| US5079169A (en) | 1990-05-22 | 1992-01-07 | The Regents Of The Stanford Leland Junior University | Method for optically manipulating polymer filaments |
| US5380833A (en) | 1984-10-16 | 1995-01-10 | Chiron Corporation | Polynucleotide reagents containing selectable cleavage sites |
Family Cites Families (3)
| Publication number | Priority date | Publication date | Assignee | Title |
|---|---|---|---|---|
| US4994373A (en) * | 1983-01-27 | 1991-02-19 | Enzo Biochem, Inc. | Method and structures employing chemically-labelled polynucleotide probes |
| GB8810400D0 (en) * | 1988-05-03 | 1988-06-08 | Southern E | Analysing polynucleotide sequences |
| US5314829A (en) * | 1992-12-18 | 1994-05-24 | California Institute Of Technology | Method for imaging informational biological molecules on a semiconductor substrate |
-
1996
- 1996-04-03 WO PCT/US1996/004550 patent/WO1996031522A1/fr not_active Ceased
- 1996-04-03 EP EP20070023766 patent/EP1914238A3/fr not_active Ceased
- 1996-04-03 JP JP53044496A patent/JP4511636B2/ja not_active Expired - Lifetime
- 1996-04-03 AU AU55321/96A patent/AU5532196A/en not_active Abandoned
- 1996-04-03 EP EP96912538A patent/EP0871640A4/fr not_active Ceased
-
2008
- 2008-07-30 JP JP2008197050A patent/JP4495767B2/ja not_active Expired - Lifetime
Patent Citations (4)
| Publication number | Priority date | Publication date | Assignee | Title |
|---|---|---|---|---|
| US4473452A (en) | 1982-11-18 | 1984-09-25 | The Trustees Of Columbia University In The City Of New York | Electrophoresis using alternating transverse electric fields |
| US4695548A (en) | 1982-11-18 | 1987-09-22 | The Trustees Of Columbia University In The City Of New York | Gel inserts useful in electrophoresis |
| US5380833A (en) | 1984-10-16 | 1995-01-10 | Chiron Corporation | Polynucleotide reagents containing selectable cleavage sites |
| US5079169A (en) | 1990-05-22 | 1992-01-07 | The Regents Of The Stanford Leland Junior University | Method for optically manipulating polymer filaments |
Non-Patent Citations (189)
| Title |
|---|
| "A Comprehensive Genetic Linkage Map of the Human Genome", SCIENCE, vol. 258, 1992, pages 67 - 86 |
| "New Techniques of Optical microscopy and Microspectroscopy", 1991, CRC PRESS, INC. |
| AIKENS, R.S.; AGARD, D.A.; SEDAT, J.W.: "In Fluorescence microscopy of living cells in culture", vol. 29, 1989, ACADEMIC PRESS, INC., article "Solid-state imagers for microscopy", pages: 291 - 313 |
| ALBERTSEN ET AL., PROC. NATL. ACAD. SCI., vol. 87, 1990, pages 4256 - 60 |
| ALLISON, D.P. ET AL., PROC. NATL. ACAD. SCI., vol. 89, 1992, pages 10129 - 10133 |
| ANDERSON, C.: "Genome shortcut leads to problems", SCIENCE, vol. 259, 1993, pages 1684 - 1687 |
| ARNDT-JOVIN ET AL.: "Fluorescnece decay analysis in solution and in a microscope of DNA and chromosomes stained with quinacrine", J. HISTOCHEM. CYTOCHEM., vol. 27, 1979, pages 87 - 95 |
| ARNDT-JOVIN, D.J. ET AL.: "Fluorescence digital imaging microscopy in cell biology", SCIENCE, vol. 230, 1985, pages 247 - 256 |
| ASHBURNER, M.: "Drosophila, A Laboratory Handbook.", 1989, COLD SPRING HARBOR LABORATORY PRESS |
| AUSUBEL ET AL.: "in Current Protocols in Molecular Biology", vol. 1, 6.10., 1994, JOHN WILEY & SONS, pages: 1 - 5 |
| BALDING, D.J.; TORNEY, D.C.: "Statistical analysis of DNA fingerprint data for ordered clone physical mapping of human chromosomes", BULLETING OF MATHEMATICAL BIOLOGY, vol. 53, 1991, pages 853 - 879 |
| BARLOW ET AL., TRENDS IN GENETICS, vol. 3, 1987, pages 167 - 177 |
| BARLOW, D. ET AL., LONG RANGE MAPPING AND CLONING OF MAMMALIAN CHROMOSOMES, 1989 |
| BARLOW, D.P.; LEHRACH, H.: "genetics by gel electrophoresis: the impact of pulsed field gel electrophoresis on mammalian genetics.", TRENDS IN GENETICS, vol. 3, 1987, pages 167 - 177 |
| BECK, S. ET AL.: "Chemiluminescent detection of DNA: application for DNA sequencing and hybridization", NUCLEIC ACIDS RES., vol. 17, 1989, pages 5115 - 5123, XP055230649 |
| BECK, S.: "Nonradioactive detection of DNA Using Dioxetane Chemiluminescence", METHODS IN ENZYMOL, vol. 216, 1992, pages 143 - 153 |
| BELLANNE-CHANTELOT ET AL.: "mapping the whole human genome by fingerprinting yeast artificial chromosomes", CELL, vol. 70, 1992, pages L 1059 - 1068 |
| BENDAT ET AL.: "Random Data: Analysis and Measurement Procedures", 1986, JOHN WILEY |
| BENSIMON, A. ET AL., SCIENCE, vol. 265, 1994, pages 2096 |
| BOERSMA, S., J. CHEM PHYS., vol. 32, 1960, pages 1626 - 1631 |
| BOREJDO, J.: "Orientation of DNA in agarose gels", BIOPHYS. J., vol. 55, 1989, pages 1183 - 1190 |
| BOREJDO, J.; DEFEA, K.: "The orientation of DNA fragments in the agarose gel", ANAL. BIOCHEM., vol. 174, 1988, pages 393 - 398, XP024825571, DOI: doi:10.1016/0003-2697(88)90038-3 |
| BOTSTEIN, D. ET AL.: "Construction of a genetic linkage map in man using restriction fragment length polymorphisms", AM. J. HUM. GENET, vol. 32, 1980, pages 314 - 331, XP000610566 |
| BROWNSTEIN, M. ET AL.: "Isolation of single-copy human genes from a library of yeast artificial chromosome clones", SCIENCE, vol. 244, 1989, pages 1348 - 1351, XP001208142, DOI: doi:10.1126/science.2544027 |
| BRUN, A.M.; HARRIMAN, A.: "Dynamics of electron transfer between intercalated polycyclic milesules: effect of interspersed bases", J. AM. CHEM. SOC., vol. 114, 1992, pages 3656 - 3660 |
| BURKE ET AL., SCIENCE, vol. 236, 1987, pages 806 - 812 |
| BURKE, D.T.; CARLE, G.F.; OLSON, M.B.: "Cloning of large segments of exogenous DNA into yeast by means of artificial chromosome vectors", SCIENCE, vol. 236, 1987, pages 806 - 812, XP000670149, DOI: doi:10.1126/science.3033825 |
| BUSTAMANTE, C. ET AL., BIOCHEMISTRY, vol. 31, 1992, pages 22 - 26 |
| CAI,W.; SCHWARTZ, D.C.: "Why Large DNA Molecules Don't Enter Gels: The Mechanism of Trapping", TO BE SUBNITTED |
| CALLADINE, C.R. ET AL.: "A study of electrophoretic mobility of DNA in agarose and polyacrylamide", JOURNAL OF MOLECULAR BIOLOGY, vol. 221, 1991, pages 981 - 1005, XP024009537, DOI: doi:10.1016/0022-2836(91)80187-Y |
| CALLIS, P.R.; DAVIDSON, N.: "Hydrodynamic relaxation times of DNA for decay of flow dichroism measurements", BIOPOLYMERS, vol. 8, 1969, pages 379 - 390 |
| CAMPBELL ET AL., PROC. NATL. ACAD. SCI., vol. 88, January 1999 (1999-01-01), pages 5744 |
| CAMPBELL, C. ET AL.: "Generation of a nested series of interstitial deletions in yeast artificial chromosomes carrying human DNA", PROC. NATL. ACAD. SCI., vol. 88, 1991, pages 5744 - 5748, XP000673332, DOI: doi:10.1073/pnas.88.13.5744 |
| CANTOR, R.C.; SCHIMMEL, P.R.: "Biophysical chemistry, Part II: The conformation of biological macromolecules", 1980, W.H. FREEMAN AND CO. |
| CARLE, G.F.; OLSON, M.V.: "Separation of chromosomal DNA molecules from yeast by orthogonal-field", NUCLEIC ACIDS RES., vol. 12, 1984, pages 5647 - 5664, XP001010358 |
| CAVALLI-SFORZA, AM. J. HUM. GENET, vol. 46, 1990, pages 649 |
| CHANDRASEKHARAPPA, S.C.; MARCHUK, D.A.; COLLINS, F.S.: "In Methods in Molecular Biology: Pulsed-field gel Electrophoresis", vol. 12, 1992, HUMANA PRESS, article "Analysis of yeast artificial chromosome clones", pages: 235 - 257 |
| CHU, G.; VOLLRATH, D.; DAVIS, R.W.: "Separation of large DNA molecules by contour clampled homogeneous electric fields", SCIENCE, vol. 234, 1986, pages 1582 - 1585, XP008044134, DOI: doi:10.1126/science.3538420 |
| CHUMAKOV, I. ET AL., NATURE, vol. 359, 1992, pages 380 |
| CHUMAKOV, I. ET AL.: "Continuum of overlapping clones spanning the entire human chromosome 21q", NATURE, vol. 359, 1992, pages 380 - 387, XP002031438, DOI: doi:10.1038/359380a0 |
| CHUMAKOV, NATURE, vol. 359, 1992, pages 380 |
| CHURCH, C.; KIEFER-HIGGINS, S., MULTIPLEX DNA SEQUENCING. SCIENCE, vol. 240, 1988, pages 185 - 188 |
| CHURCH; GILBERT, PROC. NATL. ACAD. SCI., vol. 81, 1984, pages 1991 |
| CLARK, S.M. ET AL.: "A novel instrument for separating large DNA molecules with pulsed homogeneous electric fields", SCIENCE, vol. 241, 1988, pages 1203 - 1205 |
| COHEN; WEISSENBACH, NATURE, vol. 366, 1993, pages 698 - 701 |
| COULSON, A. ET AL.: "Towards a physical map of the nematode C. elegans", PROC. NATL. ACAD. SCI., vol. 83, 1986, pages 7821 - 7825, XP002116104, DOI: doi:10.1073/pnas.83.20.7821 |
| CRAIG, G. ET AL.: "Ordering of cosmid clones covering the Herpes simplex virus type I (HSV 1) genome: a test case for fingerprinting by hybridization", NUCL. ACIDS.RES., vol. 18, 1990, pages 2653 - 2660, XP055263329, DOI: doi:10.1093/nar/18.9.2653 |
| D. C. SCHWARTZ; C.R. CANTOR, CELL, vol. 37, 1984, pages 67 |
| D.L. TAYLOR ET AL.: "Applications of Fluorescence in the Biomedical Sciences", 1986, ALAN R. LISS, pages: 321 - 345 |
| DE GENNES, P-G.: "Scaling concepts in polymer physics", 1979, CORNELL UNIVERSITY PRESS |
| DEUTSCH, J.M., THEORETICAL STUDIES OF DNA DURING GEL ELECCTROPHORESIS SCIENCE, vol. 240, 1988, pages 992 - 924 |
| DILL, K.; ZIMM, B.H.: "Dynamics of polymer solutions. 2. The determination of molecular weight distribution by viscoelasticity", MACROMOLECULES, vol. 13, 1980, pages 432 - 436 |
| DOI, M.; EDWARDS, S.F.: "The Theory of Polymer Dynamics", 1986, OXFORD UNIVERSITY PRESS |
| DONIS-KELLER, H. ET AL.: "A genetic linkage map of the human genome", CELL, vol. 51, 1987, pages 319 - 337, XP023883356, DOI: doi:10.1016/0092-8674(87)90158-9 |
| EVANS, G.A.; LEWIS, K.A.: "Physical mapping of complex genomies by cosmid multiplex analysis", PROC., NATL. ACAD. SCI., vol. 86, 1989, pages 5030 - 5034 |
| FAN, J.B. ET AL.: "Construction of a Not I restriction map of the fission yeast Schizosaccharomyces pombe genome", NUCLEIC ACIDS RES., vol. 17, 1989, pages 2801 - 2818 |
| FANGMAN, W.L., NUCL. ACIDS RES., vol. 5, 1978, pages 653 - 665 |
| FERRIN, L.J. ET AL., SCIENCE, vol. 54, 1991, pages 1494 |
| FERRIN, L.J.; CAMERINI-QTERO, R.D: "Selective cleavage of human DNA: RecA-assisted restriction endonuclease (RARE) cleavage", SCIENCE, vol. 254, 1991, pages 1494 - 1497, XP000608998, DOI: doi:10.1126/science.1962209 |
| FISH; MANUELIDIS, L. ET AL., J. CELL. BIOL., vol. 95, 1982, pages 619 |
| FOOTE, S.; VOLLRATH, D.; HILTON, A.: "The Human Y Chromosome: Overlapping DNA Clones Spanning the Euchromatic Regioin", SCIENCE, vol. 258, 1992, pages 60 - 66, XP002080220, DOI: doi:10.1126/science.1359640 |
| GEMMILL, R.M.: "Pulsed-field gel electrophoresis", IN ADV. ELECTROPHORESIS 4, 1991, pages 1 - 48 |
| GENNES ET AL.: "Scaling Concepts in Polymer Physics", 1979, CORNELL UNIVERSITY PRESS |
| GLAZER ET AL., PROC. NATK. ACAD. SCI., vol. 87, 1990, pages 3851 - 3855 |
| GLAZER, A.N.; PECK, K.; MATHIES, R.A.: "A stable double-stranded DNA-ethidiuum homodimer complex: Application to picogran fluorescence detection of DNA in agarose gels.", PROC. NATL. ACAD. SCI., vol. 87, 1990, pages 3851 - 3855 |
| GLAZER, A.N.; RYE, H.S.: "Stable dye-DNA intercalation complexes as reagents for high sensitivity fluorescence detection", NATURE, vol. 359, 1992, pages 859 - 861, XP000615455, DOI: doi:10.1038/359859a0 |
| GOSULE; SCHELLMAN, J. MOL. BIOL., vol. 121, 1978, pages 311 - 326 |
| GUO ET AL., J. BIOMOL. STRUCTURE & DYNAMICS, vol. 11, 1993, pages 1 - 10 |
| GUO ET AL., NATURE, vol. 359, 1992, pages 783 - 784 |
| GUO, NATURE, vol. 359, 1992, pages 783 |
| GUO, X.; SCHWARTZ, D.C., MOLECULAR SIZES AS DETERMINED BY IMAGING COIL DYNAMICS IN AGAROSE GEL |
| GUO, X.H.; HUFF, E.J.; SCHWARTZ, D.C.: "Sizing single DNA molecules", NATURE, vol. 59, 1992, pages 783 |
| HANSMA, H.G. ET AL., NUCLEIC ACIDS RESEARCH, vol. 21, 1993, pages 505 - 512 |
| HENG, H.H.Q. ET AL., PROC. NATL. ACAD. SCI., vol. 89, 1992, pages 9509 |
| HENG, H.H.Q.; SQUIRE, J.; TSUI, L-C.: "High-resolution mapping of mammalian genes by in situ hybridization to free chromatin", PROC. NATL. ACAD. SCI., vol. 89, 1992, pages 9509 - 9513, XP055128109, DOI: doi:10.1073/pnas.89.20.9509 |
| HERMAN B.; JACOBSON, K., OPTICAL MICROSCOPY FOR BIOLOGY, September 1990 (1990-09-01) |
| HERMAN, B.: "Resonance energy transfer microscopy", METHODS IN CELL BIOL., vol. 30, 1989, pages 219 - 243 |
| HIRAOKA, Y.; SEDAT, J.W.; AGARD, D.A.: "The use of a charge-coupled device for Quantitative optical microscopy of biological structures.", SCIENCE, vol. 238, 1987, pages 36 - 41 |
| HOLM, C. ET AL.: "DNA topoisomerase II is required at the time of mitosis in yeast", CELL, vol. 41, 1985, pages 553 - 563, XP023913266, DOI: doi:10.1016/S0092-8674(85)80028-3 |
| HOLZWARTH, G. ET AL.: "the acceleration of linear DNA during pulsed-field gel electrophoresis", BIOPOLYMERS, vol. 28, 1989, pages 1043 - 1058 |
| HSIEH, P.; CAMERINI-OTERO, C.S.; CAMERINI-OTERC, R.D.: "The. synapsis event in the homologous pairing of DNAs: RecA recognizes and pairs less than onehelical repeat of DNA", PROC. NATL. ACAD. SCI, vol. 89, 1992, pages 6492 - 6496 |
| HYMAN, A.A. ET AL.: "Microtubule-motor activity of a yeast centromer-binding protein complex", NATURE, vol. 359, 1992, pages L533 - 536 |
| KARRASCH ET AL., BIOPHYSICAL J., vol. 65, 1993, pages 2437 - 2446 |
| KAVENOFF, RLK.; ZIMM, B.H., CHROMOSOMA, vol. 41, 1973, pages 1 - 27 |
| KLOTZ, L.C.; ZIMM, B.H.: "Retardation times of deoxyribonucleic acid solution, II: Improvements in appratus and theory", MACROMOLECULES, vol. 5, 1972, pages 471 - 481 |
| KOHARA, Y.; AKIYAMA, K.; ISONO, K.: "The physical map of the whole E. coli-chromosome: application of a new strategy for rapid analysis and sorting of a large genomic library", CELL, vol. 50, 1987, pages 495 - 508, XP023883961, DOI: doi:10.1016/0092-8674(87)90503-4 |
| KOOB, M. ET AL., NUCLEIC ACIDS RES., vol. 20, 1992, pages 58311 |
| KOOB, M. ET AL., SCIENCE, vol. 250, 1990, pages 271 |
| KOOB, M. ET AL.: "RecA-AC: single-site cleavage of plasmids and chromosomes at any predetermined restriction site", NUCLEIC ACIDS RES., vol. 20, 1992, pages 5831 - 5836, XP002039973 |
| KOOB, M.; SZYBALSKI, W.: "Cleaving yeast and Escherichia coli genomes at single site", SCIENCE, vol. 250, 1990, pages 271 - 273 |
| KUSPA, A. ET AL.: "Physical mapping of the Myxococcus xanthus genome by random cloning in yeast artifical chromosomes", PROC. NATL. ACAD. SCI., vol. 86, 1989, pages 8917 - 8920 |
| LAI, M.H.; KIRSCH, D.R.: "Nucleotide sequence of cytochrome P450 L1A1 from Candida albicans", NUCLEIC ACIDS RES, vol. 17, 1989, pages 804, XP002054013 |
| LANDSCHULZ, W-H; JOHNSON, P.F.; MCKNIGHT, S.C.: "The Leucine zipper: A hypothetical structure common to a new class of DNA binding proteins", SCIENCE, vol. 240, 1988, pages 1759 - 1764, XP001153526, DOI: doi:10.1126/science.3289117 |
| LARIN, Z.; LEHRACH, H.: "Yeast artificial chromosome libraries containing large inserts from mouse and human DNA", PROC. NATL. ACAD. SCI., vol. 88, 1991, pages 4123 - 4127, XP055111458, DOI: doi:10.1073/pnas.88.10.4123 |
| LAWRENCE, .B.; VILLNAVE,C.A.; SINGER, R.H.: "Sensitive, high-resolution chromatin and chromosome mapping in situ: Presence and orientation of two closely integrated copies of EBV in a lymphoma cell line", CELL, vol. 52, 1988, pages 51 - 61, XP023908759, DOI: doi:10.1016/0092-8674(88)90530-2 |
| LAWRENCE, C.A. ET AL., CELL, vol. 52, 1988, pages 51 |
| LEHRACH, H. ET AL.: "Hybridization fingerprinting in genome mapping and sequencing in Genetic and Physical mapping", 1989, COLD SPRING HARBOR LABORATORY PRESS, pages: 39 - 81 |
| LICHTER, P. ET AL., SCIENCE, vol. 247, 1990, pages 64 |
| LINK, A.J., GENETICS, vol. 127, 1991, pages 681 - 698 |
| LINK, A.J.; OLSON, M.V.: "Physical map of the Saccharomyces cerevisiae genome at 110-kilobase resolution", GENETICS, vol. 127, 1991, pages 681 - 698 |
| LINK, GENETICS, vol. 127, 1991, pages 681 |
| LINK; OLSON, GENETICS, vol. 127, 1991, pages 681 |
| LINK; OLSON, GENETICS, vol. 27, 1991, pages 681 |
| LOUISE D.; SERWER, P.: "A hybrid mode of rotating gel electrophoresis for separating linear and circular duplex DNA", APPLIED AND THEORETICAL ELECTROPHORESIS, vol. 1, 1989, pages 169 - 173 |
| LUCKHAM; KLEIN, CHEM. SOC., FARADAY TRANS. I, vol. 80, 1984, pages 865 - 878 |
| LYUBCHENKO ET AL., J. OF BIOMOLECULAR STRUCT. AND DYNAMICS, vol. 10, pages 589 - 606 |
| LYUBCHENKO, Y.L. ET AL., J. BIOMOL. STRUCT. AND DYN., vol. 10, 1992, pages 589 - 606 |
| M. YANAGIDA ET AL.: "Applications of Fluorescence in the Biomedical Sciences", 1986, ALAN R. LISS, pages: 321 - 345 |
| MAIER, E. ET AL., NAT. GENET., vol. 1, 1992, pages 273 |
| MANDEL, J-L. ET AL.: "Genome Analysis and the Human X Chromosome", SCIENCE, vol. 258, 1992, pages 103 - 109 |
| MANUELIDIS, L.; LANGER-SAFER, P.R.; WARD,D.C.: "High-resolution mapping of satellite DNA using biotin-labeled DNA probels", J. CELL BIOL., vol. 95, 1982, pages 619 - 625 |
| MATHIES, R.A.; HUNG, X.C.: "Capillary array electrophoresis: an approach to high-speed, high-throughput DNA sequencing", NATURE, vol. 359, 1992, pages 167 - 169, XP002023300, DOI: doi:10.1038/359167a0 |
| MATHIES, R.A.; PECK, K.; STRYER, L.: "Optimization of high-sensitivity fluorescence detection", ANAL. CHEM, vol. 62, 1990, pages 1786 - 1791, XP000165498, DOI: doi:10.1021/ac00216a012 |
| MATSUMOTO S.; MORIKAWA K.; YANAGIDA M.: "Journal of Mol. Biol.", vol. 132, 1981, article "Light microscopic structure of DNA in solution studied by the 4'6- diamidino-2-phenylinddole staining method", pages: 501 - 516 |
| MATSUMOTO, S. ET AL., J. MOL. BIOL., vol. 132, 1981, pages 501 - 516 |
| MICKEL, S.; ARENA, V.; BAUER, W.: "Physical properties and gel electrophoresis behavior of R12- derived plasmid DNAs", NUCLEIC ACIDS RES., vol. 4, 1977, pages 1465 - 1482 |
| MULLIS, K.B.; FALOONA, F.A.: "Specific synthesis of DNS in vitro via a polymerase-catalyzed chain reaction", METHODS IN ENZYMOL, vol. 155, 1987, pages 335 - 350, XP009003171, DOI: doi:10.1016/0076-6879(87)55023-6 |
| MURAKAMI, A. ET AL.: "Highly sensitive detection of DNA using enzyme- linked DNA-probe. 1. Colorimetric and fluorometric detection", NUCLEIC ACIDS RES., vol. 17, 1989, pages 5587 - 5595 |
| MURRAY, A.W.; SZOSTAK, J.W., CONSTRUCTION OF ARTIFICIAL CHROMOSOMES IN YEAST NATURE, vol. 305, 1983, pages 189 - 193 |
| MURRAY; SZOSTAK, NATURE, vol. 305, 1983, pages 189 - 193 |
| MURRAY; SZOSTAK, NATURE, vol. 305, 1983, pages 189 - 93 |
| NOOLANDI, J. ET AL.: "Generalized tube model of biased reptation for gel electrophoresis of DNA", SCIENCE, vol. 243, 1989, pages 1456 - 1458 |
| OLIVERA, B.M.; BAINE, P.; DAVIDSON, D.: "Electrophoresis of the nucleic acids", BIOPOLYMERS, vol. 2, 1964, pages 245 - 257 |
| OLSON, M. ET AL.: "A common language for physical mapping of the human geome", SCIENCE, vol. 245, 1989, pages 1434 - 1435, XP000619568, DOI: doi:10.1126/science.2781285 |
| OLSON, M.V. ET AL.: "Random-clone strategy for genomic restriction mapping in yeast", PROC. NATL. ACAD. SCI., vol. 83, 1986, pages 7826 - 7830, XP000984476, DOI: doi:10.1073/pnas.83.20.7826 |
| OSHEROFF, N.; SHELTON E.R.; BRUTLAG, D.L.: "DNA topoisomerase II from Drosophila melanogaster. Relaxation of supercoiled DNA.", J. BIOL. CHEM, vol. 258, 1983, pages 9536 - 9543 |
| PERKINS, T.T. ET AL., SCIENCE, vol. 264, 1994, pages 819 |
| PINKEL, D. ET AL.: "High resolution DNA contene measurements of mammalian sperm", CYTOMETRY, vol. 3, 1982, pages 1 - 9 |
| QUESADA, M. ET AL.: "High-sensitivity DNA detection with a laser-excited confocal fluorescence gel scanner", BIOTECHNIQUES, vol. 10, 1991, pages 616 - 625 |
| RADDING, C., ANN.REV.GENET., vol. 16, 1982, pages 405 - 37 |
| RANMPINO, N.J.; CHRAMBACH, A.: "Conformational correlatives of DNA band compression and bidirectional migration during field inversion gel electrophoresis, detected by quantitative video epifluorescence micreoscopy", BIOPOLYMERS, vol. 31, 1991, pages 1297 - 1307 |
| RAU, D.C.; BLOOMFIELD, V.A.: "Transient electric birefringencce of T7 viral DNA", BIOPOLYMERS, vol. 18, 1979, pages 2783 - 2805 |
| RIED, T. ET AL.: "Simultaneous visualization of seven different DNA probes by in situ hybridization using combinatorial fluorescence and digital imaging microscopy.", PROC. NATL. ACAD. SCI., vol. 89, 1992, pages 1388 - 1392, XP002073155, DOI: doi:10.1073/pnas.89.4.1388 |
| RIGAS, B. ET AL.: "Rapid plasmid library screening using RecA- coated biotinylated probes", PROC. NATL. ACAD. SCI., vol. 83, 1986, pages 9591 - 9595, XP009009381, DOI: doi:10.1073/pnas.83.24.9591 |
| RIORDAN, J.R. ET AL.: "Identification of the cystic fibrosis gene: cloning and characterization of complementary DNA", SCIENCE, vol. 245, 1989, pages 1066 - 1072 |
| ROBERTS, T.M. ET AL., CRC CRIT. REV. BIOCHEM., vol. 3, 1975, pages 349 |
| ROBERTS, T.M.; LAUER, G.D.; KLOTZ, L.C.: "Physical techniques for genome analysis", CRC CRIT. REV. BIOCHEM., vol. 3, 1975, pages 349 |
| ROMMENS, J.M. ET AL.: "Identificaiton of the cystic fibrosis gene: Chromosome walking and jumping", SCIENCE, vol. 245, 1989, pages 1059 - 1065 |
| ROSS, M.T. ET AL.: "In Techniques for the analysis of complex genomes", 1992, ACADEMIC PRESS INC., article "High-density gridded YAC filters: their potential as genome mapping tools" |
| ROUSE, P.E.: "A theory of the linear viscoelastic properties of dilute solutions of.coiling polymers.", J. CHEM. PHYS, vol. 21, 1953, pages 1272 - 1280 |
| RUVOLO, P.; HSU, M.; SCHWARTZ, D.: "Separating the Smallest Drosophila Chromosome", PULSED ORIENTED ELECTROPHORESIS. MANUSCRIPT IN PREPARATION |
| SCHLESSINGER, D.; KERE, J.: "Strategies for Physical mapping", vol. 4, 1992, COLD SPRING HARBOR LABORATORY PRESS, article "YAC-based mapping of Genome Structure, Function and Evolution. In Genome Analysis", pages: 131 - 159 |
| SCHWARTXZ, D.C.; KOVAL, M: "Conformational dynamics of individual DNA molecules during gel electrophoresis", NATURE, vol. 338, 1989, pages 520 - 522 |
| SCHWARTZ ET AL., CELL, vol. 37, 1984, pages 67 |
| SCHWARTZ ET AL., NATURE, vol. 342, 1989, pages 575 - 576 |
| SCHWARTZ, CANTOR, CELL, vol. 37, 1984, pages 67 - 75 |
| SCHWARTZ, D.C. ET AL.: "Ordered Restriction Maps of Saccharomyces cerevisiae Chromosomes Constructed by optical mapping", SUBMITTED TO SCIENCE, 1993 |
| SCHWARTZ, D.C. ET AL.: "Symp. Quant. Biol.", vol. 47, 1983, COLD SPRING HARBOR, article "New technique for purifying large DNAs and studying their properties and packaging", pages: 189 - 195 |
| SCHWARTZ, D.C., GIGA-DAL-TON DNA MOLECULES, 1985 |
| SCHWARTZ, D.C.; CANTOR, C.R.: "Separation of yeast chromosome-sized DNAs by pulsed-field grandient electrophoresis", CELL, vol. 37, 1984, pages 67 - 75 |
| SCHWARTZ, D.C.; KOVAL, M., NATURE, vol. 338, 1989, pages 520 - 522 |
| SCHWARTZ; CANTOR, CELL, vol. 37, 1984, pages 67 - 75 |
| SERWER, P.; GRIESS, G.A.: "Gel electrophoresis of micron-sized molecules: A problem and a solution.", BIOPOLYMERS, vol. 29, 1990, pages 1863 - 1866 |
| SHAFIT-ZAGARDO, B.; MAIO, J.J.; BROWN, F.L.: "L1 families of long, interspersed repetitive sequences in human and other primate genomes", NUCLEIC ACIDS RES., vol. 10, 1982, pages 3175 - 3193 |
| SMITH, A.M.; BIRNSTIEL, M.L.: "A simple method for DNA restriction site mapping", NUCLEIC ACIDS RES., vol. 3, 1976, pages 2387 - 2399 |
| SMITH, H.O; BERNSTIEL, M.L.: "A simple method for DNA restriction site mapping", NUCLEIC ACIDS RES, vol. 3, 1976, pages 2387, XP008058529 |
| SMITH, S.B.; ALDRIDGE, P.K.; CALLIS, J.B.: "Observation of individual DNA molecules undergoing gel electrophoresis", SCIENCE, vol. 243, 1989, pages 203 - 206, XP000566818, DOI: doi:10.1126/science.2911733 |
| SMITH, S.B.; BENDICH, A.J.: "Electrophoreticc charge density persistence length of DNA as measured by fluorescence microscopy", IOPOLYMER, vol. 29, 1990, pages 1167 - 1173 |
| SMITH, S.B.; BENDICH, A.J: "Electrophoretic charge density and persistence length of DNA as measured by fluorescence microscopy", BIOPOLYMER, vol. 29, 1990, pages 1167 - 1173 |
| SMITH, S.B.; FINZI, I.; BUSTAMANTE, C.: "Direct mechanical measurements of the elasticity of single DNA molecules by using magnetic beads", SCIENCE, vol. 258, 1992, pages 1122 - 1126, XP000901434, DOI: doi:10.1126/science.1439819 |
| SMITH; BIRNSTIEL, NUCLEIC ACIDS RES., vol. 3, 1976, pages 2387 - 2399 |
| STALLINGS ET AL., PROC. NATL. ACAD. SCI., vol. 87, 1990, pages 6218 - 22 |
| STALLINGS, R.L. ET AL.: "Physical mapping of human chromosomes", NATL. ACAD. SCI., vol. 87, 1990, pages 6218 - 6222 |
| STEEN, H.B.; LINDMO, T.: "Flow cytometry: A high-resolution instrument for everyone", SCIENCE, vol. 204, 1979, pages 403 - 404 |
| SULST-ON, J. ET AL.: "The C elegans genome sequencing project: a beginning", NATURE, vol. 356, 1992, pages 37 - 41, XP002915582, DOI: doi:10.1038/356037a0 |
| TAYLOR, D.L.; WANG, Y-L: "Fluorescence Microscopy of Living Cells in Culture", 1989, ACADEMIC PRESS, INC. |
| TURMEL, C. ET AL.: "Electrophoresis of large DNA molecules: Theory and applications", 1990, COLD SPRING HARBOR LABORATORY, article "High resolution zero integrated field electrophoresis (ZIFE) of DNA. In Current communications in cell and molecular biology", pages: 101 - 13 |
| USTER, P.S.; PAGANO, R.E., J. CELL BIOL., vol. 103, 1986, pages 1221 - 1234 |
| VAN DEN ENGH, G. ET AL., SCIENCE, vol. 257, 1992, pages 1410 |
| VAN DEN ENGH, G.; SACHS, R.; TRASK, B.J.: "Estimating genomic distance from DNA sequence location in cell nuclei by a random walk model", SCIENCE, vol. 257, 1992, pages 1410 - 1412 |
| VIOVY, J-L ET AL.: "Irreversible trapping of DNA during crossed-field gel electrophoresis", ELECTROPHORESIS, vol. 13, 1992, pages 1 - 6 |
| VOLKMUTH, W.D.; AUSTIN,R.H.: "DNA electrophoresis in microlithographic arrays.", NATURE, vol. 358, 1992, pages 600 - 602, XP000602258, DOI: doi:10.1038/358600a0 |
| VOLLRATH, D. ET AL.: "The Human Y chromosome: A 43-Interval map Based on Naturally Occurring Deletions", SCIENCE, vol. 258, 1992, pages 52 - 59, XP002942728, DOI: doi:10.1126/science.1439769 |
| WANG; Y- AND SCHWARTZ, D.C.: "Chopped inserts are a convenient alternative to beads", NUCLEIC ACIDS RES., 1993 |
| WEETAL, METHODS ENZYMOL., vol. 44, 1976, pages 19 |
| WELLS ET AL., GENETICS, vol. 127, pages 681 |
| WELLS, R.D.; KLEIN R.D.; SINGLETON, C.K.: "In the Enzymes", vol. 14, 1981, ACADEMIC PRESS, article "Type II restriction enzyme", pages: 167 - 169 |
| WILLIAMS, PROC. NATL. ACAD. SCI., vol. 74, 1977, pages 2311 - 2315 |
| YACS; BURKE, D.T. ET AL., SCIENCE, vol. 236, 1987, pages 806 |
| YANAGIDA, M. ET AL.: "In Applications of Fluorescence in the Biomedical Sciences", 1986, ALAN R. LISS, INC., pages: 321 - 345 |
| YANAGIDA, M. ET AL.: "Quantit. Biol.", vol. 47, 1983, COLD SPRING HARBOR SYMP, pages: 177 |
| YANAGIDA, M. ET AL.: "Symp. Quantit. Biol.", vol. 47, 1983, COLD SPRING HARBOR, pages: 177 |
| YANAGIDA, M.; HIRAOKA, Y.; KATSURA, I.: "Symp. on Quant. Biol.", vol. XLVII, 1983, COLD SPR. HARB., pages: 177 - 187 |
| ZENHAUSERN, F. ET AL., J. STRUCT. BIOL., vol. 108, 1992, pages 69 - 73 |
| ZIELENSKI, J. ET AL.: "Genomic DNA sequence of the cystic fibrosis transmembrande conductance regulator (CFTR) gene", GENOMICS, vol. 10, 1991, pages 214 - 220 |
| ZIMM, B.H., J. CHEM. PHYS., vol. 9, 1991, pages 2187 - 2206 |
| ZIMM, B.H.: ""Lakes-straits" model of field- inversioin electrophoresis of DNA", J. CHEM PHYS., vol. 94, 1991, pages 2187 - 2206 |
| ZIMM, B.H.: "Dynamics of polymer molecules in dilute solution: viscoelasticity, flow birefringence and dielectic loss.", J. CHEM. PHYS., vol. 24, 1956, pages 269 - 278 |
| ZIMM, G.H.; LEVENE, S.D., PROBLEMS AND PROPSECTS IN THE THEORY OF GEL ELECTROPHORESIS OF DNA QUARTERLY REVIEWS OF BIOPHYSICE, vol. 25, 1992, pages 171 - 204 |
Also Published As
| Publication number | Publication date |
|---|---|
| JPH11503022A (ja) | 1999-03-23 |
| EP0871640A4 (fr) | 2002-04-17 |
| JP4511636B2 (ja) | 2010-07-28 |
| EP1914238A3 (fr) | 2008-11-05 |
| JP2009022284A (ja) | 2009-02-05 |
| AU5532196A (en) | 1996-10-23 |
| WO1996031522A1 (fr) | 1996-10-10 |
| EP0871640A1 (fr) | 1998-10-21 |
| JP4495767B2 (ja) | 2010-07-07 |
Similar Documents
| Publication | Publication Date | Title |
|---|---|---|
| US5720928A (en) | Image processing and analysis of individual nucleic acid molecules | |
| US6147198A (en) | Methods and compositions for the manipulation and characterization of individual nucleic acid molecules | |
| US6610256B2 (en) | Image processing and analysis of individual nucleic acid molecules | |
| US6448012B1 (en) | Method for mapping a nucleic acid | |
| JP4495767B2 (ja) | 顕微鏡的イメージングにより核酸の物理的特性を測定する方法 | |
| Cai et al. | Ordered restriction endonuclease maps of yeast artificial chromosomes created by optical mapping on surfaces. | |
| EP0391674B1 (fr) | Procédé de caractérisation de particules | |
| Ambrose et al. | Application of single molecule detection to DNA sequencing and sizing | |
| Yokota et al. | A new method for straightening DNA molecules for optical restriction mapping | |
| Zrehen et al. | On-chip stretching, sorting, and electro-optical nanopore sensing of ultralong human genomic DNA | |
| Friedrich et al. | Analysis of single nucleic acid molecules in micro-and nano-fluidics | |
| GB2264496A (en) | Sizing dna by induced fluorescence | |
| CA2173156C (fr) | Procede permettant de caracteriser des molecules polymeres ou analogues | |
| US8084257B2 (en) | Methods for sorting dimorphic daughter cells | |
| US20210010066A1 (en) | Devices and methods for nucleic acid identification | |
| Beveridge et al. | Is One Enough? | |
| Jett et al. | Flow cytometry analysis techniques for high-throughput biodefense research | |
| Hoory | Separation, deposition, and characterization of single stranded DNA on polymer coated surfaces | |
| de Grooth et al. | Measurements on Single DNA Molecules | |
| Hausmann et al. | Application of Flow Cytometry and Slit-Scan Fluorometry in Mammalian Chromosomes Analysis and Sorting | |
| Greve | MEASUREMENTS ON SINGLE DNA MOLECULES | |
| Greulich | Single Molecule DNA Restriction Analysis in the Light Microscope |
Legal Events
| Date | Code | Title | Description |
|---|---|---|---|
| PUAI | Public reference made under article 153(3) epc to a published international application that has entered the european phase |
Free format text: ORIGINAL CODE: 0009012 |
|
| AC | Divisional application: reference to earlier application |
Ref document number: 0871640 Country of ref document: EP Kind code of ref document: P |
|
| AK | Designated contracting states |
Kind code of ref document: A2 Designated state(s): AT BE CH DE DK ES FI FR GB GR IE IT LI LU MC NL PT SE |
|
| AX | Request for extension of the european patent |
Extension state: AL LT LV SI |
|
| RAP1 | Party data changed (applicant data changed or rights of an application transferred) |
Owner name: WISCONSIN ALUMNI RESEARCH FOUNDATION |
|
| PUAL | Search report despatched |
Free format text: ORIGINAL CODE: 0009013 |
|
| AK | Designated contracting states |
Kind code of ref document: A3 Designated state(s): AT BE CH DE DK ES FI FR GB GR IE IT LI LU MC NL PT SE |
|
| AX | Request for extension of the european patent |
Extension state: AL LT LV SI |
|
| 17P | Request for examination filed |
Effective date: 20090417 |
|
| 17Q | First examination report despatched |
Effective date: 20090525 |
|
| AKX | Designation fees paid |
Designated state(s): AT BE CH DE DK ES FI FR GB GR IE IT LI LU MC NL PT SE |
|
| STAA | Information on the status of an ep patent application or granted ep patent |
Free format text: STATUS: THE APPLICATION HAS BEEN REFUSED |
|
| 18R | Application refused |
Effective date: 20150618 |