EP2442104A2 - Verfahren zur Beurteilung von Zellen und Zellkulturen - Google Patents
Verfahren zur Beurteilung von Zellen und Zellkulturen Download PDFInfo
- Publication number
- EP2442104A2 EP2442104A2 EP11188198A EP11188198A EP2442104A2 EP 2442104 A2 EP2442104 A2 EP 2442104A2 EP 11188198 A EP11188198 A EP 11188198A EP 11188198 A EP11188198 A EP 11188198A EP 2442104 A2 EP2442104 A2 EP 2442104A2
- Authority
- EP
- European Patent Office
- Prior art keywords
- chondrocyte
- marker
- cell
- mfap5
- chondrocytes
- Prior art date
- Legal status (The legal status is an assumption and is not a legal conclusion. Google has not performed a legal analysis and makes no representation as to the accuracy of the status listed.)
- Withdrawn
Links
- 238000000034 method Methods 0.000 title claims abstract description 176
- 238000004113 cell culture Methods 0.000 title claims abstract description 117
- 210000001612 chondrocyte Anatomy 0.000 claims abstract description 322
- 230000014509 gene expression Effects 0.000 claims abstract description 233
- 210000004027 cell Anatomy 0.000 claims abstract description 181
- 210000002950 fibroblast Anatomy 0.000 claims abstract description 164
- 239000003550 marker Substances 0.000 claims abstract description 154
- 102100036203 Microfibrillar-associated protein 5 Human genes 0.000 claims abstract description 146
- 210000002437 synoviocyte Anatomy 0.000 claims abstract description 97
- 239000000203 mixture Substances 0.000 claims abstract description 37
- 102100028084 Hyaluronan and proteoglycan link protein 1 Human genes 0.000 claims description 128
- 101710191341 Hyaluronan and proteoglycan link protein 1 Proteins 0.000 claims description 128
- 230000002500 effect on skin Effects 0.000 claims description 36
- 108090000623 proteins and genes Proteins 0.000 claims description 34
- 210000000845 cartilage Anatomy 0.000 claims description 28
- 230000000052 comparative effect Effects 0.000 claims description 28
- 108010035532 Collagen Proteins 0.000 claims description 22
- 102000008186 Collagen Human genes 0.000 claims description 22
- 229920001436 collagen Polymers 0.000 claims description 22
- 238000001574 biopsy Methods 0.000 claims description 16
- 102000004169 proteins and genes Human genes 0.000 claims description 10
- 102100036601 Aggrecan core protein Human genes 0.000 claims description 7
- 102000055007 Cartilage Oligomeric Matrix Human genes 0.000 claims description 7
- 102100037988 Cartilage acidic protein 1 Human genes 0.000 claims description 7
- 101710196749 Cartilage acidic protein 1 Proteins 0.000 claims description 7
- 101710176668 Cartilage oligomeric matrix protein Proteins 0.000 claims description 7
- 101710118748 Cellular communication network factor 6 Proteins 0.000 claims description 7
- 101000999998 Homo sapiens Aggrecan core protein Proteins 0.000 claims description 7
- 102100034431 Nebulette Human genes 0.000 claims description 7
- 101710113660 Nebulette Proteins 0.000 claims description 7
- 102100034204 Transcription factor SOX-9 Human genes 0.000 claims description 7
- 102000050187 human CCN6 Human genes 0.000 claims description 7
- 102000043253 matrix Gla protein Human genes 0.000 claims description 7
- 108010057546 matrix Gla protein Proteins 0.000 claims description 7
- 101000947695 Homo sapiens Microfibrillar-associated protein 5 Proteins 0.000 claims description 6
- 102100032449 EGF-like repeat and discoidin I-like domain-containing protein 3 Human genes 0.000 claims description 4
- 101001016381 Homo sapiens EGF-like repeat and discoidin I-like domain-containing protein 3 Proteins 0.000 claims description 4
- 102000005701 Calcium-Binding Proteins Human genes 0.000 claims description 3
- 108010045403 Calcium-Binding Proteins Proteins 0.000 claims description 3
- 102000000503 Collagen Type II Human genes 0.000 claims description 3
- 108010041390 Collagen Type II Proteins 0.000 claims description 3
- 102000004427 Collagen Type IX Human genes 0.000 claims description 3
- 108010042106 Collagen Type IX Proteins 0.000 claims description 3
- 108010049959 Discoidins Proteins 0.000 claims description 3
- 101710198026 Transcription factor SOX-9 Proteins 0.000 claims description 3
- 102000009736 Collagen Type XI Human genes 0.000 claims 2
- 108010034789 Collagen Type XI Proteins 0.000 claims 2
- 239000002820 chemotaxin Substances 0.000 claims 2
- KIUKXJAPPMFGSW-MNSSHETKSA-N hyaluronan Chemical compound CC(=O)N[C@H]1[C@H](O)O[C@H](CO)[C@@H](O)C1O[C@H]1[C@H](O)[C@@H](O)[C@H](O[C@H]2[C@@H](C(O[C@H]3[C@@H]([C@@H](O)[C@H](O)[C@H](O3)C(O)=O)O)[C@H](O)[C@@H](CO)O2)NC(C)=O)[C@@H](C(O)=O)O1 KIUKXJAPPMFGSW-MNSSHETKSA-N 0.000 claims 1
- 229940099552 hyaluronan Drugs 0.000 claims 1
- 229920002674 hyaluronan Polymers 0.000 claims 1
- 101710147471 Microfibrillar-associated protein 5 Proteins 0.000 abstract description 141
- 239000000523 sample Substances 0.000 description 61
- 238000003753 real-time PCR Methods 0.000 description 54
- 238000003556 assay Methods 0.000 description 37
- 108091032973 (ribonucleotides)n+m Proteins 0.000 description 28
- 239000002299 complementary DNA Substances 0.000 description 28
- 239000007943 implant Substances 0.000 description 23
- 238000002247 constant time method Methods 0.000 description 20
- 238000002955 isolation Methods 0.000 description 16
- 210000001519 tissue Anatomy 0.000 description 16
- 230000029087 digestion Effects 0.000 description 15
- 239000008188 pellet Substances 0.000 description 15
- 239000000243 solution Substances 0.000 description 15
- 210000001258 synovial membrane Anatomy 0.000 description 15
- 108020004463 18S ribosomal RNA Proteins 0.000 description 14
- 238000012360 testing method Methods 0.000 description 13
- 238000004519 manufacturing process Methods 0.000 description 12
- 238000004458 analytical method Methods 0.000 description 11
- 238000006243 chemical reaction Methods 0.000 description 11
- 238000002513 implantation Methods 0.000 description 11
- 238000010195 expression analysis Methods 0.000 description 10
- 239000000499 gel Substances 0.000 description 10
- 239000002773 nucleotide Substances 0.000 description 10
- 125000003729 nucleotide group Chemical group 0.000 description 10
- 239000000047 product Substances 0.000 description 9
- 230000004044 response Effects 0.000 description 9
- 102000029816 Collagenase Human genes 0.000 description 8
- 108060005980 Collagenase Proteins 0.000 description 8
- 230000003321 amplification Effects 0.000 description 8
- 229960002424 collagenase Drugs 0.000 description 8
- 238000003199 nucleic acid amplification method Methods 0.000 description 8
- 238000002123 RNA extraction Methods 0.000 description 7
- 210000004748 cultured cell Anatomy 0.000 description 7
- 239000002609 medium Substances 0.000 description 7
- 239000012467 final product Substances 0.000 description 6
- 239000011159 matrix material Substances 0.000 description 6
- 238000002360 preparation method Methods 0.000 description 6
- 230000002441 reversible effect Effects 0.000 description 6
- 239000002356 single layer Substances 0.000 description 6
- 108091093088 Amplicon Proteins 0.000 description 5
- 102000035195 Peptidases Human genes 0.000 description 5
- 108091005804 Peptidases Proteins 0.000 description 5
- 239000004365 Protease Substances 0.000 description 5
- 238000010240 RT-PCR analysis Methods 0.000 description 5
- 108090000631 Trypsin Proteins 0.000 description 5
- 102000004142 Trypsin Human genes 0.000 description 5
- 238000000684 flow cytometry Methods 0.000 description 5
- 238000010842 high-capacity cDNA reverse transcription kit Methods 0.000 description 5
- 208000014674 injury Diseases 0.000 description 5
- 239000012588 trypsin Substances 0.000 description 5
- 208000027418 Wounds and injury Diseases 0.000 description 4
- 239000006285 cell suspension Substances 0.000 description 4
- 230000006378 damage Effects 0.000 description 4
- 238000002474 experimental method Methods 0.000 description 4
- 239000006166 lysate Substances 0.000 description 4
- 239000000463 material Substances 0.000 description 4
- 108020004999 messenger RNA Proteins 0.000 description 4
- 238000002156 mixing Methods 0.000 description 4
- KDELTXNPUXUBMU-UHFFFAOYSA-N 2-[2-[bis(carboxymethyl)amino]ethyl-(carboxymethyl)amino]acetic acid boric acid Chemical compound OB(O)O.OB(O)O.OB(O)O.OC(=O)CN(CC(O)=O)CCN(CC(O)=O)CC(O)=O KDELTXNPUXUBMU-UHFFFAOYSA-N 0.000 description 3
- 102000016911 Deoxyribonucleases Human genes 0.000 description 3
- 108010053770 Deoxyribonucleases Proteins 0.000 description 3
- 102100040448 Leukocyte cell-derived chemotaxin 1 Human genes 0.000 description 3
- 101710163270 Nuclease Proteins 0.000 description 3
- 239000012472 biological sample Substances 0.000 description 3
- 230000008859 change Effects 0.000 description 3
- 238000010790 dilution Methods 0.000 description 3
- 239000012895 dilution Substances 0.000 description 3
- 238000013150 knee replacement Methods 0.000 description 3
- 238000004264 monolayer culture Methods 0.000 description 3
- XLYOFNOQVPJJNP-UHFFFAOYSA-N water Substances O XLYOFNOQVPJJNP-UHFFFAOYSA-N 0.000 description 3
- 108091003079 Bovine Serum Albumin Proteins 0.000 description 2
- KCXVZYZYPLLWCC-UHFFFAOYSA-N EDTA Chemical compound OC(=O)CN(CC(O)=O)CCN(CC(O)=O)CC(O)=O KCXVZYZYPLLWCC-UHFFFAOYSA-N 0.000 description 2
- 238000002965 ELISA Methods 0.000 description 2
- 241000124008 Mammalia Species 0.000 description 2
- 238000000636 Northern blotting Methods 0.000 description 2
- 108010059712 Pronase Proteins 0.000 description 2
- 238000011529 RT qPCR Methods 0.000 description 2
- 240000004808 Saccharomyces cerevisiae Species 0.000 description 2
- 210000004102 animal cell Anatomy 0.000 description 2
- 210000001188 articular cartilage Anatomy 0.000 description 2
- 210000000988 bone and bone Anatomy 0.000 description 2
- 239000002782 chondrocyte implant Substances 0.000 description 2
- 238000012258 culturing Methods 0.000 description 2
- 230000001351 cycling effect Effects 0.000 description 2
- 230000009089 cytolysis Effects 0.000 description 2
- 238000010828 elution Methods 0.000 description 2
- 238000011156 evaluation Methods 0.000 description 2
- 239000012091 fetal bovine serum Substances 0.000 description 2
- 238000003500 gene array Methods 0.000 description 2
- 238000003633 gene expression assay Methods 0.000 description 2
- 102000006602 glyceraldehyde-3-phosphate dehydrogenase Human genes 0.000 description 2
- 108020004445 glyceraldehyde-3-phosphate dehydrogenase Proteins 0.000 description 2
- 238000000338 in vitro Methods 0.000 description 2
- 238000011534 incubation Methods 0.000 description 2
- 210000000629 knee joint Anatomy 0.000 description 2
- 230000007774 longterm Effects 0.000 description 2
- 239000012528 membrane Substances 0.000 description 2
- 201000008482 osteoarthritis Diseases 0.000 description 2
- BASFCYQUMIYNBI-UHFFFAOYSA-N platinum Chemical compound [Pt] BASFCYQUMIYNBI-UHFFFAOYSA-N 0.000 description 2
- 229920002401 polyacrylamide Polymers 0.000 description 2
- 238000010517 secondary reaction Methods 0.000 description 2
- 238000003860 storage Methods 0.000 description 2
- 238000001356 surgical procedure Methods 0.000 description 2
- 238000013518 transcription Methods 0.000 description 2
- 230000035897 transcription Effects 0.000 description 2
- 238000001262 western blot Methods 0.000 description 2
- YUXKOWPNKJSTPQ-AXWWPMSFSA-N (2s,3r)-2-amino-3-hydroxybutanoic acid;(2s)-2-amino-3-hydroxypropanoic acid Chemical compound OC[C@H](N)C(O)=O.C[C@@H](O)[C@H](N)C(O)=O YUXKOWPNKJSTPQ-AXWWPMSFSA-N 0.000 description 1
- BZTDTCNHAFUJOG-UHFFFAOYSA-N 6-carboxyfluorescein Chemical group C12=CC=C(O)C=C2OC2=CC(O)=CC=C2C11OC(=O)C2=CC=C(C(=O)O)C=C21 BZTDTCNHAFUJOG-UHFFFAOYSA-N 0.000 description 1
- 102000007469 Actins Human genes 0.000 description 1
- 108010085238 Actins Proteins 0.000 description 1
- 206010007710 Cartilage injury Diseases 0.000 description 1
- 102100036213 Collagen alpha-2(I) chain Human genes 0.000 description 1
- 108020004414 DNA Proteins 0.000 description 1
- 230000007067 DNA methylation Effects 0.000 description 1
- 108700039887 Essential Genes Proteins 0.000 description 1
- 108010080379 Fibrin Tissue Adhesive Proteins 0.000 description 1
- CEAZRRDELHUEMR-URQXQFDESA-N Gentamicin Chemical compound O1[C@H](C(C)NC)CC[C@@H](N)[C@H]1O[C@H]1[C@H](O)[C@@H](O[C@@H]2[C@@H]([C@@H](NC)[C@@](C)(O)CO2)O)[C@H](N)C[C@@H]1N CEAZRRDELHUEMR-URQXQFDESA-N 0.000 description 1
- 229930182566 Gentamicin Natural products 0.000 description 1
- 101150014382 Hapln1 gene Proteins 0.000 description 1
- 108010033040 Histones Proteins 0.000 description 1
- 101000875067 Homo sapiens Collagen alpha-2(I) chain Proteins 0.000 description 1
- 101710125682 Leukocyte cell-derived chemotaxin 1 Proteins 0.000 description 1
- 101150052697 MFAP5 gene Proteins 0.000 description 1
- 241000204031 Mycoplasma Species 0.000 description 1
- 108091034117 Oligonucleotide Proteins 0.000 description 1
- 241000219061 Rheum Species 0.000 description 1
- 102000006382 Ribonucleases Human genes 0.000 description 1
- 108010083644 Ribonucleases Proteins 0.000 description 1
- -1 SOX9 Proteins 0.000 description 1
- CGNLCCVKSWNSDG-UHFFFAOYSA-N SYBR Green I Chemical compound CN(C)CCCN(CCC)C1=CC(C=C2N(C3=CC=CC=C3S2)C)=C2C=CC=CC2=[N+]1C1=CC=CC=C1 CGNLCCVKSWNSDG-UHFFFAOYSA-N 0.000 description 1
- 239000011543 agarose gel Substances 0.000 description 1
- 150000001413 amino acids Chemical group 0.000 description 1
- 206010003246 arthritis Diseases 0.000 description 1
- 239000011230 binding agent Substances 0.000 description 1
- 230000015572 biosynthetic process Effects 0.000 description 1
- 230000036770 blood supply Effects 0.000 description 1
- 238000004364 calculation method Methods 0.000 description 1
- 239000004202 carbamide Substances 0.000 description 1
- 210000003321 cartilage cell Anatomy 0.000 description 1
- 238000013043 cell viability test Methods 0.000 description 1
- 238000004587 chromatography analysis Methods 0.000 description 1
- 238000003776 cleavage reaction Methods 0.000 description 1
- 238000010367 cloning Methods 0.000 description 1
- 238000011109 contamination Methods 0.000 description 1
- 238000007796 conventional method Methods 0.000 description 1
- 238000012136 culture method Methods 0.000 description 1
- 230000007547 defect Effects 0.000 description 1
- 238000009795 derivation Methods 0.000 description 1
- 238000001514 detection method Methods 0.000 description 1
- 238000010586 diagram Methods 0.000 description 1
- 230000004069 differentiation Effects 0.000 description 1
- 229940079593 drug Drugs 0.000 description 1
- 239000003814 drug Substances 0.000 description 1
- 230000009977 dual effect Effects 0.000 description 1
- 238000001962 electrophoresis Methods 0.000 description 1
- 239000002158 endotoxin Substances 0.000 description 1
- 230000002255 enzymatic effect Effects 0.000 description 1
- 108060002895 fibrillin Proteins 0.000 description 1
- 102000013370 fibrillin Human genes 0.000 description 1
- 230000003328 fibroblastic effect Effects 0.000 description 1
- 238000007429 general method Methods 0.000 description 1
- 229960002518 gentamicin Drugs 0.000 description 1
- 239000001963 growth medium Substances 0.000 description 1
- 238000003306 harvesting Methods 0.000 description 1
- 238000004128 high performance liquid chromatography Methods 0.000 description 1
- 102000044021 human MFAP5 Human genes 0.000 description 1
- 210000004276 hyalin Anatomy 0.000 description 1
- 238000003365 immunocytochemistry Methods 0.000 description 1
- 238000003364 immunohistochemistry Methods 0.000 description 1
- 238000001114 immunoprecipitation Methods 0.000 description 1
- 238000012296 in situ hybridization assay Methods 0.000 description 1
- 230000036512 infertility Effects 0.000 description 1
- 230000003902 lesion Effects 0.000 description 1
- 238000011068 loading method Methods 0.000 description 1
- 238000004949 mass spectrometry Methods 0.000 description 1
- 230000004048 modification Effects 0.000 description 1
- 238000012986 modification Methods 0.000 description 1
- 238000010606 normalization Methods 0.000 description 1
- 238000007747 plating Methods 0.000 description 1
- 229910052697 platinum Inorganic materials 0.000 description 1
- 238000003752 polymerase chain reaction Methods 0.000 description 1
- 238000012545 processing Methods 0.000 description 1
- 238000011002 quantification Methods 0.000 description 1
- 230000008439 repair process Effects 0.000 description 1
- 238000003757 reverse transcription PCR Methods 0.000 description 1
- 238000005070 sampling Methods 0.000 description 1
- 230000007017 scission Effects 0.000 description 1
- 230000035945 sensitivity Effects 0.000 description 1
- 239000004017 serum-free culture medium Substances 0.000 description 1
- 238000007860 single-cell PCR Methods 0.000 description 1
- 238000002798 spectrophotometry method Methods 0.000 description 1
- 230000006641 stabilisation Effects 0.000 description 1
- 238000011105 stabilization Methods 0.000 description 1
- 238000010186 staining Methods 0.000 description 1
- 238000013212 standard curve analysis Methods 0.000 description 1
- 238000007619 statistical method Methods 0.000 description 1
- 239000000725 suspension Substances 0.000 description 1
- 238000003786 synthesis reaction Methods 0.000 description 1
- 238000010257 thawing Methods 0.000 description 1
- 230000008733 trauma Effects 0.000 description 1
- PIEPQKCYPFFYMG-UHFFFAOYSA-N tris acetate Chemical compound CC(O)=O.OCC(N)(CO)CO PIEPQKCYPFFYMG-UHFFFAOYSA-N 0.000 description 1
Images






Classifications
-
- C—CHEMISTRY; METALLURGY
- C12—BIOCHEMISTRY; BEER; SPIRITS; WINE; VINEGAR; MICROBIOLOGY; ENZYMOLOGY; MUTATION OR GENETIC ENGINEERING
- C12Q—MEASURING OR TESTING PROCESSES INVOLVING ENZYMES, NUCLEIC ACIDS OR MICROORGANISMS; COMPOSITIONS OR TEST PAPERS THEREFOR; PROCESSES OF PREPARING SUCH COMPOSITIONS; CONDITION-RESPONSIVE CONTROL IN MICROBIOLOGICAL OR ENZYMOLOGICAL PROCESSES
- C12Q1/00—Measuring or testing processes involving enzymes, nucleic acids or microorganisms; Compositions therefor; Processes of preparing such compositions
- C12Q1/68—Measuring or testing processes involving enzymes, nucleic acids or microorganisms; Compositions therefor; Processes of preparing such compositions involving nucleic acids
- C12Q1/6844—Nucleic acid amplification reactions
-
- C—CHEMISTRY; METALLURGY
- C12—BIOCHEMISTRY; BEER; SPIRITS; WINE; VINEGAR; MICROBIOLOGY; ENZYMOLOGY; MUTATION OR GENETIC ENGINEERING
- C12Q—MEASURING OR TESTING PROCESSES INVOLVING ENZYMES, NUCLEIC ACIDS OR MICROORGANISMS; COMPOSITIONS OR TEST PAPERS THEREFOR; PROCESSES OF PREPARING SUCH COMPOSITIONS; CONDITION-RESPONSIVE CONTROL IN MICROBIOLOGICAL OR ENZYMOLOGICAL PROCESSES
- C12Q1/00—Measuring or testing processes involving enzymes, nucleic acids or microorganisms; Compositions therefor; Processes of preparing such compositions
- C12Q1/68—Measuring or testing processes involving enzymes, nucleic acids or microorganisms; Compositions therefor; Processes of preparing such compositions involving nucleic acids
- C12Q1/6844—Nucleic acid amplification reactions
- C12Q1/6851—Quantitative amplification
-
- G—PHYSICS
- G01—MEASURING; TESTING
- G01N—INVESTIGATING OR ANALYSING MATERIALS BY DETERMINING THEIR CHEMICAL OR PHYSICAL PROPERTIES
- G01N33/00—Investigating or analysing materials by specific methods not covered by groups G01N1/00 - G01N31/00
- G01N33/48—Biological material, e.g. blood, urine; Haemocytometers
- G01N33/50—Chemical analysis of biological material, e.g. blood, urine; Testing involving biospecific ligand binding methods; Immunological testing
- G01N33/5005—Chemical analysis of biological material, e.g. blood, urine; Testing involving biospecific ligand binding methods; Immunological testing involving human or animal cells
- G01N33/5008—Chemical analysis of biological material, e.g. blood, urine; Testing involving biospecific ligand binding methods; Immunological testing involving human or animal cells for testing or evaluating the effect of chemical or biological compounds, e.g. drugs, cosmetics
- G01N33/5044—Chemical analysis of biological material, e.g. blood, urine; Testing involving biospecific ligand binding methods; Immunological testing involving human or animal cells for testing or evaluating the effect of chemical or biological compounds, e.g. drugs, cosmetics involving specific cell types
-
- G—PHYSICS
- G01—MEASURING; TESTING
- G01N—INVESTIGATING OR ANALYSING MATERIALS BY DETERMINING THEIR CHEMICAL OR PHYSICAL PROPERTIES
- G01N33/00—Investigating or analysing materials by specific methods not covered by groups G01N1/00 - G01N31/00
- G01N33/48—Biological material, e.g. blood, urine; Haemocytometers
- G01N33/50—Chemical analysis of biological material, e.g. blood, urine; Testing involving biospecific ligand binding methods; Immunological testing
- G01N33/68—Chemical analysis of biological material, e.g. blood, urine; Testing involving biospecific ligand binding methods; Immunological testing involving proteins, peptides or amino acids
- G01N33/6887—Chemical analysis of biological material, e.g. blood, urine; Testing involving biospecific ligand binding methods; Immunological testing involving proteins, peptides or amino acids from muscle, cartilage or connective tissue
-
- G—PHYSICS
- G01—MEASURING; TESTING
- G01N—INVESTIGATING OR ANALYSING MATERIALS BY DETERMINING THEIR CHEMICAL OR PHYSICAL PROPERTIES
- G01N2333/00—Assays involving biological materials from specific organisms or of a specific nature
- G01N2333/435—Assays involving biological materials from specific organisms or of a specific nature from animals; from humans
- G01N2333/46—Assays involving biological materials from specific organisms or of a specific nature from animals; from humans from vertebrates
- G01N2333/47—Assays involving proteins of known structure or function as defined in the subgroups
- G01N2333/4701—Details
- G01N2333/4722—Proteoglycans, e.g. aggreccan
-
- G—PHYSICS
- G01—MEASURING; TESTING
- G01N—INVESTIGATING OR ANALYSING MATERIALS BY DETERMINING THEIR CHEMICAL OR PHYSICAL PROPERTIES
- G01N2400/00—Assays, e.g. immunoassays or enzyme assays, involving carbohydrates
- G01N2400/10—Polysaccharides, i.e. having more than five saccharide radicals attached to each other by glycosidic linkages; Derivatives thereof, e.g. ethers, esters
- G01N2400/38—Heteroglycans, i.e. polysaccharides having more than one sugar residue in the main chain in either alternating or less regular sequence, e.g. gluco- or galactomannans, Konjac gum, Locust bean gum or Guar gum
- G01N2400/40—Glycosaminoglycans, i.e. GAG or mucopolysaccharides, e.g. chondroitin sulfate, dermatan sulfate, hyaluronic acid, heparin, heparan sulfate, and related sulfated polysaccharides
-
- G—PHYSICS
- G01—MEASURING; TESTING
- G01N—INVESTIGATING OR ANALYSING MATERIALS BY DETERMINING THEIR CHEMICAL OR PHYSICAL PROPERTIES
- G01N2800/00—Detection or diagnosis of diseases
- G01N2800/10—Musculoskeletal or connective tissue disorders
Definitions
- This invention relates to methods of determining the composition of a cell culture, more particularly, to methods of distinguishing between chondrocytes and fibroblasts.
- articular cartilage injuries may be repaired by autologous chondrocyte implantation ( Brittberg et al., Clin. Orthopaed. Rel. Res., 367S: S147-S155 (1999 )).
- chondrocytes are harvested from a patient, expanded in cell culture to increase the number of chondrocytes, and then implanted back into the injury site of the patient.
- the chondrocytes are covered with a flap of periosteal tissue to seal the chondrocytes into the injury site.
- de-differentiated chondrocytes preserve their redifferentiation potential and will re-diffierentiate into chondrocytes that produce a hyaline cartilaginous tissue upon implantation.
- cultured chondrocytes are loaded onto a collagen matrix before they are implanted into the patient (Basad et al., supra ).
- the collagen matrix can be fixed with fibrin glue rather than suturing, making it a simpler surgical technique.
- Fibroblasts or fibroblast-like cells may be co-isolated with chondrocytes and, thus, co-propagated in a cell culture in the course of preparing chondrocyte implants.
- Chondrocytes are known to take on a fibroblastic appearance when they de-differentiate in culture ( Benya and Shaffer, Cell, 30: 215-224 (1982 )). Nevertheless, they maintain their differentiation potential, i.e., they are able to re-express a chondrocytic phenotype upon implantation. As a result, it can be difficult to distinguish cultured de-differentiated chondrocytes from co-cultured fibroblasts or fibroblast-like cells based on appearance.
- de-differentiated chondrocytes are different from those of native cartilage chondrocytes.
- many markers that are highly expressed in native cartilage chondrocytes are expressed at reduced levels in cultured chondrocytes ( Binette et al., J. Orthopaed. Res., 16: 207-216 (1998 )). Accordingly, expression of such a chondrocyte marker may not necessarily distinguish a de-differentiated chondrocyte from cells of other types that may be present in the cell culture.
- many known fibroblast markers are expressed in both de-differentiated chondrocytes and native cartilage chondrocytes, albeit at different levels. Accordingly, the expression level of such a fibroblast marker may not necessarily indicate whether cells present in the sample are de-differentiated chondrocytes, fibroblasts, or fibroblast-like cells.
- the methods of the invention provide methods of evaluating the composition of a cell culture (e.g., to distinguish chondrocytes from fibroblasts) and methods for evaluating the phenotype of an individual cell (e.g., as a chondrocyte).
- the methods of the invention may be used, for example, for assessing chondrocyte cultures used for the treatment of cartilage defects.
- the invention involves identifying cell culture composition or the identity of a cell based on expression level of a fibroblast marker.
- the invention involves comparing expression levels of at least one chondrocyte marker and at least one fibroblast marker in a cell culture sample or in an individual cell,
- the chondrocyte marker is hyaluronan and proteoglycan link protein 1 (HAPLN1)
- the fibroblast marker is microfibrillar associated protein 5 (MFAP5).
- the invention is based, at least in part, on the identification of MFAP5 as a cell phenotype marker that is highly expressed in certain non-chondrocytic cell types, such as fibroblasts and synoviocytes, while being expressed at significantly lower levels in chondrocytes.
- the invention is further based, at least in part, on the finding that the expression level ratios of MFAP5 and a chondrocyte marker, such as HAPLN1, is a reliable indicator of the cell phenotype in cultures derived from cartilage biopsies.
- the invention also provides embodiments in which determining the normalized expression level of the MFAP5 marker alone may be sufficient for that purpose.
- the fibroblast marker is other than MFAP5 and is such that its normalized expression levels are lower in chondrocytes than in fibroblasts. In some embodiments, the fibroblast marker is such that its normalized expression levels are lower in chondrocytes (e.g., primary and/or passaged chondrocytes) than in fibroblasts and/or synoviocytes. In some embodiments, the fibroblast marker is expressed at least 2-, 5-, 8-, 10-fold lower, or less, in chondrocytes than in fibroblasts and/or synoviocytes.
- the invention provides a method of evaluating the composition of a cell culture (Method 1), e.g., cell culture that tentatively contains chondrocytes; and a method of evaluating the phenotype of an individual cell (Method 2).
- Method 1 the expression level of a respective marker is determined as the average expression level of that marker in a plurality of cells (e.g., culture sample).
- the composition of a cell culture may be evaluated as a whole to determine whether it contains chondrocytes
- the expression level of a marker is determined as the expression level of that marker in the individual cell being evaluated.
- Method 1 identifies the composition of the cell culture
- Method 2 identifies the phenotype of an individual cell, e.g., whether or not the cell is a chondrocyte.
- Method 1 comprises:
- Method 1 involves comparing expression levels of a fibroblast marker (MFAP5 or another fibroblast marker) and a chondrocyte marker (e.g., HAPLN1) to a control or to each other.
- a fibroblast marker MFAP5 or another fibroblast marker
- a chondrocyte marker e.g., HAPLN1
- the fibroblast marker and the chondrocyte marker are such that the ratio of their expression levels (chondrocyte marker to fibroblast marker) in primary and/or passaged chondrocytes is equal to, or greater than, 5,10, 20, 30, 50, 75, 100 or more times the expression ratio in cultured fibroblasts.
- Method 1 comprises:
- the step of determining the culture composition includes comparing the average expression levels of the chondrocyte marker and the average expression level of the fibroblast marker.
- the markers' expression levels are compared relative to each other (thus, the thresholds may be defined, e.g., as a given difference between the expression levels of two markers, or a ratio thereof).
- a predetermined threshold e.g. 0.25, 0.55, 1, 2, 2.2, 5, 10, 25, 50 or more
- the expression levels of chondrocyte and fibroblast markers are determined at the RNA level, e.g., by a standard curve method of quantitative RT-PCR or by a comparative C T method of quantitative RT-PCR (which measures the difference in the number of threshold cycles required for the fibroblast marker and the chondrocyte markers).
- the invention provides a method of evaluating the phenotype of an individual cell (Method 2), e.g., using flow cytometry or single-cell RT-PCR.
- the method is useful for identifying individual cells from a cell culture, including a cell culture derived from cartilage or synovium, a chondrocyte culture, a fibroblast culture, synoviocyte culture, or any other appropriate culture.
- the method is also useful for identifying individual cells derived from any appropriate biological samples in which it is desirable to identify individual cells, including cartilage samples, synovium samples, fibroblast samples, etc.
- the fibroblast and chondrocyte markers in Method 2 may be chosen and evaluated as described for Method 1.
- Method 2 comprises
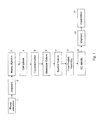
- Figure 1 is a flow diagram illustrating stages in an exemplary manufacturing process used for producing cultured chondrocytes from chondrocyte biopsies.
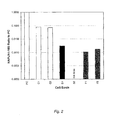
- Figure 2 depicts HAPLN1 expression levels in several cell strains as determined by a standard curve method of RT-PCR. Expression levels were normalized to 18S ribosomal RNA. The expression level in primary chondrocytes (PC) was scaled to 1; other ratios were scaled accordingly. Cell strains used are listed in Table 2.
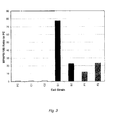
- Figure 3 depicts expression levels of MFAP5 in the same cell strains as shown in Figure 2 , as determined by a standard curve method of RT-PCR. Expression levels were normalized to 18S ribosomal RNA. The expression level in primary chondrocytes (PC) was scaled to 1; other ratios were scaled accordingly.
- PC primary chondrocytes
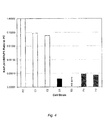
- Figure 4 depicts the ratios of HAPLN1 and MFAP5 expression levels from Figures 2 and 3 .
- the ratio in primary chondrocytes (PC) was scaled to 1; other ratios were scaled accordingly.
- Figure 5 depicts the ratios of HAPLN1 and MFAP5 expression levels in the same strains as shown in Figure 2 .
- the expression levels were determined by a comparative C T method of RT-PCR, and the ratios were calculated as 2 ⁇ (C T,MFAP5 - C T,HAPLN1 ).
- Figures 6 depicts HAPLN1 expression levels in a number of additional chondrocyte and synoviocyte strains.
- the expression levels were determined by a standard curve method of RT-PCR and normalized to 18S ribosomal RNA.
- the expression level in primary chondrocytes (PC) was scaled to 1; other ratios were scaled accordingly.
- Cell strains used are listed in Table 3.
- Figure 7 depicts MFAP5 expression levels in the same strains as shown in Figure 6 .
- the expression levels were determined by a standard curve method of RT-PCR and normalized to 18S ribosomal RNA.
- the expression level in primary chondrocytes (PC) was scaled to 1; other ratios were scaled accordingly.
- Figure 8 depicts the ratios of HAPLN1 and MFAP5 expression levels from Figures 6 and 7 .
- the ratio in primary chondrocytes (PC) was scaled to 1; other ratios were scaled accordingly.
- Figure 9 depicts the ratios of HAPLN1 and MFAP5 expression levels in the same strains as shown in Figure 6 .
- the expression levels were determined by a comparative C T method of RT-PCR, and the ratios were calculated as 2 ⁇ (C T,MFAP5 - C T,HAPLN1 ).
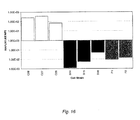
- Figure 10A depicts the ratios of HAPLN1 and MFAP5 expression levels in the same strains as shown in Figures 2 and 6 , as well as additional chondrocyte, synoviocyte, and dermal fibroblast strains identified in Table 4.
- the expression levels were determined by a comparative C T method of RT-PCR using custom-designed primers and probes as described in Example 3.
- the HAPLN1:MFAP5 ratios were calculated as 2 ⁇ (C T,MFAP5 - -C T,HAPLN1 ).
- Figure 10B depicts the ratios of HAPLN1 and MFAP5 expression levels in additional cell strains identified in Table 5. The expression levels were determined using the same methods as described for Figure 10A .
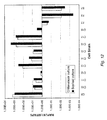
- Figure 11 shows a comparison between expression level ratios for HAPLN1 and MFAP5 in monolayer and collagen-scaffold cultures.
- Cell strains used are listed in Table 7.
- HAPLN1 and MFAP5 expression levels were determined by a standard curve method of RT-PCR. Expression levels were normalized to 18S ribosomal RNA, The ratio in monolayer culture of primary chondrocytes (PC) was scaled to 1; other ratios were scaled accordingly.
- Figure 12 shows a comparison between expression level ratios for HAPLN1 and MFAP5 in the monolayer and collagen-scaffold cultures using the same strains as shown in Figure 11 .
- the expression levels of HAPLN1 and MFAP5 were determined by a comparative C T method of RT-PCR, and the ratios were calculated as 2 ⁇ (C T,MFAP5 - C T,HAPLN1 ).
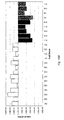
- Figure 13 depicts the change in the expression level ratios for HAPLN1 and MFAP5 as a function of culture level.
- Three synoviocyte strains were cultured from primary culture (culture level 1) through fourth passage (culture level 5), as shown in the figure.
- the expression levels of HAPLN1 and MFAP5 were determined by a comparative C T method of RT-PCR, and the ratios were calculated as 2 ⁇ (C T,MFP5 - C T,HAPLN1 ).
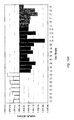
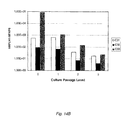
- Figures 14A and 14B depict the change in the expression level ratios for HAPLN1 and MFAP5 as a function of culture level.
- chondrocyte strains were sampled from cartilage (culture level 0) and then cultured from primary (culture level 1) through second passage (culture level 3), as shown in the figure.
- the expression levels were determined by a comparative C T method of RT-PCR using custom-designed primers and probes as described in the Example 5.
- the HAPLN1 :MFAP5 ratio was calculated as 2 ⁇ (C T,MFAP5 - C T,HAPLN1 ).
- Figure 15 depicts ratios of expression levels of HAPLN1 and MFAP5 in cultures of mixed populations of chondrocytes and synoviocytes. Three trials were conducted, each with varying proportions of the two cell types. The expression levels were determined by a comparative C T method of RT-PCR using custom-designed primers and probes as described in Example 6. The HAPLN1:MFAP5 ratios were calculated as 2 ⁇ (C T,MFAP5 - C T,HAPLN1 ).
- Figure 16 depicts molar ratios of expression levels of HAPLN1 and MFAP5 in various cell strains, which are listed in Table 12, using absolute copy numbers of the markers as determined by an absolute quantitation method.
- RT-PCR was performed as described in Example 3, except that 2 ⁇ l of cDNA was used per 13 ⁇ L PCR reaction.
- Standard curves were prepared from synthetic HAPLN1 and MFAP5 RNA transcript standards run at 10 3 , 10 4 , and 10 5 copies/reaction. The quantities of HAPLN1 and MFAP5 mRNA copies present in each test sample were determined from these standard curves.
- the invention is based, at least in part, on the identification of MFAP5 as a gene that is highly expressed in certain non-chondrocytic cell types, such as fibroblasts and synoviocytes, while being expressed at significantly lower levels in chondrocytes. Accordingly, in some embodiments the invention provides methods of using MFAP5 as a cell phenotype marker.
- MFAP5 is a serine-threonine-rich protein that binds to fibrillins and was reported to be involved in the stabilization of type I procollagen ( Lemaire et al., Arthritis & Rheumatism, 52(6): 1812-1823 (2005 )).
- MFAP5 The nucleotide and amino acid sequences of human MFAP5 can be found under GenBank® Accession No. NM_003480; its nucleotide sequence is also provided as SEQ ID NO:1.
- MFAP5 fibroblast markers
- other fibroblast markers can also be used in the methods of the invention, as described below.
- the invention provides a method of evaluating the composition of a cell culture comprising chondrocytes (Method 1) and a method of evaluating the phenotype of an individual cell (Method 2).
- the expression level of a respective marker is determined as the average expression level of that marker in a plurality of cells.
- the composition of a cell culture may be evaluated as a whole to determine whether it contains chondrocytes.
- the expression level of a marker is determined as the expression level of that marker in an individual cell being evaluated.
- Method 1 identifies the composition of cell culture
- Method 2 identifies the phenotype of an individual cell, e.g., whether or not the cell is a chondrocyte.
- the fibroblast marker is other than MFAP5 and is such that its normalized expression levels are lower in chondrocytes than in fibroblasts. In some embodiments, the fibroblast marker is such that its normalized expression levels are lower in chondrocytes (e.g., primary chondrocytes, cultured de-differentiated chondrocytes) than in fibroblasts (e.g. dermal fibroblasts) and/or synoviocytes. In some embodiments, the fibroblast marker is expressed at least 2-, 5-, 8-, 10-fold lower, or less, in chondrocytes than in fibroblasts and/or synoviocytes. Such additional markers can be identified using, e.g., gene array analysis, as described in, e.g., Leung et al., Trends in Genetics, 19(11): 649 -659 (2003 ).
- Method 1 comprises determining the expression level of a fibroblast marker of the invention in a plurality of cells from a cell culture, wherein the expression level below a predetermined threshold indicates that the cell culture contains chondrocytes.
- the expression level above a predetermined threshold indicates that the cell culture does not contain chondrocytes (e.g., the culture does not comprise at least 50%, 55%, 60%, 65%, 75%, 80%, 85%, 90%, 95%, 98%, 99% or more chondrocytes).
- the fibroblast marker is MFAP5, and a higher-than-threshold expression of MFAP5 by the cell culture indicates that the culture contains a substantial number of non-chondrocytes.
- the predetermined threshold level is 1) equal to or less than that of MFAP5 expression in pure fibroblast cultures (e.g., 2-, 3-, 4-, or 5-fold lower) or 2) equal to or greater than (e.g., 2-, 3-, 4-, or 5-fold greater) the level of MFAP5 expression in pure chondrocyte cultures (e.g., primary chondrocytes obtained from cartilage biopsies).
- the predetermined threshold can be analogously selected based on the expression levels of the respective marker in pure fibroblasts and/or chondrocytes.
- the "predetermined" level does not need to be chosen prior to determining marker expression levels and may be chosen after expression levels are determined, based for example, on the statistical analysis of the expression results.
- the plurality of cells from the culture under evaluation may be represented by a sample or an aliquot obtained from that culture.
- punch sampling can be used as described in the Examples.
- the plurality of cells typically, will contain at least the number of cells sufficient to conduct a given method of expression analysis, or more. For example, for PCR as few as 10-1,000 cells are usually sufficient, but a lower number can also be used.
- Method 1 and Method 2 involve comparing expression levels of a fibroblast marker (MFAP5 or another fibroblast marker) and a chondrocyte marker (e.g., HAPLN1 or another chondrocyte marker) to a control or to each other.
- a fibroblast marker MFAP5 or another fibroblast marker
- a chondrocyte marker e.g., HAPLN1 or another chondrocyte marker
- the order in which the expression levels of either marker are determined can vary. For example, one can first determine the expression level of a chondrocyte marker and then determine the expression level of a fibroblast marker, or vice versa. In some embodiments, the expression levels of both types of markers can be determined simultaneously.
- chondrocyte markers useful in the methods of the invention, including their GenBankTM accession numbers and SEQ ID NOs, are provided in Table 1.
- the chondrocyte marker is chosen from HAPLN1, MGP, EDIL3, WISP3, AGC1, COMP, COL2A1, COL9A1, COL11A1, LECT1, S100B, CRTAC1, SOX9, and NEBL.
- Table 1 Examples of chondrocyte markers Marker Name GenBankTM Accession No. SEQ ID NO Reference hyaluronan and proteoglycan link protein 1 (HAPLN1) NM_001884 SEQ ID NO:2 Buckwalter et al., J. Biol.
- cartilage oligomeric matrix protein (COMP) NM_000095 SEQ ID NO:7 Song et al., J. Hum. Genet., 48(5): 222-5 (2003 ) type II collagen (COL2A1) NM_001844 SEQ ID NO:8 Nishimura et al., Hum. Mutat., 26(1): 36-43 (2005 ) type IX collagen (COL9A1) NM_001851 SEQ ID NO:9 Czarny-Ratajczak et al., Am. J. Hum.
- nebulette NM_006393 SEQ ID NO:15 Grogan et al., Arth. & Rheum., 56(2): 586-95 (2007 )
- chondrocyte markers can be identified using, e.g., gene array analysis, as described in, e.g., Leung et al., Trends in Genetics, 19(11): 649-659 (2003 ).
- a chondrocyte marker is a gene or protein whose normalized expression levels are higher in chondrocytes (e.g., primary chondrocytes, cultured de-differentiated chondrocytes) than in fibroblasts (e.g. dermal fibroblasts) and/or synoviocytes.
- the chondrocyte marker is expressed at least 2, 4, 5, 8, 10, 50, 75, 100 times or greater in chondrocytes than in fibroblasts and/or synoviocytes.
- the fibroblast marker and the chondrocyte marker are chosen in such a way that the ratio of their expression levels in primary chondrocytes and/or in passaged chondrocytes is equal to or greater than 5, 10, 20, 30, 50, 75, 100 or more times that in dermal fibroblasts and/or synoviocytes.
- Method 1 comprises:
- the invention comprises a method of evaluating the composition of a cell culture, said method comprising:
- the step of determining the culture composition comprises comparing the average expression levels of the chondrocyte marker and the average expression level of the fibroblast marker.
- the cell culture is evaluated as containing chondrocytes when the ratio of HAPLN1 expression to that of MFAP5 is greater than 0.25. In particular embodiments, this ratio indicates that the cell culture contains at least 50% chondrocytes.
- the markers' expression levels are compared relative to each other (thus, the thresholds may be defined, e.g., as a given difference between the expression levels of two markers or a ratio thereof).
- a ratio of a chondrocyte marker (e.g., HAPLN1) expression level to that of a fibroblast marker (e.g., MFAP5) which is greater than a predetermined threshold, e.g., 0.25, 0.55, 1, 2, 2.2, 5, 10, 25, 50 or more, indicates that the cell culture contains chondrocytes.
- the expression levels of chondrocyte and fibroblast markers are determined at the RNA level, e.g., by a standard curve method of quantitative RT-PCR or by a comparative C T method of quantitative RT-PCR (which measures the difference in the number of threshold cycles required for the fibroblast marker and the chondrocyte markers).
- the invention provides a method of evaluating the phenotype of an individual cell (Method 2), e.g., using flow cytometry.
- the method is useful for identifying individual cells from a cell culture, including a cell culture derived from cartilage or synovium, a chondrocyte culture, a fibroblast culture, synoviocyte culture, or any other appropriate culture.
- the method is also useful for identifying individual cells derived from any appropriate biological samples in which it is desirable to identify individual cells, including cartilage samples, synovium samples, fibroblast samples, etc.
- Method 2 comprises determining the expression level of a fibroblast marker of the invention in the cell, wherein the expression level below a predetermined threshold indicates that the cell is a chondrocyte. Alternatively, the expression level above a predetermined threshold indicates that the cell is not a chondrocyte (e.g., the cell is a fibroblast or a synoviocyte). In some embodiments, Method 2 comprises:
- Flow cytometry can be performed using commercially available antibodies or such antibodies may be prepared as described in, e.g., Linsenmeyer et al., Biochem. Biophys. Res. Com., 92(2): 440-6 (1980 ).
- Cells and cultures being evaluated by the methods of this invention may be obtained from any biological sample, including any tissue, cell culture, or other material, that may or may not contain chondrocytes.
- the cells or cultures being evaluated are of mammalian, particularly human, origin.
- the cell culture is grown from cells released from a cartilage biopsy.
- cartilage cells for the procedure are normally cultured from a cartilage biopsy of the patient receiving the implant.
- Carticel® autologous chondrocyte product (Genzyme Corporation, Cambridge, MA) is an example of a cultured chondrocyte product.
- the cell culture comprises a collagen matrix loaded with chondrocytes.
- Such chondrocytes may be obtained from a cartilage biopsy and cultured prior to being loaded on the matrix, e.g., as used in the MACI® implant product.
- the method of the invention is useful for identifying, and/or confirming identify of cells loaded onto the collagen support prior to implanting the matrix.
- FIG. 1 This figure illustrates the steps involved in producing a cultured chondrocyte product for autologous chondrocyte implantation, such as using Carticel® autologous chondrocytes, or for producing a cultured chondrocyte product for the MACI® implantation procedure.
- a cartilage biopsy from a patient undergoing autologous chondrocyte implantation is shipped for processing (step 2).
- the biopsy material is digested at step 3 to release and harvest chondrocytes from the cartilage,
- the released cells are plated in tissue culture flasks and expanded in primary culture at step 4, and if necessary, subcultured.
- the cells can be, optionally, cryopreserved at step 5 until the patient is ready to receive the implant. Once the patient is ready to receive the cells, they are thawed and plated into tissue culture flasks and grown to prepare an assembly culture (step 6).
- the cells are centrifuged to a cell pellet and resuspended in shipping medium, which is the "final product” such as the Carticel® autologous chondrocyte product (step 8).
- This "final product” is subjected to a number of QC tests, including for example, a sterility test, a cell viability test, an endotoxin test, a mycoplasma test, and a culture composition test (step 9 "QC identity" as described herein) to ensure that the cultured cells contain a sufficient number of chondrocytes. If the cultured cells pass all QC tests, they are shipped (step 10) to the patient for implantation (step 11).
- the cells are resuspended in culture medium, seeded onto a collagen scaffold, and cultured for 4 days (step 7). At the end of the culture period, the cells are rinsed with shipping medium to produce a final product for MACI® implants. This product is also subjected to the QC tests outlined above.
- the method of the invention is useful as a lot identification assay or lot release assay, to confirm the composition of a cell culture as containing chondrocytes prior to shipment of the culture.
- the "QC identity" can be performed at any step prior to the final product assembly, e.g., before step 4, 5, 6, 7, or 8.
- Examples of such methods include polymerase chain reaction (including absolute quantitation by PCR, real time PCR (RT-PCR) and qRT-PCR, multiplex or singleplex PCR), single cell PCR, northern blot assays, nuclease protection assays, in situ hybridization assays, immunohistochemistry assays, immunocytochemistry assays, electrophoresis assays such as gel or capillary, Western blot assays, ELISAs, immunoprecipitation assays, chromatography based assays such as HPLC or gel chromotography, mass spectrometry assays, RNase protection assays, flow cytometry assays, DNA methylation assays, and histone modification analysis assays.
- polymerase chain reaction including absolute quantitation by PCR, real time PCR (RT-PCR) and qRT-PCR, multiplex or singleplex PCR
- RT-PCR real time PCR
- qRT-PCR multiplex or singleplex PCR
- RNA levels can be determined using any suitable method, including any one of conventional methods.
- RNA levels may be determined by, e.g., quantitative RT-PCR (e.g., TaqManTM RT-PCR or RT-PCR), Northern blotting, or any other method for determining RNA levels, or as described in the Examples.
- Protein levels may be determined, e.g., by using Western blotting, ELISA, flow cytometry, enzymatic activity assays, or any other method for determining protein levels.
- Expression levels may be scaled and/or normalized per total amount of RNA or protein in the sample and/or a control, which may typically be a housekeeping gene such, as beta-actin or glyceraldehyde-3-phosphate dehydrogenase (GAPDH), or 18S ribosomal RNA, etc.). Normalization is typically done to account for variability in the amount of protein, DNA, or RNA input. For example, in the Examples, expression levels are normalized to 18S ribosomal RNA using a standard curve.
- GPDH glyceraldehyde-3-phosphate dehydrogenase
- the expression levels of the fibroblast and chondrocyte markers are determined using RT-PGR, either by a standard curve or by a comparative C T method for relative quantification.
- absolute quantitation of marker copy numbers can be determined by preparing standard curves using known amounts of the markers. The general methods for conducting such assays are described, e.g., in Real-Time PCR Systems: Applied Biosystems 7900HT Fast Real-Time PCR System and 7300/7500 Real-Time PCR Systems, Chemistry Guide, Applied Biosystems, 2005, Part No. 4348358 Rev. E .
- the amount of the ratio of expression levels of a fibroblast marker to that of a chondrocyte marker can be calculated as (1+ E) ⁇ C T,f - C T,c ), wherein C T,f is the number of the fibroblast marker threshold cycles, C T,c is the number of threshold cycles of the chondrocyte marker, assuming that efficiency of amplification (E) is the same for both markers and the starting amount of both markers is normalized to the same amount of endogenous control ( e.g., as in two duplicate samples).
- E efficiency of amplification
- the ratio can be approximated as 2 ⁇ C T,f - C T,c ).
- Example 1 Expression of HAPLN1 and MFAP5 in Chondrocytes, Synoviocyte and Fibroblasts
- Cell Isolation and culture--Human chondrocyte cultures were isolated from cartilage using the method for producing Carticel® autologous chondrocytes or the Protease method for producing cultured chondrocytes.
- cartilage tissue was trimmed of bone and synovium and subjected to a first digestion where tissue was enzymatically treated in collagenase solution for 18 hours at 37°C.
- Cells released from the first digestion were plated in tissue culture flasks with fetal bovine serum (FBS) and gentamicin containing medium (EGHXX).
- FBS fetal bovine serum
- ESHXX gentamicin containing medium
- the cells were then subjected to a second digestion where remaining tissue from the first digestion was treated with a collagenase/trypsin solution for 2.5 hours at 37°C.
- Cells released from the second digestion were plated in tissue culture flasks with EGHXX.
- Tissue pieces remaining after the second digestion were plated in tissue culture flasks with EGHXX.
- cartilage tissue was trimmed of bone and synovium and subjected to a first digestion in Pronase E (Sigma-Aldrich Inc., St. Louis, MO) solution for 1.5 hours at 37°C.
- the Pronase solution was then removed and a second digestion of the cartilage was performed in collagenase solution for 18 hours at 37°C.
- the released cells were then plated in tissue culture flasks with EGHXX. After isolation, the cell culture methods were the same for cells obtained from either isolation method. Primary cell cultures were re-fed fresh EGHXX every 2 to 4 days. When the primary culture flasks reached 50% to 80% confluence, they were trypsinized to a single cell suspension, neutralized with EGHXX to inactivate trypsin, and a cell count was performed. The resulting cell suspension was then either sampled, further expanded by subculturing, or cryopreserved for long term storage. The subculture of the primary culture is referred to as the secondary culture, or first passage. Subsequent subcultures are referred to as the second passage, third passage, fourth passage, etc.
- Subculturing was performed by plating cells in tissue culture flasks with EGHXX and-re-feeding with fresh EGHXX every 2 to 4 days. When the subcultures reached 80% to 100% confluence, they were trypsinized to a single cell suspension, neutralized with EGHXX to inactivate trypsin, and a cell count was performed. The resulting cell suspension was then either sampled, further expanded, or cryopreserved for long term storage.
- Human synoviocyte cultures synovium derived cell cultures, also known as synovial fibroblasts) S1 and S2 were obtained from Cell Applications Inc. (San Diego, CA) as cryopreserved primary cultured cells.
- the synoviocytes were plated in tissue culture flasks with EGHXX medium and cultured using the method for producing Carticel® autologous chondrocytes as described above.
- Human dermal fibroblast cultures were purchased from Cell Applications Inc, as cryopreserved-primary cultured cells, The dermal fibroblasts were cultured using the method for producing Carticel® autologous chondrocytes as described above.
- Example 2 Cell cultures used in RT-PCR Analysis (Example 1) Cell Culture Cell Type Type of Cell Culture PC Chondrocyte Primary culture C1 Chondrocyte Second Passage C2 Chondrocyte Second Passage S1 Synoviocyte Second Passage S2 Synoviocyte Second Passage F1 Dermal Fibroblast Second Passage F2 Dermal Fibroblast Second Passage
- RNA and cDNA preparation was isolated from cell cultures using the TRI-spin procedure ( Reno et al., Biotechniques 22: 1082-6 (1997 )). Isolated RNA concentrations were determined spectrophotometrically.
- the First Strand Synthesis Kit (Roche, Indianapolis, IN), using random hexamer primers was run according to the manufacturer's instructions. The resulting cDNA was stored at -20°C or -80°C until analysis.
- Gene expression analysis was performed using quantitative real time RT-PCR, using either a standard curve method or a comparative C T method.
- the real time PCR method was based on the 5' nuclease cleavage of a dual labeled oligo probe to report sequence specific primer amplification of the target sequence ("TaqManTM assay).
- TaqManTM assay expression of genes encoding cartilage link protein (HAPLN1) and microfibrillar associated protein 5 (MFAP5) were assayed using TaqManTM Gene Expression Assays Hs00157103_m1 and Hs00185803_m1 (Applied Biosystems Inc.), respectively.
- the real time PCR was prepared with TaqManTM Universal PCR Master Mix, no UNG (catalog number 4324018, Applied Biosystems Inc.), appropriate TaqManTM Gene Expression Assay (Applied Biosystems) and sample cDNA were used according to the Universal PCR Mix protocol.
- the amplifications were run on an ABI 7500 Real-Time PCR system (Applied Biosystems Inc.) using the standard TaqManTM cycling and data collection program for this configuration. Duplicate 25 ⁇ L reactions were run with up to 5 ng of input cDNA per well. A threshold of 0.1 I units was used for all assays.
- Standard Curve Method The standard curve method was performed using the Eukaryotic 18S rRNA Endogenous Control assay (catalog number 4319413E, Applied Biosystems Inc.), in which 18S rRNA is used as an internal control to normalize RT-PCR results to account for input variation.
- 18S rRNA is used as an internal control to normalize RT-PCR results to account for input variation.
- dilutions of the primary chondrocyte (PC) cDNA were run to generate a standard curve with the 7500 system software.
- the level of each test sample's expression was determined from the standard curve, and the resulting mRNA ratios to the primary chondrocyte control (PC) were divided by the sample's 18S rRNA ratio to PC to normalize for cDNA loading.
- Comparative C T Method--Comparative C T analysis was performed to determine the relative gene expression ratios of HAPLN1 to MFAP5 in the various samples from the real time quantitative RT-PCR gene expression analysis raw data generated as described above.
- the comparative Ct method provides a relative measure of the ratio of HAPLN1 to MFAP5 which allows for direct comparison between test samples without the need for standards, standard curve analysis, or actual calibrators.
- This method can be employed in the case of the HAPLN1 and MFAP5 assays used in this example because the following four conditions were met: 1) the assay performance was consistent from run to run; 2) equivalent amounts of RNA were run in HAPLN1, MFAP5, and endogenous control assays; 3) the C T value for the endogenous control gene, 18S rRNA, was always lower than either the HAPLN1 C T or MFAP5 C T when equivalent amounts of RNA were run in each assay, and thus 18S C T was always quantifiable when either HAPLN1 or MFAP5 were quantifiable; and 4) the method used an arbitrarily selected theoretical calibrator defined as a theoretical sample containing the ratio of HAPLN1 / MFAP5 which yielded a HAPLN1 Or value equal to the MFAP5 C T value when the other three conditions listed above were met.
- HAPLN1 to MFAP5 can be described as: 1 + E ⁇ ⁇ - ⁇ C T , HAPLN ⁇ 1 / 1 + E ⁇ ⁇ - ⁇ C T , MFAP ⁇ 5 which equals: 1 + E ⁇ ⁇ - sample C T , HAPLN ⁇ 1 - sample C T , endogenous control gene - calibrator C T , HAPLN ⁇ 1 - calibrator C T , endogenous control gene / 1 + E ⁇ ⁇ - sample C T , MFAP ⁇ 5 - sample C T , endogenous control gene - calibrator C T , MFAP ⁇ 5 - calibrator C T , endogenous control gene - calibrator C T , MFAP ⁇ 5 - calibrator C T , endogenous control gene If the
- the C T of the calibrator endogenous control gene can be represented by the term y. Substituting these terms, the equation derives to: 1 + E ⁇ ⁇ - sample C T , HAPLN ⁇ 1 - x - calibrator C T , HAPLN ⁇ 1 - y / 1 + E ⁇ ⁇ - sample C T , MFAP ⁇ 5 - x - calibrator C T , MFAP ⁇ 5 - y which equals: 1 + E ⁇ ⁇ x - sample C T , HAPLN ⁇ 1 - y - calibrator C T , HAPLN ⁇ 1 / 1 + E ⁇ ⁇ x - sample C T , MFAP ⁇ 5 - y - calibrator C T , MFAP ⁇ 5 ⁇ 5 If the calibrator is defined as a theoretical sample containing the ratio of HAPLN1 / MFAP5 which yield
- Figure 2 depicts HAPLN1 expression levels in several cell strains as determined by a standard curve method of RT-PCR.
- Figure 3 depicts expression levels of MFAP5 in the same cell samples as shown in Figure 2 , as determined by a standard curve method of RT-PCR.
- HAPLN1 was expressed at higher levels in the chondrocyte cell cultures than in the synoviocyte and fibroblast cell cultures.
- MFAP5 was expressed at higher levels in synoviocyte and fibroblast cell cultures than in the chondrocyte cell cultures.
- Figure 4 depicts the ratios of HAPLN1 and MFAP5 expression levels from Figures 2 and 3 .
- the ratio in primary chondrocytes (PC) was scaled to 1; other ratios were scaled accordingly.
- Figure 5 depicts the ratios of HAPLN1 and MFAP5 expression levels in the same strains as shown in Figure 2 , however, the expression levels were determined by a comparative C T method of RT-PCR. The results of the C T method were similar to the results obtained by the standard curve method.
- Example 2 Expression of HAPLN1 and MFAP5 in Additional Strains of Chondrocyte, Synoviocytes and Fibroblasts
- HAPLN1 and MFAP5 were determined in additional cell cultures to confirm fidelity of the method for differentiating between chondrocyte and synoviocyte cultures.
- the cultures used in this Example are listed in Table 3.
- Table 3 Cell cultures used in RT-PCR Analysis (Example 2) Cell Culture Cell Type Type of Cell Culture PC Chondrocyte Primary culture C3 Chondrocyte Second passage C4 Chondrocyte Second passage C5 Chondrocyte Second passage C6 Chondrocyte Second passage C7 Chondrocyte Second passage S3 Synoviocyte Second passage S4 Synoviocyte Second passage S5 Synoviocyte Second passage S6 Synoviocyte Second passage S7 Synoviocyte Second passage
- Human chondrocyte cell cultures C3, C4, C5, C6, and C7 were isolated and cultured using the method for producing Carticel® autologous chondrocytes as described in Example 1.
- Human synoviocyte cultures (synovium derived cell cultures, also known as synovial fibroblasts) were either isolated at Genzyme or obtained from Cell Applications Inc. (San Diego, CA).
- Strains S4, S6, and S7 were isolated at Genzyme using various procedures. S4 was isolated by subjecting minced synovium tissue to digestion in collagenase solution for 3.5 hours at 37°C, followed by a second digestion in trypsin solution for 1 hour at 37°C.
- Strain S6 was isolated by subjecting minced synovium tissue to digestion in a solution containing collagenase and DNase for 2 hours at 37°C.
- Strain S7 was isolated by subjecting minced synovium to the method for producing Carticel® autologous chondrocytes. After isolation, the synovium derived cells were plated in tissue culture flasks with EGHXX medium and cultured using the method for producing Carticel® autologous chondrocytes as described in Example 1.
- Strains S3 and S5 were obtained from Cell Applications Inc. as cryopreserved first passage cells. After thawing, the cells from strains S3 and S5 were plated in tissue culture flasks with EGHXX medium and cultured using the method for producing Carticel® autologous chondrocytes as described in Example 1.
- RNA isolation and cDNA preparation RNA preparations for chondrocyte cell cultures C3, C4, C5, C6, C7 and synoviocyte cultures S3, S4, S5, S6, S7 were performed as described in Example 1.
- the RNA from these samples was reverse transcribed into cDNA using the High Capacity cDNA Reverse Transcription Kit (Applied Biosystems, Inc., Foster City, CA) according to the manufacturer's instructions.
- the PC cDNA from Example 1 was used in this Example.
- the cDNA was stored at -20°C or -80°C until analysis.
- Figure 6 depicts HAPLN1 expression levels in a number of additional chondrocyte and synoviocyte strains. The expression levels were determined by a standard curve method of RT-PCR and normalized to 18S ribosomal RNA.
- Figure 7 depicts MFAP5 expression levels in the same strains as shown in Figure 6 .
- the expression levels were determined by a standard curve method of RT-PCR and normalized to 18S ribosomal RNA.
- Figure 8 depicts the ratios of HAPLN1 and MFAP5 expression levels from Figures 6 and 7 .
- the ratio in primary chondrocytes (PC) was scaled to 1; other ratios were scaled accordingly.
- Figure 9 depicts the ratios of HAPLN1 and MFAP5 expression levels in the same strains as shown in Figure 6 .
- the expression levels were determined by a comparative C T method of RT-PCR, and the ratios were calculated as 2 ⁇ (C T,MFAP5 - C T,HAPLN1 ).
- Example 3 Expression of HAPLN1 and MFAP5 in Chondrocytes, Synoviocytes and Fibroblasts Using Custom-designed Primers and Probes
- Human chondrocyte cell cultures C1, C2, C3, C4, C5, C6, C7, C8, C26, C28, C30, and C34 were isolated and cultured using the method for producing Carticel® autologous chondrocytes as described in Example 1.
- Human chondrocyte cell cultures C21, C22, C23, C24, C25, C27, C29, C31, C32, and C33 were isolated (using the Protease method) and cultured as described in Example 1.
- Cell isolation and culture methods for human synoviocyte cultures S1, S2, S3, S4, S5, S6, and S7 were described in Examples 1 and 2.
- Synoviocyte culture S9 was isolated by subjecting minced synovium tissue to digestion in a solution containing collagenase and DNase for 2 hours at 37°C.
- Synoviocyte culture S10 was isolated by subjecting minced synovium tissue to digestion in collagenase solution for 3.5 hours at 37°C, followed by a second digestion in trypsin solution for 1 hour at 37°C.
- Synoviocyte strains S11, S12, S13, S14, S15, S16, S17, and S18 were obtained from Cell Applications Inc. as cryopreserved first passage cells.
- Dermal fibroblast strains F1, F2, F3, F4, F5, F6, F8, F9, F10, and F11 were obtained from Cell Applications Inc. as cryopreserved primary cultured cells.
- RNA isolation and cDNA preparation--RNA preparations from chondrocyte strains C1, C2, C3, C4, C5, C6, C7, synoviocyte strains S1, S2, S3, S4, S5, S6, S7, and dermal fibroblast strains F1, and F2 were described in Examples 1 and 2.
- synoviocyte strains S9, S10, S11, S12, S13, S14, dermal fibroblast strains F3, F4, F5, and F6, and all strains listed in Table 5 the RNeasyTM Mini Kit (Qiagen, Valencia, CA) RNA isolation method was used.
- RNeasyTM isolation 360 ⁇ L of lysis solution was added to cell pellets containing up to one million cells.
- RNA was reverse transcribed into cDNA using the High Capacity cDNA Reverse Transcription Kit (Applied Biosystems, Inc., Foster City, CA) according to the manufacturer's instructions.
- the resulting cDNA was stored at - 20°C or -80°C until analysis.
- the target of the reverse primer is nucleotides 603 to 622, and the target of the probe is nucleotides 584 through 601 of the same sequence.
- the target of the forward primer is nucleotides 301 through 322 of the MFAP5 sequence deposited under Genbank Accession No. NM_003480.2 (SEQ ID NO:1); the target of the reverse primer is nucleotides 353 through 372, and the target of the probe is nucleotides 334 through 350 of the same sequence.
- Figure 10A depicts the ratios of HAPLN1 and MFAP5 expression levels in the same strains as shown in Figures 2 and 6 , as well as additional chondrocyte, synoviocyte, and dermal fibroblast strains from Table 4.
- Figure 10B depicts the ratios of HAPLN1 and MFAP5 expression levels in strains from Table 5. The results obtained with the custom-designed primers and probes were similar to the results described in Examples 1 and 2.
- Example 4 Comparison of HAPLN1 and MFAP5 Expression Levels in Chondrocyte, Synoviocyte and Fibroblast Cultures in Monolayers and Collagen Scaffolds
- HAPLN1 and MFAP5 Expression levels of HAPLN1 and MFAP5 were compared in various types of cultures in monolayers and collagen scaffolds.
- RNA isolation (the "Day 0" or monolayer sample), and then the cells were resuspended in EGHXX medium and seeded onto a 20 cm 2 MAIXTM scaffold (ACI- MAIX TM collagen membrane, CE, Matricel GmbH, D-52134 Herzogenrath, Germany). The cells were allowed to attach for 1 hour at 37°C, then the scaffold was fed additional EGHXX and cultured for 4 days. Scaffold cultures containing synoviocytes and dermal fibroblasts were also prepared in the same manner. After 4 days of scaffold culture, the cultures were sampled using an 8 mm biopsy punch (the "Day 4" or scaffold sample), and RNA isolation was performed.
- RNA isolation and cDNA preparation was isolated using the RNeasyTM Mini Kit (Qiagen, Valencia, CA).
- RNeasyTM isolation 360 ⁇ L of lysis solution was added to MACl® implant samples (up to two 8 mm MACl® implant punches per preparation). The samples were immediately vortexed at full speed for 30 seconds, then placed at 37°C for 5 minutes. After incubation, the samples were shaken by hand for 10 seconds to unfold the membrane followed by another 30 second vortex at full speed. The contents of each tube were collected, and the lysate was run through a Qiashredder column (Qiagen).
- RNA Three hundred and fifty ⁇ L of the Qiashredded lysate was used in the RNeasyTM procedure following the manufacturer's protocol for the isolation of RNA from animal cells. The columns were eluted with a single elution consisting of 30 ⁇ L of water. Preparation of cDNA from the sample RNA was performed using the High Capacity cDNA Reverse Transcription Kit (Applied Biosystems, Inc., Foster City, CA) according to the manufacturer's instructions. The cDNA was stored at -20°C or -80°C.
- Table 7 lists the cell cultures used and configurations used in this Example. Table 7: Cell cultures used in RT-PCR Analysis (Example 4) Culture Code Cell Type Culture Type Configuration C9 day 0 Chondrocyte Second passage 5 X 10 5 cell pellet C10 day 0 Chondrocyte Second passage 5 X 10 5 cell pellet C11 day 0 Chondrocyte Second passage 5 X 10 5 cell pellet C12 day 0 Chondrocyte Second passage 5 X 10 5 cell pellet C13 day 0 Chondrocyte Second passage 5 X 10 5 cell pellet C14 day 0 Chondrocyte Second passage 5 X 10 5 cell pellet C15 day 0 Chondrocyte Second passage 5 X 10 5 cell pellet C16 day 0 Chondrocyte Second passage 5 X 10 5 cell pellet C17 day 0 Chondrocyte Second passage 5 X 10 5 cell pellet C18 day 0 Chondrocyte Second passage 5 X 10 5 cell pellet S7 day 0 Synoviocyte Third passage 5 X 10 5 cell pellet F7 day 0 Dermal fibroblast Second passage 5 X 10
- Figure 11 shows a comparison between expression level ratios for HAPLN1 and MFAP5 in monolayer and collagen-scaffold cultures.
- HAPLN1 and MFAP5 expression levels were determined by a standard curve method of RT-PCR. Expression levels were normalized to 18S ribosomal RNA. The ratio in monolayer culture of primary chondrocytes (PC) was scaled to 1; other ratios were scaled accordingly.
- PC primary chondrocytes
- Figure 12 shows a comparison between expression level ratios for HAPLN1 and MFAP5 in the monolayer and collagen-scaffold cultures using the same strains as shown in Figure 11 .
- the expression levels of HAPLN1 and MFAP5 were determined by a comparative C T method of RT-PCR, and the ratios were calculated as 2 ⁇ (C T,MFAP5 - C T,HAPLN1 ).
- the ratio of HAPLN1 to MFAP5 at various culture levels was investigated.
- Synoviocyte cultures C19, C20, C31, C32, and C33 were isolated using the Protease method as described in Example 1, and cultured as described in Example 1.
- Synoviocyte cultures S6 and S7 were isolated and cultured as described in Examples 1 and 2.
- Synoviocyte culture S8 was isolated by subjecting minced synovium tissue to digestion in a solution containing collagenase and DNase for 2 hours at 37°C. Cell culture of S8 was performed as described in Example 1.
- RNA isolation and cDNA preparation were prepared using the RNeasyTM Mini Kit (Qiagen) and the High Capacity cDNA Reverse Transcription Kit (Applied Biosystems inc.) as described in Example 3.
- Figures 13 , 14A , and 14B depict the change in the expression level ratios for HAPLN1 and MFAP5 as a function of the passage number.
- the expression levels were determined by a comparative C T method of RT-PCR.
- the HAPLN1 :MFAP5 ratios were calculated as 2 ⁇ (C T,MFAP5 - C T,HAPLN1 ).
- the ratios of HAPLN1 to MFAP5 were consistently low at all culture levels for the synoviocyte samples relative to the chondrocyte samples.
- the ratios of HAPLN1 to MFAP5 were consistently high at all culture levels for the chondrocyte samples relative to the synoviocyte samples.
- RNA isotafion and cDNA preparation --RNA and cDNA were prepared using the RNeasyTM Mini Kit (Qiagen) and the High Capacity cDNA Reverse Transcription Kit (Applied Biosystems Inc.) as described in Example 3.
- the expression levels were determined by a comparative C T method of RT-PCR.
- the HAPLN1:MFAP5 ratios were calculated as 2 ⁇ (C T,MFAP5 -C T,HAPLN1 ).
- Figure 15 shows the ratios of expression levels of HAPLN1 and MFAP5 in samples consisting of mixed populations of chondrocytes and synoviocytes. In the cultures that contained 75% or less chondrocytes and 25% or more synoviocytes, the HAPLN1:MFAP5 expression level ratios were about 1 or lower. Higher ratios corresponded to higher proportions of chondrocytes in the tested samples.
- the ability of the assay to discern mixtures of cell cultures showed that, on average, samples composed of at least 67% chondrocytes with the balance consisting of synovial fibroblasts to produce a positive C T,MFAP5 - C T,HAPLN1 . Contamination by other cell types, such as dermal fibroblasts, can also be detected with this assay.
- RNA transcripts of HAPLN1 and MFAP5 were employed to determine the relationship between the assay response and the molecular ratio of the markers in test samples.
- HAPLN1 these primers amplified nucleotides from positions 256 to 1171 of the HAPLN1 gene (Accession No. NM_001 884.2).
- MFAP5 these primers amplified nucleotides from positions 32 to 728 of the MFAP5 gene (Accession No. NM_003480.2).
- PCR products were analyzed on 1.5% tris-acetate EDTA (TAE) agarose gels using a 100 base pair molecular size ladder (100 bp PCR Molecular Ruler, BioRad catalog number 170-8206) for reference and SYBR Green I (Invitrogen catalog number S-7563) gel staining.
- the resulting primary amplicons were gel purified with 4% native tris-borate EDTA (TBE) polyacrylamide (PAGE) gels and used as a template for secondary PCR with the primers listed in Table 8.
- Gel-purified primary amplicon template for the secondary MFAP5 amplification was loaded at 0.56 ng per 200 ⁇ L of secondary reaction.
- the gel purified transcripts were analyzed on 6% TBU gels to assess purity. After determination of purity by PAGE analysis and quantitation by spectrophotometry, the number of transcript copies per ⁇ L was determined using the conversion factors listed in Table 9. These conversion factors assume an average base molecular weight of 343 Daltons. Avagadro's constant was considered to be 6.02 X 10 23 /mole. It was also assumed that the first base transcribed was the +1 G from the T7 promoter, followed by the target sequence. The transcripts were diluted in yeast RNA carrier buffer (20 ng/ ⁇ L solution of Yeast RNA (Ambion catalog number AM7120G) in nuclease free water) at concentrations ranging from 10 3 to 10 8 copies/ ⁇ L.
- Table 8 Primers Used for Amplification of Copy Number Standards Marker Forward Primer (Primary PCR) Forward Primer (Secondary PCR) Reverse Primer (Primary and Secondary PCR) HAPLN1 MFAP5 Table 9: Expected Transcript Sizes and Conversion Factors Transcript Expected transcript size (bases) Molecular weight (Daltons) Copies/ng HAPLN1 917 3.145 X 10 5 g/mole 1.914 X 10 9 /ng MFAP5 698 2.394 X 10 5 g/mole 2.515 X 10 9 /ng Table 10: Assay Response Versus Molecular Ratio of Markers Copies of HAPLN1 Copies of MFAP5 Exact molecular ratio of HAPLN1:MFAP5 Assay response, HAPLN1:MFAP5 1 X 10 8 1 X 10 8 1 0.470 1 X 10 7 1 X 10 7 1 0.448 1 X 10 6 1 X 10 6 1 0.423 1
- Table 12 lists the cell cultures used in this Example. The various cultures were isolated and cultured as discussed in the Examples above. RNA from the cell cultures was isolated using the RNeasy Kit as discussed in Example 3. RT-PCR was performed on the cell cultures as described in Example 3, except that 2 ⁇ l of cDNA was used per 13 *L PCR reaction. In vitro transcribed RNA standards for HAPLN1 and MFAP5 (prepared as described in Example 7) were diluted to yield cDNA with final concentrations of 5 X 10 2 , 5 X 10 3 , and 5 X 10 4 copies per uL.
- Standard curves were generated by graphing the Ct results from the standards on the y-axis, versus the logarithm of the number of copies per reaction (10 3 , 10 4 , and 10 5 ) on the x-axis. A linear trendline was fitted to the data, and the quantities of HAPLN1 and MFAP5 mRNA copies present in each test sample were determined mathematically. This method of quantitation has been previously described, e.g., in Real-Time PCR Systems: Applied Biosystems 7900HT Fast Real-Time PCR System and 7300/7500 Real-Time PCR Systems, Chemistry Guide, Applied Biosystems, 2005, Part No. 4348358 Rev. E .
Landscapes
- Health & Medical Sciences (AREA)
- Life Sciences & Earth Sciences (AREA)
- Engineering & Computer Science (AREA)
- Chemical & Material Sciences (AREA)
- Biomedical Technology (AREA)
- Immunology (AREA)
- Molecular Biology (AREA)
- Urology & Nephrology (AREA)
- Hematology (AREA)
- Cell Biology (AREA)
- Biochemistry (AREA)
- Biotechnology (AREA)
- Microbiology (AREA)
- Analytical Chemistry (AREA)
- Physics & Mathematics (AREA)
- General Health & Medical Sciences (AREA)
- Proteomics, Peptides & Aminoacids (AREA)
- Medicinal Chemistry (AREA)
- General Physics & Mathematics (AREA)
- Food Science & Technology (AREA)
- Organic Chemistry (AREA)
- Pathology (AREA)
- Bioinformatics & Cheminformatics (AREA)
- Wood Science & Technology (AREA)
- Zoology (AREA)
- Toxicology (AREA)
- Tropical Medicine & Parasitology (AREA)
- Chemical Kinetics & Catalysis (AREA)
- Genetics & Genomics (AREA)
- General Engineering & Computer Science (AREA)
- Biophysics (AREA)
- Measuring Or Testing Involving Enzymes Or Micro-Organisms (AREA)
- Investigating Or Analysing Biological Materials (AREA)
Applications Claiming Priority (2)
| Application Number | Priority Date | Filing Date | Title |
|---|---|---|---|
| US91057407P | 2007-04-06 | 2007-04-06 | |
| EP08733105A EP2132562B9 (de) | 2007-04-06 | 2008-04-03 | Verfahren zur beurteilung von zellen und zellkulturen |
Related Parent Applications (1)
| Application Number | Title | Priority Date | Filing Date |
|---|---|---|---|
| EP08733105.4 Division | 2008-04-03 |
Publications (2)
| Publication Number | Publication Date |
|---|---|
| EP2442104A2 true EP2442104A2 (de) | 2012-04-18 |
| EP2442104A3 EP2442104A3 (de) | 2012-04-25 |
Family
ID=39629001
Family Applications (2)
| Application Number | Title | Priority Date | Filing Date |
|---|---|---|---|
| EP08733105A Active EP2132562B9 (de) | 2007-04-06 | 2008-04-03 | Verfahren zur beurteilung von zellen und zellkulturen |
| EP11188198A Withdrawn EP2442104A3 (de) | 2007-04-06 | 2008-04-03 | Verfahren zur Beurteilung von Zellen und Zellkulturen |
Family Applications Before (1)
| Application Number | Title | Priority Date | Filing Date |
|---|---|---|---|
| EP08733105A Active EP2132562B9 (de) | 2007-04-06 | 2008-04-03 | Verfahren zur beurteilung von zellen und zellkulturen |
Country Status (20)
| Country | Link |
|---|---|
| US (3) | US8029992B2 (de) |
| EP (2) | EP2132562B9 (de) |
| JP (2) | JP5383654B2 (de) |
| KR (1) | KR20090127153A (de) |
| CN (1) | CN101680881B (de) |
| AR (1) | AR066403A1 (de) |
| AT (1) | ATE541211T1 (de) |
| AU (1) | AU2008237332A1 (de) |
| BR (1) | BRPI0809902A2 (de) |
| CA (1) | CA2682948C (de) |
| DK (1) | DK2132562T3 (de) |
| ES (1) | ES2380753T3 (de) |
| HR (1) | HRP20120299T1 (de) |
| IL (1) | IL201225A0 (de) |
| MX (1) | MX2009010694A (de) |
| MY (1) | MY153234A (de) |
| PL (1) | PL2132562T3 (de) |
| PT (1) | PT2132562E (de) |
| SI (1) | SI2132562T1 (de) |
| WO (1) | WO2008124508A1 (de) |
Families Citing this family (22)
| Publication number | Priority date | Publication date | Assignee | Title |
|---|---|---|---|---|
| US8889127B2 (en) | 2004-07-01 | 2014-11-18 | Icahn School Of Medicine At Mount Sinai | Targeted protein replacement for the treatment of lysosomal storage disorders |
| JP2009508596A (ja) | 2005-09-19 | 2009-03-05 | ヒストジェニックス コーポレイション | 細胞支持基材及びその調製方法 |
| JP5557084B2 (ja) * | 2009-03-17 | 2014-07-23 | 独立行政法人物質・材料研究機構 | 組織再生方法 |
| US20120128632A1 (en) * | 2009-07-23 | 2012-05-24 | Jeffrey Keeler Teumer | Identity markers |
| US20130052198A1 (en) * | 2010-03-29 | 2013-02-28 | The General Hospital Corporation | Anti-inflammatory factors |
| US8883210B1 (en) | 2010-05-14 | 2014-11-11 | Musculoskeletal Transplant Foundation | Tissue-derived tissuegenic implants, and methods of fabricating and using same |
| US9352003B1 (en) | 2010-05-14 | 2016-05-31 | Musculoskeletal Transplant Foundation | Tissue-derived tissuegenic implants, and methods of fabricating and using same |
| US10130736B1 (en) | 2010-05-14 | 2018-11-20 | Musculoskeletal Transplant Foundation | Tissue-derived tissuegenic implants, and methods of fabricating and using same |
| CN103210312A (zh) * | 2010-11-16 | 2013-07-17 | 三菱化学株式会社 | 通过软骨酸性蛋白1 检测脑梗塞的方法 |
| KR101316702B1 (ko) * | 2011-04-20 | 2013-10-10 | 서울대학교산학협력단 | 곤충의 표지 유전자를 이용한, 곤충의 맥주 유입 시기 계산 방법 |
| US8834928B1 (en) | 2011-05-16 | 2014-09-16 | Musculoskeletal Transplant Foundation | Tissue-derived tissugenic implants, and methods of fabricating and using same |
| LT2753346T (lt) | 2011-09-07 | 2020-08-10 | Mount Sinai School Of Medicine | Ceramidazė ir ląstelių diferenciacija |
| ES2897825T3 (es) | 2012-06-01 | 2022-03-02 | Icahn School Med Mount Sinai | Niveles de ceramida en el tratamiento y prevención de infecciones |
| PT2968479T (pt) | 2013-03-14 | 2019-08-07 | Icahn School Med Mount Sinai | Composições terapêuticas de ceramidase ácida e métodos de fabrico e utilização |
| US10077420B2 (en) | 2014-12-02 | 2018-09-18 | Histogenics Corporation | Cell and tissue culture container |
| CA2986702C (en) | 2015-05-21 | 2023-04-04 | David Wang | Modified demineralized cortical bone fibers |
| DE102016213684A1 (de) | 2016-07-26 | 2018-02-01 | Tetec Tissue Engineering Technologies Ag | Marker und Verfahren zur Beurteilung der Zusammensetzung oder Reinheit einer Zellkultur sowie zur in vitro Bestimmung der Identität einer Knorpelzelle oder einer Synovialzelle |
| CA3055168C (en) * | 2017-03-06 | 2022-09-06 | Haplnscience inc. | Composition for skin aging measurement, prevention, or alleviation using hapln1 |
| EP3417888A1 (de) * | 2017-06-25 | 2018-12-26 | co.don AG | Verfahren zum herstellen von transplantierbarem knorpelgewebe |
| CN112048563B (zh) * | 2020-09-09 | 2022-12-02 | 福建华民生物科技有限公司 | 一种利用软骨特异性基因表达程度控制软骨质量的方法 |
| JP7222001B2 (ja) * | 2021-01-22 | 2023-02-14 | ハプルサイエンス・インコーポレイテッド | Hapln1を利用した皮膚老化の測定用または予防用または改善用の組成物 |
| CN119235920B (zh) * | 2024-12-06 | 2025-06-24 | 浙江大学 | 一种用于关节软骨损伤修复的mfap5阳性滑膜衬里层干细胞及其鉴定方法 |
Citations (2)
| Publication number | Priority date | Publication date | Assignee | Title |
|---|---|---|---|---|
| US6150163A (en) | 1996-07-25 | 2000-11-21 | Genzyme Corporation | Chondrocyte media formulations and culture procedures |
| US7169610B2 (en) | 2002-01-25 | 2007-01-30 | Genzyme Corporation | Serum-free media for chondrocytes and methods of use thereof |
Family Cites Families (6)
| Publication number | Priority date | Publication date | Assignee | Title |
|---|---|---|---|---|
| AU3895597A (en) * | 1996-07-26 | 1998-02-20 | Genzyme Corporation | Whole cell assay |
| WO2002085285A2 (en) * | 2001-04-18 | 2002-10-31 | Wyeth | Methods and reagents for regulating bone and cartilage formation |
| US8298762B2 (en) * | 2005-03-11 | 2012-10-30 | Epiontis Gmbh | Specific DNAS for Epigenetic Characterisation of cells and tissues |
| EP1870455A4 (de) * | 2005-03-31 | 2010-01-20 | Two Cells Co Ltd | Verfahren zur unterscheidung einer mesenchym-stammzelle unter verwendung eines molekularen markers und verwendung davon |
| WO2007058671A1 (en) * | 2005-11-21 | 2007-05-24 | West Michael D | Novel uses of cells with prenatal patterns of gene expression |
| US20070292949A1 (en) | 2006-06-20 | 2007-12-20 | Genzyme Corporation | Serum-free media and their uses for chondrocyte expansion |
-
2008
- 2008-04-03 SI SI200830589T patent/SI2132562T1/sl unknown
- 2008-04-03 PT PT08733105T patent/PT2132562E/pt unknown
- 2008-04-03 CN CN2008800174379A patent/CN101680881B/zh active Active
- 2008-04-03 MY MYPI20094111A patent/MY153234A/en unknown
- 2008-04-03 JP JP2010502294A patent/JP5383654B2/ja active Active
- 2008-04-03 BR BRPI0809902-2A2A patent/BRPI0809902A2/pt not_active IP Right Cessation
- 2008-04-03 HR HR20120299T patent/HRP20120299T1/hr unknown
- 2008-04-03 KR KR1020097020856A patent/KR20090127153A/ko not_active Ceased
- 2008-04-03 EP EP08733105A patent/EP2132562B9/de active Active
- 2008-04-03 EP EP11188198A patent/EP2442104A3/de not_active Withdrawn
- 2008-04-03 AT AT08733105T patent/ATE541211T1/de active
- 2008-04-03 AU AU2008237332A patent/AU2008237332A1/en not_active Abandoned
- 2008-04-03 MX MX2009010694A patent/MX2009010694A/es active IP Right Grant
- 2008-04-03 CA CA2682948A patent/CA2682948C/en active Active
- 2008-04-03 PL PL08733105T patent/PL2132562T3/pl unknown
- 2008-04-03 ES ES08733105T patent/ES2380753T3/es active Active
- 2008-04-03 DK DK08733105.4T patent/DK2132562T3/da active
- 2008-04-03 WO PCT/US2008/059275 patent/WO2008124508A1/en not_active Ceased
- 2008-04-04 US US12/098,033 patent/US8029992B2/en active Active
- 2008-04-04 AR ARP080101409A patent/AR066403A1/es unknown
-
2009
- 2009-09-29 IL IL201225A patent/IL201225A0/en active IP Right Grant
-
2011
- 2011-08-19 US US13/213,617 patent/US20120149013A1/en not_active Abandoned
-
2012
- 2012-08-13 US US13/584,507 patent/US20120329051A1/en not_active Abandoned
-
2013
- 2013-10-01 JP JP2013206530A patent/JP2014036658A/ja active Pending
Patent Citations (2)
| Publication number | Priority date | Publication date | Assignee | Title |
|---|---|---|---|---|
| US6150163A (en) | 1996-07-25 | 2000-11-21 | Genzyme Corporation | Chondrocyte media formulations and culture procedures |
| US7169610B2 (en) | 2002-01-25 | 2007-01-30 | Genzyme Corporation | Serum-free media for chondrocytes and methods of use thereof |
Non-Patent Citations (16)
| Title |
|---|
| "Appendix A of Real-Time PCR Systems: Applied Biosystems 7900HT Fast Real-Time PCR System and 7300/7500 Real-Time PCR Systems", CHEMISTRY GUIDE, APPLIED BIOSYSTEMS, 2005 |
| "Chemistry Guide", 2005, APPLIED BIOSYSTEMS, article "Real-Time PCR Systems: Applied Biosystems 7900HT Fast Real-Time PCR System and 7300/7500 Real-Time PCR Systems" |
| "Chemistry Guide, Applied Biosystems", 2005, article "Real-Time PCR Systems: Applied Biosystems 7900HT Fast Real-Time PCR System and 7300/7500 Real-Time PCR Systems" |
| AUSUBEL ET AL.: "Current Protocols in Molecular Biology", 1998, JOHN WILEY AND SONS |
| BASAD ET AL.: "Cartilage Surgery and Future Perspectives", 2003, THIEME VERLAG, pages: 49 - 56 |
| BENYA, SHAFFER, CELL, vol. 30, 1982, pages 215 - 224 |
| BINETTE ET AL., J. ORTHOPAED. RES., vol. 16, 1998, pages 207 - 216 |
| BRITTBERG ET AL., CLIN. ORTHOPAED. REL. RES., vol. 367S, 1999, pages S147 - S155 |
| BRITTBERG ET AL., NEW ENGLAND JOURNAL OF MEDICINE, vol. 331, no. 14, 1994, pages 889 - 895 |
| LEMAIRE ET AL., ARTHRITIS & RHEUMATISM, vol. 52, no. 6, 2005, pages 1812 - 1823 |
| LEUNG ET AL., TRENDS IN GENETICS, vol. 19, no. 11, 2003, pages 649 - 659 |
| LINSENMEYER ET AL., BIOCHEM. BIOPHYS. RES. COM., vol. 92, no. 2, 1980, pages 440 - 6 |
| LIU, W., SAINT, D.A., ANALYTICAL BIOCHEMISTRY, vol. 302, 2002, pages 52 - 59 |
| LIVAK, K.J: "User Bulletin 2", 1997, ABI PUBLICATION, article "ABI Prism 7700 Sequence Detection System", pages: 4303859 |
| RENO ET AL., BIOTECHNIQUES, vol. 22, 1997, pages 1082 - 6 |
| SAMBROOK ET AL.: "Cloning: A Laboratory Manual, 2nd ed.,", 1989, COLD SPRING HARBOR LABORATORY PRESS |
Also Published As
| Publication number | Publication date |
|---|---|
| EP2132562B9 (de) | 2012-05-23 |
| MY153234A (en) | 2015-01-29 |
| CN101680881B (zh) | 2013-04-24 |
| SI2132562T1 (sl) | 2012-05-31 |
| EP2442104A3 (de) | 2012-04-25 |
| DK2132562T3 (da) | 2012-04-30 |
| PT2132562E (pt) | 2012-04-19 |
| US20120149013A1 (en) | 2012-06-14 |
| US20120329051A1 (en) | 2012-12-27 |
| EP2132562A1 (de) | 2009-12-16 |
| PL2132562T3 (pl) | 2012-06-29 |
| US20080248481A1 (en) | 2008-10-09 |
| ATE541211T1 (de) | 2012-01-15 |
| ES2380753T3 (es) | 2012-05-18 |
| ES2380753T9 (es) | 2012-11-27 |
| JP2010523124A (ja) | 2010-07-15 |
| IL201225A0 (en) | 2010-05-31 |
| CA2682948A1 (en) | 2008-10-16 |
| JP5383654B2 (ja) | 2014-01-08 |
| MX2009010694A (es) | 2009-10-22 |
| JP2014036658A (ja) | 2014-02-27 |
| CN101680881A (zh) | 2010-03-24 |
| HRP20120299T1 (hr) | 2012-04-30 |
| CA2682948C (en) | 2016-05-31 |
| KR20090127153A (ko) | 2009-12-09 |
| BRPI0809902A2 (pt) | 2014-10-07 |
| AU2008237332A1 (en) | 2008-10-16 |
| EP2132562B1 (de) | 2012-01-11 |
| WO2008124508A1 (en) | 2008-10-16 |
| US8029992B2 (en) | 2011-10-04 |
| HK1138374A1 (en) | 2010-08-20 |
| AR066403A1 (es) | 2009-08-19 |
Similar Documents
| Publication | Publication Date | Title |
|---|---|---|
| EP2132562B9 (de) | Verfahren zur beurteilung von zellen und zellkulturen | |
| Watt | Osteoarthritis biomarkers: year in review | |
| Mobasheri | Osteoarthritis year 2012 in review: biomarkers | |
| Kucur et al. | Serum YKL-40 levels and chitotriosidase activity as potential biomarkers in primary prostate cancer and benign prostatic hyperplasia | |
| US20220397576A1 (en) | Apparatuses and methods for detection of pancreatic cancer | |
| Chen et al. | Increased serum concentrations of visfatin and its production by different joint tissues in patients with osteoarthritis. | |
| Høgdall et al. | Stability of YKL-40 concentration in blood samples | |
| WO2021221138A1 (ja) | アトピー性皮膚炎の検出方法 | |
| Choi et al. | Transcriptional profiling of human femoral mesenchymal stem cells in osteoporosis and its association with adipogenesis | |
| Cerezo et al. | Pro-inflammatory S100A11 is elevated in inflammatory myopathies and reflects disease activity and extramuscular manifestations in myositis | |
| Mohammed et al. | The role of serum chitinase-3-like 1 protein (YKL-40) level and its correlation with proinflammatory cytokine in patients with rheumatoid arthritis | |
| Gu et al. | LncRNA KCNQ1OT1 delayed fracture healing through the Wnt/β-catenin pathway. | |
| Wang et al. | Circ_0088036 mediated progression and inflammation in fibroblast-like synoviocytes of rheumatoid arthritis by miR-1263/REL-activated NF-κB pathway | |
| AU2002240493B2 (en) | Determining cartilage degeneration and aging using bone morphogenic proteins | |
| HK1168895A (en) | Methods of evaluating cells and cell cultures | |
| HK1138374B (en) | Methods of evaluating cells and cell cultures | |
| Basok et al. | Increased chitotriosidase activities in patients with rheumatoid arthritis: A possible novel marker? | |
| US20220065870A1 (en) | Type X Collagen Assays and Methods of Use Thereof | |
| Ciesla et al. | AB0050 EVALUATION OF THE ASSOCIATION BETWEEN CIRCULATING NON-CODING RNA CIRC_0005567 AND DISEASE ACTIVITY IN PATIENTS WITH RHEUMATOID ARTHRITIS AND ITS BIOLOGICAL FUNCTION IN THE CELL LINE MODEL | |
| Kruis et al. | Ab0049 a Rapid Hemagglutination Assay for Acpa Detection in Patient Blood | |
| WO2018083231A1 (en) | Diagnostic methods | |
| Alanay et al. | Osteochondrodysplasias | |
| Kazakov et al. | YKL-40 in sera of breast tumor patients | |
| van de Loo et al. | THU0022 Enhanced expression of suppressor of cytokine signaling 3 in arthritic cartilage dysregulates human chondrocyte function |
Legal Events
| Date | Code | Title | Description |
|---|---|---|---|
| PUAL | Search report despatched |
Free format text: ORIGINAL CODE: 0009013 |
|
| PUAI | Public reference made under article 153(3) epc to a published international application that has entered the european phase |
Free format text: ORIGINAL CODE: 0009012 |
|
| 17P | Request for examination filed |
Effective date: 20111108 |
|
| AC | Divisional application: reference to earlier application |
Ref document number: 2132562 Country of ref document: EP Kind code of ref document: P |
|
| AK | Designated contracting states |
Kind code of ref document: A2 Designated state(s): AT BE BG CH CY CZ DE DK EE ES FI FR GB GR HR HU IE IS IT LI LT LU LV MC MT NL NO PL PT RO SE SI SK TR |
|
| AK | Designated contracting states |
Kind code of ref document: A3 Designated state(s): AT BE BG CH CY CZ DE DK EE ES FI FR GB GR HR HU IE IS IT LI LT LU LV MC MT NL NO PL PT RO SE SI SK TR |
|
| RIC1 | Information provided on ipc code assigned before grant |
Ipc: G01N 33/68 20060101ALI20120321BHEP Ipc: G01N 33/50 20060101AFI20120321BHEP |
|
| 17Q | First examination report despatched |
Effective date: 20121120 |
|
| REG | Reference to a national code |
Ref country code: HK Ref legal event code: DE Ref document number: 1168895 Country of ref document: HK |
|
| STAA | Information on the status of an ep patent application or granted ep patent |
Free format text: STATUS: THE APPLICATION IS DEEMED TO BE WITHDRAWN |
|
| 18D | Application deemed to be withdrawn |
Effective date: 20130403 |
|
| REG | Reference to a national code |
Ref country code: HK Ref legal event code: WD Ref document number: 1168895 Country of ref document: HK |