EP2665406B1 - Détermination automatisée de rapport artérioveineux dans des images de vaisseaux sanguins - Google Patents
Détermination automatisée de rapport artérioveineux dans des images de vaisseaux sanguins Download PDFInfo
- Publication number
- EP2665406B1 EP2665406B1 EP12736290.3A EP12736290A EP2665406B1 EP 2665406 B1 EP2665406 B1 EP 2665406B1 EP 12736290 A EP12736290 A EP 12736290A EP 2665406 B1 EP2665406 B1 EP 2665406B1
- Authority
- EP
- European Patent Office
- Prior art keywords
- vessel
- image
- pixels
- veins
- avr
- Prior art date
- Legal status (The legal status is an assumption and is not a legal conclusion. Google has not performed a legal analysis and makes no representation as to the accuracy of the status listed.)
- Active
Links
Images








Classifications
-
- A—HUMAN NECESSITIES
- A61—MEDICAL OR VETERINARY SCIENCE; HYGIENE
- A61B—DIAGNOSIS; SURGERY; IDENTIFICATION
- A61B3/00—Apparatus for testing the eyes; Instruments for examining the eyes
- A61B3/10—Objective types, i.e. instruments for examining the eyes independent of the patients' perceptions or reactions
- A61B3/12—Objective types, i.e. instruments for examining the eyes independent of the patients' perceptions or reactions for looking at the eye fundus, e.g. ophthalmoscopes
-
- A—HUMAN NECESSITIES
- A61—MEDICAL OR VETERINARY SCIENCE; HYGIENE
- A61B—DIAGNOSIS; SURGERY; IDENTIFICATION
- A61B3/00—Apparatus for testing the eyes; Instruments for examining the eyes
- A61B3/0016—Operational features thereof
-
- A—HUMAN NECESSITIES
- A61—MEDICAL OR VETERINARY SCIENCE; HYGIENE
- A61B—DIAGNOSIS; SURGERY; IDENTIFICATION
- A61B3/00—Apparatus for testing the eyes; Instruments for examining the eyes
- A61B3/0016—Operational features thereof
- A61B3/0041—Operational features thereof characterised by display arrangements
- A61B3/0058—Operational features thereof characterised by display arrangements for multiple images
-
- A—HUMAN NECESSITIES
- A61—MEDICAL OR VETERINARY SCIENCE; HYGIENE
- A61B—DIAGNOSIS; SURGERY; IDENTIFICATION
- A61B3/00—Apparatus for testing the eyes; Instruments for examining the eyes
- A61B3/10—Objective types, i.e. instruments for examining the eyes independent of the patients' perceptions or reactions
- A61B3/12—Objective types, i.e. instruments for examining the eyes independent of the patients' perceptions or reactions for looking at the eye fundus, e.g. ophthalmoscopes
- A61B3/1225—Objective types, i.e. instruments for examining the eyes independent of the patients' perceptions or reactions for looking at the eye fundus, e.g. ophthalmoscopes using coherent radiation
Definitions
- the methods and systems provided can automatically determine an Arteriolar-to-Venular diameter Ratio, AVR, in blood vessels, such as retinal blood vessels and other blood vessels in vertebrates.
- AVR is an important predictor of increases in the risk for stroke, cerebral atrophy, cognitive decline, and myocardial infarct. It can thus be used to perform risk analysis of (a) cardiovascular events in patients already undergoing fundus imaging for other reasons, such as diabetic retinopathy screening, (b) risk analysis for patients undergoing fundus imaging for specifically that reason, or (c) risk analysis in other situations.
- the methods and systems provided can predict cardiovascular events.
- the methods and systems provided can be applicable in many areas including Medicine, Neurology, Primary Care, Ophthalmology, as well as other applications to determine properties of blood vessels in other parts of the body that are suitable for multi-wavelength imaging, such as the iris, the skin, the eardrum, as well as other organs in albino animals.
- a decreased ratio of the width of retinal arteries to veins can be predictive of medical conditions such as cerebral atrophy, stroke and other cardiovascular events. Tortuous and dilated arteries and veins, as well as decreased AVR can also be a marker for Plus disease in retinopathy of prematurity.
- the methods and systems provided can estimate the AVR in retinal color images by detecting the location of the optic disc, determining an appropriate region of interest (ROI), classifying vessels as arteries or veins, estimating the widths and calculating the AVR.
- ROI region of interest
- the optic disc is located and the system can eliminate all vessels outside the AVR measurement ROI.
- a skeletonization operation can be applied to the remaining vessels after which vessel crossings and bifurcation points can be removed, leaving a set of vessel segments that are vessel centerline pixels.
- Features can be extracted from each centerline pixel in order to assign these a soft label indicating the likelihood the pixel is part of a vein.
- the median soft label can be assigned to each centerline pixel in the segment.
- Artery/vein pairs can be matched using an iterative algorithm, and the widths of the vessels used to calculate the AVR.
- the invention is described by reference to the claims.
- the automated method and systems provided for determination of the AVR can have substantial impact on clinical practice, and an improved assessment for patients at risk for cardiovascular and brain disease.
- the methods and systems may take the form of an entirely hardware format, an entirely software format, or a format combining software and hardware aspects.
- the methods and systems may take the form of a computer program product on a computer-readable storage medium having computer-readable program instructions (e.g., computer software) embodied in the storage medium.
- the present methods and systems may take the form of web-implemented computer software. Any suitable computer-readable storage medium may be utilized including hard disks, CD-ROMs, optical storage devices, or magnetic storage devices.
- These computer program instructions may also be stored in a computer-readable memory that can direct a computer or other programmable data processing apparatus to function in a particular manner, such that the instructions stored in the computer-readable memory produce an article of manufacture including computer-readable instructions for implementing the function specified in the flowchart block or blocks.
- the computer program instructions may also be loaded onto a computer or other programmable data processing apparatus to cause a series of operational steps to be performed on the computer or other programmable apparatus to produce a computer-implemented process such that the instructions that execute on the computer or other programmable apparatus provide steps for implementing the functions specified in the flowchart block or blocks.
- blocks of the block diagrams and flowchart illustrations support combinations of means for performing the specified functions, combinations of steps for performing the specified functions and program instruction means for performing the specified functions. It will also be understood that each block of the block diagrams and flowchart illustrations, and combinations of blocks in the block diagrams and flowchart illustrations, can be implemented by special purpose hardware-based computer systems that perform the specified functions or steps, or combinations of special purpose hardware and computer instructions.
- the accurate estimation of AVR can comprise one or more of the following, optic disc detection, vessel segmentation, vessel width measurement, vessel network analysis, and artery/vein classification.
- Optic disc detection can determine the location of the Region of Interest (ROI) where the measurements are obtained.
- Vessel segmentation can be used to find the vessels themselves and, depending on the method that is used, the width of the vessels. The methods and systems can then identify which vessels are arteries and which are veins with high accuracy. Small classification errors can have a large influence on the final AVR.
- a protocol has been established for the measurement of the AVR.
- the protocol defines where and how measurements should be obtained.
- the automated methods and systems described herein follow this protocol whenever possible.
- the methods and systems can by pre-process an image to remove the gradient around the border of the field of view (FOV) as well as to remove slow intensity variations in the image. Further pre-processing can be focused on the detection of anatomical landmarks. These can comprise the optic disc, the landmark on the retina around which the measurements are obtained and the vasculature, the structure that is actually being measured. Vessel width measurements can be obtained and the vessels within the measurement area can be classified into arteries and veins. Finally, the artery vein ratio can be determined.
- the methods and systems can implement one or more preprocessing techniques. For example, Field of View mirroring and background removal. Digital color fundus photographs have a black border around the FOV. The large gradient can disturb feature measurements near the FOV border. It can be removed by applying a mirroring technique. This method mirrors pixel values from within the circular field of view to outside the FOV. This operation can be performed at the original image resolution. Slow background variations can be removed by blurring the image with a Gaussian filter with a large standard deviation and subtracting the blurred image from the original. The value of the standard deviation of the Gaussian filter is not a critical parameter as long as it is large enough to ensure the blurred image contains no visible structures such as vessels. This procedure can be performed on both the Red as well as the Green color planes separately. From here, whenever the Green and Red plane is mentioned, it refers to the pre-processed versions. The Blue color plane is not used.
- pixel classification can be used to segment the retinal vasculature.
- the filter outputs of a Gaussian filter bank can be used as features to train a kNN-classifier to detect the vasculature.
- This method is not scale independent as the Gaussian filterbank features are extracted at particular scales.
- the images with which the vessel segmentation method can be trained have a particular resolution and therefore a particular range of vessel widths (measured in pixels).
- images can be downsampled before applying the vessel segmentation, for example with a factor 4.
- the vessel segmentation method can assign each pixel in the image a likelihood between 0 and 1 that the pixel is within a vessel. This results in a "vesselness map" that can be thresholded to produce a binary vessel segmentation.
- the vesselness map prior to thresholding the vesselness map can be up sampled back to the resolution of the original image, for example by using quintic spline interpolation.
- a skeletonization method can be applied to the thresholded likelihood map, reducing all vessels to a single centerline.
- the centerline can be one or more pixels wide.
- cross-over and bifurcation points can be removed by counting the number of neighbors for all centerline pixels and removing those with more than two neighbors. This operation subdivides the vascular network into a collection of vessel segments that can be individually analyzed.
- a supervised position regression method can be used to detect the centerpoint of the optic disc.
- This method can estimate how far a certain position in the image is from the optic disc center. This estimation can be based on measurements obtained in the image and from the vessel segmentation.
- the target location can be found by obtaining estimates in many locations in the image, eliminating those locations that are estimated to be far from the optic disc and searching around the locations estimated to be close to the optic disc center.
- the method can first be trained using a large set of images for which the location of the optic disc is known. As this method does not provide an estimate of the size of the optic disc, a more or less constant size can be assumed. For example, a value of 360 pixels can be used for the diameter of the optic disc (DD). Other diameters can be used and determined by those of skill in the art.
- the AVR calculation protocol defines the region of interest (ROI) in which the AVR should be measured. This ROI is centered on the optic disc (see FIG. 1).
- FIG. 1 shows an image overlaid with the automatically determined ROI region.
- the region labeled "B" is where AVR measurements are taken.
- the ROI comprises several circular regions whose size is based on the approximate diameter of the optic disc. Region A is between 0.5 and 1 DD from the optic disc center and region B, where vessel measurements are taken, is between 1DD and 1.5DD from the optic disc center. In an approach, all analysis and evaluation performed by the methods and systems is within region B, however, it may be advantageous to expand or contract the region within which the methods and systems can operate.
- the vasculature after preprocessing, can be thinned and subdivided into a set of vessel segments. All vessel segments that are not (partly) inside region B ( FIG. 1 ) can be removed as they are not used in the AVR analysis.
- the vessel segmentation method provided can successfully localize most vessels, i.e. wide and narrow ones, choosing a single threshold to produce a binary segmentation of the vasculature that can be used to determine the local vessel width is difficult.
- the values in the likelihood map, as produced by the vessel segmentation method tend to zero as one moves away from the vessel border into the retinal background. This effect is also dependent on the vessel width with narrower vessels having an overall lower likelihood response than wider vessels. Consequently, relatively small variations in the applied threshold result in substantial vessel width differences and thresholds that give visually pleasing results for wider vessels completely miss smaller vessels. This is further complicated by the fact that the vessel detection is performed at a lower resolution resulting in larger errors after upsampling.
- Tobogganing is a segmentation technique that subdivides the image into areas (i.e. "splats") that are homogeneous based on a certain criterion.
- the technique's results are analogous to the "catchment basins" in watershed segmentation.
- the multiscale gradient magnitude image can be used to define homogeneity.
- the image can be convolved with a first derivative of Gaussian filter in both the x and y direction after which the magnitude of the gradient is obtained for each pixel.
- the gradient magnitude at various scales i.e.
- various standard deviations ⁇ tends to have a maximum at the border of high contrast structures such as the vasculature.
- a lower scale filter can give more response at the border of small vessels and a higher scale filter can give more response at the border of wider vessels.
- a splat map (see FIG. 2c ) can be obtained.
- the likelihood map produced by the vessel segmentation algorithm can now be used to determine for each splat the likelihood it is inside a vessel.
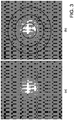
- FIG. 2 shows the process in more detail on a small subimage.
- FIG. 2 is an image showing various processing steps described herein on a small sub-image.
- FIG. 2a the color fundus image.
- FIG. 2b the vessel likelihood map. A higher pixel value in this image means a higher vessel likelihood.
- FIG. 2c the splat map, the borders of the individual splats are shown.
- FIG. 2d the processed vessel likelihood map each splat has been assigned the median vessel likelihood value under the splat.
- FIG. 2e the vessel centerlines where each centerline pixel has been assigned the likelihood it is inside a vein (dilated for display).
- FIG. 2f the final width measures overlaid on the original image. Only every third measurement was plotted.
- measurement of the local vessel width can be performed perpendicular to the local vessel angle in order to minimize errors during the measurement process.
- the local vessel angle can be determined for all centerline pixels in every vessel segment.
- the local vessel angle can be defined as the direction of the largest eigenvector of the covariance matrix of the coordinate of the centerline pixel along with the coordinates of its seven connected neighbors to both sides (i.e. 15 coordinates in total).
- the range of the angles is [0... ⁇ ].
- Near the end of the vessel segment only centerline coordinates inside the vessel are used, 8 for the end pixel. Other values can be determined and used by those of skill in the art.
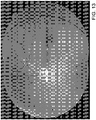
- FIG. 3 illustrates an artery vein centerline classification result ( FIG. 3b ) overlaid on a retinal image ( FIG. 3a ).
- a centerline pixel with higher pixel intensity can have a higher likelihood to be a vein.
- the local vessel width can be measured by finding the left and right vessel edges in the enhanced vessel map and calculating the distance between them.
- the likelihood can be measured along a line through the centerline pixel and perpendicular to the local vessel angle. Starting from the centerline pixel, the vessel border can be found in both left and right direction.
- the likelihood threshold at which a splat is no longer part of a vessel can be a critical parameter in this algorithm.
- a local vessel threshold can be determined for every centerline pixel.
- the vessel likelihood under the centerline pixel can be multiplied with a ratio, for example 0.7, to determine the appropriate value for the vessel threshold.
- error correction can be performed by finding sudden, local changes in the vessel width.
- a sudden change can be defined as more than a pre-determined number of pixels from one centerline pixel to the other, for example, 3.
- a sudden change can happen when a vessel splat is not or a background splat is included in the vessel width measurement.
- the ratio threshold can be varied locally until the width measurement is similar ( ⁇ 3 pixels difference) to the average width at the preceding vessel centerline pixels, for example 8 preceding vessel centerline pixels. If the vessel width can not be adjusted to match the mean width, the originally detected vessel width can be used.
- FIG. 2 shows width measurement results in a small sub-image.
- FIG. 4 is a detail of a fundus photograph showing the measurement diameters and the vessel crossings where width measurements are obtained.
- the white dots indicate the points on the vessels where measurements are obtained.
- a graph based approach can be used for vessel boundary delineation.
- a vessel centerline image can be derived from the vesselness map, and the two borders of the vessel can then be segmented simultaneously by transforming the first derivative of the vessel's pixels intensities into a two-slice three-dimension surface segmentation problem.
- the boundaries of the blood column form a reliable proxy for vessel diameter. While the splat based approach provides reliable results, a graph-based approach to determine the location of the vessel boundary can provide greater speed and accuracy, as graph-based approaches are known to be globally optimal.
- automated determination of vessel width measurement based on segmentation of both vessel boundaries can also allow the geometry of the retinal vessels to be quantified, as the geometry is also affected by cardiovascular disease, diabetes, and retinal disease.
- accurate determination of the vessel boundary may allow local pathologic vascular changes such as tortuosity and vessel beading to be measured accurately.
- a two-slice 3-D graph can be built and a smoothness constraint between the two slices can be applied.
- a simultaneous two-D boundary segmentation is transformed into a two-slice 3-D surface segmentation problem.
- This problem is then further converted into the problem of computing a minimum closed set in a node-weighted graph.
- FIG. 5a is a color fundus image.
- the white rectangular is enlarged and used for illustration in FIG. 6 .
- FIG. 5b is the corresponding vesselness image.
- a binary vessel segmentation can be generated.
- a (constant) low threshold can be selected to better maintain the continuity of blood vessels.
- the trade-off is that small regions of noise may not be suppressed adequately.
- the vessel regions with an area smaller than a pre-determined number (for example, 20) pixels can be erased from the thresholded image.
- a sequential thinning approach can then be applied to the binary vessel segmentation to find the vessel centerlines.
- vessel width can be measured directly from the vesselness map.
- the vesselness image can be thresholded, generating a binary vessel segmentation.
- a fixed threshold of 190 can be used. Widths can then be measured on this binary vessel map.
- a bifurcation point can be defined as a centerline pixel with three eight-connected neighbors and a crossing point can be defined as a centerline pixel with four or more eight-connected neighbors.
- the vessel centerline image can be scanned first to get the centerline pixels that have three or more neighbors.
- the vessel trees can be cut into vessel segments. From these vessel segments, the end points which have only one neighbor pixel can be found by scanning the image again. Starting from one end point, the vessel segment can be traced until the other end point is reached. In this way, all the vessel segments on the image are traced and labeled.
- the growing direction for every centerline pixel can be calculated.
- n adjacent centerline pixels can be used on both sides of the target centerline pixel and principal component analysis can be applied on the resulting vessel segment.
- the value of n can be a parameter of the image size, which is approximately 0.005 times the first dimension of the image size. For example, if the first dimension of an image is 600 pixels, the value of n would be three pixels, resulting in a total vessel segment length of seven pixels. In an approach, the minimum value of n can be two.
- the first principal component can correspond to the growing direction of the pixel. An end point that does not have enough neighboring centerline pixels to define the vessel growing direction can be determined to have the direction of the nearest centerline pixel that has a definition of a vessel growing direction.
- a counter-clockwise 90 degree is regarded as the normal direction for this point.
- profiles on the positive direction of the normals can be built as one slice and profiles on the negative direction can be built as another slice, as shown in FIG. 6 .
- FIG. 6 is an illustration of how to luxate the vessel normal profiles into a graph.
- FIG. 6a a small segment of vessel extracted from FIG. 5 .
- FIG. 6b the vessel probability image of FIG. 6a.
- FIG. 6c the vessel centerline image of FIG. 6a.
- FIG. 6d the vessel growing directions are calculated and node normal profile perpendicular to the vessel growing direction are constructed.
- FIG. 6e red normal profiles in FIG. 6d are used to build the red graph slice and the green normal profiles in FIG. 6d are used to build the green graph slice.
- the black nodes represent base nodes, corresponding to the black centerline pixels in FIG. 6d . Consequently, the red slice represents one boundary in FIG. 6d and the green slice represents the other boundary in FIG. 6d .
- Smoothness constraints (controlled by the arcs between adjacent columns) are applied differently to control the boundary smoothness within one boundary and between the two boundaries.
- Every node V ( x, y, z )( z> 0) has a directed arc to the node V ( x,y ,z - 1).
- a directed arc is constructed from V (x, y, z) ⁇ Col (x, y ) to V (x + 1, y, max(0, z - ⁇ x )) ⁇ Col (x + 1, y).
- arcs from V (x, y, z) ⁇ Col (x, y ) to V(x - 1, y, max(0, z - ⁇ x )) ⁇ Col (x -1, y, z) are constructed.
- ⁇ x is the maximum difference allowed between two adjacent normal profiles within one boundary.
- arcs from V (x, y, z) ⁇ Col (x, y ) to V(x, y + 1, max (0, z - ⁇ y )) ⁇ Col (x, y + 1, z) and arcs from V (x, y, z) ⁇ Col (x, y ) to V (x, y - 1, max (0, z - ⁇ y )) ⁇ Col (x, y - 1, z) are constructed.
- ⁇ y is the maximum difference allowed between two corresponding normal profiles between the two boundaries.
- the base nodes are all connected.
- a surface is regarded feasible if it satisfies the smoothness constraint defined by ⁇ x and ⁇ y .
- An optimal surface is defined as the surface with the minimum cost among all feasible surfaces defined in the 3-D volume.
- the cost image can be generated from the orientation sensitive ID first order derivative of Gaussian of the green channel.
- the green channel of the color image usually shows the highest contrast between the blood vessels and background.
- a discrete convolution with the 1D derivative of Gaussian can be applied along the direction perpendicular to the vessel growing direction (as shown in FIG. 7 ).
- the derivative of Gaussian kernel is shown in Equation 1: where ⁇ is the only parameter in the first order derivative of Gaussian.
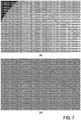
- FIG. 7 is an example.
- FIG. 7a shows an enlarged part of the green channel image.
- FIG. 7b shows the orientation sensitive ID derivative of Gaussian result.
- ⁇ ⁇ can be set to one to maintain the smoothness within one boundary and ⁇ y can be set to two so that a difference is allowed between widths from the centerline to the left edge and from the centerline to the right edge, in case the centerline is not exactly at the center of the two edges.
- the optimal surface can be determined. To determine the vessel width, the coordinate difference between the two corresponding nodes on the optimal surface from the two slices can be calculated. To show the boundary on the image, the nearest integer coordinate of every node on the optimal surface can be calculated and shown on the image.
- the previously detected vessel segments can be assigned to one of these two classes.
- a supervised system i.e. trained with examples, can be used.
- the classification method can be used to classify previously unseen centerline pixels into either artery or vein (AV classification).
- AV classification artery or vein
- the pre-processing procedure and vessel width measurements can be applied to all images in the training set. An expert can indicate whether a given major vessel was an artery or vein for each of the training images.
- a classifier can be trained using the expert labeled vessels in the training set in order to distinguish between both classes of centerline pixels. As not all vessels in the training set will be marked as artery or vein, centerline pixels from unmarked vessels are not included in the training dataset. For all remaining centerline pixels in the training images, a set of local features was extracted. Table I shows a list of exemplary extracted features that can be used. In general the features characterize the color as well as the color variation in the vessel. All features that are measured across the vessel can be measured on the profiles as previously determined. Table 1 Nr. Feature description 1-3 Normalized Mean Hue, Saturation and Intensity across vessel. 4-5 Normalized Mean Red and Green plane intensities across the vessel.
- the absolute color of the blood in the vessels can vary between images and across subjects. This variation can have several causes. Primarily, the amount of hemoglobin oxygen saturation influences the reflectivity of the blood column, and this difference allows the difference between higher saturation arterial from lower saturation venous blood to be visualized. Next, lens absorption for different wavelengths is influenced by aging and the development of cataract, causing shifts in the spectral distribution of light reflected by blood. Individual difference in pigmentation of the retinal pigment epithelium below the blood vessels also influence the spectrum of reflected light. Finally, across examinations, even from the same subject, differences in flash intensity, flash spectrum, nonlinear optical distortions of the camera, flash artifacts, and focus also cause considerable variability.
- the training set can then be split into a separate classifier selection training and test set.
- classifiers can be used, for example: k -Nearest Neighbor Classifier, Support Vector Machine Classifier, Linear Discriminant Classifier, or a Quadratic Discriminant Classifier.
- the classifier that maximizes the area under the Receiver Operator Characteristic (ROC) curve can be selected.
- a label close to 0 means the pixel was likely in an artery and a label close to 1 means a pixel was likely in a vein. It can be assumed that all pixels in a vessel segment are either in an artery or a vein.
- Each soft label assigned to a centerline pixel can be regarded as a vote for the label of the complete segment. Combining these votes can be done in many different ways including taking the median label for the entire vessel segment.
- the soft labels assigned to each of the segments can vary over the image.
- a global threshold will not always successfully separate the arteries from the veins within a single subject and will vary between subjects.
- To perform the final classification the prior knowledge that arteries and veins usually come in pairs can be used. This means that, when going around the optic disc in a circle in region B of the ROI, one will generally encounter an artery after first encountering a vein and vice versa. Since this rule does not always hold and since finding the matching vessel segment for a particular different vessel segment is non-trivial, a voting procedure can be implemented.
- AVR CRAE CRVE
- CRAE Central Retinal Artery Equivalent
- CRVE Central Retinal Vein Equivalent.
- Algorithm 1 shows an exemplary implementation.
- the final voting procedure can be based on measurements obtained on a circle with a certain diameter.
- the chance that all vessel segments in the ROI will intersect with a circle of any particular diameter is small. Therefore, the voting procedure and AVR calculation should be repeated at various diameters within the AVR ROI (see FIG. 4 ).
- the diameters can be from 1 DD to 1.5 DD in steps of 0.1 DD where DD was 360 pixels, so the voting and AVR calculation procedure can be repeated 6 times. Note that this samples the AVR ROI equidistantly.
- the AV voting procedure can be performed, the local vessel width can be measured and stored in two vectors, A for arteries and V for veins.
- Algorithm 1 can be used to calculate the AVR.
- the resulting six AVR values can be averaged to arrive at the final AVR estimate for the complete image.
- AVR arteriovenous ratio
- FIG. 8 provided are methods and systems for automatic determination of arteriovenous ratio (AVR), comprising receiving an image at 801, detecting a region of interest in the image at 802, identifying arteries and veins in the region of interest at 803, determining vessel width measurements for the identified arteries and veins at 804, and estimating an arteriovenous ratio (AVR), from the vessel width measurements at 805.
- AVR arteriovenous ratio
- decreased AVR indicates higher propensity for a disease. For example, decreased from a "normal" AVR or decreased from a previous AVR.
- the methods and systems provide a novel quantitative approach to early detection of retinal and cardiovascular disease.
- detecting a region of interest in the image can further comprise detecting an optic disc in the image. Identifying arteries and veins in the region of interest can comprise performing vessel segmentation on the image. Performing vessel segmentation on the image can further comprise utilizing a trained classifier to classify pixels in the image as artery or vein pixels.
- the image can be one or more of, a color image, a multispectral image, an Optical Coherence Tomography image.
- the image can be of the retina, iris, skin, brain surface, or any tissue with visible blood vessels imaged using any two different wavelength imaging process.
- the trained classifier can use a feature vector comprising one or more of, derivatives, texture, and color properties.
- determining vessel width measurements for the identified arteries and veins comprises using one or more of, a graph search, a multiscale pixel feature based toboganning method and splats.
- the graph search can use a multiscale cost function.
- the multiscale cost function can be derived from some combination of wavelet kernel lifting including Gabor, Gaussian derivative and Difference of Gaussians kernels.
- the methods and systems provided can be applied to other two-dimensional blood vessel projections such as cardiac and brain angiograms.
- the methods and systems can be utilized to provide an indicator of disease propensity.
- the methods and systems can be applied to large quantities of images for batch processing and determination of a disease propensity for a group of persons.
- the methods and systems can utilize disc detection, disc centerpoint determination and disc diameter measurement to identify the image region.
- Pixel classification and mathematical morphology can be used to determine the artery/vein measures.
- the image can be a color image.
- the image can be a multispectral image.
- the image can be a combination of an OCT image and a multispectral image.
- the image can be of the retina, the iris, the skin, the brain surface, or of another tissue with visible blood vessels imaged using any two different wavelength imaging process.
- the methods and systems can classify pixels in an image using artery and vein measurements.
- the classification can use a feature vector containing derivatives, texture and color properties.
- the color features can be normalized for each individual image.
- a knn classifier or a support vector machine can be used to classify the pixels.
- the centerline of one or a plurality of vessels can be assigned a classification.
- the methods and systems can measure local vessel texture patterns using filters.
- the filters can be, for example, Gaussian derivatives, Gabor filters or wavelet filters based filterbank, or a combination thereof.
- the filters can be obtained using image samples and a transform such as principal component analysis thereof.
- methods and systems to perform accurate width measurements of the retinal vessel between the boundaries of the vessel can be determined using graph search.
- the graph search can use a multiscale cost function.
- the multiscale cost function can be derived from some combination of wavelet kernel lifting including Gabor, Gaussian derivative and Difference of Gaussians kernels.
- the boundaries can be determined using a multiscale pixel feature based toboganning method and splats.
- the methods and systems disclosed can analyze local vessel structure to determine how the vascular network is connected. In a further approach, the methods and systems disclosed can determine the locations in the image where width measurements need to be obtained in order to calculate the AV-ratio. Disc detection, disc centerpoint determination and disc diameter measurement can be used to identify the image locations.
- the features can be normalized to all vessel pixels. The features can be normalized to all disc vessel pixels. The features can be normalized to all background pixels.
- An ophthalmologist labeled the major vessels in the images of the training set as either artery or vein to train the artery vein classification method,. As only the vessel centerlines needed to be labeled, precise vessel segmentation was not needed. Labeling was done by manually drawing a line over the major vessels using a standard painting program. The colors blue and red were used for veins and arteries respectively.
- AV classification Two components of the presented method were evaluated on the test images, the AV classification and the AVR determination.
- the vessels in each of the images in the test set were manually labeled as either artery or vein by an ophthalmologist (AVD).
- AVR ophthalmologist
- the major arteries and veins were labeled in the training set, only those parts of all vessels (i.e. including the small vessels) that were inside the AVR ROI were labeled in the test set.
- the expert labeled all vessels in the ROI as either an artery or a vein.
- IVAN semi-automated computer program developed by the University of Wisconsin in Madison, WI, USA was used (IVAN). Two ophthalmologists processed the images in the test set using this software. Both ophthalmologists were instructed in the use of the software using the protocols defined by the software developers. IVAN is semi-automated; the AVR ROI localization, the vessel width measurements and the artery vein classification require manual adjustment. On average a human observer takes around 10 minutes per image to perform the analysis. The software is capable of producing several different AVR measures. The ratios obtained by the first ophthalmologist (MDA) were used as the reference standard and the second ophthalmologist's (AVD) ratios were used to determine the variability between experts.
- MDA first ophthalmologist
- ATD second ophthalmologist's
- the methods and systems provided herein were applied to all 40 test images.
- the system was able to find the optic disc and successfully placed the AVR in all 40 images. This was verified by visual inspection and the AVR ROI was centered on the optic disc in all 40 images.
- FIG. 10 This graph plots the mean of two AVR measurements against the difference between them and allows a visual assessment of the distribution of errors and the agreement between the two methods.
- FIG. 10 provides the Bland-Altman plots or the agreement between the automatic system and the reference standard FIG. 10a and between the second observer and the reference standard FIG. 10b .
- the red lines represent the 95% limits or agreement.
- the dotted line represents the mean difference between AVR measurements.
- Table 2 shows the error with respect to the reference standard of the automated system for each image.
- the mean AVR values and their standard deviations of the reference standard are very close between the automated system and observer 2, a statistical test showed there was no significant difference between the means.
- there are 8 AVR measurements by the automated system that have an error above 0.10 when compared with the reference standard.
- 5 show a relatively good agreement with the measurement done by the second observer.
- the Bland-Altman plots show that both the automated system and the second observer have no bias as the mean difference between the AVR measurements is close to 0.
- the 95% limits of agreement for both the automated and second observer are also almost the same. However, the second observer has two large outliers without which the 95% limits of agreement would have moved somewhat closer to 0.
- the REVIEW database was used to validate the correctness of the methods and systems.
- Each profile in the REVIEW database consists of 15 numbers: series number, image number, segment number and four data for each of three observers.
- the three observers are denoted as O 1 , O 2 and O 3 .
- O 1 , O 2 and O 3 For each observer, there are four measurements for two points on each edge ( x 1 , y 1 , x 2 and y 2 ).
- the vessel centerline is defined as ( x 1 - x 2 ) 2 + ( y 1 - y 1 ) 2 and the vessel width as ( x 1 - x 2 ) 2 + ( y 1 - y 2 ) 2 for each observer (http://ReviewDB.lincoln.ac.uk).
- a reference standard, denoted by RS is then created by averaging the manual results of the three observers.
- the vessel centerlines were determined as described herein and mapped to the centerlines in the RS, so that only those vessel centerline pixels were analyzed that also occurred in the RS. Otherwise the centerline pixel was labeled as absent.
- FIG. 11 An example of the quality of the obtained vessel boundary detection is shown in FIG. 11 .
- Good performance is obtained on even the smallest vessels, which have low contrast.
- FIG. 11b is an enlarged part of image FIG. 11a .
- the methods and systems provided herein were compared to other known algorithms in Table 3 to Table 6.
- the first three rows are the manual result from the observers. Rows 4-8 show the results of the other algorithms.
- the last row shows the result of the presently disclosed methods and systems.
- the first column is the success rate. Every centerline pixel that had corresponding ground truth profiles as a "success measurement", irrespective of the estimate of the width. Therefore all measurements with a corresponding ground truth profile were included even if the measurements did not result in a meaningful estimation.
- the columns 2-3 are the mean and standard deviation of all measurements labeled as 'success measurement'.
- Columns 4-5 are the signed mean and standard deviation of the point-by-point differences.
- the HRIS dataset has the highest image resolution (3584 x 2438 pixels).
- the performance of the vessel width detection is comparable to the observers.
- the CLRIS dataset images have a resolution of 2160 x 1440 pixels.
- the mean vessel with and the point-by-point difference mean are very close to the observers' performance. But the point-by-point difference standard deviation is high.
- the VDIS dataset has a resolution of 1360 x 1024 pixels.
- the mean vessel width is 0.53 pixels smaller than the ground truth.
- the KPIS dataset has the smallest image resolution, 288 x 119 pixels and 170 x 92 pixels.
- FIG. 12 shows the correlation of predicted vessel width and the mean of the observers' measurement for HRIS.
- the regression line shows the prediction tends to give a smaller measurement for vessels with fine vessels while a larger measurement for large vessels, compared to the observers' measurements.
- Each point represent one profile.
- the relationship between vessel width and distance from the optic disc center is shown in FIG. 13 .
- a total of 2,936,749 center line pixels were extracted from the 600 images. If the pixels near the center of optic disc are not considered, where the blood vessels show a very complicated structure, the average vessel width shows a monotonic decrease from a distance of 20 pixels to 450 pixels, with a sudden slope change at a distance of 300 pixels to the optic disc.
- the average vessel width is about 5.0 pixels (approximately 75 microns) while the vessels that have a distance of 450 pixels to the optic disc have an average vessel width of 3.5 pixels (approximately 52.5 microns).
- FIG. 13 illustrates relationship between vessel width and distance to optic disc.
- the black circle marks a 400 pixels to the optic disc center.
- the vessel width analysis starts from the optic disc center and ends at a distance of 450 pixels (the x-axis).
- the y-axis shows the vessel width in pixels.
- the green line is the average vessel width.
- the black lines are the 95% confidence interval lines.
- Image resolution is about 800 x 700 pixels.
- Scale parameter (J 4 pixels was used.
- the methods and systems provided can identify the retinal blood vessel boundaries using a graph-based approach.
- the results of the evaluation show that the blood vessel boundaries are accurate, and that the methods and systems outperform the prior algorithm on two datasets of standard retinal image resolution.
- the presently disclosed methods and systems allow for the identification of retinal vessel boundaries of even small vessels on standard posterior pole images as used in diabetic retinopathy screening programs around the world.
- the relationship between vessel width with distance and the optic disc center is inverse and monotonous.
- the relationship between the average retinal vessel diameter and the distance from the optic disc from 600 patients with diabetes was reliably determined. Except for the vessel pixels near the center of the optic disc (about 20 pixels), the blood vessel width shows a monotonic decrease considering the distance from the optic disc to the center. This is most likely caused by branching - if it is assumed that the blood vessel volume to be unchanged. If the number of blood vessels is kept constant, the higher the branch frequency with increasing distance to the optic disc the larger the slope of the width decrease. At a distance of around 300 pixels, there is a slight slope change in average vessel width, most likely caused by the fact that this is where the image centered on the optic disc ends and transitions to the fovea centered image that is registered to it in our dataset.
- FIG. 14 illustrates vessel width measurement on vessel segments with different resolutions
- FIG. 14a one test vessel segment from HRIS.
- the length of the vessel segment is 173 pixels.
- FIG. 14b one test vessel segment from KPIS.
- the length of the vessel segment is 226 pixels.
- FIG. 14c the vessel width measurement result of (a). If the detected edge is not at an integer location, the nearest integer coordinate is shown.
- FIG. 14d the vessel width measurement result of (b). If the detected edge is not at an integer location, the nearest integer coordinate is shown.
- FIG. 14e the cross-sectional view of vessel intensity with regard to the distance to the centerline for (a).
- the black curve is the average of 173 normal profiles in the vessel segment. Intensities at non-integer locations are linearly interpolated.
- the red star is the average vessel width across the whole vessel segment marked by observers.
- the green star is the average vessel width across the whole vessel segment measured by proposed method. The two boundaries are flipped and shown in one figure.
- FIG. 14f the cross-sectional view of vessel intensity with regard to the distance to the centerline for FIG. 14b .
- the black curve is the average of 226 normal profiles in the vessel segment. Intensities at non-integer locations are linearly interpolated.
- the red star is the average vessel width across the whole vessel segment marked by observers.
- the green star is the average vessel width across the whole vessel segment measured by proposed method. The two boundaries are flipped and shown in one figure.
- the methods provided have high computational performance.
- vesselness map creation takes about 110 seconds, and this is an operation O'( n ), where n is the number of pixels.
- the image skeletonization and small region removal takes about 120 seconds, and this is also an operation O'( n ).
- the total number of centerline pixels is around 20000 pixels (or 0.0064 n ) and the total number of vessel segments is 160. Consequently the average length of the graph is around 125 pixels.
- the average size of the graph would be slice number x height of graph x length of graph, which is 45000 (or 0.0145 n ) in this case. It takes around 9 seconds to build all the graphs in the image.
- the method we used to solve the max-flow problem is a pseudoflow algorithm.
- the running time is O'( n 3 ) [23]. It takes about 41 seconds to solve all the graphs in the example image.
- the method and systems provided for retinal vessel boundary detection based on graph search have been validated it on a publicly available dataset of expert annotated vessel widths.
- An advantage is in the detection of both boundaries simultaneously, and is therefore more robust than methods which detect the boundaries one at a time.
- the simultaneous detection of both borders makes the accurate detection possible even if one boundary is of low contrast or blurred.
- the method is robust as the only algorithmic parameter is ⁇ in the cost function, and the final measurement is insensitive to the choice of ⁇ .
- the methods and systems can comprise a computer 1501 as illustrated in FIG. 15 and described below.
- FIG. 15 is a block diagram illustrating an exemplary operating environment for performing the disclosed methods.
- This exemplary operating environment is only an example of an operating environment and is not intended to suggest any limitation as to the scope of use or functionality of operating environment architecture. Neither should the operating environment be interpreted as having any dependency or requirement relating to any one or combination of components illustrated in the exemplary operating environment.
- the present methods and systems can be operational with numerous other general purpose or special purpose computing system environments or configurations.
- Examples of well known computing systems, environments, and/or configurations that can be suitable for use with the systems and methods comprise, but are not limited to, personal computers, server computers, laptop devices, and multiprocessor systems. Additional examples comprise set top boxes, programmable consumer electronics, network PCs, minicomputers, mainframe computers, distributed computing environments that comprise any of the above systems or devices, and the like.
- the processing of the disclosed methods and systems can be performed by software components.
- the disclosed systems and methods can be described in the general context of computer-executable instructions, such as program modules, being executed by one or more computers or other devices.
- program modules comprise computer code, routines, programs, objects, components, data structures, etc. that perform particular tasks or implement particular abstract data types.
- the disclosed methods can also be practiced in grid-based and distributed computing environments where tasks are performed by remote processing devices that are linked through a communications network.
- program modules can be located in both local and remote computer storage media including memory storage devices.
- the components of the computer 1501 can comprise, but are not limited to, one or more processors or processing units 1503, a system memory 1512, and a system bus 1513 that couples various system components including the processor 1503 to the system memory 1512. In the case of multiple processing units 1503, the system can utilize parallel computing.
- the system bus 1513 represents one or more of several possible types of bus structures, including a memory bus or memory controller, a peripheral bus, an accelerated graphics port, and a processor or local bus using any of a variety of bus architectures.
- bus architectures can comprise an Industry Standard Architecture (ISA) bus, a Micro Channel Architecture (MCA) bus, an Enhanced ISA (EISA) bus, a Video Electronics Standards Association (VESA) local bus, an Accelerated Graphics Port (AGP) bus, and a Peripheral Component Interconnects (PCI), a PCI-Express bus, a Personal Computer Memory Card Industry Association (PCMCIA), Universal Serial Bus (USB) and the like.
- ISA Industry Standard Architecture
- MCA Micro Channel Architecture
- EISA Enhanced ISA
- VESA Video Electronics Standards Association
- AGP Accelerated Graphics Port
- PCI Peripheral Component Interconnects
- PCI-Express PCI-Express
- PCMCIA Personal Computer Memory Card Industry Association
- USB Universal Serial Bus
- the bus 1513, and all buses specified in this description can also be implemented over a wired or wireless network connection and each of the subsystems, including the processor 1503, a mass storage device 1504, an operating system 1505, image analysis software 1506, image analysis data 1507, a network adapter 1508, system memory 1512, an Input/Output Interface 1510, a display adapter 1509, a display device 1511, and a human machine interface 1502, can be contained within one or more remote computing devices 1514a,b,c at physically separate locations, connected through buses of this form, in effect implementing a fully distributed system.
- the computer 1501 typically comprises a variety of computer readable media. Exemplary readable media can be any available media that is accessible by the computer 1501 and comprises, for example and not meant to be limiting, both volatile and non-volatile media, removable and non-removable media.
- the system memory 1512 comprises computer readable media in the form of volatile memory, such as random access memory (RAM), and/or non-volatile memory, such as read only memory (ROM).
- the system memory 1512 typically contains data such as image analysis data 1507 and/or program modules such as operating system 1505 and image analysis software 1506 that are immediately accessible to and/or are presently operated on by the processing unit 1503.
- the computer 1501 can also comprise other removable/non-removable, volatile/non-volatile computer storage media.
- FIG. 15 illustrates a mass storage device 1504 which can provide non-volatile storage of computer code, computer readable instructions, data structures, program modules, and other data for the computer 1501.
- a mass storage device 1504 can be a hard disk, a removable magnetic disk, a removable optical disk, magnetic cassettes or other magnetic storage devices, flash memory cards, CD-ROM, digital versatile disks (DVD) or other optical storage, random access memories (RAM), read only memories (ROM), electrically erasable programmable read-only memory (EEPROM), and the like.
- any number of program modules can be stored on the mass storage device 1504, including by way of example, an operating system 1505 and image analysis software 1506.
- Each of the operating system 1505 and image analysis software 1506 (or some combination thereof) can comprise elements of the programming and the image analysis software 1506.
- Image analysis data 1507 can also be stored on the mass storage device 1504.
- Image analysis data 1507 can be stored in any of one or more databases known in the art. Examples of such databases comprise, DB2®, Microsoft® Access, Microsoft® SQL Server, Oracle®, mySQL, PostgreSQL, and the like. The databases can be centralized or distributed across multiple systems.
- the user can enter commands and information into the computer 1501 via an input device (not shown).
- input devices comprise, but are not limited to, a keyboard, pointing device (e .g., a "mouse"), a microphone, a joystick, a scanner, tactile input devices such as gloves, and other body coverings, and the like
- a human machine interface 1502 that is coupled to the system bus 1513, but can be connected by other interface and bus structures, such as a parallel port, game port, an IEEE 1394 Port (also known as a Firewire port), a serial port, or a universal serial bus (USB).
- a display device 1511 can also be connected to the system bus 1513 via an interface, such as a display adapter 1509. It is contemplated that the computer 1501 can have more than one display adapter 1509 and the computer 1501 can have more than one display device 1511.
- a display device can be a monitor, an LCD (Liquid Crystal Display), or a projector.
- other output peripheral devices can comprise components such as speakers (not shown) and a printer (not shown) which can be connected to the computer 1501 via Input/Output Interface 1510. Any step and/or result of the methods can be output in any form to an output device.
- Such output can be any form of visual representation, including, but not limited to, textual, graphical, animation, audio, tactile, and the like.
- the computer 1501 can operate in a networked environment using logical connections to one or more remote computing devices 1514a,b,c.
- a remote computing device can be a personal computer, portable computer, a server, a router, a network computer, a peer device or other common network node, and so on.
- Logical connections between the computer 1501 and a remote computing device 1514a,b,c can be made via a local area network (LAN) and a general wide area network (WAN).
- LAN local area network
- WAN general wide area network
- a network adapter 1508 can be implemented in both wired and wireless environments. Such networking environments are conventional and commonplace in offices, enterprise-wide computer networks, intranets, and the Internet. Any type of network 1515 can be used.
- image analysis software 1506 can be stored on or transmitted across some form of computer readable media. Any of the disclosed methods can be performed by computer readable instructions embodied on computer readable media.
- Computer readable media can be any available media that can be accessed by a computer.
- Computer readable media can comprise “computer storage media” and “communications media.”
- “Computer storage media” comprise volatile and non-volatile, removable and non-removable media implemented in any methods or technology for storage of information such as computer readable instructions, data structures, program modules, or other data.
- Exemplary computer storage media comprises, but is not limited to, RAM, ROM, EEPROM, flash memory or other memory technology, CD-ROM, digital versatile disks (DVD) or other optical storage, magnetic cassettes, magnetic tape, magnetic disk storage or other magnetic storage devices, or any other medium which can be used to store the desired information and which can be accessed by a computer.
Landscapes
- Life Sciences & Earth Sciences (AREA)
- Health & Medical Sciences (AREA)
- Medical Informatics (AREA)
- Molecular Biology (AREA)
- Ophthalmology & Optometry (AREA)
- Engineering & Computer Science (AREA)
- Biomedical Technology (AREA)
- Heart & Thoracic Surgery (AREA)
- Physics & Mathematics (AREA)
- Biophysics (AREA)
- Surgery (AREA)
- Animal Behavior & Ethology (AREA)
- General Health & Medical Sciences (AREA)
- Public Health (AREA)
- Veterinary Medicine (AREA)
- Image Analysis (AREA)
- Eye Examination Apparatus (AREA)
- Image Processing (AREA)
Claims (18)
- Un procédé de détermination automatique d'un rapport artérioveineux (AVR) dans des tissus, comprenant :la réception, par un dispositif informatique, d'une image,la détection, par le dispositif informatique, d'une région d'intérêt dans l'image,l'identification d'artères et de veines dans la région d'intérêt par l'exécution d'une segmentation de vaisseau sur l'image au moyen d'un classificateur entraîné de façon à classer des pixels de vaisseau ou des segments de vaisseau dans l'image en tant que pixels de vaisseau ou segments de vaisseau artériels ou veineux, où le classificateur est entraîné en fonction d'un ensemble d'images d'entraînement et n'utilise pas plus de 27 vecteurs de caractéristique qui comprennent un ou plusieurs éléments parmi des dérivés, des propriétés de couleur et de texture lors de l'identification d'artères et de veines,la détermination, par le dispositif informatique, de mesures de largeur de vaisseau pour les artères et veines identifiées, etl'estimation, par le dispositif informatique, d'un rapport artérioveineux (AVR) à partir des mesures de largeur de vaisseau.
- Le procédé selon la Revendication 1, où la détection d'une région d'intérêt dans l'image comprend en outre la détection d'un disque optique dans l'image.
- Le procédé selon la Revendication 1, où une analyse d'arbre vasculaire est utilisée de façon à classer des pixels de vaisseau ou des segments de vaisseau.
- Le procédé selon la Revendication 1, où un débit sanguin est utilisé de façon à classer des pixels ou des segments de vaisseau.
- Le procédé selon la Revendication 1, où une propension plus élevée à la maladie est indiquée par un AVR réduit.
- Le procédé selon la Revendication 1, où l'image est une ou plusieurs images parmi : une image en couleurs, une image multispectrale, une image de tomographie par cohérence optique.
- Le procédé selon la Revendication 1, où l'image est une image de la rétine, de l'iris, de la peau, de la surface cérébrale ou de tout tissu avec des vaisseaux sanguins visibles imagés au moyen de deux procédés d'imagerie en longueur d'onde différents quelconques.
- Le procédé selon la Revendication 1, où la détermination de mesures de largeur de vaisseau pour les artères et veines identifiées comprend l'utilisation d'une ou de plusieurs opérations parmi : une recherche dans un graphe, un procédé de segmentation en toboggan basé sur une caractéristique de pixel à échelles multiples et des splats, et un ajustement de profil.
- Le procédé selon la Revendication 8, où la détermination de mesures de vaisseau comprend une recherche dans un graphe et où la recherche dans un graphe utilise une fonction de coût à échelles multiples.
- Le procédé selon la Revendication 9, où le fonction de coût à échelles multiples est dérivée d'un lifting de noyau en ondelettes.
- Un système de détermination automatique d'un rapport artérioveineux (AVR), comprenant :une mémoire, etun processeur, couplé à la mémoire, où le processeur est configuré pour l'exécution d'opérations comprenant :la réception d'une image,la détection d'une région d'intérêt dans l'image,l'utilisation d'un classificateur entraîné de façon à classer des pixels dans l'image en tant que pixels d'artères ou de veines, où le classificateur entraîné est entraîné en fonction d'un ensemble d'images d'entraînement et n'utilise pas plus de 27 vecteurs de caractéristique qui comprennent un ou plusieurs éléments parmi des dérivés, des propriétés de couleur et de texture lors de l'identification d'artères et de veines,l'identification d'artères et de veines dans la région d'intérêt en fonction des pixels classés,la détermination de mesures de largeur de vaisseau pour les artères et veines identifiées, etl'estimation, à partir des mesures de largeur de vaisseau, d'un rapport artérioveineux (AVR).
- Le système selon la Revendication 11, où un AVR réduit indique une propension plus élevée à une maladie.
- Le système selon la Revendication 11, où l'image est une image de la rétine, de l'iris, de la peau, de la surface cérébrale ou de tout tissu avec des vaisseaux sanguins visibles imagés au moyen de deux procédés d'imagerie en longueur d'onde différents quelconques.
- Le système selon la Revendication 11, où la détermination de mesures de largeur de vaisseau pour les artères et veines identifiées comprend l'utilisation d'une ou de plusieurs éléments parmi : une recherche dans un graphe, un procédé de segmentation en toboggan basé sur une caractéristique de pixel à échelles multiples et des splats.
- Le système selon la Revendication 14, où la détermination d'une largeur de vaisseau comprend une recherche dans un graphe et où la recherche dans un graphe utilise une fonction de coût à échelles multiples.
- Le système selon la Revendication 15, où la fonction de coût à échelles multiples est dérivée d'un lifting de noyau en ondelettes comprenant filtre de Gabor, dérivée gaussienne ou différence de noyaux gaussiens.
- Un support lisible par ordinateur possédant des instructions exécutables par ordinateur incorporées sur celui-ci destinées à la détermination automatique d'un rapport artérioveineux (AVR), les instructions exécutables par ordinateur comprenant :une mémoire, etun processeur, couplé à la mémoire, où le processeur est configuré pour l'exécution d'opérations comprenant :la réception d'une image,la détection d'une région d'intérêt dans l'image,l'utilisation d'un classificateur entraîné de façon à classer des pixels dans l'image en tant que pixels d'artère ou de veine, où le classificateur entraîné est entraîné en fonction d'un ensemble d'images d'entraînement et n'utilise pas plus de 27 vecteurs de caractéristique qui comprennent un ou plusieurs éléments parmi des dérivés, des propriétés de couleur et de texture lors de l'identification d'artères et de veines,l'identification d'artères et de veines dans la région d'intérêt,la détermination de mesures de largeur de vaisseau pour les artères et veines identifiées, etl'estimation d'un rapport artérioveineux (AVR) à partir des mesures de largeur de vaisseau.
- Le support lisible par ordinateur selon la Revendication 17, où la détermination de mesures de largeur de vaisseau pour les artères et veines identifiées comprend l'utilisation d'un ou de plusieurs éléments parmi : une recherche dans un graphe, un procédé de segmentation en toboggan basé sur une caractéristique de pixel à échelles multiples et des splats.
Applications Claiming Priority (2)
| Application Number | Priority Date | Filing Date | Title |
|---|---|---|---|
| US201161434551P | 2011-01-20 | 2011-01-20 | |
| PCT/US2012/022111 WO2012100221A1 (fr) | 2011-01-20 | 2012-01-20 | Détermination automatisée de rapport artérioveineux dans des images de vaisseaux sanguins |
Publications (3)
| Publication Number | Publication Date |
|---|---|
| EP2665406A1 EP2665406A1 (fr) | 2013-11-27 |
| EP2665406A4 EP2665406A4 (fr) | 2016-04-13 |
| EP2665406B1 true EP2665406B1 (fr) | 2021-03-10 |
Family
ID=46516132
Family Applications (1)
| Application Number | Title | Priority Date | Filing Date |
|---|---|---|---|
| EP12736290.3A Active EP2665406B1 (fr) | 2011-01-20 | 2012-01-20 | Détermination automatisée de rapport artérioveineux dans des images de vaisseaux sanguins |
Country Status (6)
| Country | Link |
|---|---|
| US (5) | US9924867B2 (fr) |
| EP (1) | EP2665406B1 (fr) |
| JP (1) | JP6005663B2 (fr) |
| AU (2) | AU2012207076A1 (fr) |
| CA (1) | CA2825169A1 (fr) |
| WO (1) | WO2012100221A1 (fr) |
Families Citing this family (55)
| Publication number | Priority date | Publication date | Assignee | Title |
|---|---|---|---|---|
| WO2012078636A1 (fr) | 2010-12-07 | 2012-06-14 | University Of Iowa Research Foundation | Séparation optimale et conviviale d'arrière-plan d'objet |
| US12367578B2 (en) | 2010-12-07 | 2025-07-22 | University Of Iowa Research Foundation | Diagnosis of a disease condition using an automated diagnostic model |
| EP2665406B1 (fr) * | 2011-01-20 | 2021-03-10 | University of Iowa Research Foundation | Détermination automatisée de rapport artérioveineux dans des images de vaisseaux sanguins |
| US8848996B2 (en) * | 2012-02-17 | 2014-09-30 | Siemens Medical Solutions Usa, Inc. | System for suppressing vascular structure in medical images |
| US9545196B2 (en) | 2012-05-04 | 2017-01-17 | University Of Iowa Research Foundation | Automated assessment of glaucoma loss from optical coherence tomography |
| US9861311B2 (en) * | 2012-08-03 | 2018-01-09 | Zoll Medical Corporation | Arterial and venous blood metrics |
| WO2014037013A1 (fr) * | 2012-09-07 | 2014-03-13 | Region Nordjylland, Aalborg Sygehus | Système de détection de structures de vaisseau sanguin dans des images médicales |
| GB201302887D0 (en) * | 2013-02-19 | 2013-04-03 | Optos Plc | Improvements in or relating to image processing |
| WO2014143891A1 (fr) | 2013-03-15 | 2014-09-18 | University Of Iowa Research Foundation | Séparation automatisée d'arbres binaires se chevauchant |
| JP6215555B2 (ja) * | 2013-03-29 | 2017-10-18 | 株式会社ニデック | 眼底画像処理装置および眼底画像処理プログラム |
| EP4057215A1 (fr) | 2013-10-22 | 2022-09-14 | Eyenuk, Inc. | Systèmes et procédés d'analyse automatisée d'images rétiniennes |
| WO2015130663A1 (fr) * | 2014-02-25 | 2015-09-03 | Oregon Health & Science University | Détection de glaucome par tomographie en cohérence optique sur la base d'une hauteur de relief de vaisseau rétinien |
| US10410355B2 (en) | 2014-03-21 | 2019-09-10 | U.S. Department Of Veterans Affairs | Methods and systems for image analysis using non-euclidean deformed graphs |
| CN106415660A (zh) * | 2014-04-07 | 2017-02-15 | Mimo股份公司 | 用于分析表示生物组织的三维体积的图像数据的方法 |
| JP6469387B2 (ja) * | 2014-08-26 | 2019-02-13 | 株式会社トプコン | 眼底解析装置 |
| EP3245632B1 (fr) * | 2015-01-16 | 2020-07-15 | Koninklijke Philips N.V. | Segmentation de la lumière d'un vaisseau par infra-résolution |
| CN107427210B (zh) * | 2015-01-19 | 2020-11-24 | 斯塔图马努艾克普有限公司 | 用于颅内压的无创评估的方法和设备 |
| US10115194B2 (en) | 2015-04-06 | 2018-10-30 | IDx, LLC | Systems and methods for feature detection in retinal images |
| JP6490501B2 (ja) * | 2015-06-09 | 2019-03-27 | 株式会社トプコン | 眼科検査システム |
| US10492682B2 (en) | 2015-10-21 | 2019-12-03 | Nidek Co., Ltd. | Ophthalmic analysis device and ophthalmic analysis program |
| JP6922151B2 (ja) * | 2015-10-21 | 2021-08-18 | 株式会社ニデック | 眼科解析装置、眼科解析プログラム |
| DE102015220768A1 (de) * | 2015-10-23 | 2017-04-27 | Siemens Healthcare Gmbh | Verfahren, Vorrichtung und Computerprogramm zur visuellen Unterstützung eines Behandlers bei der Behandlung eines Zielgebietes eines Patienten |
| JP6753052B2 (ja) * | 2015-11-02 | 2020-09-09 | 株式会社ニデック | Octデータ処理装置、およびoctデータ処理プログラム |
| US10102633B2 (en) * | 2015-11-30 | 2018-10-16 | Hyland Switzerland Sarl | System and methods of segmenting vessels from medical imaging data |
| US20180012359A1 (en) * | 2016-07-06 | 2018-01-11 | Marinko Venci Sarunic | Systems and Methods for Automated Image Classification and Segmentation |
| EP3270355B1 (fr) * | 2017-01-27 | 2019-07-31 | Siemens Healthcare GmbH | Détermination d'une valeur de complexité d'une sténose ou d'une section d'un vaisseau |
| US10307050B2 (en) | 2017-04-11 | 2019-06-04 | International Business Machines Corporation | Early prediction of hypertensive retinopathy |
| WO2018237218A1 (fr) | 2017-06-23 | 2018-12-27 | The Procter & Gamble Company | Composition et procédé permettant d'améliorer l'aspect de la peau |
| WO2019013779A1 (fr) * | 2017-07-12 | 2019-01-17 | Mohammed Alauddin Bhuiyan | Détection et quantification automatisées de caractéristiques de vaisseaux sanguins pour classement d'image rétinienne et dépistage de maladies |
| US11373450B2 (en) * | 2017-08-11 | 2022-06-28 | Tectus Corporation | Eye-mounted authentication system |
| JP6734475B2 (ja) * | 2017-10-10 | 2020-08-05 | 国立大学法人 東京大学 | 画像処理装置及びプログラム |
| CN107657612A (zh) * | 2017-10-16 | 2018-02-02 | 西安交通大学 | 适用于智能便携设备的全自动视网膜血管分析方法及系统 |
| US11523736B2 (en) | 2017-11-16 | 2022-12-13 | Victor X. D. YANG | Systems and methods for performing gabor optical coherence tomographic angiography |
| JP7140512B2 (ja) * | 2018-03-05 | 2022-09-21 | キヤノン株式会社 | 画像処理装置、画像処理方法及びプログラム |
| JP2019208851A (ja) * | 2018-06-04 | 2019-12-12 | 株式会社ニデック | 眼底画像処理装置および眼底画像処理プログラム |
| JP2018198968A (ja) * | 2018-08-27 | 2018-12-20 | 株式会社トプコン | 眼底解析装置 |
| EP3719808B1 (fr) | 2019-04-04 | 2024-09-11 | Optos plc | Détermination de niveaux d'hypertension à partir d'images vasculaires rétiniennes |
| WO2020236729A1 (fr) * | 2019-05-17 | 2020-11-26 | Voxeleron, LLC | Segmentation basée sur l'apprentissage profond d'images de fibres nerveuses cornéennes |
| CN110477852B (zh) * | 2019-08-02 | 2024-06-18 | 佛山科学技术学院 | 一种虹膜血管成像系统 |
| KR102818965B1 (ko) * | 2019-08-23 | 2025-06-11 | 삼성에스디에스 주식회사 | 심혈관 질환 위험 인자 예측 장치 및 방법 |
| CN111000563B (zh) * | 2019-11-22 | 2020-12-11 | 北京理工大学 | 一种视网膜动脉静脉直径比自动测量方法及装置 |
| JPWO2021106967A1 (fr) * | 2019-11-29 | 2021-06-03 | ||
| US11386298B2 (en) * | 2020-01-09 | 2022-07-12 | International Business Machines Corporation | Uncertainty guided semi-supervised neural network training for image classification |
| CN111681211B (zh) * | 2020-05-18 | 2024-03-08 | 东软医疗系统股份有限公司 | 一种血管图像处理方法及装置 |
| EP4167829A1 (fr) * | 2020-06-17 | 2023-04-26 | Statumanu ICP ApS | Procédé et système d'évaluation non invasive d'une relation entre une pression intracrânienne et une pression intraoculaire |
| CN111681242B (zh) * | 2020-08-14 | 2020-11-17 | 北京至真互联网技术有限公司 | 视网膜血管动静脉区分方法和装置、设备 |
| CN113643354B (zh) * | 2020-09-04 | 2023-10-13 | 深圳硅基智能科技有限公司 | 基于增强分辨率的眼底图像的血管管径的测量装置 |
| US12086981B2 (en) * | 2021-01-04 | 2024-09-10 | Shenzhen Keya Medical Technology Corporation | Methods and systems for computer-assisted medical image analysis using sequential model |
| US12026886B2 (en) * | 2021-01-22 | 2024-07-02 | The General Hospital Corporation | Method and system for automatically estimating a hepatorenal index from ultrasound images |
| CN112884750B (zh) * | 2021-03-04 | 2022-03-25 | 湖州点彩智能科技有限公司 | 一种基于gpu的素色织物折痕提取方法 |
| JP7643899B2 (ja) * | 2021-03-19 | 2025-03-11 | 株式会社トプコン | グレード評価装置、眼科撮影装置、プログラム、記録媒体、およびグレード評価方法 |
| JP7662386B2 (ja) * | 2021-04-08 | 2025-04-15 | キヤノンメディカルシステムズ株式会社 | 医用画像診断装置、医用画像処理装置及び医用画像処理システム |
| CN115100178B (zh) * | 2022-07-15 | 2025-10-03 | 依未科技(北京)有限公司 | 一种眼底血管形态特征评估的方法、装置、介质和设备 |
| JP7833183B2 (ja) * | 2022-07-20 | 2026-03-19 | 大学共同利用機関法人情報・システム研究機構 | 画像処理装置、画像処理方法、画像処理プログラム及び記録媒体 |
| CN116758309B (zh) * | 2023-06-09 | 2024-02-27 | 强联智创(北京)科技有限公司 | 血管段分型方法、导引导管塑形方法、设备及存储介质 |
Family Cites Families (116)
| Publication number | Priority date | Publication date | Assignee | Title |
|---|---|---|---|---|
| JPS605663B2 (ja) | 1982-12-24 | 1985-02-13 | 三菱マテリアル株式会社 | タングステン基サ−メツト |
| US4998533A (en) | 1986-07-15 | 1991-03-12 | Winkelman James W | Apparatus and method for in vivo analysis of red and white blood cell indices |
| US5040225A (en) | 1987-12-07 | 1991-08-13 | Gdp, Inc. | Image analysis method |
| US4883061A (en) | 1988-02-29 | 1989-11-28 | The Board Of Trustees Of The University Of Illinois | Method and apparatus for measuring the thickness of eye components |
| US5233517A (en) | 1990-04-30 | 1993-08-03 | Jindra Lawrence F | Early glaucoma detection by Fourier transform analysis of digitized eye fundus images |
| JP3058680B2 (ja) | 1990-11-30 | 2000-07-04 | 株式会社トプコン | 眼底像処理装置 |
| US6198532B1 (en) | 1991-02-22 | 2001-03-06 | Applied Spectral Imaging Ltd. | Spectral bio-imaging of the eye |
| US5303709A (en) | 1991-12-16 | 1994-04-19 | Dreher Andreas W | Retinal eye disease diagnostic system |
| US5868134A (en) | 1993-09-21 | 1999-02-09 | Kabushiki Kaisha Topcon | Retinal disease analyzer |
| JP3407761B2 (ja) * | 1993-12-24 | 2003-05-19 | 株式会社トプコン | 眼底画像解析処理装置 |
| US6104828A (en) | 1994-03-24 | 2000-08-15 | Kabushiki Kaisha Topcon | Ophthalmologic image processor |
| US5857030A (en) | 1995-08-18 | 1999-01-05 | Eastman Kodak Company | Automated method and system for digital image processing of radiologic images utilizing artificial neural networks |
| AU737530B2 (en) | 1997-04-17 | 2001-08-23 | Avimo Group Limited | Ocular microcirculation examination and treatment apparatus |
| US5867251A (en) | 1997-05-02 | 1999-02-02 | The General Hospital Corp. | Scanning ophthalmoscope with spatial light modulators |
| US6041132A (en) | 1997-07-29 | 2000-03-21 | General Electric Company | Computed tomography inspection of composite ply structure |
| US6044181A (en) | 1997-08-01 | 2000-03-28 | Microsoft Corporation | Focal length estimation method and apparatus for construction of panoramic mosaic images |
| MY124160A (en) | 1997-12-05 | 2006-06-30 | Dynamic Digital Depth Res Pty | Improved image conversion and encoding techniques |
| US6996549B2 (en) | 1998-05-01 | 2006-02-07 | Health Discovery Corporation | Computer-aided image analysis |
| US6000799A (en) | 1998-05-01 | 1999-12-14 | Jozef F. Van De Velde | Maxwellian view and modulation control options for the scanning laser ophthalmoscope |
| US6276798B1 (en) | 1998-09-29 | 2001-08-21 | Applied Spectral Imaging, Ltd. | Spectral bio-imaging of the eye |
| US6674894B1 (en) | 1999-04-20 | 2004-01-06 | University Of Utah Research Foundation | Method and apparatus for enhancing an image using data optimization and segmentation |
| GB9909966D0 (en) | 1999-04-29 | 1999-06-30 | Torsana Diabetes Diagnostics A | Analysis of fundus images |
| US6714672B1 (en) | 1999-10-27 | 2004-03-30 | Canon Kabushiki Kaisha | Automated stereo fundus evaluation |
| US6567682B1 (en) | 1999-11-16 | 2003-05-20 | Carecord Technologies, Inc. | Apparatus and method for lesion feature identification and characterization |
| US7224357B2 (en) | 2000-05-03 | 2007-05-29 | University Of Southern California | Three-dimensional modeling based on photographic images |
| US7104958B2 (en) * | 2001-10-01 | 2006-09-12 | New Health Sciences, Inc. | Systems and methods for investigating intracranial pressure |
| US6453057B1 (en) | 2000-11-02 | 2002-09-17 | Retinal Technologies, L.L.C. | Method for generating a unique consistent signal pattern for identification of an individual |
| US6744933B2 (en) | 2001-01-18 | 2004-06-01 | Siemens Corporate Research, Inc. | Method for image alignment under non-uniform illumination variations |
| US6845260B2 (en) | 2001-07-18 | 2005-01-18 | Koninklijke Philips Electronics N.V. | Automatic vessel indentification for angiographic screening |
| US6728561B2 (en) | 2001-08-14 | 2004-04-27 | University Of Alabama In Huntsville | Multispectral image processing method, apparatus and computer program product for determining the blood oxygen saturation in a vessel |
| DE10151314A1 (de) | 2001-10-17 | 2003-04-30 | Zeiss Carl Jena Gmbh | Ophthalmologisches Untersuchungsgerät |
| JP3998464B2 (ja) | 2001-11-30 | 2007-10-24 | 三洋電機株式会社 | 映像付与装置 |
| US7206435B2 (en) | 2002-03-26 | 2007-04-17 | Honda Giken Kogyo Kabushiki Kaisha | Real-time eye detection and tracking under various light conditions |
| US7263214B2 (en) | 2002-05-15 | 2007-08-28 | Ge Medical Systems Global Technology Company Llc | Computer aided diagnosis from multiple energy images |
| US20040064057A1 (en) | 2002-07-31 | 2004-04-01 | Massachusetts Institute Of Technology | Measuring circulating blood volume through retinal vasculometry |
| US20040105074A1 (en) | 2002-08-02 | 2004-06-03 | Peter Soliz | Digital stereo image analyzer for automated analyses of human retinopathy |
| AU2002950873A0 (en) | 2002-08-20 | 2002-09-12 | Robert Sellars | A device for providing multi-directional movement |
| WO2004021050A2 (fr) | 2002-08-29 | 2004-03-11 | Kestrel Corporation | Imageur retinien hyperspectral |
| US6731782B2 (en) | 2002-10-02 | 2004-05-04 | Virtualscopics, Llc | Method and system for automatic identification and quantification of abnormal anatomical structures in medical images |
| US6830336B2 (en) | 2002-11-01 | 2004-12-14 | Inoveon Corporation | Automated generation of fundus images based on processing of acquired images |
| US8045770B2 (en) | 2003-03-24 | 2011-10-25 | Cornell Research Foundation, Inc. | System and method for three-dimensional image rendering and analysis |
| SG140445A1 (en) | 2003-07-28 | 2008-03-28 | Sony Corp | Method and apparatus for automatically recognizing audio data |
| US7409587B2 (en) | 2004-08-24 | 2008-08-05 | Symantec Operating Corporation | Recovering from storage transaction failures using checkpoints |
| GB2428325B (en) | 2003-10-09 | 2007-08-01 | Univ York | Image Recognition |
| WO2005069377A1 (fr) | 2004-01-19 | 2005-07-28 | Matsushita Electric Industrial Co., Ltd. | Dispositif de formation d'images a semi-conducteurs et son procede de fabrication |
| US20070165243A1 (en) | 2004-02-09 | 2007-07-19 | Cheol-Gwon Kang | Device for measuring 3d shape using irregular pattern and method for the same |
| US7620501B2 (en) | 2004-05-06 | 2009-11-17 | Siemens Medical Solutions Usa, Inc. | Artery-vein separation and vessel modeling |
| US7907769B2 (en) | 2004-05-13 | 2011-03-15 | The Charles Stark Draper Laboratory, Inc. | Image-based methods for measuring global nuclear patterns as epigenetic markers of cell differentiation |
| WO2005114557A2 (fr) | 2004-05-13 | 2005-12-01 | Proximex | Fusion de donnees multimodales de dimensions elevees pour classification et identification |
| US7316512B2 (en) | 2004-07-30 | 2008-01-08 | General Electric Company | Interconnect device |
| GB2418314A (en) | 2004-09-16 | 2006-03-22 | Sharp Kk | A system for combining multiple disparity maps |
| US7574028B2 (en) | 2004-11-23 | 2009-08-11 | Carestream Health, Inc. | Method for recognizing projection views of radiographs |
| US7301644B2 (en) | 2004-12-02 | 2007-11-27 | University Of Miami | Enhanced optical coherence tomography for anatomical mapping |
| US7372996B2 (en) | 2004-12-27 | 2008-05-13 | Trw Automotive U.S. Llc | Method and apparatus for determining the position of a vehicle seat |
| US7715597B2 (en) | 2004-12-29 | 2010-05-11 | Fotonation Ireland Limited | Method and component for image recognition |
| US7474775B2 (en) | 2005-03-31 | 2009-01-06 | University Of Iowa Research Foundation | Automatic detection of red lesions in digital color fundus photographs |
| US7232240B2 (en) | 2005-05-06 | 2007-06-19 | Northrop Grumann Corporation | Extended source laser illuminator |
| CA2610345C (fr) | 2005-06-02 | 2013-12-24 | The Medipattern Corporation | Systeme et procede de detection assistee par ordinateur |
| US7995810B2 (en) | 2005-06-24 | 2011-08-09 | The University Of Iowa Research Foundation | System and methods for image segmentation in n-dimensional space |
| US8098907B2 (en) | 2005-07-01 | 2012-01-17 | Siemens Corporation | Method and system for local adaptive detection of microaneurysms in digital fundus images |
| US7343032B2 (en) | 2005-09-01 | 2008-03-11 | Fujifilm Corporation | Method and apparatus for automatic and dynamic vessel detection |
| US7914451B2 (en) | 2005-09-15 | 2011-03-29 | Innervision Medical Technologies Inc. | Determining attributes using ultrasound |
| US8023739B2 (en) | 2005-09-27 | 2011-09-20 | Battelle Memorial Institute | Processes, data structures, and apparatuses for representing knowledge |
| US20070092864A1 (en) | 2005-09-30 | 2007-04-26 | The University Of Iowa Research Foundation | Treatment planning methods, devices and systems |
| JP4958254B2 (ja) * | 2005-09-30 | 2012-06-20 | 興和株式会社 | 画像解析システム、及び画像解析プログラム |
| US7524061B2 (en) * | 2005-10-12 | 2009-04-28 | Siemens Corporate Research, Inc. | System and method for robust optic disk detection in retinal images using vessel structure and radon transform |
| GB0522968D0 (en) | 2005-11-11 | 2005-12-21 | Popovich Milan M | Holographic illumination device |
| US8094928B2 (en) | 2005-11-14 | 2012-01-10 | Microsoft Corporation | Stereo video for gaming |
| KR100727033B1 (ko) | 2005-12-07 | 2007-06-12 | 한국전자통신연구원 | 네트워크 기반 지능형 서비스 로봇의 비전 처리 장치 및방법과 이를 이용한 시스템 |
| WO2007065221A1 (fr) | 2005-12-07 | 2007-06-14 | Commonwealth Scientific And Industrial Research Organisation | Procédé et appareil de détection de caractéristique linéaire |
| US8150155B2 (en) | 2006-02-07 | 2012-04-03 | Qualcomm Incorporated | Multi-mode region-of-interest video object segmentation |
| DE102006010105A1 (de) | 2006-02-28 | 2007-08-30 | Carl Zeiss Meditec Ag | Ophthalmologisches Gerät |
| WO2007118079A2 (fr) | 2006-04-03 | 2007-10-18 | University Of Iowa Research Foundation | procédés et systèmes pour une segmentation de papille optique |
| DE102006018445B4 (de) * | 2006-04-18 | 2008-04-24 | Imedos Gmbh | Vorrichtung und Verfahren zur Bestimmung arterio-venöser Verhältniswerte durch quantitative Analyse retinaler Gefäße |
| TW200741417A (en) | 2006-04-26 | 2007-11-01 | Aopen Inc | Computer chassis structure that allows to be unfolded into components in sheet shape for easy assembly |
| CN103778635B (zh) | 2006-05-11 | 2016-09-28 | 苹果公司 | 用于处理数据的方法和装置 |
| JP2008022929A (ja) * | 2006-07-19 | 2008-02-07 | Gifu Univ | 画像解析装置及び画像解析プログラム |
| RU2449365C2 (ru) * | 2006-08-11 | 2012-04-27 | Конинклейке Филипс Электроникс, Н.В. | Способы и устройство для интегрирования систематического прореживания данных в основанный на генетическом алгоритме выбор подмножества признаков |
| CN101626719B (zh) | 2006-09-26 | 2012-07-18 | 俄勒冈健康与科学大学 | 体内结构和流动成像 |
| CA2670214A1 (fr) | 2006-11-21 | 2008-05-29 | Mantisvision Ltd. | Modelisation geometrique en 3d et creation de contenu video en 3d |
| GB0708676D0 (en) | 2007-05-04 | 2007-06-13 | Imec Inter Uni Micro Electr | A Method for real-time/on-line performing of multi view multimedia applications |
| WO2008150840A1 (fr) | 2007-05-29 | 2008-12-11 | University Of Iowa Research Foundation | Procédés et systèmes de détermination des caractéristiques optimales permettant de classer des motifs ou des objets dans des images |
| ES2544585T3 (es) | 2007-06-15 | 2015-09-01 | University Of Southern California | Análisis de patrones de mapas retinales para el diagnóstico de enfermedades del nervio óptico por tomografía de coherencia óptica |
| US20100182406A1 (en) | 2007-07-12 | 2010-07-22 | Benitez Ana B | System and method for three-dimensional object reconstruction from two-dimensional images |
| US8090173B2 (en) | 2007-11-27 | 2012-01-03 | Siemens Medical Solutions Usa, Inc. | System and method for blood vessel bifurcation detection in thoracic CT scans |
| JP2009151896A (ja) | 2007-12-21 | 2009-07-09 | Sony Corp | 画像処理装置、動画再生装置、これらにおける処理方法およびプログラム |
| JP5492869B2 (ja) * | 2008-04-08 | 2014-05-14 | ナショナル ユニヴァーシティー オブ シンガポール | 網膜画像分析システム及び方法 |
| US8194936B2 (en) | 2008-04-25 | 2012-06-05 | University Of Iowa Research Foundation | Optimal registration of multiple deformed images using a physical model of the imaging distortion |
| JP5535905B2 (ja) * | 2008-06-04 | 2014-07-02 | 株式会社網膜情報診断研究所 | 網膜情報診断システム |
| US7941462B2 (en) | 2008-09-24 | 2011-05-10 | Toshiba Medical Visualization Systems Europe, Limited | Method and apparatus for classification of coronary artery image data |
| FR2937530B1 (fr) | 2008-10-24 | 2012-02-24 | Biospace Med | Mesure de grandeurs geometriques intrinseques a un systeme anatomique |
| WO2010048632A1 (fr) | 2008-10-24 | 2010-04-29 | Real D | Format d'image stéréoscopique avec informations de profondeurs |
| WO2010099289A1 (fr) | 2009-02-25 | 2010-09-02 | University Of Iowa Research Foundation | Ophtalmoscope laser hybride |
| CA2732647C (fr) | 2009-03-03 | 2014-04-29 | Fujifilm Corporation | Dispositif et procede de traitement d'image et programme |
| AU2009201637B2 (en) | 2009-04-24 | 2011-08-11 | Canon Kabushiki Kaisha | Processing multi-view digital images |
| US9028421B2 (en) * | 2009-05-13 | 2015-05-12 | Kyushu Institute Of Technology | Blood flow image diagnosing device |
| US9679389B2 (en) | 2009-05-19 | 2017-06-13 | Algotec Systems Ltd. | Method and system for blood vessel segmentation and classification |
| US8494243B2 (en) | 2009-07-29 | 2013-07-23 | Siemens Aktiengesellschaft | Deformable 2D-3D registration of structure |
| KR20110064197A (ko) | 2009-12-07 | 2011-06-15 | 삼성전자주식회사 | 물체 인식 시스템 및 그 물체 인식 방법 |
| US9082159B2 (en) | 2010-10-07 | 2015-07-14 | Siemens Aktiengesellschaft | Non-rigid composition of multiple overlapping medical imaging volumes |
| WO2012078636A1 (fr) | 2010-12-07 | 2012-06-14 | University Of Iowa Research Foundation | Séparation optimale et conviviale d'arrière-plan d'objet |
| US20150379708A1 (en) | 2010-12-07 | 2015-12-31 | University Of Iowa Research Foundation | Methods and systems for vessel bifurcation detection |
| JP6050246B2 (ja) * | 2010-12-22 | 2016-12-21 | コーニンクレッカ フィリップス エヌ ヴェKoninklijke Philips N.V. | 低コスト振動子を用いる自動ドップラ速度計測 |
| US20140035909A1 (en) | 2011-01-20 | 2014-02-06 | University Of Iowa Research Foundation | Systems and methods for generating a three-dimensional shape from stereo color images |
| EP2665406B1 (fr) * | 2011-01-20 | 2021-03-10 | University of Iowa Research Foundation | Détermination automatisée de rapport artérioveineux dans des images de vaisseaux sanguins |
| US8989514B2 (en) | 2011-02-03 | 2015-03-24 | Voxeleron Llc | Method and system for image analysis and interpretation |
| WO2012114600A1 (fr) | 2011-02-22 | 2012-08-30 | オリンパスメディカルシステムズ株式会社 | Dispositif de traitement d'image médicale et procédé de traitement d'image médicale |
| JP5263995B2 (ja) | 2011-03-18 | 2013-08-14 | 富士フイルム株式会社 | ネットワーク構築装置および方法ならびにプログラム |
| JP2012223338A (ja) | 2011-04-19 | 2012-11-15 | Fujifilm Corp | 木構造作成装置および方法ならびにプログラム |
| JP5701138B2 (ja) | 2011-04-19 | 2015-04-15 | 富士フイルム株式会社 | 医用画像処理装置および方法、並びにプログラム |
| JP5391229B2 (ja) | 2011-04-27 | 2014-01-15 | 富士フイルム株式会社 | 木構造抽出装置および方法ならびにプログラム |
| GB201201230D0 (en) | 2012-01-25 | 2012-03-07 | Univ Delft Tech | Adaptive multi-dimensional data decomposition |
| US9536338B2 (en) | 2012-07-31 | 2017-01-03 | Microsoft Technology Licensing, Llc | Animating objects using the human body |
| JP5833994B2 (ja) | 2012-09-20 | 2015-12-16 | 富士フイルム株式会社 | 画像処理装置および方法ならびにプログラム |
| US9307926B2 (en) | 2012-10-05 | 2016-04-12 | Volcano Corporation | Automatic stent detection |
| WO2014143891A1 (fr) | 2013-03-15 | 2014-09-18 | University Of Iowa Research Foundation | Séparation automatisée d'arbres binaires se chevauchant |
-
2012
- 2012-01-20 EP EP12736290.3A patent/EP2665406B1/fr active Active
- 2012-01-20 JP JP2013550644A patent/JP6005663B2/ja active Active
- 2012-01-20 CA CA2825169A patent/CA2825169A1/fr not_active Abandoned
- 2012-01-20 AU AU2012207076A patent/AU2012207076A1/en not_active Abandoned
- 2012-01-20 US US13/355,386 patent/US9924867B2/en active Active
- 2012-01-20 WO PCT/US2012/022111 patent/WO2012100221A1/fr not_active Ceased
-
2016
- 2016-08-03 AU AU2016210680A patent/AU2016210680B2/en active Active
-
2018
- 2018-03-26 US US15/936,162 patent/US11638522B2/en active Active
-
2023
- 2023-03-17 US US18/185,704 patent/US12035971B2/en active Active
-
2024
- 2024-06-05 US US18/734,253 patent/US12369793B2/en active Active
-
2025
- 2025-06-24 US US19/247,372 patent/US20250318726A1/en active Pending
Non-Patent Citations (1)
| Title |
|---|
| None * |
Also Published As
| Publication number | Publication date |
|---|---|
| US20240315554A1 (en) | 2024-09-26 |
| AU2012207076A1 (en) | 2013-08-15 |
| WO2012100221A1 (fr) | 2012-07-26 |
| US20230255478A1 (en) | 2023-08-17 |
| US11638522B2 (en) | 2023-05-02 |
| US20120236259A1 (en) | 2012-09-20 |
| US9924867B2 (en) | 2018-03-27 |
| JP6005663B2 (ja) | 2016-10-12 |
| AU2016210680A1 (en) | 2016-08-18 |
| JP2014504523A (ja) | 2014-02-24 |
| EP2665406A4 (fr) | 2016-04-13 |
| EP2665406A1 (fr) | 2013-11-27 |
| AU2016210680B2 (en) | 2019-06-13 |
| CA2825169A1 (fr) | 2012-07-26 |
| US20250318726A1 (en) | 2025-10-16 |
| US12035971B2 (en) | 2024-07-16 |
| US12369793B2 (en) | 2025-07-29 |
| US20190059718A1 (en) | 2019-02-28 |
Similar Documents
| Publication | Publication Date | Title |
|---|---|---|
| US12035971B2 (en) | Automated determination of arteriovenous ratio in images of blood vessels | |
| Niemeijer et al. | Automated measurement of the arteriolar-to-venular width ratio in digital color fundus photographs | |
| Fraz et al. | An ensemble classification-based approach applied to retinal blood vessel segmentation | |
| L Srinidhi et al. | Recent advancements in retinal vessel segmentation | |
| Zhao et al. | Saliency driven vasculature segmentation with infinite perimeter active contour model | |
| Yin et al. | Vessel extraction from non-fluorescein fundus images using orientation-aware detector | |
| Odstrcilik et al. | Retinal vessel segmentation by improved matched filtering: evaluation on a new high‐resolution fundus image database | |
| Fraz et al. | An approach to localize the retinal blood vessels using bit planes and centerline detection | |
| Nguyen et al. | An effective retinal blood vessel segmentation method using multi-scale line detection | |
| Yavuz et al. | Blood vessel extraction in color retinal fundus images with enhancement filtering and unsupervised classification | |
| Sidhu et al. | Segmentation of retinal blood vessels by a novel hybrid technique-Principal Component Analysis (PCA) and Contrast Limited Adaptive Histogram Equalization (CLAHE) | |
| US10573007B2 (en) | Image processing apparatus, image processing method, and image processing program | |
| Tavakoli et al. | Unsupervised automated retinal vessel segmentation based on Radon line detector and morphological reconstruction | |
| ter Haar Romeny et al. | Brain-inspired algorithms for retinal image analysis | |
| US20240296555A1 (en) | Machine learning classification of retinal atrophy in oct scans | |
| Li et al. | Retinal vessel detection and measurement for computer-aided medical diagnosis | |
| Chen et al. | Combination of enhanced depth imaging optical coherence tomography and fundus images for glaucoma screening | |
| Gunay et al. | Automated detection of adenoviral conjunctivitis disease from facial images using machine learning | |
| Giachetti et al. | Multiresolution localization and segmentation of the optical disc in fundus images using inpainted background and vessel information | |
| Zhou et al. | Segmentation of optic disc in retinal images using an improved gradient vector flow algorithm | |
| Oliveira et al. | Automatic features extraction from the optic cup and disc segmentation for glaucoma classification | |
| Fraz et al. | Retinal vessel segmentation using ensemble classifier of bagged decision trees | |
| Zhang et al. | A fully automated pipeline of extracting biomarkers to quantify vascular changes in retina-related diseases | |
| Ghadiri et al. | Retinal vessel tortuosity evaluation via Circular Hough Transform | |
| Esgario et al. | Beyond visual image: Automated diagnosis of pigmented skin lesions combining clinical image features with patient data |
Legal Events
| Date | Code | Title | Description |
|---|---|---|---|
| PUAI | Public reference made under article 153(3) epc to a published international application that has entered the european phase |
Free format text: ORIGINAL CODE: 0009012 |
|
| 17P | Request for examination filed |
Effective date: 20130725 |
|
| AK | Designated contracting states |
Kind code of ref document: A1 Designated state(s): AL AT BE BG CH CY CZ DE DK EE ES FI FR GB GR HR HU IE IS IT LI LT LU LV MC MK MT NL NO PL PT RO RS SE SI SK SM TR |
|
| DAX | Request for extension of the european patent (deleted) | ||
| RA4 | Supplementary search report drawn up and despatched (corrected) |
Effective date: 20160316 |
|
| RIC1 | Information provided on ipc code assigned before grant |
Ipc: A61B 3/12 20060101ALI20160310BHEP Ipc: A61B 3/14 20060101AFI20160310BHEP |
|
| STAA | Information on the status of an ep patent application or granted ep patent |
Free format text: STATUS: EXAMINATION IS IN PROGRESS |
|
| 17Q | First examination report despatched |
Effective date: 20171114 |
|
| GRAP | Despatch of communication of intention to grant a patent |
Free format text: ORIGINAL CODE: EPIDOSNIGR1 |
|
| STAA | Information on the status of an ep patent application or granted ep patent |
Free format text: STATUS: GRANT OF PATENT IS INTENDED |
|
| INTG | Intention to grant announced |
Effective date: 20200918 |
|
| GRAS | Grant fee paid |
Free format text: ORIGINAL CODE: EPIDOSNIGR3 |
|
| GRAA | (expected) grant |
Free format text: ORIGINAL CODE: 0009210 |
|
| STAA | Information on the status of an ep patent application or granted ep patent |
Free format text: STATUS: THE PATENT HAS BEEN GRANTED |
|
| AK | Designated contracting states |
Kind code of ref document: B1 Designated state(s): AL AT BE BG CH CY CZ DE DK EE ES FI FR GB GR HR HU IE IS IT LI LT LU LV MC MK MT NL NO PL PT RO RS SE SI SK SM TR |
|
| REG | Reference to a national code |
Ref country code: GB Ref legal event code: FG4D |
|
| REG | Reference to a national code |
Ref country code: AT Ref legal event code: REF Ref document number: 1368857 Country of ref document: AT Kind code of ref document: T Effective date: 20210315 Ref country code: CH Ref legal event code: EP |
|
| REG | Reference to a national code |
Ref country code: DE Ref legal event code: R096 Ref document number: 602012074716 Country of ref document: DE |
|
| REG | Reference to a national code |
Ref country code: IE Ref legal event code: FG4D |
|
| REG | Reference to a national code |
Ref country code: LT Ref legal event code: MG9D |
|
| PG25 | Lapsed in a contracting state [announced via postgrant information from national office to epo] |
Ref country code: FI Free format text: LAPSE BECAUSE OF FAILURE TO SUBMIT A TRANSLATION OF THE DESCRIPTION OR TO PAY THE FEE WITHIN THE PRESCRIBED TIME-LIMIT Effective date: 20210310 Ref country code: HR Free format text: LAPSE BECAUSE OF FAILURE TO SUBMIT A TRANSLATION OF THE DESCRIPTION OR TO PAY THE FEE WITHIN THE PRESCRIBED TIME-LIMIT Effective date: 20210310 Ref country code: GR Free format text: LAPSE BECAUSE OF FAILURE TO SUBMIT A TRANSLATION OF THE DESCRIPTION OR TO PAY THE FEE WITHIN THE PRESCRIBED TIME-LIMIT Effective date: 20210611 Ref country code: LT Free format text: LAPSE BECAUSE OF FAILURE TO SUBMIT A TRANSLATION OF THE DESCRIPTION OR TO PAY THE FEE WITHIN THE PRESCRIBED TIME-LIMIT Effective date: 20210310 Ref country code: BG Free format text: LAPSE BECAUSE OF FAILURE TO SUBMIT A TRANSLATION OF THE DESCRIPTION OR TO PAY THE FEE WITHIN THE PRESCRIBED TIME-LIMIT Effective date: 20210610 Ref country code: NO Free format text: LAPSE BECAUSE OF FAILURE TO SUBMIT A TRANSLATION OF THE DESCRIPTION OR TO PAY THE FEE WITHIN THE PRESCRIBED TIME-LIMIT Effective date: 20210610 |
|
| REG | Reference to a national code |
Ref country code: AT Ref legal event code: MK05 Ref document number: 1368857 Country of ref document: AT Kind code of ref document: T Effective date: 20210310 |
|
| REG | Reference to a national code |
Ref country code: NL Ref legal event code: MP Effective date: 20210310 |
|
| PG25 | Lapsed in a contracting state [announced via postgrant information from national office to epo] |
Ref country code: RS Free format text: LAPSE BECAUSE OF FAILURE TO SUBMIT A TRANSLATION OF THE DESCRIPTION OR TO PAY THE FEE WITHIN THE PRESCRIBED TIME-LIMIT Effective date: 20210310 Ref country code: LV Free format text: LAPSE BECAUSE OF FAILURE TO SUBMIT A TRANSLATION OF THE DESCRIPTION OR TO PAY THE FEE WITHIN THE PRESCRIBED TIME-LIMIT Effective date: 20210310 Ref country code: SE Free format text: LAPSE BECAUSE OF FAILURE TO SUBMIT A TRANSLATION OF THE DESCRIPTION OR TO PAY THE FEE WITHIN THE PRESCRIBED TIME-LIMIT Effective date: 20210310 |
|
| PG25 | Lapsed in a contracting state [announced via postgrant information from national office to epo] |
Ref country code: NL Free format text: LAPSE BECAUSE OF FAILURE TO SUBMIT A TRANSLATION OF THE DESCRIPTION OR TO PAY THE FEE WITHIN THE PRESCRIBED TIME-LIMIT Effective date: 20210310 |
|
| PG25 | Lapsed in a contracting state [announced via postgrant information from national office to epo] |
Ref country code: SM Free format text: LAPSE BECAUSE OF FAILURE TO SUBMIT A TRANSLATION OF THE DESCRIPTION OR TO PAY THE FEE WITHIN THE PRESCRIBED TIME-LIMIT Effective date: 20210310 Ref country code: AT Free format text: LAPSE BECAUSE OF FAILURE TO SUBMIT A TRANSLATION OF THE DESCRIPTION OR TO PAY THE FEE WITHIN THE PRESCRIBED TIME-LIMIT Effective date: 20210310 Ref country code: EE Free format text: LAPSE BECAUSE OF FAILURE TO SUBMIT A TRANSLATION OF THE DESCRIPTION OR TO PAY THE FEE WITHIN THE PRESCRIBED TIME-LIMIT Effective date: 20210310 Ref country code: CZ Free format text: LAPSE BECAUSE OF FAILURE TO SUBMIT A TRANSLATION OF THE DESCRIPTION OR TO PAY THE FEE WITHIN THE PRESCRIBED TIME-LIMIT Effective date: 20210310 |
|
| PG25 | Lapsed in a contracting state [announced via postgrant information from national office to epo] |
Ref country code: RO Free format text: LAPSE BECAUSE OF FAILURE TO SUBMIT A TRANSLATION OF THE DESCRIPTION OR TO PAY THE FEE WITHIN THE PRESCRIBED TIME-LIMIT Effective date: 20210310 Ref country code: IS Free format text: LAPSE BECAUSE OF FAILURE TO SUBMIT A TRANSLATION OF THE DESCRIPTION OR TO PAY THE FEE WITHIN THE PRESCRIBED TIME-LIMIT Effective date: 20210710 Ref country code: SK Free format text: LAPSE BECAUSE OF FAILURE TO SUBMIT A TRANSLATION OF THE DESCRIPTION OR TO PAY THE FEE WITHIN THE PRESCRIBED TIME-LIMIT Effective date: 20210310 Ref country code: PL Free format text: LAPSE BECAUSE OF FAILURE TO SUBMIT A TRANSLATION OF THE DESCRIPTION OR TO PAY THE FEE WITHIN THE PRESCRIBED TIME-LIMIT Effective date: 20210310 Ref country code: PT Free format text: LAPSE BECAUSE OF FAILURE TO SUBMIT A TRANSLATION OF THE DESCRIPTION OR TO PAY THE FEE WITHIN THE PRESCRIBED TIME-LIMIT Effective date: 20210712 Ref country code: ES Free format text: LAPSE BECAUSE OF FAILURE TO SUBMIT A TRANSLATION OF THE DESCRIPTION OR TO PAY THE FEE WITHIN THE PRESCRIBED TIME-LIMIT Effective date: 20210310 |
|
| REG | Reference to a national code |
Ref country code: DE Ref legal event code: R097 Ref document number: 602012074716 Country of ref document: DE |
|
| PLBE | No opposition filed within time limit |
Free format text: ORIGINAL CODE: 0009261 |
|
| STAA | Information on the status of an ep patent application or granted ep patent |
Free format text: STATUS: NO OPPOSITION FILED WITHIN TIME LIMIT |
|
| REG | Reference to a national code |
Ref country code: DE Ref legal event code: R081 Ref document number: 602012074716 Country of ref document: DE Owner name: UNIVERSITY OF IOWA RESEARCH FOUNDATION, IOWA C, US Free format text: FORMER OWNER: UNIVERSITY OF IOWA RESEARCH FOUNDATION, IOWA CITY, IA., US Ref country code: DE Ref legal event code: R081 Ref document number: 602012074716 Country of ref document: DE Owner name: UNITED STATES GOVERNMENT AS REPRESENTED BY THE, US Free format text: FORMER OWNER: UNIVERSITY OF IOWA RESEARCH FOUNDATION, IOWA CITY, IA., US |
|
| PG25 | Lapsed in a contracting state [announced via postgrant information from national office to epo] |
Ref country code: AL Free format text: LAPSE BECAUSE OF FAILURE TO SUBMIT A TRANSLATION OF THE DESCRIPTION OR TO PAY THE FEE WITHIN THE PRESCRIBED TIME-LIMIT Effective date: 20210310 Ref country code: DK Free format text: LAPSE BECAUSE OF FAILURE TO SUBMIT A TRANSLATION OF THE DESCRIPTION OR TO PAY THE FEE WITHIN THE PRESCRIBED TIME-LIMIT Effective date: 20210310 |
|
| REG | Reference to a national code |
Ref country code: GB Ref legal event code: S117 Free format text: REQUEST FILED; REQUEST FOR CORRECTION UNDER SECTION 117 FILED ON 07 JANUARY 2022 |
|
| 26N | No opposition filed |
Effective date: 20211213 |
|
| PG25 | Lapsed in a contracting state [announced via postgrant information from national office to epo] |
Ref country code: SI Free format text: LAPSE BECAUSE OF FAILURE TO SUBMIT A TRANSLATION OF THE DESCRIPTION OR TO PAY THE FEE WITHIN THE PRESCRIBED TIME-LIMIT Effective date: 20210310 |
|
| PG25 | Lapsed in a contracting state [announced via postgrant information from national office to epo] |
Ref country code: IT Free format text: LAPSE BECAUSE OF FAILURE TO SUBMIT A TRANSLATION OF THE DESCRIPTION OR TO PAY THE FEE WITHIN THE PRESCRIBED TIME-LIMIT Effective date: 20210310 |
|
| PG25 | Lapsed in a contracting state [announced via postgrant information from national office to epo] |
Ref country code: IS Free format text: LAPSE BECAUSE OF FAILURE TO SUBMIT A TRANSLATION OF THE DESCRIPTION OR TO PAY THE FEE WITHIN THE PRESCRIBED TIME-LIMIT Effective date: 20210710 |
|
| PG25 | Lapsed in a contracting state [announced via postgrant information from national office to epo] |
Ref country code: MC Free format text: LAPSE BECAUSE OF FAILURE TO SUBMIT A TRANSLATION OF THE DESCRIPTION OR TO PAY THE FEE WITHIN THE PRESCRIBED TIME-LIMIT Effective date: 20210310 |
|
| REG | Reference to a national code |
Ref country code: CH Ref legal event code: PL |
|
| REG | Reference to a national code |
Ref country code: BE Ref legal event code: MM Effective date: 20220131 |
|
| PG25 | Lapsed in a contracting state [announced via postgrant information from national office to epo] |
Ref country code: LU Free format text: LAPSE BECAUSE OF NON-PAYMENT OF DUE FEES Effective date: 20220120 |
|
| PG25 | Lapsed in a contracting state [announced via postgrant information from national office to epo] |
Ref country code: FR Free format text: LAPSE BECAUSE OF NON-PAYMENT OF DUE FEES Effective date: 20220131 Ref country code: BE Free format text: LAPSE BECAUSE OF NON-PAYMENT OF DUE FEES Effective date: 20220131 |
|
| PG25 | Lapsed in a contracting state [announced via postgrant information from national office to epo] |
Ref country code: LI Free format text: LAPSE BECAUSE OF NON-PAYMENT OF DUE FEES Effective date: 20220131 Ref country code: CH Free format text: LAPSE BECAUSE OF NON-PAYMENT OF DUE FEES Effective date: 20220131 |
|
| REG | Reference to a national code |
Ref country code: GB Ref legal event code: S117 Free format text: REQUEST FOR CORRECTION UNDER SECTION 117 FILED ON 7 JANUARY 2022 WAS NOT PROCEEDED WITH ON 14 DECEMBER 2022 |
|
| PG25 | Lapsed in a contracting state [announced via postgrant information from national office to epo] |
Ref country code: IE Free format text: LAPSE BECAUSE OF NON-PAYMENT OF DUE FEES Effective date: 20220120 |
|
| PG25 | Lapsed in a contracting state [announced via postgrant information from national office to epo] |
Ref country code: HU Free format text: LAPSE BECAUSE OF FAILURE TO SUBMIT A TRANSLATION OF THE DESCRIPTION OR TO PAY THE FEE WITHIN THE PRESCRIBED TIME-LIMIT; INVALID AB INITIO Effective date: 20120120 |
|
| PG25 | Lapsed in a contracting state [announced via postgrant information from national office to epo] |
Ref country code: MK Free format text: LAPSE BECAUSE OF FAILURE TO SUBMIT A TRANSLATION OF THE DESCRIPTION OR TO PAY THE FEE WITHIN THE PRESCRIBED TIME-LIMIT Effective date: 20210310 Ref country code: CY Free format text: LAPSE BECAUSE OF FAILURE TO SUBMIT A TRANSLATION OF THE DESCRIPTION OR TO PAY THE FEE WITHIN THE PRESCRIBED TIME-LIMIT Effective date: 20210310 |
|
| PG25 | Lapsed in a contracting state [announced via postgrant information from national office to epo] |
Ref country code: TR Free format text: LAPSE BECAUSE OF FAILURE TO SUBMIT A TRANSLATION OF THE DESCRIPTION OR TO PAY THE FEE WITHIN THE PRESCRIBED TIME-LIMIT Effective date: 20210310 |
|
| PG25 | Lapsed in a contracting state [announced via postgrant information from national office to epo] |
Ref country code: MT Free format text: LAPSE BECAUSE OF FAILURE TO SUBMIT A TRANSLATION OF THE DESCRIPTION OR TO PAY THE FEE WITHIN THE PRESCRIBED TIME-LIMIT Effective date: 20210310 |
|
| PGFP | Annual fee paid to national office [announced via postgrant information from national office to epo] |
Ref country code: GB Payment date: 20260127 Year of fee payment: 15 |
|
| PGFP | Annual fee paid to national office [announced via postgrant information from national office to epo] |
Ref country code: DE Payment date: 20260128 Year of fee payment: 15 |