EP2712930A2 - Marqueurs pharmacodynamiques par induction alpha d'interféron - Google Patents
Marqueurs pharmacodynamiques par induction alpha d'interféron Download PDFInfo
- Publication number
- EP2712930A2 EP2712930A2 EP13179923.1A EP13179923A EP2712930A2 EP 2712930 A2 EP2712930 A2 EP 2712930A2 EP 13179923 A EP13179923 A EP 13179923A EP 2712930 A2 EP2712930 A2 EP 2712930A2
- Authority
- EP
- European Patent Office
- Prior art keywords
- ifn
- ifnα
- ifi6
- isg15
- ifi44l
- Prior art date
- Legal status (The legal status is an assumption and is not a legal conclusion. Google has not performed a legal analysis and makes no representation as to the accuracy of the status listed.)
- Withdrawn
Links
Images


Classifications
-
- C—CHEMISTRY; METALLURGY
- C12—BIOCHEMISTRY; BEER; SPIRITS; WINE; VINEGAR; MICROBIOLOGY; ENZYMOLOGY; MUTATION OR GENETIC ENGINEERING
- C12Q—MEASURING OR TESTING PROCESSES INVOLVING ENZYMES, NUCLEIC ACIDS OR MICROORGANISMS; COMPOSITIONS OR TEST PAPERS THEREFOR; PROCESSES OF PREPARING SUCH COMPOSITIONS; CONDITION-RESPONSIVE CONTROL IN MICROBIOLOGICAL OR ENZYMOLOGICAL PROCESSES
- C12Q1/00—Measuring or testing processes involving enzymes, nucleic acids or microorganisms; Compositions therefor; Processes of preparing such compositions
- C12Q1/68—Measuring or testing processes involving enzymes, nucleic acids or microorganisms; Compositions therefor; Processes of preparing such compositions involving nucleic acids
- C12Q1/6876—Nucleic acid products used in the analysis of nucleic acids, e.g. primers or probes
- C12Q1/6883—Nucleic acid products used in the analysis of nucleic acids, e.g. primers or probes for diseases caused by alterations of genetic material
-
- A—HUMAN NECESSITIES
- A61—MEDICAL OR VETERINARY SCIENCE; HYGIENE
- A61K—PREPARATIONS FOR MEDICAL, DENTAL OR TOILETRY PURPOSES
- A61K39/00—Medicinal preparations containing antigens or antibodies
- A61K39/395—Antibodies; Immunoglobulins; Immune serum, e.g. antilymphocytic serum
-
- A—HUMAN NECESSITIES
- A61—MEDICAL OR VETERINARY SCIENCE; HYGIENE
- A61P—SPECIFIC THERAPEUTIC ACTIVITY OF CHEMICAL COMPOUNDS OR MEDICINAL PREPARATIONS
- A61P1/00—Drugs for disorders of the alimentary tract or the digestive system
- A61P1/04—Drugs for disorders of the alimentary tract or the digestive system for ulcers, gastritis or reflux esophagitis, e.g. antacids, inhibitors of acid secretion, mucosal protectants
-
- A—HUMAN NECESSITIES
- A61—MEDICAL OR VETERINARY SCIENCE; HYGIENE
- A61P—SPECIFIC THERAPEUTIC ACTIVITY OF CHEMICAL COMPOUNDS OR MEDICINAL PREPARATIONS
- A61P13/00—Drugs for disorders of the urinary system
- A61P13/12—Drugs for disorders of the urinary system of the kidneys
-
- A—HUMAN NECESSITIES
- A61—MEDICAL OR VETERINARY SCIENCE; HYGIENE
- A61P—SPECIFIC THERAPEUTIC ACTIVITY OF CHEMICAL COMPOUNDS OR MEDICINAL PREPARATIONS
- A61P17/00—Drugs for dermatological disorders
-
- A—HUMAN NECESSITIES
- A61—MEDICAL OR VETERINARY SCIENCE; HYGIENE
- A61P—SPECIFIC THERAPEUTIC ACTIVITY OF CHEMICAL COMPOUNDS OR MEDICINAL PREPARATIONS
- A61P17/00—Drugs for dermatological disorders
- A61P17/06—Antipsoriatics
-
- A—HUMAN NECESSITIES
- A61—MEDICAL OR VETERINARY SCIENCE; HYGIENE
- A61P—SPECIFIC THERAPEUTIC ACTIVITY OF CHEMICAL COMPOUNDS OR MEDICINAL PREPARATIONS
- A61P21/00—Drugs for disorders of the muscular or neuromuscular system
-
- A—HUMAN NECESSITIES
- A61—MEDICAL OR VETERINARY SCIENCE; HYGIENE
- A61P—SPECIFIC THERAPEUTIC ACTIVITY OF CHEMICAL COMPOUNDS OR MEDICINAL PREPARATIONS
- A61P25/00—Drugs for disorders of the nervous system
-
- A—HUMAN NECESSITIES
- A61—MEDICAL OR VETERINARY SCIENCE; HYGIENE
- A61P—SPECIFIC THERAPEUTIC ACTIVITY OF CHEMICAL COMPOUNDS OR MEDICINAL PREPARATIONS
- A61P29/00—Non-central analgesic, antipyretic or antiinflammatory agents, e.g. antirheumatic agents; Non-steroidal antiinflammatory drugs [NSAID]
-
- A—HUMAN NECESSITIES
- A61—MEDICAL OR VETERINARY SCIENCE; HYGIENE
- A61P—SPECIFIC THERAPEUTIC ACTIVITY OF CHEMICAL COMPOUNDS OR MEDICINAL PREPARATIONS
- A61P3/00—Drugs for disorders of the metabolism
- A61P3/08—Drugs for disorders of the metabolism for glucose homeostasis
- A61P3/10—Drugs for disorders of the metabolism for glucose homeostasis for hyperglycaemia, e.g. antidiabetics
-
- A—HUMAN NECESSITIES
- A61—MEDICAL OR VETERINARY SCIENCE; HYGIENE
- A61P—SPECIFIC THERAPEUTIC ACTIVITY OF CHEMICAL COMPOUNDS OR MEDICINAL PREPARATIONS
- A61P37/00—Drugs for immunological or allergic disorders
-
- A—HUMAN NECESSITIES
- A61—MEDICAL OR VETERINARY SCIENCE; HYGIENE
- A61P—SPECIFIC THERAPEUTIC ACTIVITY OF CHEMICAL COMPOUNDS OR MEDICINAL PREPARATIONS
- A61P37/00—Drugs for immunological or allergic disorders
- A61P37/02—Immunomodulators
-
- A—HUMAN NECESSITIES
- A61—MEDICAL OR VETERINARY SCIENCE; HYGIENE
- A61P—SPECIFIC THERAPEUTIC ACTIVITY OF CHEMICAL COMPOUNDS OR MEDICINAL PREPARATIONS
- A61P37/00—Drugs for immunological or allergic disorders
- A61P37/02—Immunomodulators
- A61P37/06—Immunosuppressants, e.g. drugs for graft rejection
-
- A—HUMAN NECESSITIES
- A61—MEDICAL OR VETERINARY SCIENCE; HYGIENE
- A61P—SPECIFIC THERAPEUTIC ACTIVITY OF CHEMICAL COMPOUNDS OR MEDICINAL PREPARATIONS
- A61P43/00—Drugs for specific purposes, not provided for in groups A61P1/00-A61P41/00
-
- A—HUMAN NECESSITIES
- A61—MEDICAL OR VETERINARY SCIENCE; HYGIENE
- A61P—SPECIFIC THERAPEUTIC ACTIVITY OF CHEMICAL COMPOUNDS OR MEDICINAL PREPARATIONS
- A61P9/00—Drugs for disorders of the cardiovascular system
-
- C—CHEMISTRY; METALLURGY
- C07—ORGANIC CHEMISTRY
- C07K—PEPTIDES
- C07K16/00—Immunoglobulins [IG], e.g. monoclonal or polyclonal antibodies
- C07K16/18—Immunoglobulins [IG], e.g. monoclonal or polyclonal antibodies against material from animals or humans
- C07K16/24—Immunoglobulins [IG], e.g. monoclonal or polyclonal antibodies against material from animals or humans against cytokines, lymphokines or interferons
- C07K16/249—Interferons
-
- A—HUMAN NECESSITIES
- A61—MEDICAL OR VETERINARY SCIENCE; HYGIENE
- A61K—PREPARATIONS FOR MEDICAL, DENTAL OR TOILETRY PURPOSES
- A61K39/00—Medicinal preparations containing antigens or antibodies
- A61K2039/505—Medicinal preparations containing antigens or antibodies comprising antibodies
-
- C—CHEMISTRY; METALLURGY
- C07—ORGANIC CHEMISTRY
- C07K—PEPTIDES
- C07K2317/00—Immunoglobulins specific features
- C07K2317/20—Immunoglobulins specific features characterized by taxonomic origin
- C07K2317/21—Immunoglobulins specific features characterized by taxonomic origin from primates, e.g. man
-
- C—CHEMISTRY; METALLURGY
- C07—ORGANIC CHEMISTRY
- C07K—PEPTIDES
- C07K2317/00—Immunoglobulins specific features
- C07K2317/50—Immunoglobulins specific features characterized by immunoglobulin fragments
- C07K2317/56—Immunoglobulins specific features characterized by immunoglobulin fragments variable (Fv) region, i.e. VH and/or VL
- C07K2317/565—Complementarity determining region [CDR]
-
- C—CHEMISTRY; METALLURGY
- C07—ORGANIC CHEMISTRY
- C07K—PEPTIDES
- C07K2317/00—Immunoglobulins specific features
- C07K2317/70—Immunoglobulins specific features characterized by effect upon binding to a cell or to an antigen
- C07K2317/76—Antagonist effect on antigen, e.g. neutralization or inhibition of binding
-
- C—CHEMISTRY; METALLURGY
- C12—BIOCHEMISTRY; BEER; SPIRITS; WINE; VINEGAR; MICROBIOLOGY; ENZYMOLOGY; MUTATION OR GENETIC ENGINEERING
- C12Q—MEASURING OR TESTING PROCESSES INVOLVING ENZYMES, NUCLEIC ACIDS OR MICROORGANISMS; COMPOSITIONS OR TEST PAPERS THEREFOR; PROCESSES OF PREPARING SUCH COMPOSITIONS; CONDITION-RESPONSIVE CONTROL IN MICROBIOLOGICAL OR ENZYMOLOGICAL PROCESSES
- C12Q2600/00—Oligonucleotides characterized by their use
- C12Q2600/106—Pharmacogenomics, i.e. genetic variability in individual responses to drugs and drug metabolism
-
- C—CHEMISTRY; METALLURGY
- C12—BIOCHEMISTRY; BEER; SPIRITS; WINE; VINEGAR; MICROBIOLOGY; ENZYMOLOGY; MUTATION OR GENETIC ENGINEERING
- C12Q—MEASURING OR TESTING PROCESSES INVOLVING ENZYMES, NUCLEIC ACIDS OR MICROORGANISMS; COMPOSITIONS OR TEST PAPERS THEREFOR; PROCESSES OF PREPARING SUCH COMPOSITIONS; CONDITION-RESPONSIVE CONTROL IN MICROBIOLOGICAL OR ENZYMOLOGICAL PROCESSES
- C12Q2600/00—Oligonucleotides characterized by their use
- C12Q2600/136—Screening for pharmacological compounds
-
- C—CHEMISTRY; METALLURGY
- C12—BIOCHEMISTRY; BEER; SPIRITS; WINE; VINEGAR; MICROBIOLOGY; ENZYMOLOGY; MUTATION OR GENETIC ENGINEERING
- C12Q—MEASURING OR TESTING PROCESSES INVOLVING ENZYMES, NUCLEIC ACIDS OR MICROORGANISMS; COMPOSITIONS OR TEST PAPERS THEREFOR; PROCESSES OF PREPARING SUCH COMPOSITIONS; CONDITION-RESPONSIVE CONTROL IN MICROBIOLOGICAL OR ENZYMOLOGICAL PROCESSES
- C12Q2600/00—Oligonucleotides characterized by their use
- C12Q2600/158—Expression markers
-
- Y—GENERAL TAGGING OF NEW TECHNOLOGICAL DEVELOPMENTS; GENERAL TAGGING OF CROSS-SECTIONAL TECHNOLOGIES SPANNING OVER SEVERAL SECTIONS OF THE IPC; TECHNICAL SUBJECTS COVERED BY FORMER USPC CROSS-REFERENCE ART COLLECTIONS [XRACs] AND DIGESTS
- Y02—TECHNOLOGIES OR APPLICATIONS FOR MITIGATION OR ADAPTATION AGAINST CLIMATE CHANGE
- Y02A—TECHNOLOGIES FOR ADAPTATION TO CLIMATE CHANGE
- Y02A90/00—Technologies having an indirect contribution to adaptation to climate change
- Y02A90/10—Information and communication technologies [ICT] supporting adaptation to climate change, e.g. for weather forecasting or climate simulation
Definitions
- the present invention relates to pharmacodynamic (PD) markers inducible by interferon (IFN) alpha, probes and kits that detect the PD markers, and methods employing the same.
- PD pharmacodynamic
- IFN interferon
- the present invention encompasses PD markers that are induced by IFN ⁇ .
- the PD markers can be used in methods of treating patients with a therapeutic agent that binds to and modulates IFN ⁇ activity, methods that identify patients as candidates for a therapeutic agent that binds to and modulates IFN ⁇ activity, methods of diagnosing a patient as having a disorder associated with increased IFN ⁇ levels, methods of monitoring disease progression of a patient receiving treatment with a therapeutic agent that binds to and modulates IFN ⁇ activity, and methods of identifying a candidate therapeutic for treating IFN ⁇ -mediated disorders
- One embodiment of the invention encompasses a method of identifying a patient as a candidate for a therapeutic agent that binds to and modulates IFN ⁇ activity. Presence or absence of an IFN ⁇ -inducible PD marker expression profile is detected in a sample from the patient.
- Another embodiment of the invention encompasses a method of treating a patient having a type I IFN or IFN ⁇ -mediated disease or disorder.
- An agent that binds to and modulates type I IFN or IFN ⁇ activity is administered to the patient.
- the agent neutralizes a type I IFN or IFN ⁇ -inducible PD marker expression profile of the patient.
- Yet another embodiment of the invention encompasses a method of treating an autoimmune disease patient comprising a moderate or strong type I IFN or an IFN ⁇ PD marker profile.
- An agent that binds to and modulates type I IFN or IFN ⁇ activity is administered to the patient.
- the agent neutralizes the type I IFN or IFN ⁇ -inducible PD marker expression profile of the patient.
- a further embodiment of the invention encompasses a method of neutralizing a type I IFN or IFN ⁇ -inducible PD marker expression profile in a patient in need thereof.
- An agent that binds to and modulates type I IFN or IFN ⁇ activity is administered to the patient.
- the agent neutralizes the type I IFN or IFN ⁇ -inducible PD marker expression profile of the patient.
- Another embodiment of the invention encompasses a method of diagnosing a patient as having a disorder associated with increased IFN ⁇ levels. Presence or absence of an IFN ⁇ -inducible PD marker expression profile is detected in a sample from the patient.
- a further embodiment of the invention encompasses a method of monitoring disease progression of a patient receiving treatment with a therapeutic agent that binds to and modulates IFN ⁇ activity.
- a first IFN ⁇ -inducible PD marker expression profile is obtained in a first sample from the patient.
- a therapeutic agent that binds to and modulates IFN ⁇ activity is administered to the patient.
- a second IFN ⁇ -inducible PD marker expression profile is obtained from a second sample from the patient. The first and the second IFN ⁇ -inducible PD marker expression profiles are compared.
- Yet another embodiment of the invention encompasses a method of identifying a candidate therapeutic for treating IFN ⁇ -mediated disorders.
- Cells comprising an IFN ⁇ -inducible PD marker expression profile are contacted with an agent. Presence or absence of a change in the IFN ⁇ -induced PD marker expression profile of the cells is detected.
- a further embodiment of the invention encompasses a set of probes.
- kits that comprise the probes.
- Another embodiment of the invention encompasses a method of detecting IFN activity in a sample.
- Cells comprising a polynucleotide sequence comprising a reporter gene under the control of an IFN-stimulated response element are incubated with a sample. Expression of the reporter gene is detected.
- the invention encompasses methods of identifying, diagnosing, treating, and monitoring disease progression in patients.
- Patients include any animal having a type I IFN or an IFN ⁇ -inducible disease, disorder, or condition.
- the patient may have the disease, disorder, or condition as a result of experimental research, e.g., it may be an experimental model developed for the disease, disorder, or condition. Alternatively, the patient may have the disease, disorder, or condition in the absence of experimental manipulation.
- Patients include humans, mice, rats, horses, pigs, cats, dogs, and any animal used for research.
- the patient may comprise a type I IFN or IFN ⁇ -inducible PD marker expression profile.
- the type I IFN or IFN ⁇ -inducible PD marker expression profile may be a strong profile, a moderate profile, or a weak profile.
- the type I IFN or IFN ⁇ -inducible PD marker expression profile can readily be designated as strong, moderate, or weak by determining the fold dysregulation of the type I IFN or IFN ⁇ -inducible PD marker expression profile of the patient, ( e.g ., the fold increase in expression of upregulated type I IFN or IFN ⁇ -inducible PD markers in the patient), relative to a control sample(s) or control patient(s) and comparing the patient's fold dysregulation to that of other patients having a type I IFN or IFN ⁇ -inducible PD marker expression profile.
- Fold dysregulation can be calculated by well known methods in the art as can the comparing. See, e.g ., Example 8.
- the type I IFN or IFN ⁇ -inducible PD marker expression profile may comprise upregulation of any group of genes or group of genes detected by the probes identified in Tables 19, 20, 21, 22, 23, 24, 26, 28, or 30.
- the group of genes or group of genes detected by the probes identified in Tables 19, 20, 21, 22, 23, 24, 26, 28 or 30 may include any at least 2, any at least 3, any at least 4, any at least 5, any at least 6, any at least 7, any at least 8, any at least 9, any at least 10, any at least 11, any at least 12, any at least 13, any at least 14, any at least 15, any at least 16, any at least 17, any at least 18, any at least 19, any at least 20, any at least 21, any at least 22, any at least 23, any at least 24, any at least 25, any at least 26, any at least 27, any at least 28, any at least 29, any at least 30, any at least 40, or any at least 50 of the genes or genes detected by the probes identified in the Tables.
- the group of genes that may be included in the type I IFN or IFN ⁇ -inducible PD marker expression profile of the patient may be MX1, LY6E, IFI27, OAS1, IFIT1, IFI6, IFI44L, ISG15, LAMP3, OASL, RASD2, and IFI44.
- the genes or genes detected by the probes may include IFI44, IFI27, IFI44L, DNAPTP6, LAMP3, LY6E, RSAD2, HERC5, IFI6, ISG15, OAS3, SIGLEC1, OAS2, USP18, RTP4, IFIT1, MX1, OAS1, EPSTI1, PLSCR1, and IFRG28.
- the genes may include any at least 2, any at least 3, any at least 4, any at least 5, any at least 6, any at least 7, any at least 8, any at least 9, any at least 10, or any at least 11, or any at least 12, or any at least 13, or any at least 14, or any at least 15, or any at least 16, or any at least 17, or any at least 18, or any at least 19, or at least 20, or any at least 21, or any at least 22, or any at least 23, or any at least 24, or any least 25, or any at least 26, or any at least 27, or any at least 28, or any at least 29, or any at least 30 of LAMP3, DNAPTP6, FLJ31033, HERC6, SERPING1, EPST11, RTP4, OASL, FBXO6, IFIT2, IFI44, OAS3, BATF2, ISG15, IRF7, RSAD2, IFI35, OAS1, LAP3, IFIT1, IFIT5, PLSCR1, IFI44L, MS4A4A, GALM, UBE2L6, TOR1B, SAMD9L, HERC5,
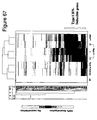
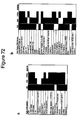
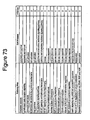
- the type I IFN or IFN ⁇ -inducible PD marker expression profile may contain upregulation of the entire group of genes or group of genes detected by the probes identified in one of Table 19, or Table 20, or Table 21, or Table 22, or Table 23, or Table 24, or Table 26, or Table 28, or Table 30 or may be any one or more of the genes identified in Figure 72 .
- the type I IFN or IFN ⁇ -inducible PD marker expression profile may include upregulation of all the genes identified in Table 24.
- the type I IFN or IFN ⁇ -inducible PD marker expression profile may include upregulation of the genes identified in figure 72A or figure 72b, or figure 72a and figure 72b .
- the patient comprising the type I IFN or IFN ⁇ -inducible PD marker expression profile may further comprise downregulated type I IFN or IFN ⁇ PD marker(s).
- the downregulated PD markers may include any one, any two, any three, any four, any five, any six, any seven, any eight, any nine, any ten, any 15, any 20, any 25, any 30, any 35, any 40, any 45, or any 50 of the genes in Table 31 or any of CYP1B1, TGST1, RRAGD, IRS2, MGST1, TGFBR3, and RGS2.
- the patient comprising the type I IFN or IFN ⁇ -inducible PD marker expression profile may further comprise upregulation of expression of any number of IFN ⁇ or type-I IFN subtypes.
- the IFN ⁇ or type-I IFN subtypes may include any more than one, more than two, more than three, more than four, more than five, more than six, more than seven, more than eight, more than nine, or more than ten IFN ⁇ or type-I IFN subtypes. These subtypes may include IFN ⁇ 1, IFN ⁇ 2, IFN ⁇ 4, IFN ⁇ 5, IFN ⁇ 6, IFN ⁇ 7, IFN ⁇ 8, IFN ⁇ 10, IFN ⁇ 14, IFN ⁇ 17, IFN ⁇ 21, IFN ⁇ , or IFN ⁇ .
- the patient may comprise upregulation of expression of IFN subtypes IFN ⁇ 1, IFN ⁇ 2, IFN ⁇ 8, and IFN ⁇ 14.
- a patient treated in the methods encompassed by the invention may simply be one identified as comprising a gene expression profile with upregulation of expression of any number of IFN ⁇ or type-I IFN subtypes.
- the IFN ⁇ or type-I IFN subtypes may include any more than one, more than two, more than three, more than four, more than five, more than six, more than seven, more than eight, more than nine, or more than ten IFN ⁇ or type-I IFN subtypes. These subtypes may include IFN ⁇ 1, IFN ⁇ 2, IFN ⁇ 4, IFN ⁇ 5, IFN ⁇ 6, IFN ⁇ 7, IFN ⁇ 8, IFN ⁇ 10, IFN ⁇ 14, IFN ⁇ 17, IFN ⁇ 21, IFN ⁇ , or IFN ⁇ . These subtypes may include IFN ⁇ 1, IFN ⁇ 2, IFN ⁇ 8, and IFN ⁇ 14.
- the patient comprising the type I IFN or IFN ⁇ -inducible PD marker expression profile may further comprise upregulation of expression of IFN ⁇ receptors, either IFNAR1 or IFNAR2, or both, or TNF ⁇ , or IFN ⁇ , or IFN ⁇ receptors (either IFNGR1, IFNGR2, or both IFNGR1 and IFNGR2).
- the patient may simply be identified as one who comprises upregulation of expression of IFN ⁇ receptors, either IFNAR1 or IFNAR2, or both, or TNF ⁇ , or IFN ⁇ , or IFNyreceptors (either IFNGR1, IFNGR2, or both IFNGR1 and IFNGR2).
- the upregulation or downregulation of the type I IFN or IFN ⁇ -inducible PD markers in the patient's expression profile may be by any degree relative to that of a sample from a control (which may be from a sample that is not disease tissue of the patient (e.g., non-lesional skin of a psoriasis patient) or from a healthy person not afflicted with the disease or disorder).
- a control which may be from a sample that is not disease tissue of the patient (e.g., non-lesional skin of a psoriasis patient) or from a healthy person not afflicted with the disease or disorder).
- the degree upregulation or downregulation may be at least 10%, at least 15%, at least 20%, at least 25%, at least 30%, at least 40%, at least 50%, at least 60%, at least 70%, at least 75%, at least 80%, at least 90%, at least 100%, at least 125%, at least 150%, or at least 200%, or at least 300%, or at least 400%, or at least 500% that of the control or control sample.
- the patient may overexpress or have a tissue that overexpresses a type I IFN subtype at least 10%, at least 15%, at least 20%, at least 25%, at least 30%, at least 40%, at least 50%, at least 60%, at least 70%, at least 75%, at least 80%, at least 90%, at least 100%, at least 125%, at least 150%, or at least 200%, or at least 300%, or at least 400%, or at least 500% that of the control.
- the type I IFN subtype may be any one of IFN ⁇ 1, IFN ⁇ 2, IFN ⁇ 4, IFN ⁇ 5, IFN ⁇ 6, IFN ⁇ 7, IFN ⁇ 8, IFN ⁇ 10, IFN ⁇ 14, IFN ⁇ 17, IFN ⁇ 21, IFN ⁇ , or IFN ⁇ .
- the type I IFN subtypes may include all of IFN ⁇ 1, IFN ⁇ 2, IFN ⁇ 8, and IFN ⁇ 14.
- the patient may further comprise or alternatively comprise alterations in levels of proteins in serum.
- the patient may have increased serum levels of proteins such as adiponectin, alpha-fetoprotein, apolipoprotein CIII, beta-2 microglobulin, cancer antigen 125, cancer antigen 19-9, eotaxin, FABP, factor VII, ferritin, IL-10, IL-12p70, IL-16, IL-18, IL-1ra, IL-3, MCP-1, MMP-3, myoglobin, SGOT, tissue factor, TIMP-1, TNF RII, TNF-alpha, VCAM-1, or vWF.
- proteins such as adiponectin, alpha-fetoprotein, apolipoprotein CIII, beta-2 microglobulin, cancer antigen 125, cancer antigen 19-9, eotaxin, FABP, factor VII, ferritin, IL-10, IL-12p70, IL-16, IL-18, IL-1ra, IL
- the patient may have increased serum levels of any 1, 2,3, 4, 5, 6, 7, 8, 9, 10, 11, 12, 13 14, 15, 16, 17, 18, 19, 20, 21, o22, 23, 24, 25, or 26 of these proteins in serum.
- the increased level may be at least 10%, at least 15%, at least 20%, at least 25%, at least 30%, at least 40%, at least 50%, at least 60%, at least 70%, at least 75%, at least 80%, at least 90%, at least 100%, at least 125%, at least 150%, or at least 200%, or at least 300%, or at least 400%, or at least 500% that of a control, e.g., a healthy subject.
- the alteration may be a decrease in serum levels of proteins such as BDNK, complement 3, CD40 ligand, EGF, ENA-78, EN-RAGE, IGF-1, MDC, myeloperoxidase, RANTES, or thrombopoietin
- the patient may have decreased serum levels of any 1, 2, 3, 4, 5, 6, 7, 8, 9, 10, or 11 or these proteins.
- the decreased level may be at least 10%, at least 15%, at least 20%, at least 25%, at least 30%, at least 40%, at least 50%, at least 60%, at least 70%, at least 75%, at least 80%, at least 90%, or at least 100% that of a control, e.g., a healthy subject.
- the PD marker profile may comprise one or more of these increased or decreased serum levels of proteins.
- the patient may further comprise auto-antibodies that bind to any one of the following auto-antigens: (a) Myxovirus (influenza virus) resistance 1, interferon-inducible protein p78; (b) surfeit 5, transcript variant c; (c) proteasome (posome, macropain) activator subunit 3 (PA28 gamma; Ki) transc; (d) retinoic acid receptor, alpha; (e) Heat shock 10 kDa protein 1 (chaperonin 10); (f) tropomyosin 3; (g) pleckstrin homology-like domain, family A, member 1; (h) cytoskeleton-associated protein 1; (i) Sjogren syndrome antigen A2 (60 kDa, ribonucleoprotein auto-antigen SS-A/Ro); (j) NADH dehydrogenase (ubiquinone) 1, alpha/beta subcomplex 1, 8 kDa; (k) NudE nuclear distribution gene E homo
- nidulans (1) MutL homolog 1, colon cancer, nonpolyposis type 2 (E. coli); (m) leucine rich repeat (in FLII) interacting protein 2; (n) tropomyosin 1 (alpha); (o) spastic paraplegia 20, spartin (Troyer syndrome); (p) preimplantation protein, transcript variant 1; (r) mitochondrial ribosomal protein L45; (s) Lin-28 homolog (C. elegans); (t) heat shock 90 kDa protein 1, alpha; (u) dom-3 homolog Z (C.
- the patient may comprise auto-antibodies that bind to any number of these auto-antigens, e.g ., any at least 2, at least 3, at least 4, at least 5, at least 6, at least 7, at least 8, at least 9 at least 10, at least 11, at least 12, at least 13, at least 14, at least 15, at least 20, at least 25.
- auto-antibodies that bind to any number of these auto-antigens, e.g ., any at least 2, at least 3, at least 4, at least 5, at least 6, at least 7, at least 8, at least 9 at least 10, at least 11, at least 12, at least 13, at least 14, at least 15, at least 20, at least 25.
- a type I IFN or an IFN ⁇ -inducible disease, disorder, or condition is any that exhibits a type I IFN or an IFN ⁇ PD marker expression profile or gene signature.
- a PD marker expression profile and a gene signature will be understood to be equivalent.
- These diseases, disorders, or conditions include those with an autoimmune component such as systemic lupus erythematosus, insulin dependent diabetes mellitus, inflammatory bowel disease (including Crohn's disease, ulcerative colitis, and Celiac's disease), multiple sclerosis, psoriasis, autoimmune thyroiditis, rheumatoid arthritis, glomerulonephritis, idiopathic inflammatory myositis, Sjogren's syndrome, vasculitis, dermatomyositis, polymyositis, and sarcoidosis.
- Other diseases, disorders, or conditions include graft versus host disease and transplant rejection.
- the patients may also exhibit any of a number of symptoms as discussed in, e.g ., provisional patent application Methods of Treating Systemic Lupus Erythematosis filed April 16, 2007, or may have a clinical SLEDAI score or BILAG score as discussed in the same. These symptoms may include fatigue, organ damage, malar rash, and alopecia.
- the patient may be scored using a known clinical scoring system, e.g., SLEDAI which is an index of SLE disease activity as measured and evaluated within the last 10 days ( Bombardier C, Gladman D D, Urowitz M B, Caron D, Chang C H and the Committee on Prognosis Studies in SLE: Derivation of the SLEDAI for Lupus Patients.
- BILAG index is an activity index of SLE that is based on specific clinical manifestations in eight organ systems: general, mucocutaneous, neurological, musculoskeletal, cardiovascular, respiratory, renal, and hematology results. Scoring is based on a letter system, but weighted numerical scores can also be assigned to each letter, making it possible to calculate a BILAG score in the range of 0-72. ( Griffiths, et al., Assessment of Patients with Systemic Lupus Erythematosus and the use of Lupus Disease Activity Indices ). Other scoring indices include the PGA score, the composite responder index (CRI), and the ANAM4TM test.
- the methods described herein, e.g ., of treating an autoimmune disorder may be used for any subject identified as having any activity level of disease activity as measured by any classification methodology known in the art, e.g ., mild, moderate, high, or very high.
- the methods described herein, e.g., of treating an autoimmune disorder may result in a decrease in a patient's symptoms or may result in an improvement in a score of disease for the patient's type I IFN or an IFN ⁇ -inducible disease, disorder, or condition.
- a therapeutic agent may be administered to a patient or a patient may be identified as a candidate for administration of an agent or a therapeutic agent.
- a therapeutic agent is any molecule that binds to and modulates type I IFN or IFN ⁇ activity.
- the therapeutic agent may be a small molecule or a biological agent. If the therapeutic agent is a small molecule it may be synthesized or identified and isolated from a natural source.
- the therapeutic agent may be an antibody specific for any subtype(s) of type I IFN or IFN ⁇ .
- the antibody may be specific for any one of IFN ⁇ 1, IFN ⁇ 2, IFN ⁇ 4, IFN ⁇ 5, IFN ⁇ 6, IFN ⁇ 7, IFN ⁇ 8, IFN ⁇ 10, IFN ⁇ 14, IFN ⁇ 17, IFN ⁇ 21, IFN ⁇ , or IFN ⁇ .
- the antibody may be specific for any two, any three, any four, any five, any six, any seven, any eight, any nine, any ten, any eleven, any twelve type I IFN of IFN ⁇ subtypes.
- the antibody may be specific for IFN ⁇ 1, IFN ⁇ 2, IFN ⁇ 4, IFN ⁇ 5, IFN ⁇ 8, IFN ⁇ 10, and IFN ⁇ 21; or it may be specific for IFN ⁇ 1, IFN ⁇ 2, IFN ⁇ 4, IFN ⁇ 5, IFN ⁇ 8, and IFN ⁇ 10; or it may be specific for IFN ⁇ 1, IFN ⁇ 2, IFN ⁇ 4, IFN ⁇ 5, IFN ⁇ 8, and IFN ⁇ 21; or it may be specific for IFN ⁇ 1, IFN ⁇ 2, IFN ⁇ 4, IFN ⁇ 5, IFN ⁇ 10, and IFN ⁇ 21.
- Antibodies specific for type I IFN or IFN ⁇ include MEDI-545, any biologic or antibody other than MEDI-545, antibodies described in U.S.
- the antibody may be a synthetic antibody, a monoclonal antibody, polyclonal antibodies, a recombinantly produced antibody, an intrabody, a multispecific antibody (including bi-specific antibodies), a human antibody, a humanized antibody, a chimeric antibody, a single-chain Fv (scFv) (including bi-specific scFv), a BiTE molecule, a single chain antibody, a Fab fragments, a F(ab') fragment, a disulfide-linked Fv (sdFv), or an epitope-binding fragment of any of the above.
- the antibody may be any of an immunoglobulin molecule or immunologically active portion of an immunoglobulin molecule.
- the antibody may be of any isotype.
- it may be any of isotypes IgG1, IgG2, IgG3 or IgG4.
- the antibody may be a full-length antibody comprising variable and constant regions, or an antigen-binding fragment thereof, such as a single chain antibody, or a Fab or Fab'2 fragment.
- the antibody may also be conjugated or linked to a therapeutic agent, such as a cytotoxin or a radioactive isotope.
- Second agents include, but are not limited to non-steroidal anti-inflammatory drugs such as ibuprofen, naproxen, sulindac, diclofenac, piroxicam, ketoprofen, diflunisal, nabumetone, etodolac, and oxaprozin, indomethacin; anti-malarial drugs such as hydroxychloroquine; corticosteroid hormones, such as prednisone, hydrocortisone, methylprednisolone, and dexamethasone; methotrexate; immunosuppressive agents, such as azathioprine and cyclophosphamide; and biologic agents that, e.g ., target T cells such as Alefacept and Efalizumab, or target TNF ⁇ , such as, Enbrel, Remicade, and Humira.
- target T cells such as Alefacept and Efalizumab
- target TNF ⁇ such as, Enbrel, Rem
- Treatment with the agent may result in neutralization of the type I IFN or IFN ⁇ -inducible profile. Treatment with the agent may result in a decrease in one or more symptoms of the type I IFN or an IFN ⁇ -mediated disease or disorder. Treatment with the agent may result in fewer flare-ups related to the type I IFN or an IFN ⁇ -mediated disease or disorder. Treatment with the agent may result in improved prognosis for the patient having the type I IFN or an IFN ⁇ -mediated disease or disorder. Treatment with the agent may result in a higher quality of life for the patient. Treatment with the agent may alleviate the need to co-administer second agents or may lessen the dosage of administration of the second agent to the patient. Treatment with the agent may reduce the number of hospitalizations of the patient that are related to the type I IFN or an IFN ⁇ -mediated disease or disorder.
- the agent that binds to and modulates type I IFN or IFN ⁇ activity may neutralize a type I IFN or IFN ⁇ -inducible profile.
- Neutralization of the type I IFN or IFN ⁇ -inducible profile may be a reduction in at least one, at least two, at least three, at least five, at least seven, at least eight, at least ten, at least twelve, at least fifteen, at least twenty, at least twenty five, at least thirty, at least thirty five, at least forty, at least forty five, or at least fifty genes up-regulated by type I IFN or IFN ⁇ .
- the genes upregulated by type I IFN or IFN ⁇ may be any group of genes in Tables 19, 20, 21, 22, 23, 24, 26, 28, or 30 as discussed above.
- Neutralization of the type I IFN or IFN ⁇ -inducible profile is a reduction of at least 2%, at least 3%, at least 4%, at least 5%, at least 7%, at least 8%, at least 10%, at least 15%, at least 25%, at least 30%, at least 35%, at least 40%, at least 45%, at least 50%, at least 60%, at least 70%, at least 75%, at least 80%, or at least 90% of any of the at least one, at least two, at least three, at least five, at least seven, at least eight, at least ten, at least twelve, at least fifteen, at least twenty, at least twenty five, at least thirty, at least thirty five, at least forty, at least forty five, or at least fifty genes up-regulated in any type 1 IFN or IFN ⁇ -inducible profile.
- neutralization of the type I IFN or IFN ⁇ -inducible profile refers to a reduction of expression of up-regulated type I IFN or IFN ⁇ -inducible genes that is within at most 50%, at most 45%, at most 40%, at most 35%, at most 30%, at most 25%, at most 20%, at most 15%, at most 10%, at most 5%, at most 4%, at most 3%, at most 2%, or at most 1% of expression levels of those type I IFN or IFN ⁇ -inducible genes in a control sample.
- the agent that binds to and modulates type I IFN or IFN ⁇ activity is a biologic agent, such as an antibody
- the agent may neutralize the type I IFN or IFN ⁇ profile at doses of 0.3 to 30 mg/kg, 0.3 to 10 mg/kg, 0.3 to 3 mg/kg, 0.3 to I mg/kg, 1 to 30 mg/kg, 3 to 30 mg/kg, 5 to 30 mg/kg, 10 to 30 mg/kg, 1 to 10 mg/kg, 3 to 10 mg/kg, or I to 5 mg/kg.
- Neutralization of the type 1 IFN or IFN ⁇ -inducible profile may be increased expression of at least one, at least two, at least three, at least five, at least seven, at least eight, at least ten, at least twelve, at least fifteen, at least twenty, at least twenty five, at least thirty, at least thirty five, at least forty, at least forty five, or at least fifty genes whose expression is reduced by type I IFN or IFN ⁇ .
- the genes whose expression is reduced by type I IFN or IFN ⁇ may be any group of genes in Table 30.
- Neutralization of down-regulated genes in a type I IFN or IFN ⁇ -inducible profile is an increase of at least 2%, at least 3%, at least 4%, at least 5%, at least 7%, at least 8%, at least 10%, at least 15%, at least 25%, at least 30%, at least 35%, at least 40%, at least 45%, at least 50%, at least 60%, at least 70%, at least 75%, at least 80%, or at least 90%, or at least 100%, or at least 125%, or at least 130%, or at least 140%, or at least 150%, or at least 175%, or at least 200%, or at least 250%, or at least 300%, or at least 500% of any of the at least one, at least two, at least three, at least five, at least seven, at least eight, at least ten, at least twelve, at least fifteen, at least twenty, or at least twenty five genes whose expression is downregulated in any type I IFN or IFN ⁇ -inducible profile.
- neutralization of the type I IFN or IFN ⁇ -inducible profile refers to an increase in expression of type I IFN or IFN ⁇ -inducible genes to within at most 50%, at most 45%, at most 40%, at most 35%, at most 30%, at most 25%, at most 20%, at most 15%, at most 10%, at most 5%, at most 4%, at most 3%, at most 2%, or at most 1% of expression levels of those type I IFN or IFN ⁇ -inducible (downregulated) genes in a control sample.
- the agent that binds to and modulates type I IFN or IFN ⁇ activity is a biologic agent, such as an antibody
- the agent may neutralize the type I IFN or IFN ⁇ profile at doses of 0.3 to 30 mg/kg, 0.3 to 10 mg/kg, 0.3 to 3 mg/kg, 0.3 to I mg/kg, 1 to 30 mg/kg, 3 to 30 mg/kg, 5 to 30 mg/kg, 10 to 30 mg/kg, 1 to 10 mg/kg, 3 to 10 mg/kg, or I to 5 mg/kg.
- the agent that binds to and modulates type I IFN or IFN ⁇ activity may further or alternatively neutralize expression of one or more type I IFN or IFN ⁇ subtypes.
- the IFN ⁇ or type-I IFN subtypes may include any more than one, more than two, more than three, more than four, more than five, more than six, more than seven, more than eight, more than nine, or more than ten IFN ⁇ or type-I IFN subtypes. These subtypes may include IFN ⁇ 1, IFN ⁇ 2, IFN ⁇ 4, IFN ⁇ 5, IFN ⁇ 6, IFN ⁇ 7, IFN ⁇ 8, IFN ⁇ 10, IFN ⁇ 14,IFN ⁇ 17, IFN ⁇ 21-, IFN ⁇ , or IFN ⁇ .
- subtypes may include all of IFN ⁇ 1, IFN ⁇ 2, IFN ⁇ 8, and IFN ⁇ 14.
- these subtypes may include IFN ⁇ 1, IFN ⁇ 2, IFN ⁇ 4, IFN ⁇ 5, IFN ⁇ 8, IFN ⁇ 10, IFN ⁇ 21.
- Neutralization of the IFN ⁇ or type-I IFN subtypes may be a reduction of at least 2%, at least 3%, at least 4%, at least 5%, at least 7%, at least 8%, at least 10%, at least 15%, at least 25%, at least 30%, at least 35%, at least 40%, at least 45%, at least 50%, at least 60%, at least 70%, at least 75%, at least 80%, or at least 90% of any of the at least one, at least two, at least three, at least five, at least seven, at least eight, or at least ten of the subtypes.
- Neutralization of the IFN ⁇ or type-I IFN subtypes may be a reduction in expression of IFN ⁇ or type-I IFN subtype genes that is within at most 50%, at most 45%, at most 40%, at most 35%, at most 30%, at most 25%, at most 20%, at most 15%, at most 10%, at most 5%, at most 4%, at most 3%, at most 2%, or at most 1% of expression levels of those IFN ⁇ or type I IFN subtypes in a control sample.
- the agent that binds to and modulates IFN ⁇ activity or type I IFN activity is a biologic agent, such as an antibody
- the agent may neutralize the IFN ⁇ or type I IFN subtypes at doses of 0.3 to 30 mg/kg, 0.3 to 10 mg/kg, 0.3 to 3 mg/kg, 0.3 to I mg/kg, I to 30 mg/kg, 3 to 30 mg/kg, 5 to 30 mg/kg, 10 to 30 mg/kg, I to 10 mg/kg, 3 to 10 mg/kg, or I to 5 mg/kg.
- the agent that binds to and modulates type I IFN or IFN ⁇ activity may further or alternatively neutralize expression of IFN ⁇ receptors, either IFNAR1 or IFNAR2, or both, or TNF ⁇ , or IFN ⁇ , or IFN ⁇ receptors (either IFNGR1, IFNGR2, or both IFNGR1 and IFNGR2).
- Neutralization of expression of IFN ⁇ receptors may be a reduction of at least 2%, at least 3%, at least 4%, at least 5%, at least 7%, at least 8%, at least 10%, at least 15%, at least 25%, at least 30%, at least 35%, at least 40%, at least 45%, at least 50%, at least 60%, at least 70%, at least 75%, at least 80%, or at least 90% of any of the at least one, at least two, at least three, at least five, or at least six of these genes.
- IFN ⁇ receptors either IFNAR1 or IFNAR2, or TNF ⁇ , or IFN ⁇ , or IFN ⁇ receptors (either IFNGR1, IFNGR2, or both IFNGR1 and IFNGR2) is a reduction of expression of at most 50%, at most 45%, at most 40%, at most 35%, at most 30%, at most 25%, at most 20%, at most 15%, at most 10%, at most 5%, at most 4%, at most 3%, at most 2%, or at most I % of expression levels of these genes in a control sample.
- the agent that binds to and modulates type I IFN or IFN ⁇ activity is a biologic agent, such as an antibody
- the agent may neutralize expression of IFN ⁇ receptors IFNAR1 or IFNAR2, or TNF ⁇ , or IFN ⁇ , or IFN ⁇ receptors IFNGR1 or IFNGR2 at doses of 0.3 to 30 mg/kg, 0.3 to 10 mg/kg, 0.3 to 3 mg/kg, 0.3 to 1 mg/kg, 1 to 30 mg/kg, 3 to 30 mg/kg, 5 to 30 mg/kg, 10 to 30 mg/kg, 1 to 10 mg/kg, 3 to 10 mg/kg, or 1 to 5 mg/kg.
- the agent that binds to and modulates type I IFN or IFN ⁇ activity may further or alternatively neutralize alterations of levels of proteins in serum, e.g ., increase levels of those proteins whose serum levels are downregulated or decrease levels of those proteins whose serum levels are upregulated to levels closer to those of control subjects.
- Neutralization of expression of proteins in serum may be by bringing the level of at least one, at least two, at least three, at least five, at least six, at least seven, at least eight, at least nine, at least ten, at least twelve, at least fifteen, at least twenty proteins in serum, such as adiponectin, alpha-fetoprotein, apolipoprotein CIII, beta-2 microglobulin, cancer antigen 125, cancer antigen 19-9, eotaxin, FABP, factor VII, ferritin, IL-10, IL-12p70, IL-16, IL-18, IL-1ra, IL-3, MCP-1, MMP-3, myoglobin, SGOT, tissue factor, TIMP-1, TNF RII, TNF-alpha, VCAM-1, vWF, BDNK, complement 3, CD40 ligand, EGF, ENA-78, EN-RAGE, IGF-1, MDC, myeloperoxidase, RANTES, or thrombopo
- the agent that binds to and modulates type I IFN or IFN ⁇ activity is a biologic agent, such as an antibody
- the agent may neutralize levels of the serum proteins, e.g ., adiponectin, alpha-fetoprotein, apolipoprotein CIII, beta-2 microglobulin, cancer antigen 125, cancer antigen 19-9, eotaxin, FABP, factor VII, ferritin, IL-10, IL-12p70, IL-16, IL-18, IL-1ra, IL-3, MCP-1, MMP-3, myoglobin, SGOT, tissue factor, TIMP-1, TNF RII, TNF-alpha, VCAM-1, vWF, BDNK, complement 3, CD40 ligand, EGF, ENA-78, EN-RAGE, IGF-1, MDC, myeloperoxidase, RANTES, or thrombopoietin, at doses of 0.3 to 30 mg/kg, 0.3 to 10 mg
- the agent that binds to and modulates type I IFN or IFN ⁇ activity may further or alternatively reduce number or level of auto-antibodies that bind to any one, any at least 2, any at least 3, any at least 4, any at least 5, any at least 6, any at least 7, any at least 8, any at least 9, any at least 10, any at least 15, or any at least 20 of the following auto-antigens: (a) Myxovirus (influenza virus) resistance 1, interferon-inducible protein p78; (b) surfeit 5, transcript variant c; (c) proteasome (posome, macropain) activator subunit 3 (PA28 gamma; Ki) transc; (d) retinoic acid receptor, alpha; (e) Heat shock 10 kDa protein 1 (chaperonin 10); (f) tropomyosin 3; (g) pleckstrin homology-like domain, family A, member 1; (h) cytoskeleton-associated protein 1; (i) Sjogren syndrome antigen A2 (
- nidulans (1) MutL homolog 1, colon cancer, nonpolyposis type 2 (E. coli); (m) leucine rich repeat (in FLII) interacting protein 2; (n) tropomyosin I (alpha); (o) spastic paraplegia 20, spartin (Troyer syndrome); (p) preimplantation protein, transcript variant 1; (r) mitochondrial ribosomal protein L45; (s) Lin-28 homolog (C. elegans); (t) heat shock 90 kDa protein 1, alpha; (u) dom-3 homolog Z (C.
- Reduction in level of auto-antibody may be a reduction of at least 2%, at least 3%, at least 4%, at least 5%, at least 7%, at least 8%, at least 10%, at least 15%, at least 25%, at least 30%, at least 35%, at least 40%, at least 45%, at least 50%, at least 60%, at least 70%, at least 75%, at least 80%, or at least 90% in presence of any of the auto-antibodies.
- the agent that binds to and modulates type I IFN or IFN ⁇ activity is a biologic agent, such as an antibody
- the agent may reduce number or level or auto-antibodies at doses of 0.3 to 30 mg/kg, 0.3 to 10 mg/kg, 0.3 to 3 mg/kg, 0.3 to I mg/kg, 1 to 30 mg/kg, 3 to 30 mg/kg, 5 to 30 mg/kg, 10 to 30 mg/kg, I to 10 mg/kg, 3 to 10 mg/kg, or 1 to 5 mg/kg.
- the agent that binds to and modulates type I IFN or IFN ⁇ activity may not neutralize expression of genes that are not included in an interferon-inducible signature or PD marker profile.
- Samples may also be obtained from patients in the methods of the invention. Samples include any biological fluid or tissue, such as whole blood, saliva, urine, synovial fluid, bone marrow, cerebrospinal fluid, nasal secretions, sputum, amniotic fluid, bronchoalveolar lavage fluid, peripheral blood mononuclear cells, total white blood cells, lymph node cells, spleen cells, tonsil cells, or skin.
- biological fluid or tissue such as whole blood, saliva, urine, synovial fluid, bone marrow, cerebrospinal fluid, nasal secretions, sputum, amniotic fluid, bronchoalveolar lavage fluid, peripheral blood mononuclear cells, total white blood cells, lymph node cells, spleen cells, tonsil cells, or skin.
- the samples may be obtained by any means known in the art.
- IFN ⁇ -inducible PD marker expression profiles may include up-regulated expression or activity of genes in cells exposed to elevated IFN ⁇ levels relative to baseline.
- Up-regulated expression or activity of genes includes an increase in expression of mRNA from a gene, an increase in expression of a protein encoded by a gene, or an increase in activity of a protein encoded by a gene.
- the expression or activity of the genes may be up-regulated as a direct or indirect response to IFN ⁇ .
- the up-regulated expression or activity of any gene detected in a sample, by probes, or by probes in kits in an IFN ⁇ -inducible PD marker expression profile may be at least 1.2-fold, at least 1.25-fold, at least 1.3-fold, at least 1.4-fold, at least 1.5-fold, at least 2.0-fold, at least 2.25-fold, at least 2.5-fold, at least 2.75-fold, at least 3.0-fold, at least 3.5-fold, at least 4.0-fold, at least 4.5-fold, at least 5.0-fold, at least 6.0-fold, at least 7.0-fold, at least 8.0-fold, at least 9.0-fold, at least 10.0-fold, at least 15.0-fold, at least 20.0-fold, at least 25.0-fold, or at least 50.0-fold relative to baseline levels of control cells, e.g ., cells of healthy volunteers or cells of control animals or cells not exposed to IFN ⁇ in culture. All of the genes in the IFN ⁇ -inducible PD marker expression profile may have up-regulated
- the down-regulated expression or activity of any gene detected in a sample, by probes, or by probes in kits in an IFN ⁇ -inducible PD marker expression profile may be at least 5%, at least 10%, at least 15%, at least 20%, at least 25%, at least 30%, at least 35%, at least 40%, at least 45%, at least 50%, at least 55%, at least 60%, at least 65%, at least 70%, at least 75%, at least 80%, at least 85%, at least 90%, at least 95%, at least 96%, at least97%, at least 98%, or at least 99% relative to baseline levels of control cells, e.g ., cells of healthy volunteers or cells of control animals or cells not exposed to IFN ⁇ in culture. All of the genes in the IFN ⁇ -inducible PD marker expression profile may have down-regulated expression or activity at the same fold decrease. Alternatively, the genes in the PD marker expression profile may have varying levels of down-regulated expression or activity.
- the number of genes included in IFN ⁇ -inducible PD marker expression profile may be at least 2, at least 3, at least 4, at least 5, at least 10, at least 20, at least 25 at least 30, at least 50, at least 75, at least 100, at least 150, at least 200, at least 250, at least 300, at least 400, at least 500, at least 750, at least 1000, at least 1500, at least 2000, at least 2500, at least 5000, at least 10000, or at least 15000 genes.
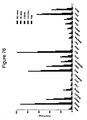
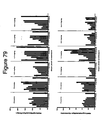
- These genes may include those listed in Tables 19 and/or 20 and/or 21 and/or 22 and/or 23 and/or 24 and/or 26 and/or 28 and/or 30 and/or 31 and/or any of the genes identified in Figures 72 , 74 , 75 , or 77 .
- the genes included in IFN ⁇ -inducible PD marker expression profile may be up-regulated genes, down-regulated genes, or a combination of up- and down-regulated genes.
- the genes included in the IFN ⁇ -inducible PD marker expression profile may be the genes provided in Tables 19 and/or 20 and/or 21 and/or 22 and/or 23 and/or 24 and/or 26 and/or 28 and/or 30 and/or 31 and/or any of the genes identified in Figures 72 , 74 , 75 , or 77 .
- the genes included in the IFN ⁇ -inducible PD marker expression profile may consist of or comprise at least 10%, at least 20%, at least 25%, at least 30%, at least 40%, at least 50%, at least 60%, at least 75%, at least 80%, at least 85% at least 90%, at least 95%, or at least 100% of the genes provided in Tables 19 and/or 20 and/or 21 and/or 22 and/or 23 and/or 24 and/or 26 and/or 28 and/or 30 and/or 31 and/or any of the genes identified in Figures 72 , 74 , 75 , or 77 .
- the IFN ⁇ -inducible PD markers in an expression profile may include any at least 5 genes such as, for example: MX1, LLY6E, IFI27, OAS1, IFIT1; or MX1, LLY6E, IFI27, OAS1, IFI6; or MX1, LLY6E, IFI27, OAS1, IFI44L; or MX1, LLY6E, IFI27, OAS1, ISG15; or MX1, LLY6E, IFI27, OAS1, LAMP3; or MX1, LLY6E, IFI27, OAS1, OASL; or MX1, LLY6E, IFI27, OAS1, RSAD2; or MX1, LLY6E, IFI27, OAS1, IFI44; or MX1, LLY6E, IFI27, OAS1, IFIT2; or MX1, LLY6E, IFI27, OAS1, OAS3; or MX1, LLY6E, IFI27, OAS1, USP18; or MX1, L
- the IFN ⁇ -inducible PD markers in an expression profile may include any at least 6 genes such as, for example: MX1, LLY6E, IFI27, OAS1, IFIT1, IFI6; or MX1, LLY6E, IFI27, OAS1, IFIT1, IFI44L; or MX1, LLY6E, IFI27, OAS1, IFIT1, ISG15; or MX1, LLY6E, IFI27, OAS1, IFIT1, LAMP3; or MX1, LLY6E, IFI27, OAS1, IFIT1, OASL; or MX1, LLY6E, IFI27, OAS1, IFIT1, RSAD2; or MX1, LLY6E, IFI27, OAS1, IFIT1, IFI44; or MX1, LLY6E, IF127, OAS1, IFIT1, IFIT2; or MX1, LLY6E, IFI27, OAS1, IFIT1, OAS3; or MX1, LLY6E, IFI27, OAS1, IFIT
- the IFN ⁇ -inducible PD markers in an expression profile may include any at least 7 genes such as, for example: MX1, LLY6E, IFI27, OAS1, IFIT1, IFI6, IFI44L; or MX1, LLY6E, IFI27, OAS1, IFIT1, IFI6, ISG15; or MX1, LLY6E, IFI27, OAS1, IFIT1, IFI6, LAMP3; or MX1, LLY6E, IFI27, OAS1, IFIT1, IFI6, OASL; or MX1, LLY6E, IFI27, OAS1, IFIT1, IFI6, RSAD2; or MX1, LLY6E, IFI27, OAS1, IFIT1, IFI6, IFI44; or MX1, LLY6E, IFI27, OAS1, IFIT1, IFI6, IFIT2; or MX1, LLY6E, IFI27, OAS1, IFIT1, IFI6, OAS3; or MX1, LLY6E, IFI27, OAS1, I
- the IFN ⁇ -inducible PD markers in an expression profile may include any at least 8 genes such as, for example: MX1, LLY6E, IFI27, OASI, IFIT1, IFI6, IFI44L, ISG15; or MX1, LLY6E, IFI27, OAS1, IFIT1, IFI6, IFI44L, LAMP3; or MX1, LLY6E, IFI27, OAS1, IFIT1, IFI6, IFI44L, OASL; or MX1, LLY6E, IFI27, OAS1, IFIT1, IFI6, IFI44L, RSAD2; or MX1, LLY6E, IFI27, OAS1, IFIT1, IFI6, IFI44L, IFI44; or MX1, LLY6E, IFI27, OAS1, IFIT1, IFI6, IFI44L, IFIT2; or MX1, LLY6E, IFI27, OAS1, IFIT1, IFI6, IFI44L, OAS3; or MX1, LLY6E
- the IFN ⁇ -inducible PD markers in an expression profile may include any at least 12 genes such as, for example: MX1, LLY6E, IFI27, OAS1, IFIT1, IFl6, IFI44L, ISG15, LAMP3, OASL, RSAD2, IFI44; or MX1, LLY6E, IFI27, OAS1, IFIT1, IFI6, IFI44L, ISG15, LAMP3, OASL, RSAD2, IFIT2; or MX1, LLY6E, IFI27, OAS1, IFIT1, IFI6, IFI44L, ISG15, LAMP3, OASL, RSAD2, OAS3; or MX1, LLY6E, IFI27, OAS1, IFIT1, IFI6, IFI44L, ISG15, LAMP3, OASL, RSAD2, USP18; or MX1, LLY6E, IFI27, OAS1, IFIT1, IFI6, IFI44L, ISG15, LAMP3, OASL, RSAD2,
- the IFN ⁇ -inducible PD markers in an expression profile may include at least genes IFI27, SIGLEC1, RSAD2, IFI6, IFI44L, IFI44, USP18, IFIT2, SAMD9L, BIRC4BP, DNAPTP6, OAS3, LY6E, IFIT1, LIPA, LOC129607, ISG15, PARP14, MX1, OAS2, OASL, CCL2, HERC5, OAS1.
- the IFN ⁇ -inducible PD markers in such an expression profile may further include at least one or more gene listed in Table 19 and/or 20 and/or 21, and/or 22, and/or 23, and/or 24, and/or 26, and/or 28, and/or 30.
- the IFN ⁇ -inducible PD markers in an expression profile may include at least genes IFIT1, IFIT3, IRF7, IFI6, IL6ST, IRF2, LY6E, MARCKS, MX1, MX2, OAS1, EIF2AK2, ISG15, STAT2, OAS3, IFI44, IFI44L, HERC5, RAB8B, LILRA5, RSAD2, and FCHO2.
- the IFN ⁇ -inducible PD markers in such an expression profile may further include at least one or more gene listed in Table 19 and/or 20 and/or 21, and/or 22, and/or 23, and/or 24, and/or 26, and/or 28 and/or 30.
- the IFN ⁇ -inducible PD markers in an expression profile may include at least genes SERVING1, IFIT2, IFIT3, IFI6, LY6E, MX1, OAS1, ISG15, IFI27, OAS3, IFI44, LAMP3, DNAPTP6, ETV7, HERC5, OAS2, USP18, XAF1, RTP4, SIGLEC1, and EPSTI1.
- the IFN ⁇ -inducible PD markers in such an expression profile may further include at least one or more gene listed in Table 19 and/or 20 and/or 21, and/or 22, and/or 23, and/or 24, and/or 26, and/or 28 and/or 30.
- the IFN ⁇ -inducible PD markers in an expression profile may include at least genes SERPING1, IFIT2, IFIT3, IFI6, LY6E, MX1, OAS1, ISG15, IFI27, OAS3, IFI44, LAMP3, DNAPTP6, ETV7, HERC5, OAS2, USP18, XAF1, RTP4, SIGLEC1, EPSTI1, and RSAD2.
- the IFN ⁇ -inducible PD markers in such an expression profile may further include at least one or more gene listed in Table 19 and/or 20 and/or 21, and/or 22, and/or 23, and/or 24, and/or 26, and/or 28 and/or 30.
- the IFN ⁇ -inducible PD markers in an expression profile may include at least genes BCL2, BAK1, BAD, BAX, and BCL2L1.
- the IFN ⁇ -inducible PD markers in such an expression profile may further include at least one or more gene listed in Table 19 and/or 20 and/or 21, and/or 22, and/or 23, and/or 24, and/or 26, and/or 28 and/or 30.
- the IFN ⁇ -inducible PD markers in an expression profile may include at least genes RTP4, RSAD2, HERC5, SIGLEC1, USP18, LY6E, ETV7, SERPING1, IFIT3, OAS1, HSXIAPAF1, G1P3, MX1, OAS3, IFI27, DNAPTP6, LAMP3, EPSTI1, IFI44, OAS2, IFIT2, and ISG 15.
- the IFN ⁇ -inducible PD markers in such an expression profile may further include at least one or more gene listed in Table 19 and/or 20 and/or 21, and/or 22, and/or 23, and/or 24, and/or 26, and/or 28 and/or 30.
- the IFN ⁇ -inducible PD markers in an expression profile may include at least genes LAMP3, SIGLEC1, DNAPTP6, IFIT2, ETV7, RTP4, SERPRNG1, HERC5, XAF1, MX1, EPSTI1, OAS2, OAS1, OAS3, IFIT3, IFI6, USP18, RSAD2, IFI44, LY6E, ISG15, and IFI27.
- the IFN ⁇ -inducible PD markers in such an expression profile may further include at least one or more gene listed in Table 19 and/or 20 and/or 21, and/or 22, and/or 23, and/or 24, and/or 26, and/or 28 and/or 30.
- the IFN ⁇ -inducible PD markers in an expression profile may include at least genes DNAPTP6, EPSTI1, HERC5, IFI27, IFI44, IFI44L, IFI6, IFIT1, IFIT3, ISG15, LAMP3, LY6E, MX1, OAS1, OAS2, OAS3, PLSCR1, RSAD2, RTP4, SIGLEC1, and USP18.
- the IFN ⁇ -inducible PD markers in such an expression profile may further include at least one or more gene listed in Table 19 and/or 20 and/or 21, and/or 22, and/or 23, and/or 24, and/or 26, and/or 28 and/or 30.
- the IFN ⁇ -inducible PD markers in an expression profile may include at least genes SAMD9L, IFI6, IFI44, IFIT2, ZC3HAV1, ETV6, DAPP1, ILIRN, CEACAM1, OAS1, IFI27, OAS3, IFI44L, HERC5, IFIT1, EPSTI1, ISG15, SERPING1 , OASL, GBP1, and MX1.
- the IFN ⁇ -inducible PD markers in such an expression profile may further include at least one or more gene listed in Table 19 and/or 20 and/or 21, and/or 22, and/or 23, and/or 24, and/or 26, and/or 28 and/or 30.
- the IFN ⁇ -inducible PD markers in an expression profile may include at least genes IFI6, RSAD2, IFI44, IFI44L, IFI27, MX1, IFIT1, ISG15, LAMP3, OAS3, OAS1, EPSTI1, IFIT3, OAS2, SIGLEC1, and USP18.
- the IFN ⁇ -inducible PD markers in such an expression profile may further include at least one or more gene listed in Table 19 and/or 20 and/or 21, and/or 22, and/or 23, and/or 24, and/or 26, and/or 28 and/or 30.
- the IFN ⁇ -inducible PD markers in an expression profile may include at least genes IFI6, RSAD2, IFI44, IFI44L, IFI27, MX1, IFIT1, HERC5, ISG15, LAMP3, OAS3, OAS1, EPSTI1, IFIT3, OAS2, LY6E, SIGLEC1, and USP18.
- the IFN ⁇ -inducible PD markers in such an expression profile may further include at least one or more gene listed in Table 19 and/or 20 and/or 21, and/or 22, and/or 23, and/or 24, and/or 26, and/or 28 and/or 30.
- the IFN ⁇ -inducible PD markers in an expression profile may include at least genes IF16, RSAD2, IFI44, IFI44L, IFI27, MX1, and IFIT1.
- the IFN ⁇ -inducible PD markers in such an expression profile may further include at least one or more gene listed in Table 19 and/or 20 and/or 21, and/or 22, and/or 23, and/or 24, and/or 26, and/or 28 and/or 30.
- the IFN ⁇ -inducible PD markers in an expression profile may include at least genes IFI6, RSAD2, IFI44, IFI44L, and IFI27.
- the IFN ⁇ -inducible PD markers in such an expression profile may further include at least one or more gene listed in Table 19 and/or 20 and/or 21, and/or 22, and/or 23, and/or 24, and/or 26, and/or 28 and/or 30.
- the IFN ⁇ -inducible PD markers in an expression profile may include at least genes SAMD9L, IFI6, IFI44, IFIT2, OAS1, IFI27, OAS3, IFI44L, HERC5, IFIT1, EPSTI1, ISG15, SERPING1, OASL, GBP1, and MX1.
- the IFN ⁇ -inducible PD markers in such an expression profile may further include at least one or more gene listed in Table 19 and/or 20 and/or 21, and/or 22, and/or 23, and/or 24, and/or 26, and/or 28 and/or 30.
- the IFN ⁇ -inducible PD markers in an expression profile may include at least genes IFI27, IL-121R beta2, IL-15R alpha, IL-15, suppressor of cytokine signaling 1 (SOCS1), janus kinase 2, CXCL11 (T-TAC), TNFSF13B (BAFF), TRAF-type domain 1 (TRAFD1), SERVING1, CD274 (PD1-L), indoleamine 2,3 dioxygenase (INDO), lymphocyte-activation gene 3 (LAG3), and caspase 5.
- the IFN ⁇ -inducible PD markers in such an expression profile may further include at least one or more gene listed in Table 19 and/or 20 and/or 21, and/or 22, and/or 23, and/or 24, and/or 26, and/or 28 and/or 30.
- the IFN ⁇ -inducible PD markers in an expression profile may include at least genes complement factor B, insulin-like growth factor (IGF2BP3), cyclin A1, neuropilin 2, complement 1qB, complement 1qC, CD80, CD47, MMP14, toll-like receptor 3 (TLR3), TLR adaptor molecule 2 (TICAM2), macrophage scavenger receptor-1 (MSR1), desmoplakin, PDGR receptor, CCL13 (MCP-4), CXCL13 (BCA-1), CCL19 (CCR7), IL-1 family 5, purinergic receptor P2X7, IRS1, caspase 3, and cyclin-dependent kinase-like 1 (CDKL1).
- the IFN ⁇ -inducible PD markers in such an expression profile may further include at least one or more gene listed in Table 19 and/or 20 and/or 21, and/or 22, and/or 23, and/or 24, and/or 26, and/or 28 and/or 30.
- the IFN ⁇ -inducible PD markers in an expression profile may include alterations in any one or more of serum protein levels of adiponectin, alpha-fetoprotein, apolipoprotein CIII, beta-2 microglobulin, cancer antigen 125, cancer antigen 19-9, eotaxin, FABP, factor Vll, ferritin, IL-10, IL-12p70, IL-16, IL-18, IL-1ra, IL-3, MCP-1, MMP-3, myoglobin, SGOT, tissue factor, TIMP-1, TNF RII, TNF-alpha, VCAM-1, vWF, BDNK, complement 3, CD40 ligand, EGF, ENA-78, EN-RAGE, IGF-1, MDC, myeloperoxidase, RANTES, or thrombopoietin.
- the IFN ⁇ -inducible PD markers in an expression profile may include alterations in any one or more of serum protein levels of adiponectin, alpha-fetoprotein, apolipoprotein CIII, beta-2 microglobulin, cancer antigen 125, cancer antigen 19-9, eotaxin, FABP, factor VII, ferritin, IL-10, IL-12p70, IL-16, IL-18, IL-1 ra, IL-3, MCP-1, MMP-3, myoglobin, SGOT, tissue factor, TIMP-1, TNF RII, TNF-alpha, VCAM-1, or vWF.
- the IFN ⁇ -inducible PD markers in such an expression profile may further include at least one or more gene listed in Table 19 and/or 20 and/or 21, and/or 22, and/or 23, and/or 24, and/or 26, and/or 28 and/or 30.
- the IFN ⁇ -inducible PD markers in an expression profile may include alterations in any one or more of serum protein levels of BDNK, complement 3, CD40 ligand, EGF, ENA-78, EN-RAGE, IGF-1, MDC, myeloperoxidase, RANTES, or thrombopoietin.
- the IFN ⁇ -inducible PD markers in such an expression profile may further include at least one or more gene listed in Table 19 and/or 20 and/or 21, and/or 22, and/or 23, and/or 24, and/or 26, and/or 28 and/or 30.
- An IFN ⁇ -inducible PD marker expression profile may further include genes whose expression or activity is down-regulated in cells exposed to non-baseline IFN ⁇ levels.
- the genes whose expression or activity is down-regulated may be any of the genes that are identified in Table 31.
- the genes may include any one or more of SLC4A1, PRSS33, FCER1A, BACH2, KERB1, D4S234E, T cell receptor alpha locus/T cell receptor delta locus, FEZ1, AFF3, CD160, ABCB1, PTCH1, OR2W3, IGHD, NOG, NR3C2, TNS1, PDZK1IP1, SH2D1B, STRBP, ZMYND11, TMOD1 , FCRLA, DKFZp761P0423, EPB42, NR6A1, LOC341333, MS4A1, IGHM, SIGLECP3, KIR2DS2, PKIA, BLR1, C5orf4, MYLK, LOC283663, MAD
- any number of these genes may serve as PD markers in an IFN ⁇ -inducible PD marker expression profile. For example, at least 2, at least 3, at least 4, at least 5, at least 6, at least 7, at least 8, at least 9, at least 10, at least 11, at least 12 at least 15, at least 20, at least 25, at least 30, at least 35, at least 40, at least 45, or at least 50 down-regulated genes may be included in the IFN ⁇ -inducible PD marker expression profile.
- the IFN ⁇ -inducible PD marker expression profile may further include genes listed in Tables 19 and/or 20 and/or 21 and/or 22 and/or 23 and/or 24 and/or 26 and/or 28.
- the IFN ⁇ -inducible PD marker expression profile may include gene FEZ1, or may include genes FEZ1 and NOG, or may include gene NOG, or may include genes FEZ1, NOG, and SLC4A1, or may include gene SLC4A1, or may include genes NOG and SLC4A1, or may include genes FEZ1, NOG, SLC4A1, and D4S234E, or may include genes FEZ1, NOG, SLC4A1, D4S234E, and PRSS33.
- the IFN ⁇ -inducible PD marker expression profile may further include genes listed in Tables 19 and/or 20 and/or 21 and/or 22 and/or 23 and/or 24 and/or 26 and/or 28 and/or 30, and/or 31.
- Down-regulated genes may have down-regulated expression or activity of at least 5%, at least 10%, at least 15%, at least 20%, at least 25%, at least 30%, at least 35%, at least 40%, at least 45%, at least 50%, at least 55%, at least 60%, at least 65%, at least 70%, at least 75%, at least 80%, at least 85%, at least 90%, at least 95%, at least 96%, at least 97%, at least 98%, or at least 99% that of control cells, e.g., cells of healthy volunteers or cells of control animals or cells not exposed to IFN ⁇ in culture.
- control cells e.g., cells of healthy volunteers or cells of control animals or cells not exposed to IFN ⁇ in culture.
- Up- or down-regulation of gene expression or activity of IFN ⁇ -inducible PD markers may be determined by any means known in the art. For example, up- or down-regulation of gene expression may be detected by determining mRNA levels. mRNA expression may be determined by northern blotting, slot blotting, quantitative reverse transcriptase polymerase chain reaction, or gene chip hybridization techniques. See U.S. Pat. Nos. 5,744,305 and 5,143,854 for examples of making nucleic acid arrays for gene chip hybridization techniques.
- Up- or down-regulation of gene expression or activity of IFN ⁇ -inducible PD markers may be determined by detecting protein levels.
- the up- or down-regulated gene whose protein levels are detected may be any one, any two, any three, any four, any five, any six, any seven, any eight, any nine, any ten, any twelve, any fifteen, any twenty, any twenty five, any thirty, any thirty five, or more of adiponectin, alpha-fetoprotein, apolipoprotein CIII, beta-2 microglobulin, cancer antigen 125, cancer antigen 19-9, eotaxin, FABP, factor VII, ferritin, IL-10, IL-12p70, IL-16, IL-18, IL-1ra, IL-3, MCP-1, MMP-3, myoglobin, SGOT, tissue factor, TIMP-1, TNF RII, TNF-alpha, VCAM-1, vWF, BDNK, complement 3, CD40 ligand, EGF, ENA-78
- An IFN ⁇ -inducible PD marker expression profile may comprise a profile of protein activity.
- Up- or down-regulation of gene expression or activity of IFN ⁇ -inducible PD markers may be determined by detecting activity of proteins including, but not limited to, detectable phosphorylation activity, de-phosphorylation activity, or cleavage activity.
- up- or down-regulation of gene expression or activity of IFN ⁇ -inducible PD markers may be determined by detecting any combination of these gene expression levels or activities.
- a candidate therapeutic for treating IFN ⁇ -mediated disorders may be identified by the methods encompassed by the invention.
- Candidate therapeutics may be any type of molecule including a small molecule or a biological agent.
- a candidate therapeutic identified by the methods encompassed by the invention may immediately be identified as useful as a therapeutic for a disease, disorder, or condition.
- a candidate therapeutic identified by the methods encompassed by the invention may need to be further tested and/or modified before selection 'for treating patients.
- a candidate therapeutic identified by the methods encompassed by the invention may, after further testing, be deselected as a molecule for treating patients.
- cells comprising an IFN ⁇ -inducible PD marker expression profile are contacted with an agent.
- the cells may be any type of cells, such as commercially available immortalized cell lines that comprise an IFN ⁇ -inducible PD marker expression profile, commercially available immortalized cell lines that have been treated with IFN ⁇ to induce an IFN ⁇ -inducible PD marker expression profile, cells isolated from a patient having an IFN ⁇ -inducible PD marker expression profile, or cells isolated from a healthy patient and treated with IFN ⁇ to induce an IFN ⁇ -inducible PD marker expression profile.
- Presence or absence of a change in the IFN ⁇ -inducible PD marker expression profile of the cells is detected following contacting the cells with the agent.
- Presence of change may be any change in IFN ⁇ -inducible PD marker expression profile including at least a 10% decrease in up-regulated expression or activity of at least 1 gene in the IFN ⁇ -inducible PD marker expression profile, at least a 20% decrease of the at least 1 up-regulated gene, at least a 30% decrease of the at least up-regulated 1 gene, at least a 40% decrease of the at least 1 up-regulated gene, at least a 50% decrease of the at least 1 up-regulated gene, at least a 60% decrease of the at least 1 up-regulated gene, at least a 70% decrease of the at least I up-regulated gene, at least a 75% decrease of the at least 1 up-regulated gene, at least an 80% decrease of the at least 1 up-regulated gene, at least an 85% decrease of the at least 1 up-regulated gene, at least a 90% decrease of the at least I up-regulated gene,
- presence of change may be any change in IFN ⁇ -inducible PD marker expression profile including at least a 10% increase in expression or activity of at least I down-regulated gene in the IFN ⁇ -inducible PD marker expression profile, at least a 20% increase of the at least 1 down-regulated gene, at least a 30% increase of the at least 1 down-regulated gene, at least a 40% increase of the at least 1 down-regulated gene, at least a 50% increase of the at least I down-regulated gene, at least a 60% increase of the at least 1 down-regulated gene, at least a 70% increase of the at least I down-regulated gene, at least a 75% increase of the at least 1 down-regulated gene, at least an 80% increase of the at least 1 down-regulated gene, at least an 85% increase of the at least 1 down-regulated gene, at least a 90% increase of the at least 1 down-regulated gene, at least a 95% increase of the at least I down-regulated gene, at least a 96% increase of the at least 1 down-regulated gene
- samples from the patient may be obtained before and after administration of an agent, e.g., an agent that binds to and modulates type I IFN or IFN ⁇ activity, or an agent that binds to and does not modulate type I IFN or IFN ⁇ activity, or a combination of agents that may or may not include an agent that binds to and modulates type I IFN or IFN ⁇ activity.
- an agent e.g., an agent that binds to and modulates type I IFN or IFN ⁇ activity, or an agent that binds to and does not modulate type I IFN or IFN ⁇ activity, or a combination of agents that may or may not include an agent that binds to and modulates type I IFN or IFN ⁇ activity.
- Type I IFN or IFN ⁇ inducible PD marker expression profiles are obtained in the (before and after agent administration) samples. The type I IFN or IFN ⁇ inducible PD marker expression profiles in the samples are compared.
- Comparison may be of the number of type I IFN or IFN ⁇ inducible PD markers present in the samples or may be of the quantity of type I IFN or IFN ⁇ inducible PD markers present in the samples, or any combination thereof.
- Variance indicating efficacy of the therapeutic agent may be indicated if the number or level (or any combination thereof) of up-regulated type I IFN or IFN ⁇ inducible PD markers decreases in the sample obtained after administration of the therapeutic agent relative to the sample obtained before administration of the therapeutic agent.
- the number of up-regulated type I IFN or IFN ⁇ inducible PD markers may decrease by at least 1, at least 2, at least 3, at least 4, at least 5, at least 6, at least 7, at least 8, at least 9, or at least 10.
- the level of any given up-regulated type I IFN or IFN ⁇ inducible PD marker may decrease by at least 10%, at least 20%, at least 25%, at least 30%, at least 35%, at least 40%, at least 50%, at least 60%, at least 70%, at least 80%, at least 90%, or at least 95%.
- the number of up-regulated type I IFN or IFN ⁇ inducible PD markers with decreased levels may be at least 1, at least 2, at least 3, at least 4, at least 5, at least 6, at least 7, at least 8, at least 9, at least 10, at least 15, at least 20, at least 25, at least 30, or at least 35. Any combination of decreased number and decreased level of up-regulated type I IFN or IFN ⁇ inducible PD markers may indicate efficacy.
- Variance indicating efficacy of the therapeutic agent may be indicated if the number or level (or any combination thereof) of down-regulated type I IFN or IFN ⁇ inducible PD markers decreases in the sample obtained after administration of the therapeutic agent relative to the sample obtained before administration of the therapeutic agent.
- the number of down-regulated type I IFN or IFN ⁇ inducible PD markers may decrease by at least 1, at least 2, at least 3, at least 4, at least 5, at least 6, at least 7, at least 8, at least 9, or at least 10.
- the level of any given down-regulated type I IFN or IFN ⁇ inducible PD marker may increase by at least 10%, at least 20%, at least 25%, at least 30%, at least 35%, at least 40%, at least 50%, at least 60%, at least 70%, at least 80%, at least 90%, or at least 95%.
- the number of down-regulated type I IFN or IFN ⁇ inducible PD markers with increased levels may be at least 1, at least 2, at least 3, at least 4, at least 5, at least 6, at least 7, at least 8, at least 9, at least 10, at least 15, at least 20, at least 25, at least 30, or at least 35. Any combination of decreased number and increased level of down-regulated type I IFN or IFN ⁇ inducible PD markers may indicate efficacy.
- the sample obtained from the patient may be obtained prior to a first administration of the agent, i.e., the patient is naive to the agent.
- the sample obtained from the patient may occur after administration of the agent in the course of treatment.
- the agent may have been administered prior to the initiation of the monitoring protocol.
- an additional samples may be obtained from the patient and type I IFN or IFN ⁇ inducible PD markers in the samples are compared.
- the samples may be of the same or different type, e.g., each sample obtained may be a blood sample, or each sample obtained may be a serum sample.
- the type I IFN or IFN ⁇ inducible PD markers detected in each sample may be the same, may overlap substantially, or may be similar.
- the samples may be obtained at any time before and after the administration of the therapeutic agent.
- the sample obtained after administration of the therapeutic agent may be obtained at least 2, at least 3, at least 4, at least 5, at least 6, at least 7, at least 8, at least 9, at least 10, at least 12, or at least 14 days after administration of the therapeutic agent.
- the sample obtained after administration of the therapeutic agent may be obtained at least 2, at least 3, at least 4, at least 5, at least 6, at least 7, or at least 8 weeks after administration of the therapeutic agent.
- the sample obtained after administration of the therapeutic agent may be obtained at least 2, at least 3, at least 4, at least 5, or at least 6 months following administration of the therapeutic agent.
- Additional samples may be obtained from the patient following administration of the therapeutic agent.
- At least 2, at least 3, at least 4, at least 5, at least 6, at least 7, at least 8, at least 9, at least 10, at least 12, at least 15, at least 20, at least 25 samples may be obtained from the patient to monitor progression or regression of the disease or disorder over time.
- Disease progression may be monitored over a time period of at least 1 week, at least 2 weeks, at least 3 weeks, at least 4 weeks, at least 5 weeks, at least 6 weeks, at least 7 weeks, at least 2 months, at least 3 months, at least 4 months, at least 5 months, at least 6 months, at least I year, at least 2 years, at least 3 years, at least 4 years, at least 5 years, at least 10 years, or over the lifetime of the patient.
- Additional samples may be obtained from the patient at regular intervals such as at monthly, bi-monthly, once a quarter year, twice a year, or yearly intervals.
- the samples may be obtained from the patient following administration of the agent at regular intervals. For instance, the samples may be obtained from the patient at one week following each administration of the agent, or at two weeks following each administration of the agent, or at three weeks following each administration of the agent, or at one month following each administration of the agent, or at two months following each administration of the agent.
- multiple samples may be obtained from the patient following an or each administration of the agent.
- Disease progression in a patient may similarly be monitored in the absence of administration of an agent.
- Samples may periodically be obtained from the patient having the disease or disorder.
- Disease progression may be identified if the number of type I IFN or IFN ⁇ inducible PD markers increases in a later-obtained sample relative to an earlier obtained sample.
- the number of type I IFN or IFN ⁇ inducible PD markers may increase by at least 1, at least 2, at least 3, at least 4, at least 5, at least 6, at least 7, at least 8, at least 9, or at least 10.
- Disease progression may be identified if level of any given up-regulated type I IFN or IFN ⁇ inducible PD marker increases by at least 10%, at least 20%, at least 25%, at least 30%, at least 35%, at least 40%, at least 50%, at least 60%, at least 70%, at least 80%, at least 90%, or at least 95%.
- Disease progression may be identified if level of any given down-regulated type I IFN or IFN ⁇ inducible PD marker decreases by at least 10%, at least 20%, at least 25%, at least 30%, at least 35%, at least 40%, at least 50%, at least 60%, at least 70%, at least 80%, at least 90%, or at least 95%.
- the number of up-regulated type I IFN or IFN ⁇ inducible PD markers with increased levels may be at least 1, at least 2, at least 3, at least 4, at least 5, at least 6, at least 7, at least 8, at least 9, at least 10, at least 15, at least 20, at least 25, at least 30, or at least 35.
- the number of down-regulated type I IFN or IFN ⁇ inducible PD markers with decreased levels may be at least 1, at least 2, at least 3, at least 4, at least 5, at least 6, at least 7, at least 8, at least 9, at least 10, at least 15, at least 20, at least 25, at least 30, or at least 35. Any combination of increased number and increased level of up-regulated type I IFN or IFN ⁇ inducible PD marker may indicate disease progression.
- any combination of decreased number and decreased level of down-regulated type I IFN or IFN ⁇ inducible PD marker may indicate disease progression.
- Disease regression may also be identified in a patient having a disease or disorder, not treated by an agent. In this instance, regression may be identified if the number of type I IFN or IFN ⁇ inducible PD markers decreases in a later-obtained sample relative to an earlier obtained sample.
- the number of type I IFN or IFN ⁇ inducible PD markers may decrease by at least I, at least 2, at least 3, at least 4, at least 5, at least 6, at least 7, at least 8, at least 9, or at least 10.
- Disease regression may be identified if level of any given up-regulated type I IFN or IFN ⁇ inducible PD marker decreases by at least 10%, at least 20%, at least 25%, at least 30%, at least 35%, at least 40%, at least 50%, at least 60%, at least 70%, at least 80%, at least 90%, or at least 95%.
- Disease regression may be identified if level of any given down-regulated type I IFN or IFN ⁇ inducible PD marker increases by at least 10%, at least 20%, at least 25%, at least 30%, at least 35%, at least 40%, at least 50%, at least 60%, at least 70%, at least 80%, at least 90%, or at least 95%.
- the number of up-regulated type I IFN or IFN ⁇ inducible PD markers with decreased levels may be at least 1, at least 2, at least 3, at least 4, at least 5, at least 6, at least 7, at least 8, at least 9, at least 10, at least 15, at least 20, at least 25, at least 30, or at least 35.
- the number of down-regulated type I IFN or IFN ⁇ inducible PD markers with increased levels may be at least 1, at least 2, at least 3, at least 4, at least 5, at least 6, at least 7, at least 8, at least 9, at least 10, at least 15, at least 20, at least 25, at least 30, or at least 35.
- Disease progression or disease regression may be monitored by obtaining samples over any period of time and at any interval.
- Disease progression or disease regression may be monitored by obtaining samples over the course of at least 1 week, at least 2 weeks, at least 3 weeks, at least 4 weeks, at least 5 weeks, at least 6 weeks, at least 7 weeks, at least 2 months, at least 3 months, at least 4 months, at least 5 months, at least 6 months, at least I year, at least 2 years, at least 3 years, at least 4 years, at least 5 years, at least 10 years, or over the lifetime of the patient.
- Disease progression or disease regression may be monitored by obtaining samples at least monthly, bi-monthly, once a quarter year, twice a year, or yearly. The samples need not be obtained at strict intervals.
- the invention also encompasses kits and probes.
- the probes may be any molecule that detects any expression or activity of any gene that may be included in an IFN ⁇ -inducible PD marker expression profile.
- the invention also encompasses methods of detecting IFN activity. These methods may employ cells comprising a polynucleotide sequence comprising a reporter gene under the control of an interferon-stimulated response element.
- the cells comprising the polynucleotide sequence may be any cells amenable to transfection or transformation with a polynucleotide sequence and that can be maintained in culture. These cells include animal cells, bacterial cells, yeast cells, insect cells, or plant cells. These cells may be adherent or may grow in suspension.
- the cells are animal cells, they may be from a known cell line such as HeLa, COS, NIH3T3, AGS, 293, CHO, Huh-7, HUVEC, MCF-7, C6, BHK-21, BNL CL 2, C2C12, HepG2, and ATDC5. Countless other cell lines are known and can be obtained by those of skill in the art.
- the cells may alternatively be primary cells that have or have not been immortalized.
- the cells may comprise a polynucleotide sequence comprising a reporter gene under the control of an interferon-stimulated response element.
- the polynucleotide sequence may be stably integrated in the DNA of the cell or may be an extrachomosomal element that is stably or transiently in the cell.
- the polynucleotide may have been introduced to the cell as a naked polynucleotide molecule, a polynucleotide molecule complexed with lipids or other molecules, or a polynucleotide in a virus particle.
- the polynucleotide may have been a linear or a circular molecule.
- Non-limiting examples of circular polynucleotide molecules include plasmids, and artificial chromosomes. These vectors may be cleaved with enzymes, for example, to generate linear polynucleotide molecules.
- the polynucleotide was introduced as a naked polynucleotide it may have been introduced into the cells by any of many well known techniques in the art. These techniques include, but are not limited to, electroporation, microinjection, and biolistic particle delivery. See, also, e.g ., Loeffler and Behr, 1993, Meth. Enzymo/. 217:599-618 ; Cohen et al., 1993, Meth. Enzymol. 217:618-644 ; Clin. Pharma. Ther. 29:69-92 (1985 ), Sambrook, et al. Molecular Cloning: A Laboratory Manual.
- Lipids or liposomes comprise a mixture of fat particles or lipids which bind to DNA or RNA to provide a hydrophobic coated delivery vehicle.
- Suitable liposomes may comprise any of the' conventional synthetic or natural phospholipid liposome materials including phospholipids from natural sources such as egg, plant or animal sources such as phosphatidylcholine, phosphatidylethanolamine, phosphatidylglycerol, sphingomyelin, phosphatidylserine or phosphatidylinositol.
- Synthetic phospholipids also may be used, e.g., dimyristoylphosphatidylcholine, dioleoylphosphatidylcholine, dioleoylphosphatidycholine and corresponding synthetic phosphatidylethanolamines and phosphatidylglycerols.
- Lipids or liposomes that may be conjugated with the vector are also commercially available to the skilled artisan.
- lipid or liposome transfection reagents examples include LIPOFECTAMINETM (Invitrogen), GENEJUICE® (Novagen), GENEJAMMER® (Stratagene), FUGENE® HD (Roche), MEGAFECTINTM (Qbiogene), SUPERFECT® (Qiagen), and EFFECTENE® (Qiagen).
- polynucleotide was introduced as a complex with other molecule it may have been compacted or in a nanosphere.
- Compacted polynucleotide complexes are described in U.S. Patents 5,972,901 , 6,008,336 , and 6,077,835 .
- Nanospheres are described in U.S. Patent Nos. 5,718,905 and 6,207,195 .
- These compacted polynucleotide complexes and nanospheres that complex nucleic acids utilize polymeric cations. Typical polymeric cations include gelatin, poly-L-lysine, and chitosan.
- the polynucleotide may have been complexed with DEAE-dextran, or transfected using techniques such as calcium phosphate coprecipitation, or calcium chloride coprecipitation.
- the virus may have been any well known suitable virus for polynucleotide delivery.
- Example viruses that may be used as vectors include adenovirus, adeno-associated virus, lentivirus, retrovirus, herpes virus (e.g. herpes simplex virus), vaccina virus, papovirus, Sendai virus, SV40 virus, respiratory syncytial virus, etc.
- the polynucleotide sequence may include a reporter gene and an interferon-stimulated response element.
- the reporter gene may be any one of luciferase, chloramphenicol acetyl transferase, ⁇ -galactosidase, green fluorescent protein, ⁇ -glucuronidase, or secreted placental alkaline phosphatase. Variations of many of these reporter genes, e.g ., green fluorescent protein and luceriferase, are known and can be readily identified and/or produced by those of skill in the art. Other reporter genes in addition to those listed will also be known to those of skill in the art and are readily available. Interferon-stimulated response elements are also known to those of skill in the art.
- the cells employed in the assay may be incubated with a sample.
- the sample may be obtained from a patient, from a vendor with patient samples, or a control sample used for calibration or as a control. If the sample is obtained from a patient it may be any biological fluid or tissue, such as whole blood, saliva, urine, synovial fluid, bone marrow, cerebrospinal fluid, nasal secretions, sputum, amniotic fluid, bronchoalveolar lavage fluid, peripheral blood mononuclear cells, total white blood cells, lymph node cells, spleen cells, tonsil cells, or skin.
- biological fluid or tissue such as whole blood, saliva, urine, synovial fluid, bone marrow, cerebrospinal fluid, nasal secretions, sputum, amniotic fluid, bronchoalveolar lavage fluid, peripheral blood mononuclear cells, total white blood cells, lymph node cells, spleen cells, tonsil cells, or skin.
- Expression of the reporter gene is detected by any well known means in the art. The expression, even if "0" indicates IFN activity in the sample. One of skill in the art may further quantitate any level of expression of the reporter gene which may then correlate to level of IFN activity in the sample.
- Example 1a Initial Identification of Up-Regulated Genes in Lupus Patients
- Gene expression in whole blood of 5 (2 cutaneous and 3 severe) lupus patients and 5 healthy volunteers was profiled using Affymetrix whole genome array technology and qPCR validation. Gene expression fold-change values were determined by calculating the log 2 signal intensity difference between individual lupus patient samples and the mean log 2 signal intensity for the 5 healthy donor samples. 118 genes were identified as up-regulated by at least 2-fold in whole blood of all 5 lupus patients relative to the healthy volunteers.
- Table I provides a summary for 71 of the 118 annotated genes identified as up-regulated by at least 2-fold in all 5 lupus patients.
- Table 2 provides the fold-up-regulation in gene expression for a subset of the 118 genes for each of the five lupus patients relative to the healthy volunteers.
- Table 2 also provides a comparison between fold-change values determined on two unique platforms (Affy GeneChip and TaqMan (i.e. qPCR)).
- Table 2 Up-Regulation in Gene Expression for a Set of Genes for each of Five Lupus Patients Probe_ID Gene Symbol I29KHR.SLE (TaqMan) I29KHR.S LE (Affy) RH33XR.SLE (TaqMan) RH33XR.S LE (Affy) J9SSR (Ta OJ9SSR (A 499R (Ta 4499R (A 4126CR(Ta aMI)26CR(AA 228220_at FCHO2 3.24 39.86 3.30 76.15 33.05 84.86 22.36 35.07 17.77 10.61 205483_s_at G1P3 86.13 146.74 80.55 92.15 4.45 7.83 2.90 5.45 5.06 12.71 212195_at IL6ST 3.87 9.18 3.63 27.52 6.60 9.73 4.95 10.70 2.35 6.14 203275_at IRF2 8.10 6.46 5.00 4.80 5.07 6.54 4.12 4.32 2.44 4.66 1555643
- Example 1a Validation of Genes Identified as Up-Regulated Genes in Lupus Patients
- the Affymetrix Human Genome U133 Plus 2.0 GeneChip ® array platform was used to profile WB from 46 SLE patients and WB from 24 age- and sex-matched healthy donors. It was observed that 245 and 77 probe sets were upregulated and downregulated, respectively, in WB of SLE patients compared with that from healthy control donors.
- Table 30 lists the 50 most upregulated probe sets in WB of these SLE patients; 76% of them are type I IFN inducible. Table 30 also lists the prevalence of the overexpression of these genes in WB of SLE patients. The majority of these genes are overexpressed by at least 2-fold in 65% to 80% of the patients profiled. The robust and prevalent overexpression of a large number of type I IFN-inducible genes in SLE patients suggests that they might be suitable PD markers for clinical trials that investigate an anti-IFN- ⁇ mAb therapy for SLE.
- Table 30 50 most upregulated probe sets in whole blood of SLE patients Probe ID Gene Title Gene Symbol log 2 fc q Value (FDR) Prevalence 202411_at interferon, alpha-inducible protein 27 IFI27 4.60 8.41E-07 73.91 219519_s_at sialic acid binding Ig-like lectin 1, sialoadhesin SIGLEC1 3.52 7.28E-07 65.22 214059_at Interferon-induced protein 44 IFI44 3.51 8.04E-07 73.91 213797_at radical S-adenosyl methionine domain containing 2 RSAD2 3.29 9.86E-06 71.74 204415_at interferon, alpha-inducible protein 6 IFI6 3.21 2.25E-09 82.61 242625_at radical S-adenosyl methionine domain containing 2 RSAD2 3.19 1.55E-06 69.57 204439_at interferon-induced protein 44-like I
- Figure 80 shows a heat map of the expression of the 114 upregulated type I IFN-inducible probe sets in SLE patients and healthy controls. A total of 32/46 of the SLE patients profiled showed significant overexpression of the type I IFN gene signature. To confirm the observation that type I IFN-inducible genes are overexpressed in WB of SLE patients, WB was procured from 54 SLE patients in a prospective study.
- Figure 81A shows the PCA plot of the 46 SLE patients in the first study using the 114 overexpressed type I IFN-inducible probes. A clear difference was observed between SLE patients that had distinct overexpression of type I IFN gene signature from healthy donors and SLE patients that had weak or nondetectable type I IFN gene signature in WB.
- Figure 81B shows the PCA plot from the 54 SLE patients in the prospective study using the same 114 type I IFN-inducible probe sets identified. A similar separation of SLE patients was observed based on type 1 IFN gene signature as in Figure 81A . The distribution of the type I IFN gene signature scores in the prospective study was also similar to that of the first study (data not shown). The ability to use the overexpressed type I IFN-inducible genes identified to segregate SLE patients into 2 distinct groups-patients with or without type I IFN gene signature-validated the accurate identification of overexpression in the type I IFN gene signature in WB of SLE patients.
- the granulocyte gene signature included (but was not limited to) the following genes: AZU, DEFA1, DEFA4, ELA2, MMP8, MMP9, RNAS2, MPO, CAMP, FCAR, and CYBB ( Figure 80 , second panel).
- the granulocyte gene signature was present in about 50% of the SLE patients profiled.
- the 50 most downregulated probe sets observed in WB of SLE patients are shown in Table 31.
- the downregulation of T, NK, and B cell gene signatures was observed in WB of SLE patients ( Figure 80 , panels three, four, and five, respectively); this is in agreement with the observation of lymphopenia in SLE patients previously reported in the literature ( Bennett L, Palucka AK, Arce E et al.: Interferon and granulopoiesis signatures in systemic lupus erythematosus blood. J Exp Med. 197(6), 711-723 (2003 ), Rivero SJ, Diaz-Jouanen E and Alarcon-Segovia D: Lymphopenia in systemic lupus erythematosus.
- Example 2 Potential PD Markers Selected from Genes Up-Restated in Lupus Patients
- Example 3 Using the whole genome profiling data described in Example 1a, a group of candidate PD markers were selected. These candidate markers are provided in Table 3.
- Example 3 Candidate PD Markers Exhibit Minimal Variation in Healthy Donors
- Example 4 IFN ⁇ Stimulates Up-Regulation in Expression of Candidate PD Markers in Whole Blood of Healthy Volunteers
- Whole blood of healthy volunteers was collected in heparinized tubes, transferred to the appropriate wells of 6-well culture plates, and incubated with leukocyte IFN doses of 3, 30, 100, and 300 I.U. and then incubated for 4 hours at 37"C, 5% CO 2 .
- Fold-induction of expression of candidate PD markers for genes IFI44, IRF2, RSAD2, GIP3, and HERC5 was determined using RNA isolated from PBMCs (Peripheral Blood Mononuclear Cells) with Qiagen's RNAeasy kit.
- leukocyte IFN causes up-regulation in expression of each of these candidate PD markers. See also Figure 1 (IFI44), Figure 2 (IRF2), Figure 3 (RSAD2), Figure 4 (G1P3), and Figure 5 (HERC5) for a graphical analysis of these candidate PD marker expression results.
- a summary hierarchical clustering of all samples using 1384 genes differentially regulated by IFN type 1, IFN type 2, or TNF ⁇ obtained from a separate experiment is shown in Figure 17 .
- a heat map with a summary hierarchical clustering is also provided for 689 type I IFN inducible probe sets used on whole blood samples from healthy donors ex vivo stimulated with IFN type 1, IFN type 2, or TNF ⁇ . See figure 64 .
- IFN ⁇ treatment of healthy volunteers' whole blood induced expression of candidate PD markers it was determined whether IFN ⁇ Ab, MEDI-545, could neutralize the induction of expression of these markers.
- Blood was drawn from each of three donors into heparin tubes. Aliquots of 2.5 ml of drawn blood were added to each of 4 wells of 6- or 24-well treatment plates. The 4 wells were designated for treatment as follows: (a) blood + vehicle, (b) blood + 100 IU IFN ⁇ 2a, (c) blood + 100 IU IFN ⁇ 2a + MEDI-545 (IFN ⁇ Ab), and (d) blood + 100 IU IFN ⁇ 2a + R347 (control Ab).
- Wells containing blood to be treated with Ab were first incubated with either MEDI-545 (IFN ⁇ Ab; well (c)) or R347 (control Ab; well (d)) for 30 minutes. Following Ab treatment, vehicle (well (a)) or IFN ⁇ 2a (wells (b), (c), and (d)) was added to the appropriate wells and was then incubated for an additional 4 hours at 37°C, 5% CO 2 . The samples were then transferred to PAXgene tubes and incubated at room temperature for 2 hr. Following the 2 hr incubation the tubes were transferred to -80 °C for storage.
- RNA of the cells was prepared according to the PAXgene protocol.
- First and second strand cDNA was prepared via Affy GRP methods and TaqMan was conducted on the cDNA samples.
- Expression of at least 11 candidate PD markers could be neutralized by MEDI-545 in the IFN ⁇ 2a-stimulated whole blood. See Table 8 (RAB8B), Table 9 (IRF7), Table 10 (MARCKS), Table 11 (IL6ST), Table 12 (LY6E), Table 13 (IFIT3), Table 14 (IFIT1), Table 15 (HERC5), Table 16 (OAS1), Table 17 (OAS3), and Table 18 (RSAD2), which provide quantitative gene expression analysis for each of these 11 genes in the whole blood of each of the 3 healthy volunteers.
- IFN ⁇ 2a-Induced RAB8B Gene Expression is Neutralized by MEDI-545 Sample Gene Average StDev 107 VEH RAB8B 1.00 107 IFN RAB8B 3.45 0.31 107 IFN+545 RAB8B 1.30 0.04 107 IFN+R347 RAB8B 3.15 0.03 163 VEH RAB8B 0.70 0.01 163 IFN RAB8B 2.20 0.04 163 IFN+545 RAB8B 1.18 0.01 163 IFN+R3437 RAB8B 3.71 0.02 175 VEH RAB8B 0.64 0.01 175 IFN RAB8B 2.63 0.04 175 IFN+545 RAB8B 1.15 0.02 175 IFN+R347 RAB8B 2.51 0.05 Table 9: IFN ⁇ 2a-Induced IRF7 Gene Expression is Neutralized by MEDI-545 Sample Gene Average StDev 107 VEH IRF7 1.00 107 IFN IRF7 18.53 3.
- Heatmap analysis was also performed to examine induction of a type I IFN signature in PBMCs of a healthy donor by serum of an SLE patient and neutralization of the type I IFN signature by MEDI-545. See Figure 67 .
- the anti-IFN- ⁇ mAb treatment (lanes 4-6) demonstrated strong neutralization of a large number of genes stimulated with the serum of an SLE patient.
- neutralization by the anti-IFN- ⁇ mAb was dose-dependent, which suggests that these genes could be good candidates for PD.
- the reference mAb itself inhibited the overexpression of some of the genes upregulated when challenged with SLE patient sera; some of these were identified as type I IFN-inducible genes.
- HEK293H cells were stably transfected with a luciferase construct ( Gaussia princeps) under the control of the IFN-stimulated response element (ISRE). Transfected cells were incubated with 50% patient sera and luciferase activity was detected in the culture supernatants 24 h later. Samples generating a signal greater than 1.5X negative control wells (normal human serum) were considered positive. To determine which class of type I IFN was responsible for the positive response, cells were treated with anti-type I and anti-type II IFN mAbs.
- Figure 70a shows the range of levels of type I IFN activity in each of the four SLE patient serum samples.
- PBMCs isolated from a healthy volunteer.
- the PBMCs from the healthy volunteer (previously determined to be IFN-signature negative) were isolated using Ficoll gradient centrifugation. Isolated PBMCs were incubated with 25% SLE patient serum or with 25% autologous patient serum (as a negative control). Following the incubation, cells were harvested with Trizol LS and stored at -70°C for RNA isolation. Total RNA was extracted and RNA purity and concentration were determined spectrophotometrically (260/280>1.9). The generation and hybridization of biotin-labeled amplified complementary RNA (cRNA) were conducted according to manufacturer's instructions (Affymetrix, Santa Clara, CA).
- Figure 70b shows the number of probes detected as 3-fold or more upregulated in the healthy volunteer PBMCs by each of the four SLE patient serum samples.
- the number of probes detected as 3-fold or more upregulated by an SLE patient serum sample correspondingly increased with the level of type I IFN activity detected in the SLE serum sample.
- PBMCs isolated from a healthy volunteer were incubated with 25% SLE patient serum in the presence or absence of neutralizing antibodies against IFN- ⁇ , or irrelevant mAb, for 4 or 18 hours.
- PBMC were incubated with 25% of autologous patient serum.
- cells were harvested with Trizol LS and stored at -70°C for RNA isolation. Total RNA was extracted and RNA purity and concentration were determined spectrophotometrically (260/280>1.9).
- cRNA biotin-labeled amplified complementary RNA
- Figure 71a provides heat maps showing the percent neutralization of probes that were identified as upregulated following anti-IFN ⁇ treatment for type I IFN genes (689 probes) and non-type I IFN genes (probes induced by SLE serum outside of type I IFN gene list) 4 and 18 h post incubation.
- Figure 71b shows, for each of the four SLE patient serum samples, the percentage of type I IFN gene signature or non-type I IFN gene signature probes that were neutralized by the anti-IFN ⁇ treatment following both the 4 and 18 hour incubations.
- Figure 72 provides the (a) type I IFN genes and (b) non-type I IFN genes that were identified as unique genes. Shaded areas indicate greater than 50% neutralization by anti-IFN ⁇ in that patient sample.
- Cell pathways and processes neutralized by anti-IFN ⁇ treatment at the 18 hr time point are involved in cytokine and chemokine signaling pathways, immune regulation, cell adhesion, and cell survival. See Figure 73 , which provides a table showing the pathway analysis of altered genes and proteins at the 18 hr time point. Pathways highlighted in yellow were also significantly altered in SLE serum samples. The cell pathways and processes neutralized by anti-IFN ⁇ treatment at the 18 hr time point were analyzed with the MetaCore integrated software suite from GeneGo, Inc. using the identified unique genes. Only pathways with p-values ⁇ 0.05 were considered significant. The pathways shown were altered in at least 2 out of 4 SLE serum samples.
- Example 6 Administering MEDI-545 to Lupus Patients Neutralizes the IFN ⁇ -Inducible Candidate PD Marker Expression Pattern
- MEDI-545 Whole blood of lupus patients receiving placebo, 0.3 mg/kg, 1.0 mg/kg, and 3.0 mg/kg MEDI-545 were analyzed for expression of IFN ⁇ -inducible PD markers over the course of 28 days.
- Whole blood ( ⁇ 2.5 mL) was drawn into PAXgene RNA tubes and processed as outlined above. With increasing doses of MEDI-545, up-regulated expression of the top 25 PD markers was neutralized. See Figure 18 , Figure 23 , and Figure 24 which provide graphical representations of neutralization of these top 25 PD markers following administration of varying concentrations of the MEDI-545 IFN ⁇ Ab over various lengths of time.
- the top 25 PD markers measured in this study are provided in Table 19.
- Table 19 Top 25 IFN-Induced PD Markers in Lupus Patients Probe ID UniGene ID Gene Title Gene Symbol 202086_at Hs.517307 myxovirus (influenza virus) resistance 1, interferon-inducible protein p78 (mouse) /// myxovirus (influenza virus) resistance 1, interferon-inducible protein p78 (mouse) MX1 202145_at Hs.521903 lymphocyte antigen 6 complex, locus E LY6E 202411_at Hs.532634 interferon, alpha-inducible protein 27 IFI27 202869_at Hs.524760 2',5'-oligoadenylate synthetase 1, 40/46kDa OAS1 203153_at Hs.20315 interferon-induced protein with tetratricopeptide repeats 1 /// interferon-induced protein with tetratricopeptide repeats 1 IFIT1 204415_at Hs.523847
- Figures 19-21 are heatmaps showing the neutralization of the top 25 PD markers (see Table 19) for two individual lupus patients ( Figure 19 , patient 1541; and Figure 20 , patient 1449). Each of these lupus patients received 3 mg/kg MEDI-545. Each exhibited neutralization of the top 25 inducible PD markers at 7 and 14 days post-MEDI-545 treatment.
- FIG. 25(a) A heatmap of neutralization of the top 25 type I IFN inducible genes at 1, 4, 7, and 14 days following administration of MEDI-545 is presented in Figure 25(a) . Neutralization of all genes can be seen following administration of MEDI-545.
- Figure 25(b) is a PCA of target modulation based on the top 25 type I IFN inducible genes. The PCA diagram shows the progression of the treated SLE patient from a position directly opposite that of normal healthy donors prior to administration of MEDI-545 to a position where it clusters with the healthy donors after administration of MEDI-545.
- MEDI-545 neutralized most of the 165 candidate PD markers in this lupus patient.
- the 165 candidate PD markers are shown as the first 165 entries of Table 20.
- Table 22 provides a list of the 63 type I IFN inducible probes upregulated in whole blood of lupus patients and neutralized by MEDI-545 or placebo by at least 30% at day 7, day 14, or day 28 post administration.
- Each set of columns provides neutralization data for each of the indicated genes at 7, 14, and 28 days post-administration.
- the first set of columns provides percentage neutralization of each of the indicated genes for lupus patients having a type I IFN signature and that were treated with MEDI-545. It can be noted that for each of the indicated genes, neutralization ranged from 30% to 68% at day 7 post-administration. Meanwhile, at day 7 in the placebo treated group, neutralization of the same genes ranged from 0% to 27%.
- Table 33 provides the results of a separate study which determined the top 50 genes neutralized in SLE patient whole blood 7 days after MEDI-545 treatment. Only three genes of the 50 genes, ZCCHC2, REC8L1, and GCLM, were not IFN- ⁇ / ⁇ -inducible Table 33: Top 50 probes neutralized 7 days post-dose in SLE patients receiving MEDI-545 treatment Probe ID UniGene ID Gene Title Gene Symbol Avg Probe Rank (By % Neutralization) Final Probe Rank 219352_at Hs.529317 hect domain and RLD 6 HERC6 2277.0 1 208436_s_at Hs.166120 interferon regulatory factor 7 IRF7 2497.5 2 210797_s_at Hs.110633 2 5 oligoadenylate synthetase-like OASL 2708.2 3 205483_s_at Hs.458485 ISG15 ubiquitin like modifier ISG15 2735.7 4 204439_at Hs.389724 inter
- Example 7 The Majority of Lupus Patients Exhibit a Type I IFN-Inducible PD Marker Expression Pattern
- PCA Principal Component Analysis
- Table 20 Gene Expression Detected by 169 Probe Sets in 35 SLE Patients Probe ID UniGene ID Gene Title Gene Symbol 1552772_at Hs.351811 C-type lectin domain family 4, member D CLEC4D 1554343_a_at Hs.435579 BCR downstream signaling I BRDG1 1555464_at Hs.163173 interferon induced with helicase C domain I IFIH1 1555728_a_at Hs.325960 membrane-spanning 4-domains, subfamily A, member 4 MS4A4A 1556643_at Hs.515243 Hypothetical protein BC011840 LOC93343 1557236_at Hs.257352 apolipoprotein L, 6 APOL6 1559585_at Hs.535011 hypothetical protein FU31033 FLJ31033 200887_s_at Hs.565365 signal transducer and activator of transcription 1, 91kDa STAT1 200923_at Hs.514535 lect
- PCA Principal Component Analysis
- Table 23 The overexpression of type I IFN genes in SLE patient whole blood for a larger number of patients, determined using an Affymetrix whole genome array, is provided in Table 23. Table 23 and Figure 65 provide further evidence that a high percentage of SLE patients share at least 2-fold overexpression of each individual type I IFN genes.
- Example 8 MEDI-545 Considerably Neutralizes the Tyne I IFN Gene Signature of SLE Patients Having a Strong to Moderate Type I IFN Gene Signature
- Patients in a clinical trial were identified as having a strong/moderate type I IFN gene, a weak type I IFN gene signature, or no type I IFN gene signature. These patients were designated into one of these groups based on 149 genes. Table 25 shows the number of lupus patients in the clinical trial that were designated in each of these three groups and indicates the treatment protocol they received.
- Table 25 Patient distribution based on type-I IFN gene signature prior to treatment Group Strong & moderate signature Weak signature No signature PBO 10 5 2 0.3 mpk 5 0 1 1 mpk 2 2 2 3 mpk 3 2 1 10 mpk 4 3 0 30 mpk 3 2 1 Total 27 14 7
- the average fold increase in the top 25 type I IFN inducible genes for each patient having a strong/moderate type I IFN signature or a weak signature in the trial is provided in Figure 28 .
- FIG 29(a) shows that in a group of SLE patients having a type-I IFN gene signature, virtually all of the top 39 genes neutralized 14 days post-MEDI-545 treatment are type I IFN signature genes (see yellow highlighted genes; percentage inhibition of the type I IFN signature genes ranged from 30.5-64.7). By contrast, none of the top 39 neutralized genes in SLE patients who received placebo were type I IFN signature genes. See Figure 29(c) .
- the SLE patients who lacked a type I IFN signature and were treated with MEDI-545 displayed an intermediate neutralization pattern, with some type I IFN signature genes neutralized. (See Figure 29(b) ; yellow highlighting indicates type I IFN signature genes, which were neutralized from 19%-44.9%).
- FIG. 84 shows the distribution of the type I IFN gene signature scores of the 46 SLE patients profiled. The SLE patients were profiled into 3 groups based on their type I IFN gene signature score: high type I IFN gene signature (score >10); moderate type I IFN gene signature (score 4-10); and weak type I IFN gene signature (score ⁇ 4).
- the gene panel was narrowed to 21 genes.
- 807 IFN- ⁇ / ⁇ -inducible probes identified by ex vivo stimulation of healthy donor WB with 10 IFN- ⁇ subtypes (2a, 4b, 5, 6, 7, 8, 10, 14, 16, and 17) and IFN- ⁇ were used as a candidate marker starting point.
- the WB samples from a total of 46 SLE patients procured from commercial vendors and 24 healthy normal controls were used to determine the type I IFN-inducible probes that are upregulated in WB of SLE patients.
- 114 overexpressed probes (q ⁇ 0.05; fold change ⁇ 2) were identified in WB of SLE patients were type I IFN-inducible using SAM and FDR.
- one healthy donor PBMC was stimulated ex vivo with sera from six individual SLE patients.
- the healthy donor was prescreened to exclude those donors that might have viral infection.
- 161 type I IFN-inducible probes were upregulated by ⁇ 2-fold in the PBMC of the healthy donor following stimulation with ⁇ 1 SLE patient serum in which the overexpression of these genes was suppressed by ⁇ 50% and ⁇ 70% by an anti-IFN- ⁇ mAb and an anti-IFN- ⁇ R mAb, respectively.
- the intersection between this list of 161 probes and previously determined list of 114 probes was 80 probes. Each of these 80 probes was ranked by both the average fold change magnitude across all SLE patients and the percentage of patients displaying a change ⁇ 2-fold. Generally, the 21 most prevalently overexpressed type I IFN-inducible genes (that represent unique genes using the NetAffx annotation file for the Affymetrix U133 2.0 plus array; ESTs were excluded) from this ranking were retained for a static list of probes used to measure PD. The type I IFN signature score was then defined by the median of these 21 genes.
- This method was implemented to compensate for 3 primary differences between the 2 platforms: (1) the number of probes used for the type I IFN signature (25 genes dynamically determined for each patient on the Affymetrix platform versus a 21 static gene list on the TaqMan-based assay), (2) the differences in sensitivity between the 2 platforms, and (3) the scales of the dynamic ranges within each platform.
- the fold change values were calculated (on a log 2 scale) for the 155 type I-inducible probes between the 35 randomly selected SLE patients and the average of a set of normal healthy controls.
- the genes with the top 25-fold change values were determined for each patient on the Affymetrix platform (this gene set is allowed to vary from patient to patient depending on which type I IFN-inducible genes are most highly expressed).
- the median fold change was calculated from the top 25 genes for each SLE patient. The same calculation was conducted across the same patients using the static 21 gene set on the TaqMan-based assay. This gene set was identical for each patient and the median fold change was calculated based on 21 genes, rather than 25 dynamic genes, as was conducted for the Affymetrix platform.
- a simple regression model was then computed using these 2 vectors of equal length (35 median fold change values), and the coefficients from the model were used to calculate the conversion factor (from the Affymetrix platform to the TaqMan-based assay) for the response threshold values to partition the SLE patients into a type I IFN gene signature category of strong (>10 on Affymetrix; >5.53 on TaqMan), moderate (between 4 and 10 on Affymetrix; between 1.91 and 5.53 on TaqMan), or weak ( ⁇ 4 on Affymetrix; ⁇ 1.91 on TaqMan).
- the signature ie, median fold change
- the signature ie, median fold change
- Table 32 The prevalence and fold change (log 2 based) of the 21 IFN ⁇ / ⁇ -inducible genes in whole blood of 111 SLE patients is provided in Table 32, below.
- Table 32 Prevalence and fold chance in expression of 21 IFN ⁇ / ⁇ -inducible genes in SLE patient whole blood
- Probe Q value Fold Prevalence Gene name Gene symbol 204415_at qv ⁇ 1e-16 9.38 78.20 interferon, alpha-inducible protein 6 IFI6 213797_at 2.67E-12 8.27 71.80 radical S-adenosyl methionine domain containing 2 RSAD2 214059_at 7.18E-14 7.93 70.90
- Figure 85 shows the stratification of 35 SLE patients into groups of high (20 patients), moderate (8 patients), and weak (7 patients) type I IFN gene signatures based on the distribution of fold change values (log 2 scale) of all 21 type I IFN-inducible genes and partitioned into each group by the median fold change of this distribution of 21 genes for each patient (vertical dashed lines), as measured by the dynamic array from Fluidigm. From figure 85 , it is apparent that each patient distribution exhibits slight differences in skewness and basic shape/form, as this indicates the diversity in the various severity levels of SLE, based on the 21 type IFN-inducible gene selected.
- Example 9 Multiple Type-I IFN Subtypes are Up-Regulated in Whole Blood of SLE Patients
- type-I IFN subtypes responsible for the induction of the type-I IFN signature of SLE patients To identify the type-I IFN subtypes responsible for the induction of the type-I IFN signature of SLE patients, mRNA levels of type-I IFN genes in SLE patient whole blood were measured.
- Double-stranded cDNA for each patient sample was pre-amplified using the TaqMan PreAmp Master Mix kit (Applied Biosystems).
- cDNA was pre-amplified by conducting 10 cycles of PCR on each patient sample using a pooled solution of primers, a pair for each gene analyzed on the array.
- the pre-amplified cDNA were diluted 1:5 with TE.
- a 50 ⁇ L volume of the diluted pre-amplified cDNA was added to a 50 ⁇ L volume of 2x TaqMan Universal PCR Master Mix (Applied Biosystems) and mixed.
- the array was loaded with the mixture using standard procedures and the loaded array was run on a 7900HT Fast Real-Time PCR System (Applied Biosystems). Data analysis of the resulting Ct values was conducted with the SDSv2.2.2 software tool (Applied Biosystems).
- Figure 27 shows the relative overexpression of mRNA of nine IFN ⁇ subtypes in the whole blood of lupus patients relative to healthy volunteers. Many of these IFN ⁇ subtypes were upregulated at the mRNA level in the whole blood of SLE patients.
- Figure 66 shows that IFN ⁇ , IFN ⁇ and IFNAR1 and IFNAR2 genes are also overexpressed in whole blood of lupus patients relative to healthy volunteers.
- Figure 82 shows that TNF- ⁇ , IFN- ⁇ , IFN- ⁇ R1, and IFN- ⁇ R2 transcripts were also upregulated in WB of SLE patients ( Figure 82 ). However, the relative magnitude of overexpression of these transcripts was less than that of the type I IFN family members, especially the IFN- ⁇ subtypes.
- Example 10 Ex vivo IFN-stimulated whole blood and keratinocytes of healthy individuals identifies a panel of type I IFN-inducible genes relevant to psoriasis
- Figure 30 provides the hierarchical clustering of 1384 probe sets differentially regulated by either IFN ⁇ / ⁇ , or IFN ⁇ , or TNF ⁇ in ex vivo stimulated whole blood. From this hierarchical clustering the similar response of whole blood to challenge with IFN ⁇ subtypes and IFN ⁇ can easily be observed, as can the similar but distinctly different effect of IFN ⁇ from IFN ⁇ / ⁇ , and the drastically different effect of TNF ⁇ from IFN ⁇ / ⁇ .
- Figure 31 a provides the hierarchical clustering of the relative expression of only the top 25 type-I IFN inducible probe sets identified in the ex vivo stimulated whole blood.
- Keratinocytes Normal human keratinocytes (EpiDerm system, MatTek, Inc.) were grown under serum-free conditions according to the manufacturers instructions. Briefly, keratinocytes were maintained on tissue culture inserts at the air-liquid interface to maintain a multilayered, fully differentiated epithelial phenotype. Keratinocytes were stimulated with human leukocyte IFN (15, 50, 150, IU/mL, PBL Biomedical Labs), human IFN ⁇ 2a (15-350 lU/ml, PBL Biomedical Labs), recombinant human TNF ⁇ (0.1 ng/ml, R+D Systems) or recombinant human IFN ⁇ (3 ng/ml, R+D Systems). Epidermal cultures were harvested at 2, 4, or 18 hours post treatment for transcript analysis. Over 100 probe sets were identified as overexpressed in keratinocytes cultures stimulated with human IFN ⁇ 2a and leukocyte IFN.
- Figure 31b provides the hierarchical clustering of the relative expression of 25 type-I IFN inducible genes in ex vivo stimulated keratinocytes.
- the 25 type-I IFN inducible probe sets used to prepare the hierarchical clustering are the top 25 type-I IFN inducible probes identified in the ex vivo stimulated whole blood (those shown in Figure 31a ).
- Many of the top 25 type-I IFN inducible probe sets in ex vivo stimulated whole blood are also induced in ex vivo stimulated keratinocytes. See, e.g ., MX1, IFI27, OASI, IFI6, IFI44L, etc.
- Example 11 Whole genome array profiling identified IFN ⁇ / ⁇ signaling pathway as the most significantly activated pathway in lesional skin of psoriasis patients
- a comparison of gene expression profiles of skin samples from healthy donors and paired non-lesional/lesional skin samples from psoriasis patients was performed to identify a type-I interferon induced gene expression signature associated with psoriatic skin lesions. Briefly, skin samples of 21 normal healthy control donors (5 samples obtained from Biochain, 14 from ILSbio, and 2 from Dr. James Krueger's lab) and 26 paired non-lesional/lesional skin samples of 24 psoriatic patients (21 pairs obtained from Asterand, and 5 from Dr. James Krueger's 1ab) were obtained. Three additional lesional skin samples from 3 psoriatic patients were obtained.
- RNA from the samples was extracted using the Qiagen RNAeasy-Mini kit (Hilden, Germany). The purity and concentration of the extracted RNA were determined spectrophotometrically (260/280 > 1.9). RNA quality was assessed on an Agilent 2100 Bioanalyzer using the RNA 6000 Nano LabChip ® . Generation of blotin-labeled amplified cRNA, from 2 ug of total RNA, was accomplished using the Affymetrix GeneChip ® One-Cycle cDNA Synthesis kit and the Affymetrix GeneChip ® IVT Labeling kit. Concentration and purity of the cRNA product were determined spectrophotometrically.
- ArrayAssist ® Lite software was used to calculate probe-level summaries (GC-RMA normalization algorithm) from the array CEL files.
- R packages R development core team
- samr & qvalue were used to generate differentially regulated genes.
- PCA and hierarchical clustering analyses were performed in both SpotFire and R (R Development Core Team).
- SAM & FDR were used to select differentially regulated genes (pairwise comparison between lesional and non-lesional skin, lesional and normal skin, and non-lesional and normal skin).
- Probe sets with a fold-change of at least 2 and q value less than or equal to 0.05 were considered to be differentially regulated.
- PCA and hierarchical clustering were performed in both SpotFire and bioconductor R.
- 1408 probe sets were up-regulated and 1465 probe sets were down-regulated in lesional skin compared to non-lesional skin.
- the downregulated genes outnumbered the upregulated genes in the lesional skin, the magnitude of differential regulation of the upregulated genes was much greater as a whole.
- 318 probe sets were upregulated by at least four fold in the lesional skin, while only 84 probe sets were downregulated by at least four fold in the lesional skin.
- 96 probe sets were upregulated by at least eight fold in the lesional skin, while only six probe sets were downregulated by at least eight fold.
- FIG. 45 provides a Venn diagram of the probe sets both upregulated (downregulated) in lesional skin and non-lesional skin relative to normal healthy skin. Only 70 of the 1408 upregulated probe sets in the lesional skin were also upregulated in non-lesional skin. Meanwhile, only 43 of the 1465 probe sets downregulated in the lesional skin were also downregulated in the non-lesional skin. These data suggested that the molecular events and biological changes from the non-lesional skin to lesional skin were quite different from those from the normal skin to the non-lesional skin.
- IFN ⁇ / ⁇ signaling pathway members such as IFN ⁇ , IFN ⁇ , IFNAR1, IFNAR2, STAT1, IRF I , MPL, ISG15, IFI6 were all significantly overexpressed in lesional skin compared to uninvolved skin.
- Components of the pathway like IFN ⁇ subtypes, IFN ⁇ , IFNAR1, IFNAR2, STAT1, IRF1, MPL, ISG15, IFI6 were all significantly overexpressed in lesional skin compared to non-lesional skin of psoriatic patients.
- probe sets identified to be type-1 IFN inducible in the whole blood and keratinocyte ex vivo stimulation studies 164 of the 1408 (approximately 11.7%) probe sets upregulated in lesional relative to non-lesional skin were identified as type-I IFN inducible. Fisher's exact test calculated a p value (one-tailed t test) less than 0.0001, suggesting that the observed overexpression of type-I IFN genes in lesional skin of psoriatic patients was statistically significant.
- the type-I IFN induced genes were also many of the most highly upregulated genes in the lesional relative to non-lesional psoriatic skin.
- IFN genes Nineteen percent of the top 100 and 200 most upregulated probe sets in lesional skin relative to non-lesional skin were type-I IFN genes. See Figure 47a and b for the top 100 upregulated probe sets in lesional skin. These genes included STAT1, a key component in fonning the ISGF3 complex; IRF7, a master regulator of the IFN ⁇ / ⁇ mediated immune response; MYD88, which governs the induction of CD8 + T-cell responses with IRF7; IRF1, a transcriptional activator for the type-1 IFN genes; OAS family members OAS1, OAS2, OAS3, mediators of resistance to virus infection; ISG15, a ubiquitin-like protein that becomes conjugated to many cellular proteins upon activation by IFN ⁇ / ⁇ ; and members of the ISG15 signaling pathways such as USP18, UBE2L6, and HERC5. This enrichment of type I IFN genes indicated them as the most overexpressed genes in lesional skin of psoriatic patients.
- Table 26 lists, in descending order, the top 50 IFN induced probes in lesional skin compared to non-lesional skin of psoriasis patients.
- Table 26 not only compares the log2-based fold change (log2 fc) and q value for each of the 50 most upregulated type I IFN inducible genes in lesional relative to non-lesional skin of psoriasis patients, it also compares the log 2-based fold change and q value for these 50 genes in non-lesional skin of psoriasis patients relative to healthy control patients.
- Table 26 The frequency of upregulation of the top 50 type-I IFN induced probes in lesional relative to non-lesional skin in psoriasis patients Lesional vs.
- Non-lesional Non-lesional vs. Normal Probe ID Unigene ID Gene Title Gene Symbol log2 fc q value log2 fc q value 219403_s_at Hs.44227 heparanase HPSE 4.598 4.46E-22 0.226 0.23589 204972_at Hs.414332 2-5-oligoadenylate synthetase 2, 69/71kDa OAS2 4.098 8.57E-14 0.096 0.28896 205660_at Hs.118533 2'-5'-oligoadenylate Synthetase-like OASL 4.030 1.34E-12 0.029 0.20341 227609_at Hs.546467 epithelial stromal interaction 1 (breast) EPSTI1 4.002 1.14E-14 -0.254 0.10798 227458_at --- --- --- 3.859 9.31E-14 -0.591 0.05449 219352_at Hs.529317 he
- Table 27 provides, in descending order, the top 50 most upregulated type-I IFN genes in lesional skin compared to non-lesional skin. For genes identified by more than one probe set, only the probe set detected as most upregulated is provided. Table 27: Top 50 type-I IFN induced genes in lesional relative to non-lesional skin in psoriasis patients Probe.ID Unigene.ID Gene.Title Gene.Symbol log2.fc q.value(fdr) % Prevalance 219403_s_at Hs.44227 heparanase HPSE 4.60 4.46E-22 100.00 204972_at Hs.414332 2'-5'-oligoadenylate synthetase 2, 69/71kDa OAS2 4.10 8.57E-14 96.15 205660_at Hs.118633 2'-5'-oligoadenylate synthetase-like OASL 4.03 1.34E-12 96.15 227609_at Hs.5464
- Table 28 provides the average and median fold change of the top 25 most upregulated type-I IEN probe sets for each paired lesional/non-lesional skin sample.
- the top 25 most upregulated type-I IFN probe sets were consistently observed to detect elevated gene expression in the lesional relative to non-lesional skin of each individual psoriasis patient.
- Figure 32 provides a graphic of the distribution of the average and median fold changes among the different pairs of lesional and non-lesional skin.
- the prevalent and uniform upregulation of the most overexpressed type-I IFN genes in lesional skin of psoriatic patients verified their usefulness as PD markers.
- Example 12 Expression of type-I IFN genes is not significantly altered in normal skin relative to non-lesional skin of psoriatic patients
- Example 11 Although the array data obtained in Example 11 identified overexpression of numerous type-I IFN-inducible genes in lesional relative to non-lesional skin, it identified only 5 probe sets overexpressed in non-lesional skin relative to normal control skin. The p value of Fisher's exact test (two-tailed t-test) was 0.581, which suggested that the overexpression of the type-I IFN genes is not statistically significant in the non-lesional skin of the psoriasis patients over normal skin.
- Figure 33 provides a graphical representation of the relative expression of 3 type-I IFN inducible genes (HPSE, OASL, and HERC6; included as top 50 type-I IFN-induced probe sets in lesional relative to non-lesional skin), and 1 non type-I IFN inducible gene (SERPINB4) in both (a) lesional skin compared to non-lesional skin and (b) non-lesional skin compared to normal skin.
- HPSE, OASL, and HERC6 in lesional skin compared to non-lesional skin is both statistically significant (as evidenced by the very small p value) and large in scale (between 12-250 fold overexpression on average).
- SERPINB4 is overexpressed in non-lesional skin by about 3-4 fold compared to normal skin, but upregulated by well over 200 fold in lesional skin compared to non-lesional skin.
- Figure 34a provides heatmap of unsupervised hierarchical clustering of all lesional, non-lesional, and normal skin samples profiled using the 164 type-I IFN-inducible probe sets in lesional skin compared to non-lesional skin of psoriasis patients.
- Figure 34b provides a PCA plot of the skin samples using the same 164 upregulated type-I IFN inducible probe sets. Again, the normal skin samples and the non-lesional skin samples mostly clustered together, indicating similar levels of expression of the 164 genes. Also, the majority of the lesional skin samples were separated from the normal and non-lesional skin samples, indicating that the lesional samples exhibited a distinct overexpression of the type-I IFN inducible genes that was separable from the gene expression levels of the normal and non-lesional skin samples.
- Example 13 Validation of type-I IFN-inducible gene up-regulation in psoriatic lesional skin using taqMan-based assays
- a BioMark TM 48.48 dynamic array (taqMan-based assay) from Fluidigm was used to validate the results of the Affymetrix GeneChip ® human genome U133 plus v2.0 arrays, results indicating that type-I IFN genes are up-regulated in lesional psoriatic relative to non-lesional psoriatic or normal skin samples.
- Figure 35 provides taqMan data showing overexpression of each of ten (OAS2, OASL, EPSTI1, MX1, IFI44L, IFI44, HERC6, HPSE, ISG15, and STAT1) type-I IFN-inducible genes in lesional skin in the 18 paired lesional/non-lesional samples.
- the taqMan-based assay and Affymetrix array results correlated well, validating the selected genes as overexpressed type-I IFN-induced genes in lesional psoriatic skin.
- the distribution of correlation coefficients between the taqMan-based assay and the Affymetrix array for the 40 overexpressed genes is provided in Figure 36a .
- Nineteen of the overexpressed genes had correlation coefficients greater than 0.85, indicating excellent correlation between the microarray and taqMan-based assay.
- Another 17 genes had high correlation coefficients between the microarray and taqMan-based assay of 0.5 - 0.85.
- Figure 36b provides the distribution of correlation coefficients between the taqMan-based assay and the Affymetrix array for the 29 type-I IFN-induced genes of the 18 psoriasis patients. Again, many of the genes had high correlation coefficients, greater than 0.90. These genes include, inter alia, IFI27, CXCL10, ISG15, and MX1.
- Figures 37a - 37d and 38 provide detailed gene expression data obtained from the microarray and taqMan-based assays for several type-I IFN-inducible genes in the paired lesional/non-lesional samples. These data evidence that similar levels of overexpression of type-I IFN-induced genes in lesional psoriatic skin is detected between the taqMan and array assays, and thus the high correlation coefficients discussed above.
- Figure 37a and 37b show similar overexpression of ISG 15 in each of the 18 paired lesional/non-lesional skin samples as determined by taqMan (37a) and microarray (37b) analysis.
- Figure 37c and 37d show similar overexpression of MX1 in each of the 18 paired lesional/non-lesional skin samples as determined by taqMan (37c) and microarray (37d) analysis.
- the correlation coefficient between the taqMan and microarray was 0.9735 for ISG15 and 0.9836 for MX1.
- Figure 38 shows measurement of similar overexpression of type-I IFN-inducible genes IFI27 and CXCL10 by taqMan and microarray analysis in each if the 18 paired lesional/non-lesional skin samples.
- the correlation coefficient between the taqMan and microarray results for IFI27 and CXCL10 was 0.9456 and 0.9455, respectively.
- Example 14 IFN ⁇ Ab neutralizes type-I IFN ⁇ -induced gene expression in ex vivo stimulated keratinocytes of healthy volunteers
- Keratinocytes of healthy volunteers were isolated and stimulated ex vivo with escalating doses of IFN ⁇ 2a and leukocyte IFN to induce an escalating type I IFN ⁇ -induced gene expression pattern.
- Anti-IFN ⁇ antibody was able to neutralize the type I IFN ⁇ - induced gene expression pattern in a dose-dependent manner.
- keratinocytes Normal human keratinocytes (EpiDerm system, MatTek, Inc.) were grown under serum-free conditions according to manufacturer's instructions. Briefly, keratinocytes were maintained on tissue culture inserts at the air-liquid interface to maintain a multilayered, fully differentiated epithelial phenotype. Keratinocytes were stimulated with human leukocyte IFN (15-150 IU/ml, PBL Biomedical Labs) and human IFN ⁇ 2a (15-350 IU/ml, PBL Biomedical Labs).
- a humanized anti-human IFN ⁇ monoclonal antibody (0.01-100 ⁇ g/ml; MEDI-545, Medlmmune, Inc) or isotype matched control antibody of irrelevant specifcity (R347, MedImmune, Inc) was added simultaneously with cytokine stimulus.
- Epidermal cultures were harvested at 2, 4, or 18 hours post treatment for transcript analysis.
- Expression of type-I IFN-induced genes was measured using a BioMark TM 48.48 dynamic array.
- Type-I IFN-induced genes Expression of a majority of type-I IFN-induced genes was upregulated in the IFN ⁇ 2a and leukocyte interferon stimulated keratinocytes in a dose-dependent manner. This upregulation of type-I IFN-induced genes, by either IFN ⁇ 2a or leukocyte interferon, was likewise inhibited in a dose-dependent manner by IFN ⁇ monoclonal antibody (MEDI-545). Control antibody, R347, did not have a significant effect on neutralization of the type-I IFN-induced genes.
- FIG 39 Dose-dependent neutralization of three type-I IFN-induced genes (ISG15, USP18, and IFIT2) by MEDI-545 in IFN ⁇ 2a or leukocyte IFN stimulated keratinocytes is provided in Figure 39.
- Figure 39 (a), (c), and (e) show that MEDI-545 neutralizes overexpression of type-I IFN induced genes ISG15, USP18, and IFIT2, respectively, in keratinocytes stimulated with 350 IU/mL IFN ⁇ 2a. Each of these genes was neutralized 100% by MEDI-545.
- Figure 39 (b), (d), and (f) show that MEDI-545 neutralizes overexpression of type-I IFN induced genes ISG15, USP18, and IFIT2, respectively, in keratinocytes stimulated with 150 I.U./mL leukocyte IFN.
- Neutralization of these genes by MEDI-545 was between 70 and 100%, which is not surprising because leukocyte IFN contains both IFN ⁇ and IFN ⁇ .
- MEDI-545 neutralizes a majority of IFN ⁇ subtypes efficiently, but not IFN ⁇ .
- These neutralization data provide further evidence that the type-I IFN-inducible genes identified in ex vivo stimulated whole blood and keratinocytes (Example 10) are type-I IFN-inducible genes. It also provides further support that upregulated expression of these genes in lesional psoriatic skin relative to non-lesional skin due to type-I IFN induction.
- Example 15 Multiple type-I IFN subtypes are up-regulated in lesional skin of psoriasis patients
- type-I IFN subtypes responsible for the induction of the type-I IFN signature in lesional skin of psoriasis patients mRNA levels of type-I IFN genes in psoriatic lesions were measured.
- TLDA TaqMan Low Density Array
- Double-stranded cDNA for each patient sample was pre-amplified using the TaqMan PreAmp Master Mix kit (Applied Biosystems).
- cDNA was pre-amplified by conducting 10 cycles of PCR on each patient sample using a pooled solution of primers, a pair for each gene analyzed on the array.
- the pre-amplified cDNA were diluted 1:5 with TE.
- a 50 ⁇ L volume of the diluted pre-amplified cDNA was added to a 50 ⁇ L volume of 2x TaqMan Universal PCR Master Mix (Applied Biosystems) and mixed.
- the array was loaded with the mixture using standard procedures and the loaded array was run on a 7900HT Fast Real-Time PCR System (Applied Biosystems). Data analysis of the resulting Ct values was conducted with the SDSv2.2.2 software tool (Applied Biosystems).
- Figure 40a shows the relative overexpression of mRNA of nine IFN ⁇ subtypes in the lesional skin compared to either non-lesional skin or normal skin.
- IFN ⁇ 5 upregulated by about 4.6 fold; median fold change, p ⁇ 0.001
- none of the IFN ⁇ subtypes were significantly altered at the mRNA level in the non-lesional skin compared to that in the normal skin ( p ⁇ 0.05).
- all of these IFN ⁇ subtypes were upregulated at the mRNA level in the lesional skin compared to that in the normal skin (or non-lesional skin), with the overexpression of IFN ⁇ 1, IFN ⁇ 5, IFN ⁇ 8, IFN ⁇ 14, IFN ⁇ 17, IFN ⁇ 21 being statistically significant ( p ⁇ 0.05).
- Figure 40b shows that the overexpression of other members of type I IFN family members, IFN ⁇ , - ⁇ , and - ⁇ mRNA in the lesional skin compared to either non-lesional skin or normal skin.
- the alterations of IFN ⁇ and IFN ⁇ mRNAs in the non-lesional skin were not significant. However, the upregulation of these mRNAs were significant in the lesional skin compared to normal skin ( p values of 0.022 and 0.049 respectively).
- Table 29 lists the correlation coefficients of the overexpression of type-I IFN family member (type-I IFN ⁇ subtypes 1, 2, 5, 6, 7, 8, 14, 17, and 21; and IFN ⁇ , IFN ⁇ , and IFN ⁇ ) mRNAs in lesional skin compared to non-lesional skin of psoriatic patients.
- type-I IFN family member type-I IFN ⁇ subtypes 1, 2, 5, 6, 7, 8, 14, 17, and 21; and IFN ⁇ , IFN ⁇ , and IFN ⁇
- Table 29 lists the correlation coefficients of the overexpression of type-I IFN family member (type-I IFN ⁇ subtypes 1, 2, 5, 6, 7, 8, 14, 17, and 21; and IFN ⁇ , IFN ⁇ , and IFN ⁇ ) mRNAs in lesional skin compared to non-lesional skin of psoriatic patients.
- overexpression of IFN ⁇ 1, 2, 8, and 14 in lesional skin correlated most consistently with overexpression of other members in the type-I IFN family, with the exception of IFN ⁇ 5 which showed the weakest correlation with other type-1
- Table 29 Correlation coefficient of overexpression of type-I IFN family members in lesional skin of psoriasis patients IFNA1 IFNA2 IFNA5 IFNA6 IFNA7 IFNA8 IFNA14 IFNA17 IFNA21 IFNB1 IFNK IFNW1 INFA1 1 IFNA2 0.66 1 IFNA5 0.11 0.20 1 IFNA6 0.45 0.47 -0.01 1 IFNA7 0.77 0.79 0.09 0.68 1 IFNA8 0.64 0.99 0.19 0.49 0.84 1 IFNA14 0.84 0.94 0.28 0.44 0.72 0.94 1 IFNA17 1.00 0.96 0.15 0.07 0.77 0.97 0.94 1 IFNA21 0.71 0.49 0.50 0.42 0.81 0.49 0.61 0.75 1 IFNB1 0.54 0.86 0.28 0.33 0.69 0.96 0.80 0.93 0.54 1 IFNK 0.78 0.73 0.09 0.59 0.27 0.73 0.77 0.03 0.22 0.54 1 IFNW1 0.73 0.72 0.44 0.22
- Example 16 Co-overexpression of type-I IFN. type-II IFN, and TNF ⁇ and their gene signatures in lesional skin or psoriasis patients
- IFN ⁇ and TNF ⁇ mRNA signaling pathways were also evaluated in the paired lesional/non-lesional psoriasis and normal skin samples. As discussed in Example 15, above, TLDA from Applied Biosciences was used to measure IFN ⁇ , IFNGR1 and IFNGR2, and TNF ⁇ mRNA in lesional and non-lesional skin of psoriasis patients and in normal healthy skin.
- IFN ⁇ , IFNGR1, IFNGR2, and TNF ⁇ mRNAs were significantly overexpressed in non-lesional skin compared to healthy normal skin ( Figure 41 ; p values of 0.02, ⁇ 0.001, ⁇ 0.001 and ⁇ 0.001 respectively).
- TNF ⁇ mRNA was upregulated by about 5.7 fold
- IFN ⁇ , IFNGR1 and IFNGR2 mRNAs were upregulated by about 1.5, 2.2, and 2.8 fold compared to that in the normal skin (median fold change; Figure 41 ).
- TNF ⁇ , IFN ⁇ , IFNGR1 and IFNGR2 mRNAs were upregulated by about 33.5, 116.7, 11.6, and 8.4 fold in the lesional skin compared to that in the normal skin.
- Example 17 Identification genes induced by type II IFN and TNF ⁇ in ex vivo 'stimulated whole blood and which are induced in skin lesions of psoriasis patients
- IFN ⁇ subtypes As described in Example 10, whole blood of healthy donors was stimulated ex vivo with a panel of IFN ⁇ subtypes, as well as IFN ⁇ , IFN ⁇ , and TNF ⁇ . Stimulating whole blood ex vivo with IFN ⁇ or TNF ⁇ identified probe sets associated with potential IFN ⁇ - or TNF ⁇ -inducible genes. Three hundred four probe sets were identified as at least 2-fold upregulated by IFN ⁇ four hours post-stimulation. Two hundred thirty four probe sets were identified as at least 2-fold upregulated by TNF ⁇ both 2 and 4 hours post-stimulation.
- the probe sets identified as associated with ex vivo IFN ⁇ or TNF ⁇ induction were compared with the total 1408 probe sets (Example 11) found to be upregulated in lesional skin relative to non-lesional skin of psoriasis patients.
- 106 and 35 of the probe sets included in the total 1408 upregulated in lesional skin were identified as IFN ⁇ or TNF ⁇ inducible, respectively ( Figure 42 ).
- the 106 probe sets identified as IFN ⁇ inducible are provided in Figure 49 .
- the 35 probe sets identified as TNF ⁇ inducible are provided in Figure 50 .
- the 164 probes sets shown in Figure 42 as identified as type-I IFN inducible are provided in Figure 51 .
- the Fisher's exact test indicated that the p values (one-tailed t-test) of the overexpression of IFN ⁇ or TNF ⁇ inducible genes in lesional skin were both less than 0.0001. The overexpression of IFNy and TNF ⁇ inducible genes was significant.
- type I IFN, IFN ⁇ and TNF ⁇ inducible genes upregulated at least 2-fold in each of the lesional relative to non-lesional skin sample were identified.
- Figure 43 shows the number of type I IFN, IFN ⁇ and TNF ⁇ inducible genes upregulated in each of the 26 paired lesional and non-lesional skin. The larger the number of type I I FN inducible genes upregulated in a particular lesional skin biopsy usually gave rise to the overexpression of larger numbers of IFN ⁇ and TNF ⁇ inducible genes in the same lesional skin biopsy.
- IFN ⁇ and TNF ⁇ mRNAs were found to be upregulated in the non-lesional skin of psoriatic patients when compared to healthy normal skin, IFN ⁇ and TNF ⁇ inducible genes did not appear to be significantly overexpressed in the non-lesional skin ( Figure 42 ).
- Example 18 Immunohistochemical analysis of biopsies from lesional psoriatic skin, non-lesional psoriatic skin, and skin from normal donors shows increased protein levels of type I IFN-induced genes
- Snap-frozen lesional psoriatic, non-lesional psoriatic, and normal skin biopsies were divided in half. One-half of each sample was embedded in O.C.T., sectioned at 5 ⁇ M, placed on a "plus” slide, and fixed in cold acetone. The sectioned samples were incubated with primary antibodies (specific for BDCA2, CD83, CD4, STAT1, and ISG15) for 4 hours and washed with TBS.
- primary antibodies specific for BDCA2, CD83, CD4, STAT1, and ISG15
- lesional skin contained increased numbers of pDCs, and/or mDCs, increased numbers of CD4+ cells, as well as the significant upregulation of STAT-1 and ISG 15 protein in the epidermis and dermis compared to non-lesional biopsies.
- skin biopsies from normal donors did not contain appreciable numbers of pDCs, mDCs or staining for STAT-1 and ISG15. See Figure 44 for example immunohistochemistry slides.
- Example 19 Immunohistochemical and gene expression analysis of biopsies from SLE patient skin lesions show reduced expression of type I IFN-induced genes at the protein and transcript level following treatment with MEDI-545
- transcripts of the top 25 type I IFN inducible genes in skin lesions of an SLE patient were neutralized by MEDI-545.
- biopsies from patients treated with 10mg/kg MEDI-545 were examined.
- a heatmap of neutralization of the top 25 type I IFN inducible genes in skin lesions at 0 and 14 days post-treatment is provided in Figure 58(a) . All of the top 25 genes are neutralized 14 days following administration of MEDI-545.
- a PCA diagram of target modulation based on these top 25 type I IFN-inducible genes is provided in Figure 58(b) .
- the PCA diagram shows the progression of the treated SLE patient from a position directly opposite that of normal healthy donors prior to administration of MEDI-545 to a position nearing that of the healthy donors 14 days after administration of MEDI-545.
- Snap-frozen skin lesion samples of MEDI-545 treated SLE patients and placebo treated SLE patients were divided in half. One-half of each sample was embedded in O.C.T., sectioned at 5 ⁇ M, placed on a "plus” slide, and fixed in cold acetone. The sectioned samples were incubated with primary antibodies (specific for BDCA2, CD83, CD4, IP10, and ISG15) for 4 hours and washed with TBS. The slides were then incubated with peroxidase-labeled polymer conjugated to goat anti-mouse immunoglobulin antibody (Envision+; Dakocytomation, Carpenteria, CA) for 30 minutes and washed with Tris-buffered saline, pH 7.2.
- primary antibodies specific for BDCA2, CD83, CD4, IP10, and ISG15
- TBS washed with TBS.
- the slides were then incubated with peroxidase-labeled polymer conjugated to goat anti-mouse immunoglobul
- Detection was performed with 3,3'-diaminobenzidiine tetrahydrochloride (DAB+; DakoCytomation) as the chromogen. Slides were washed with dH 2 O), counterstained with hematoxylin, dehydrated and coverslipped.
- DAB+ 3,3'-diaminobenzidiine tetrahydrochloride
- Example 20 Assay for sensitive detection of type I and type II IFNs
- ISRE interferon-stimulated response element
- HEK293H cells were stably transfected with the construct and these cells were used for the IFN detection assays.
- 25,000 of the stably transfected HEK293H cells were seeded per assay well in 50uL of cell culture medium overnight in a CO 2 incubator.
- patient serum samples or normal pooled human serum spiked with the various sub-types of IFN alpha or IFN-beta, IFN-omega, IFN-gamma
- IFN-induced luciferase activity was detected the following day, by observing chemiluminescence in the culture supernatants.
- Chemiluminescence was observed by transferring 50uL of supernatant from the wells to a B&W Isoplate, adding 50uL of chemiluminescent substrate, and detecting luminescence at 6 minutes. Samples generating a signal greater than 1.5-times the Negative Control wells on each assay plate are classified as Positive for IFN activity. See Figure 59a-d , which provide detected levels of type I and type II IFN activity in the IFN bioassay for different plates of cells treated with patient serum and spiked control serum. Each of panels a-d show that increased dose of IFN in the assay results in increased detection of IFN activity..
- Anti-IFN-type specific antibodies are pre-incubated with either the positive serum sample(s) (in the case of MEDI 545, anti-IFN beta, anti-IFN gamma and anti-IFN omega that bind to the IFN ligand itself) or with the cells (in the case of MEDI 546 that binds to the Type I interferon receptor on the HEK293H cells) followed by addition of the samples to the cells and chemiluminescence determination as above. Spiked samples that demonstrate lower chemiluminescence following specific antibody treatment are considered to be positive for the presence of the particular IFN(s) that is neutralized by the IFN-specific antibodies.
- Figure 60(a) shows that increasing dose of MEDI-545 in the treated wells increasingly neutralizes of IFN activity as does increasing dose of MEDI-546 ( Figure 60(b) ).
- Figures 61-63 show that IFN ⁇ , IFN ⁇ , and IFN ⁇ , respectively, are neutralized by antibodies specific for IFN ⁇ , IFN ⁇ , and IFN ⁇ , as expected.
- Fifty-nine percent were receiving at least 1 potential disease-modifying medication other than corticosteroids.
- Luminex xMAP technology was used to detect changes in 89 analytes and was performed by Rules Based Medicine (see the world wide web at domain name rulesbasedmedicine . com).
- QuantiGenePlex assay was first performed to assess the ability of QuantiGenePlex to detect 22 IFN-inducible transcripts in whole blood stimulated with IFN ⁇ 2b.
- the 22 IFN-inducible transcripts detected by this initial QuantiGenePlex assay were selected based on their consistent up-regulation in SLE patients and are shown on the x-axis of the graphs shown in Figures 75 and 76 .
- Stimulation of the whole blood was performed by incubating freshly drawn Na-EDTA whole blood from 5 healthy donors with 20 IU/mL IFN ⁇ 2b for 4 hours. Following this incubation, 2.5 mL of the stimulated whole blood was added to PAXgene tubes, mixed, and held overnight at room temperature. After overnight incubation, the samples were frozen at - 80°C. These sample-handling procedures were selected to mimic those to be used during clinical trials.
- PAXgene blood was analyzed for expression levels of the IFN-inducible transcripts.
- PAXgene blood (500 ⁇ L) was pelleted and then lysed in 139 ⁇ L of buffer according to the QuantiGenePlex PAXgene Blood Lysis Protocol. Processed blood from each donor was split into duplicate wells and hybridized overnight with a multiplex probe set for the 22 IFN-inducible genes. Gene expression was assessed the following day using a Luminex 100 instrument with BioRad BioPlex software. Fold changes were assessed for each individual based on the increase in signal observed between IFN-stimulated and PBS-stimulated control wells.
- Figure 75 shows the fold-change in expression of each of the 22 IFN-inducible genes following IFN stimulation of each of the 5 healthy volunteer whole blood samples. The dashed line indicates a 2-fold change over PBS-stimulated control samples.
- QuantiGenePlex assay was used to detect levels of IFN-inducible transcripts in whole blood of SLE patients. Twenty of the 22 probes from the original QuantiGenePlex kit, probes identified in Figures 75 and 76 , were retained in the QuantiaenePlex assay used for this data analysis. Two probes, HSXIAPAF1 and GIP3, were substituted with different probes, XAF1 and IF16. Using this panel of 22 probes, a baseline gene signature was established based on whole blood samples of ten healthy donors (blue bars in each panel).
- the baseline gene signature based on the whole blood samples of the healthy donors, was compared to (1) the gene signature of an SLE patient that had detectable IFN serum activity and (2) the gene signature of an SLE patient that did not have detectable IFN serum activity.
- IFN serum activity was detected in the SLE patient serum samples using the assay described in Example 20.
- Figure 77a shows a comparison of the gene signature of an SLE patient (red bars) having no detectable serum IFN ⁇ activity (i.e. serum IFN activity ⁇ 2.5 IU/mL) relative to the baseline gene signature (blue bars). With the exception of LAMP3, all transcript levels were detected as elevated in blood from the SLE patient with no IFN serum activity.
- Figure 77b shows a comparison of the gene signature of an SLE patient with high levels of serum IFN ⁇ activity (red bars) relative to the baseline gene signature (blue bars). All transcripts were elevated at least 2-fold in the blood of the patient with high IFN serum activity, with maximal inductions of nearly 80-fold for IFI27.
- QuantiGenePlex was next evaluated for its comparability to data obtained from a Fluidigm Real-Time PCR assay.
- QuantiGenePlex and Fluidigm methods were each used to analyze and compare transcript levels in PAXgene-preserved whole blood samples from 16 SLE patients participating in a Phase I clinical trial (of a monoclonal antibody against IFN ⁇ ) relative to a composite median gene score from 10 healthy donors.
- Fluidigm analyses were carried out using a mixture of TaqMan Gene Expression assays, including 4 reference control genes prepared using the TaqMan PreAmp Master Mix Kit (Applied Biosystems).
- Dynamic arrays were loaded using a NanoFlex 4-IFC Controller (Fluidigm Corp) and real-time reactions were performed using a BioMark Real-Time PCR System. Results were analyzed using BioMark Real-Time PCR Analysis software. Delta-delta Cts (DDCt) were calculated using the mean of 4 reference genes (GAPDH, TFRC, b2M, and 18S) and a calibrator sample. The results obtained using whole blood samples from SLE patients demonstrated a high degree of correlation between QuantiGenePlex and Real-Time PCR approaches to detect disease-related gene expression profiles.
- Figure 79b shows the changes in gene signature of the placebo- or antibody-treated SLE patients using QuantiGenePlex technology. For each non-placebo subject, a decrease in IFN gene signature is observed within 24 hours following drug administration and is consistent between Fluidigm and QuantiGenePlex. Subsequent changes in transcript levels post-administration were also highly similar between QuantiGenePlex and Fluidigm technologies.
Landscapes
- Health & Medical Sciences (AREA)
- Chemical & Material Sciences (AREA)
- Organic Chemistry (AREA)
- Life Sciences & Earth Sciences (AREA)
- General Health & Medical Sciences (AREA)
- Medicinal Chemistry (AREA)
- Engineering & Computer Science (AREA)
- Bioinformatics & Cheminformatics (AREA)
- Public Health (AREA)
- Veterinary Medicine (AREA)
- Pharmacology & Pharmacy (AREA)
- Animal Behavior & Ethology (AREA)
- Nuclear Medicine, Radiotherapy & Molecular Imaging (AREA)
- General Chemical & Material Sciences (AREA)
- Chemical Kinetics & Catalysis (AREA)
- Immunology (AREA)
- Proteomics, Peptides & Aminoacids (AREA)
- Genetics & Genomics (AREA)
- Biochemistry (AREA)
- Molecular Biology (AREA)
- Biophysics (AREA)
- Diabetes (AREA)
- Wood Science & Technology (AREA)
- Zoology (AREA)
- Analytical Chemistry (AREA)
- Microbiology (AREA)
- Dermatology (AREA)
- Neurology (AREA)
- Physics & Mathematics (AREA)
- General Engineering & Computer Science (AREA)
- Biotechnology (AREA)
- Pathology (AREA)
- Heart & Thoracic Surgery (AREA)
- Orthopedic Medicine & Surgery (AREA)
- Emergency Medicine (AREA)
- Hematology (AREA)
- Rheumatology (AREA)
- Obesity (AREA)
- Cardiology (AREA)
- Pain & Pain Management (AREA)
Applications Claiming Priority (14)
| Application Number | Priority Date | Filing Date | Title |
|---|---|---|---|
| US87300806P | 2006-12-06 | 2006-12-06 | |
| US90776207P | 2007-04-16 | 2007-04-16 | |
| US90776707P | 2007-04-16 | 2007-04-16 | |
| US92421907P | 2007-05-03 | 2007-05-03 | |
| US92422007P | 2007-05-03 | 2007-05-03 | |
| US92458407P | 2007-05-21 | 2007-05-21 | |
| US96018707P | 2007-09-19 | 2007-09-19 | |
| US99617407P | 2007-11-05 | 2007-11-05 | |
| US99617607P | 2007-11-05 | 2007-11-05 | |
| US99621907P | 2007-11-06 | 2007-11-06 | |
| US99682007P | 2007-12-06 | 2007-12-06 | |
| EP07867637A EP2077858A4 (fr) | 2006-12-06 | 2007-12-06 | Marqueurs pharmacodynamiques alpha-induit d'interferon |
| PCT/US2007/024941 WO2008070135A2 (fr) | 2006-12-06 | 2007-12-06 | Procédés de traitement de lupus érythémateux systémique |
| PCT/US2007/024947 WO2008070137A2 (fr) | 2006-12-06 | 2007-12-06 | Marqueurs pharmacodynamiques alpha-induit d'interféron |
Related Parent Applications (2)
| Application Number | Title | Priority Date | Filing Date |
|---|---|---|---|
| EP07867637A Division EP2077858A4 (fr) | 2006-12-06 | 2007-12-06 | Marqueurs pharmacodynamiques alpha-induit d'interferon |
| PCT/US2007/024947 Previously-Filed-Application WO2008070137A2 (fr) | 2006-12-06 | 2007-12-06 | Marqueurs pharmacodynamiques alpha-induit d'interféron |
Publications (2)
| Publication Number | Publication Date |
|---|---|
| EP2712930A2 true EP2712930A2 (fr) | 2014-04-02 |
| EP2712930A3 EP2712930A3 (fr) | 2014-04-23 |
Family
ID=39492862
Family Applications (3)
| Application Number | Title | Priority Date | Filing Date |
|---|---|---|---|
| EP07867637A Ceased EP2077858A4 (fr) | 2006-12-06 | 2007-12-06 | Marqueurs pharmacodynamiques alpha-induit d'interferon |
| EP13179923.1A Withdrawn EP2712930A3 (fr) | 2006-12-06 | 2007-12-06 | Marqueurs pharmacodynamiques par induction alpha d'interféron |
| EP07867634A Ceased EP2073844A4 (fr) | 2006-12-06 | 2007-12-06 | Procedes de traitement de lupus erythemateux systemique |
Family Applications Before (1)
| Application Number | Title | Priority Date | Filing Date |
|---|---|---|---|
| EP07867637A Ceased EP2077858A4 (fr) | 2006-12-06 | 2007-12-06 | Marqueurs pharmacodynamiques alpha-induit d'interferon |
Family Applications After (1)
| Application Number | Title | Priority Date | Filing Date |
|---|---|---|---|
| EP07867634A Ceased EP2073844A4 (fr) | 2006-12-06 | 2007-12-06 | Procedes de traitement de lupus erythemateux systemique |
Country Status (10)
| Country | Link |
|---|---|
| US (5) | US20100143373A1 (fr) |
| EP (3) | EP2077858A4 (fr) |
| JP (4) | JP2010512315A (fr) |
| KR (2) | KR20090088932A (fr) |
| AU (2) | AU2007327993B2 (fr) |
| BR (2) | BRPI0720035A2 (fr) |
| CA (2) | CA2670594A1 (fr) |
| MX (1) | MX2009005787A (fr) |
| RU (2) | RU2527068C2 (fr) |
| WO (2) | WO2008070135A2 (fr) |
Families Citing this family (47)
| Publication number | Priority date | Publication date | Assignee | Title |
|---|---|---|---|---|
| EP2077858A4 (fr) * | 2006-12-06 | 2011-07-20 | Medimmune Llc | Marqueurs pharmacodynamiques alpha-induit d'interferon |
| EP2076590A4 (fr) * | 2007-05-03 | 2011-06-01 | Medimmune Llc | Marqueurs d'auto-anticorps de maladie auto-immune |
| ES2542836T3 (es) * | 2007-07-12 | 2015-08-12 | The Brigham And Women's Hospital, Inc. | Composiciones y métodos para diagnosticar y evaluar miopatías inflamatorias |
| PT2219452E (pt) | 2007-11-05 | 2016-01-26 | Medimmune Llc | Métodos de tratamento de esclerodermia |
| SG188147A1 (en) * | 2008-02-08 | 2013-03-28 | Medimmune Llc | Disease markers and uses thereof |
| WO2011109440A1 (fr) | 2010-03-01 | 2011-09-09 | Caris Life Sciences Luxembourg Holdings | Biomarqueurs pour théranostique |
| US20120251546A1 (en) * | 2009-09-03 | 2012-10-04 | Medimmune Llc | Type 1 inteferon diagnostic |
| WO2011127219A1 (fr) | 2010-04-06 | 2011-10-13 | Caris Life Sciences Luxembourg Holdings | Biomarqueurs circulants pour une maladie |
| US9709565B2 (en) | 2010-04-21 | 2017-07-18 | Memed Diagnostics Ltd. | Signatures and determinants for distinguishing between a bacterial and viral infection and methods of use thereof |
| US20130317040A1 (en) * | 2010-12-22 | 2013-11-28 | The Feinstein Institute Of Medical Research | Methods for treating systemic lupus erythematosus using hiv protease inhibitors |
| AU2012249601A1 (en) * | 2011-04-26 | 2013-05-09 | Genentech, Inc. | Compositions and method for treating autoimmune diseases |
| AU2013204880B2 (en) * | 2011-04-26 | 2016-11-24 | Genentech, Inc. | Compositions and method for treating autoimmune diseases |
| GB201115665D0 (en) | 2011-09-09 | 2011-10-26 | Univ Leuven Kath | Autoimmune and inflammatory disorder therapy |
| MX339762B (es) | 2011-09-28 | 2016-05-27 | Univ Autonoma Del Estado De Morelos | Metalopeptidos inmunomoduladores (immp) y composiciones que los contienen. |
| WO2013101771A2 (fr) | 2011-12-30 | 2013-07-04 | Genentech, Inc. | Compositions et méthode pour le traitement de maladies auto-immunes |
| EP3367099B1 (fr) | 2012-02-09 | 2021-05-26 | Memed Diagnostics Ltd. | Signatures et déterminants pour diagnostiquer des infections et leurs procédés d'utilisation |
| US20150168398A1 (en) | 2012-05-17 | 2015-06-18 | The Johns Hopkins University | Methods for identifying patterns of ifn induced expression and use in diagnosis, monitoring and therapy |
| AU2013274389A1 (en) * | 2012-06-13 | 2015-01-22 | Astrazeneca Ab | Fixed dosage regimens for anti-type I interferon receptor (IFNAR) antibodies |
| US20140156297A1 (en) * | 2012-08-03 | 2014-06-05 | Axelacare Holdings, Inc. | Computer program, method, and system for pharmacist-assisted treatment of patients |
| US20140039907A1 (en) * | 2012-08-03 | 2014-02-06 | AxelaCare Health Solutions, Inc. | Computer program, method, and system for collecting patient data with a portable electronic device |
| US20140275257A1 (en) * | 2013-03-14 | 2014-09-18 | Foundation for the State University of New York | N-acetyl cysteine compositions in the treatment of systemic lupus erythematosus |
| BR112017002884A2 (pt) | 2014-08-14 | 2018-01-30 | Memed Diagnostics Ltd | ?análise computacional de dados biológicos por meio do uso de variedade e hiperplano? |
| CN105420347A (zh) * | 2014-08-21 | 2016-03-23 | 南京大学医学院附属鼓楼医院 | 一种用于系统性红斑狼疮的基因诊断试剂盒 |
| US20170234873A1 (en) | 2014-10-14 | 2017-08-17 | Memed Diagnostics Ltd. | Signatures and determinants for diagnosing infections in non-human subjects and methods of use thereof |
| CN111624345A (zh) | 2014-12-11 | 2020-09-04 | 米密德诊断学有限公司 | 用于诊断多种感染的标记组合及其使用方法 |
| IL287757B (en) | 2016-03-03 | 2022-07-01 | Memed Diagnostics Ltd | Analyzing rna for diagnosing infection type |
| EP3423590A4 (fr) | 2016-03-03 | 2020-02-26 | Memed Diagnostics Ltd. | Déterminants d'arn pour différencier des infections bactériennes d'infections virales |
| EP3482201B1 (fr) | 2016-07-10 | 2022-12-14 | Memed Diagnostics Ltd. | Diagnostic précoce d'infections |
| EP3482200B1 (fr) | 2016-07-10 | 2022-05-04 | Memed Diagnostics Ltd. | Signatures de protéines permettant d'établir la différence entre des infections bactériennes et des infections virales |
| WO2018060998A1 (fr) | 2016-09-29 | 2018-04-05 | Memed Diagnostics Ltd. | Méthodes de pronostic et de traitement |
| WO2018060999A1 (fr) | 2016-09-29 | 2018-04-05 | Memed Diagnostics Ltd. | Procédés d'évaluation de risque et de classification de maladie |
| WO2018112464A1 (fr) * | 2016-12-16 | 2018-06-21 | The Penn State Research Foundation | Procédés de gestion de reproduction améliorée d'ongulés ruminants |
| WO2018136625A2 (fr) * | 2017-01-20 | 2018-07-26 | Children's Medical Center Corporation | Compositions et méthodes de traitement de maladies caractérisées par une perte de synapses induite par la microglie réactive |
| US10209260B2 (en) | 2017-07-05 | 2019-02-19 | Memed Diagnostics Ltd. | Signatures and determinants for diagnosing infections and methods of use thereof |
| US11926664B2 (en) | 2017-07-25 | 2024-03-12 | INSERM (Institut National de la Santé et de la Recherche Médicale) | Methods and pharmaceutical compositions for modulating monocytopoiesis |
| US12331320B2 (en) | 2018-10-10 | 2025-06-17 | The Research Foundation For The State University Of New York | Genome edited cancer cell vaccines |
| EA202191133A1 (ru) * | 2018-10-26 | 2021-07-12 | Янссен Байотек, Инк. | Сигнатуры интерферона типа i и способы их применения |
| WO2020117715A1 (fr) | 2018-12-03 | 2020-06-11 | Board Of Regents, The University Of Texas System | Analogues d'oligo-benzamide et leur utilisation dans le traitement du cancer |
| EP3924383A1 (fr) | 2019-02-15 | 2021-12-22 | Astrazeneca AB | Troubles induits par l'interféron de type i |
| US12011284B2 (en) * | 2020-05-19 | 2024-06-18 | Peachy Corp. | Systems and methods for preventing and treating wrinkles |
| KR102429261B1 (ko) | 2020-08-25 | 2022-08-03 | 충북대학교 산학협력단 | 한국인의 tnf 저해제 약물 반응성 예측을 위한 바이오마커 |
| AR123650A1 (es) * | 2020-10-02 | 2022-12-28 | Celgene Corp | Métodos para el tratamiento del lupus eritematoso sistémico y el uso de biomarcadores como un predictor de sensibilidad clínica a terapias |
| HRP20231255T1 (hr) | 2021-04-23 | 2024-02-02 | Astrazeneca Ab | Režim doziranja anti-ifnar1 za potkožnu injekciju |
| KR20240023602A (ko) | 2021-06-18 | 2024-02-22 | 아이오니스 파마수티컬즈, 인코포레이티드 | Ifnar1 발현을 감소시키기 위한 화합물 및 방법 |
| FR3138815A1 (fr) * | 2022-08-12 | 2024-02-16 | bioMérieux | Détermination de la nature virale ou bactérienne d’une infection |
| CN117305441B (zh) * | 2023-10-13 | 2025-04-08 | 福建农林大学 | 一种2型糖尿病的生物标志物和治疗靶点及浒苔寡糖的应用方法 |
| WO2025213238A1 (fr) * | 2024-04-12 | 2025-10-16 | HaemaLogiX Ltd | Formulations d'anticorps anti-kma |
Citations (12)
| Publication number | Priority date | Publication date | Assignee | Title |
|---|---|---|---|---|
| WO1984003105A1 (fr) | 1983-02-04 | 1984-08-16 | David Stanley Secher | Anticorps monoclonal |
| EP0119476A2 (fr) | 1983-02-22 | 1984-09-26 | BOEHRINGER INGELHEIM INTERNATIONAL GmbH | Lignées de cellules hybrides produisant de l'immunoglobuline, leur application et procédé de préparation |
| US4885166A (en) | 1985-06-11 | 1989-12-05 | Ciba-Geigy Corporation | Hybrid interferons |
| US4902618A (en) | 1983-02-04 | 1990-02-20 | Wadley Technologies, Inc. | Production of hybridoma antibodies for interferon |
| US5143854A (en) | 1989-06-07 | 1992-09-01 | Affymax Technologies N.V. | Large scale photolithographic solid phase synthesis of polypeptides and receptor binding screening thereof |
| US5718905A (en) | 1992-06-16 | 1998-02-17 | Centre National De La Recherche Scientifique (C.N.R.S.) | Preparation and use of novel cyclodextrin-based dispersible colloidal systems in the form of nanospheres |
| US5744305A (en) | 1989-06-07 | 1998-04-28 | Affymetrix, Inc. | Arrays of materials attached to a substrate |
| US5972901A (en) | 1994-03-23 | 1999-10-26 | Case Western Reserve University | Serpin enzyme complex receptor--mediated gene transfer |
| US6008336A (en) | 1994-03-23 | 1999-12-28 | Case Western Reserve University | Compacted nucleic acids and their delivery to cells |
| US6077835A (en) | 1994-03-23 | 2000-06-20 | Case Western Reserve University | Delivery of compacted nucleic acid to cells |
| US6207195B1 (en) | 1997-06-13 | 2001-03-27 | The Johns Hopkins University | Therapeutic nanospheres |
| US7087726B2 (en) | 2001-02-22 | 2006-08-08 | Genentech, Inc. | Anti-interferon-α antibodies |
Family Cites Families (23)
| Publication number | Priority date | Publication date | Assignee | Title |
|---|---|---|---|---|
| US5888511A (en) * | 1993-02-26 | 1999-03-30 | Advanced Biotherapy Concepts, Inc. | Treatment of autoimmune diseases, including AIDS |
| US6905587B2 (en) * | 1996-03-22 | 2005-06-14 | Ronald Redline | Method for enhancing the solderability of a surface |
| AU757961B2 (en) * | 1998-09-30 | 2003-03-13 | Sankyo Company Limited | Anti-Fas antibodies |
| US20050008683A1 (en) * | 2000-06-29 | 2005-01-13 | Becton Dickinson And Company | Method for delivering interferons to the intradermal compartment |
| US6905827B2 (en) * | 2001-06-08 | 2005-06-14 | Expression Diagnostics, Inc. | Methods and compositions for diagnosing or monitoring auto immune and chronic inflammatory diseases |
| WO2003046008A1 (fr) * | 2001-11-30 | 2003-06-05 | Innogenetics N.V. | Utilisation therapeutique d'anticorps et de fragments associes se liant a l'interferon gamma chez des primates. |
| EP2298360A3 (fr) * | 2002-11-21 | 2011-07-13 | Bayhill Therapeutics, Inc. | Procédés et compositions d'acide nucléique modulatoire immunitaire pour empêcher et traiter une maladie |
| CN1871252A (zh) * | 2003-09-05 | 2006-11-29 | Gtc生物治疗学公司 | 在转基因哺乳动物奶中生产融合蛋白的方法 |
| NZ547157A (en) * | 2003-12-10 | 2009-07-31 | Medarex Inc | Interferon Alpha Antibodies and their uses |
| HUE035082T2 (en) * | 2004-06-21 | 2018-05-02 | Squibb & Sons Llc | Interferon alpha receptor 1 antibodies and their use |
| US20070166281A1 (en) * | 2004-08-21 | 2007-07-19 | Kosak Kenneth M | Chloroquine coupled antibodies and other proteins with methods for their synthesis |
| US7833795B2 (en) * | 2004-08-24 | 2010-11-16 | The Trustees Of The University Of Pennsylvania | Assessment of cardiovascular risk using isoprostane biomarkers and COX-2 selective inhibitors |
| US7571055B2 (en) * | 2004-10-13 | 2009-08-04 | Regents Of The University Of Minnesota | Systemic lupus erythematosus |
| WO2006086586A2 (fr) * | 2005-02-10 | 2006-08-17 | Baylor Research Institute | Anticorps monoclonaux anti-interferon alpha et procedes d'utilisation |
| US20070117105A1 (en) * | 2005-05-12 | 2007-05-24 | Crow Mary K | Interferon assay |
| US20070065844A1 (en) * | 2005-06-08 | 2007-03-22 | Massachusetts Institute Of Technology | Solution-based methods for RNA expression profiling |
| PT2327792E (pt) * | 2005-08-05 | 2013-11-21 | Genentech Inc | Métodos e composições para a detecção de distúrbios autoimunes |
| US7608395B2 (en) * | 2005-09-15 | 2009-10-27 | Baylor Research Institute | Systemic lupus erythematosus diagnostic assay |
| EA015860B1 (ru) * | 2005-10-13 | 2011-12-30 | Хьюман Дженом Сайенсиз, Инк. | Способы лечения аутоиммунных заболеваний при использовании антагониста нейтрокина-альфа |
| EP2057190A4 (fr) * | 2006-08-09 | 2010-07-28 | Baylor Res Inst | Anticorps monoclonaux anti-interféron alpha et leurs procédés d'utilisation |
| EP2077858A4 (fr) * | 2006-12-06 | 2011-07-20 | Medimmune Llc | Marqueurs pharmacodynamiques alpha-induit d'interferon |
| CA2682292A1 (fr) * | 2007-03-30 | 2008-10-09 | Medimmune, Llc | Formulation aqueuse comportant un anticorps anti-interferon alpha humain |
| US20120251546A1 (en) * | 2009-09-03 | 2012-10-04 | Medimmune Llc | Type 1 inteferon diagnostic |
-
2007
- 2007-12-06 EP EP07867637A patent/EP2077858A4/fr not_active Ceased
- 2007-12-06 AU AU2007327993A patent/AU2007327993B2/en not_active Ceased
- 2007-12-06 US US12/517,334 patent/US20100143373A1/en not_active Abandoned
- 2007-12-06 US US12/517,333 patent/US20100143372A1/en not_active Abandoned
- 2007-12-06 RU RU2009125616/10A patent/RU2527068C2/ru not_active IP Right Cessation
- 2007-12-06 AU AU2007327995A patent/AU2007327995B2/en not_active Ceased
- 2007-12-06 JP JP2009540288A patent/JP2010512315A/ja active Pending
- 2007-12-06 WO PCT/US2007/024941 patent/WO2008070135A2/fr not_active Ceased
- 2007-12-06 EP EP13179923.1A patent/EP2712930A3/fr not_active Withdrawn
- 2007-12-06 KR KR1020097013891A patent/KR20090088932A/ko not_active Ceased
- 2007-12-06 CA CA002670594A patent/CA2670594A1/fr not_active Abandoned
- 2007-12-06 BR BRPI0720035-8A patent/BRPI0720035A2/pt active Search and Examination
- 2007-12-06 BR BRPI0719912-0A2A patent/BRPI0719912A2/pt not_active IP Right Cessation
- 2007-12-06 WO PCT/US2007/024947 patent/WO2008070137A2/fr not_active Ceased
- 2007-12-06 EP EP07867634A patent/EP2073844A4/fr not_active Ceased
- 2007-12-06 JP JP2009540285A patent/JP2010512313A/ja active Pending
- 2007-12-06 MX MX2009005787A patent/MX2009005787A/es active IP Right Grant
- 2007-12-06 KR KR1020097013872A patent/KR101532797B1/ko not_active Expired - Fee Related
- 2007-12-06 CA CA002670897A patent/CA2670897A1/fr not_active Abandoned
-
2013
- 2013-09-05 JP JP2013183939A patent/JP2014014370A/ja active Pending
- 2013-09-19 JP JP2013193959A patent/JP2014040430A/ja active Pending
-
2014
- 2014-07-03 RU RU2014127178A patent/RU2014127178A/ru not_active Application Discontinuation
- 2014-07-14 US US14/330,609 patent/US20150044222A1/en not_active Abandoned
-
2015
- 2015-01-27 US US14/606,832 patent/US20150147336A1/en not_active Abandoned
-
2016
- 2016-10-11 US US15/290,925 patent/US20170121771A1/en not_active Abandoned
Patent Citations (12)
| Publication number | Priority date | Publication date | Assignee | Title |
|---|---|---|---|---|
| WO1984003105A1 (fr) | 1983-02-04 | 1984-08-16 | David Stanley Secher | Anticorps monoclonal |
| US4902618A (en) | 1983-02-04 | 1990-02-20 | Wadley Technologies, Inc. | Production of hybridoma antibodies for interferon |
| EP0119476A2 (fr) | 1983-02-22 | 1984-09-26 | BOEHRINGER INGELHEIM INTERNATIONAL GmbH | Lignées de cellules hybrides produisant de l'immunoglobuline, leur application et procédé de préparation |
| US4885166A (en) | 1985-06-11 | 1989-12-05 | Ciba-Geigy Corporation | Hybrid interferons |
| US5143854A (en) | 1989-06-07 | 1992-09-01 | Affymax Technologies N.V. | Large scale photolithographic solid phase synthesis of polypeptides and receptor binding screening thereof |
| US5744305A (en) | 1989-06-07 | 1998-04-28 | Affymetrix, Inc. | Arrays of materials attached to a substrate |
| US5718905A (en) | 1992-06-16 | 1998-02-17 | Centre National De La Recherche Scientifique (C.N.R.S.) | Preparation and use of novel cyclodextrin-based dispersible colloidal systems in the form of nanospheres |
| US5972901A (en) | 1994-03-23 | 1999-10-26 | Case Western Reserve University | Serpin enzyme complex receptor--mediated gene transfer |
| US6008336A (en) | 1994-03-23 | 1999-12-28 | Case Western Reserve University | Compacted nucleic acids and their delivery to cells |
| US6077835A (en) | 1994-03-23 | 2000-06-20 | Case Western Reserve University | Delivery of compacted nucleic acid to cells |
| US6207195B1 (en) | 1997-06-13 | 2001-03-27 | The Johns Hopkins University | Therapeutic nanospheres |
| US7087726B2 (en) | 2001-02-22 | 2006-08-08 | Genentech, Inc. | Anti-interferon-α antibodies |
Non-Patent Citations (14)
| Title |
|---|
| ALCANTARA ET AL., NUC. ACID. RES., vol. 30, 2002, pages 2068 - 2075 |
| AUSUBEL ET AL.,: "Current Protocols in Molecular Biology", 1987, JOHN WILEY & SONS, INC. |
| AUTO-ANTIBODY MARKERS OF AUTOIMMUNE DISEASE, 3 May 2007 (2007-05-03) |
| AUTO-ANTIBODY MARKERS OF AUTOIMMUNE DISEASE, 6 November 2007 (2007-11-06) |
| BENNETT L; PALUCKA AK; ARCE E ET AL.: "Interferon and granulopoiesis signatures in systemic lupus erythematosus blood", J EXP MED., vol. 197, no. 6, 2003, pages 711 - 723 |
| BOMBARDIER C; GLADMAN D D; UROWITZ M B; CARON D; CHANG C H: "SLE: Derivation of the SLEDAI for Lupus Patients", ARTHRITIS RHEUM, vol. 35, 1992, pages 630 - 640 |
| CLIN. PHARMA. THER., vol. 29, 1985, pages 69 - 92 |
| COHEN ET AL., METH. ENZYMOL., vol. 217, 1993, pages 618 - 644 |
| DIAZ-ALDERETE A; CRISPIN JC; VARGAS-ROJAS MI; ALCOCER-VARELA J: "IL-10 production in B cells is confined to CD154+ cells in patients with systemic lupus erythematosus", J AUTOIMMUN., vol. 23, no. 4, 2004, pages 379 - 383 |
| KIRCHHOFF ET AL., ONCOGENE, vol. 18, 1999, pages 3725 - 3736 |
| LOEFFLER; BEHR, METH. ENZYMOL., vol. 2/7, 1993, pages 599 - 618 |
| RIVERO SJ; DIAZ-JOUANEN E; ALARCON-SEGOVIA D: "Lymphopenia in systemic lupus erythematosus. Clinical, diagnostic, and prognostic significance", ARTHRITIS RHEUM., vol. 21, no. 3, 1978, pages 295 - 305 |
| SAMBROOK ET AL.: "Molecular Cloning: A Laboratory Manual. 2nd, ed.,", 1989, COLD SPRING HARBOR LABORATORY PRESS |
| WANG H; XU J; JI X ET AL.: "The abnormal apoptosis of T cell subsets and possible involvement of IL-10 in systemic lupus erythematosus", CELL IMMUNOL., vol. 235, no. 2, 2005, pages 117 - 121 |
Also Published As
Similar Documents
| Publication | Publication Date | Title |
|---|---|---|
| AU2007327995B2 (en) | Interferon alpha-induced pharmacodynamic markers | |
| AU2008247398B2 (en) | Interferon alpha-induced pharmacodynamic markers | |
| AU2010289383B2 (en) | Type 1 interferon diagnostic | |
| CN101999001B (zh) | 疾病标志物及其用途 | |
| US20110287022A1 (en) | Interferon alpha-induced pharmacodynamic markers | |
| CN101594882A (zh) | 干扰素α诱导的药代动力学标记物 | |
| US20100261172A1 (en) | Interferon alpha-induced pharmacodynamic markers | |
| WO2009155559A1 (fr) | Marqueurs pharmacodynamiques induits par interferon alpha | |
| AU2014200128A1 (en) | Interferon alpha-induced pharmacodynamic markers | |
| AU2014200127A1 (en) | Interferon alpha-induced pharmacodynamic markers | |
| HK1140406A (en) | Interferon alpha-induced pharmacodynamic markers | |
| AU2015203772A1 (en) | Disease markers and uses thereof |
Legal Events
| Date | Code | Title | Description |
|---|---|---|---|
| PUAL | Search report despatched |
Free format text: ORIGINAL CODE: 0009013 |
|
| PUAI | Public reference made under article 153(3) epc to a published international application that has entered the european phase |
Free format text: ORIGINAL CODE: 0009012 |
|
| 17P | Request for examination filed |
Effective date: 20130906 |
|
| AC | Divisional application: reference to earlier application |
Ref document number: 2077858 Country of ref document: EP Kind code of ref document: P |
|
| AK | Designated contracting states |
Kind code of ref document: A2 Designated state(s): AT BE BG CH CY CZ DE DK EE ES FI FR GB GR HU IE IS IT LI LT LU LV MC MT NL PL PT RO SE SI SK TR |
|
| AK | Designated contracting states |
Kind code of ref document: A3 Designated state(s): AT BE BG CH CY CZ DE DK EE ES FI FR GB GR HU IE IS IT LI LT LU LV MC MT NL PL PT RO SE SI SK TR |
|
| RIC1 | Information provided on ipc code assigned before grant |
Ipc: A61K 39/395 20060101ALI20140319BHEP Ipc: C12Q 1/68 20060101AFI20140319BHEP Ipc: A61K 39/00 20060101ALI20140319BHEP Ipc: C07K 16/24 20060101ALI20140319BHEP |
|
| 17Q | First examination report despatched |
Effective date: 20150713 |
|
| STAA | Information on the status of an ep patent application or granted ep patent |
Free format text: STATUS: THE APPLICATION IS DEEMED TO BE WITHDRAWN |
|
| 18D | Application deemed to be withdrawn |
Effective date: 20151124 |