EP3173490B1 - Procédé de sélection de cellules, procédé de détection de cellules, appareil de sélection de cellules et appareil de détection de cellules - Google Patents
Procédé de sélection de cellules, procédé de détection de cellules, appareil de sélection de cellules et appareil de détection de cellules Download PDFInfo
- Publication number
- EP3173490B1 EP3173490B1 EP16200882.5A EP16200882A EP3173490B1 EP 3173490 B1 EP3173490 B1 EP 3173490B1 EP 16200882 A EP16200882 A EP 16200882A EP 3173490 B1 EP3173490 B1 EP 3173490B1
- Authority
- EP
- European Patent Office
- Prior art keywords
- cell
- fluorescence
- fluorescent dye
- cells
- detection
- Prior art date
- Legal status (The legal status is an assumption and is not a legal conclusion. Google has not performed a legal analysis and makes no representation as to the accuracy of the status listed.)
- Active
Links
Images






Classifications
-
- C—CHEMISTRY; METALLURGY
- C12—BIOCHEMISTRY; BEER; SPIRITS; WINE; VINEGAR; MICROBIOLOGY; ENZYMOLOGY; MUTATION OR GENETIC ENGINEERING
- C12Q—MEASURING OR TESTING PROCESSES INVOLVING ENZYMES, NUCLEIC ACIDS OR MICROORGANISMS; COMPOSITIONS OR TEST PAPERS THEREFOR; PROCESSES OF PREPARING SUCH COMPOSITIONS; CONDITION-RESPONSIVE CONTROL IN MICROBIOLOGICAL OR ENZYMOLOGICAL PROCESSES
- C12Q1/00—Measuring or testing processes involving enzymes, nucleic acids or microorganisms; Compositions therefor; Processes of preparing such compositions
- C12Q1/68—Measuring or testing processes involving enzymes, nucleic acids or microorganisms; Compositions therefor; Processes of preparing such compositions involving nucleic acids
- C12Q1/6813—Hybridisation assays
- C12Q1/6841—In situ hybridisation
-
- G—PHYSICS
- G01—MEASURING; TESTING
- G01N—INVESTIGATING OR ANALYSING MATERIALS BY DETERMINING THEIR CHEMICAL OR PHYSICAL PROPERTIES
- G01N21/00—Investigating or analysing materials by the use of optical means, i.e. using sub-millimetre waves, infrared, visible or ultraviolet light
- G01N21/62—Systems in which the material investigated is excited whereby it emits light or causes a change in wavelength of the incident light
- G01N21/63—Systems in which the material investigated is excited whereby it emits light or causes a change in wavelength of the incident light optically excited
- G01N21/64—Fluorescence; Phosphorescence
- G01N21/6428—Measuring fluorescence of fluorescent products of reactions or of fluorochrome labelled reactive substances, e.g. measuring quenching effects, using measuring "optrodes"
-
- G—PHYSICS
- G01—MEASURING; TESTING
- G01N—INVESTIGATING OR ANALYSING MATERIALS BY DETERMINING THEIR CHEMICAL OR PHYSICAL PROPERTIES
- G01N21/00—Investigating or analysing materials by the use of optical means, i.e. using sub-millimetre waves, infrared, visible or ultraviolet light
- G01N21/62—Systems in which the material investigated is excited whereby it emits light or causes a change in wavelength of the incident light
- G01N21/63—Systems in which the material investigated is excited whereby it emits light or causes a change in wavelength of the incident light optically excited
- G01N21/64—Fluorescence; Phosphorescence
- G01N21/6428—Measuring fluorescence of fluorescent products of reactions or of fluorochrome labelled reactive substances, e.g. measuring quenching effects, using measuring "optrodes"
- G01N2021/6439—Measuring fluorescence of fluorescent products of reactions or of fluorochrome labelled reactive substances, e.g. measuring quenching effects, using measuring "optrodes" with indicators, stains, dyes, tags, labels, marks
Definitions
- the present invention relates to cell selection methods, cell detection methods, cell selection apparatuses, and cell detection apparatuses.
- WO03/048300 describes a cell processing method to be used when a flow cytometer or the like is applied to detection of a fluorescence in situ hybridization (FISH).
- FISH fluorescence in situ hybridization
- abnormal cells can be detected by causing a labeled probe to be bound to a DNA sequence region being the detection target in each cell, thereby staining the cell, and then, by detecting fluorescence caused by the labeled probe.
- abnormal cells can be accurately detected.
- the present invention provides a selection method for: excluding, from the analysis target, cells poorly stained by a labeled probe and cells in which nonspecific binding of the labeled probe has occurred; and selecting, as the analysis target, cells in which appropriate hybridization of the labeled probe to a DNA sequence region being the detection target has occurred.
- the present invention also provides a detection method for detecting, from the selected cells, abnormal cells in which genomic abnormality has occurred.
- genomic abnormality means that a sequence different from the wild-type DNA sequence is generated.
- Genetic abnormality includes gene amplification, deletion, inversion, translocation, and the like, for example.
- Gene amplification means that a specific gene in the genome is amplified.
- Delivery means that a part of a chromosome, for example, the long arm or the short arm, is lost.
- Translocation means that a part of a chromosome is cut and attached/fused to another chromosome.
- Inversion means that the order of DNA base sequence on a chromosome is partially inversed.
- Gene includes, for example, expression regulatory regions, coding regions, and exons or introns, irrespective of functional domains.
- the term “gene” includes regulatory sequences such as promoter, enhancer, and termination signal, in addition to coding region. Regulatory sequences of a gene may be located proximal to, in, or distal to a coding region.
- Abnormal cell is a cell in which at least one of genomic abnormalities of gene amplification, deletion, inversion, and translocation has occurred.
- Normal cell is a cell in which none of gene amplification, deletion, inversion, and translocation has occurred.
- Detection probe includes: a polynucleotide complementary to the base sequence of the detection target region in DNA in a cell; and a fluorescence substance which labels the polynucleotide.
- the fluorescence substance may directly or indirectly bind to the polynucleotide.
- "indirectly bind” means that the fluorescence substance binds to the polynucleotide via another substance (hereinafter, mediator) such as an antibody.
- mediator a hapten, an anti-hapten antibody, and the like can be used.
- a hapten that binds to the polynucleotide, an anti-hapten primary antibody, and a labeled secondary antibody that binds to the primary antibody can be used.
- a labeled anti-hapten primary antibody may be used.
- a mediator when used, the complex of the polynucleotide, the mediator, and the fluorescence substance will be collectively referred to as a "detection probe".
- the hapten include biotin, desthiobiotin and other derivatives thereof, dinitrophenol (DNP), and digoxigenin (DIG).
- DNP dinitrophenol
- DIG digoxigenin
- an anti-hapten primary antibody an anti-DNP antibody or an anti-DIG antibody can be used, for example.
- a scavenger which binds to biotin can be avidin, streptavidin, or an antibody.
- An antibody can be used as a scavenger for other haptens.
- the secondary antibody may be any secondary antibody as long as it can bind to the primary antibody, and is a goat-derived anti-rabbit antibody or a goat-derived anti-mouse antibody, for example.
- Evaluation probe includes: a polynucleotide complementary to the base sequence of the evaluation target region in DNA in a cell; and a fluorescence substance which labels the polynucleotide.
- the fluorescence substance may directly or indirectly bind to the polynucleotide.
- "indirectly bind” has the same meaning as that described above.
- the complex of the polynucleotide, the mediator, and the fluorescence substance will be collectively referred to as an "evaluation probe".
- a hapten, an anti-hapten primary antibody, and a secondary antibody are the same as described above.
- the mediator When the detection probe includes a mediator, the mediator needs to be a substance that specifically binds to the polynucleotide of the detection probe, and that substantially does not bind to the polynucleotide of the evaluation probe. Similarly, when the evaluation probe includes a mediator, this mediator needs to be a substance that specifically binds to the polynucleotide of the evaluation probe, and that substantially does not bind to the polynucleotide of the detection probe.
- the haptens that bind to the polynucleotides need to be substances that are different from each other, between the detection probe and the evaluation probe.
- DNP is used as the hapten that binds to the polynucleotide of the detection probe
- DIG needs to be used as the hapten that binds to the polynucleotide of the evaluation probe.
- the labeled secondary antibody included in the detection probe needs to be a substance that specifically binds to the primary antibody for the detection probe, and that substantially does not bind to the primary antibody for the evaluation probe.
- the labeled secondary antibody included in the evaluation probe needs to be a substance that specifically binds to the primary antibody for the evaluation probe and that substantially does not bind to the primary antibody for the detection probe.
- the primary antibody for the detection probe and the primary antibody for the evaluation probe are created from different animal species, respectively, and antibodies for the respective antibodies of the specific animal species can be used as the secondary antibodies.
- a mouse antibody can be used as the primary antibody and an anti-mouse antibody can be used as the secondary antibody; and for the evaluation probe, a rabbit antibody can be used as the primary antibody and an anti-rabbit antibody can be used as the secondary antibody.
- a rabbit antibody can be used as the primary antibody and an anti-rabbit antibody can be used as the secondary antibody.
- fluorescence substances that respectively emit fluorescences having different wavelengths are used.
- fluorescence substance include fluorescein, derivatives thereof (for example, fluorescein isothiocyanate (FITC)), phycoerythrin (PE), Texas red (registered trademark) (TR), Cy Dye, rhodamine, and Alexa Fluor (registered trademark).
- Antibody includes Fab, Fv, scFv, and Fd fragments, chimeric antibodies, humanized antibodies, single-chain antibodies, and fusion proteins including antigen-binding portions of antibodies and non-antibody proteins, but not limited thereto, and includes any isotypic antibodies or immunoglobulins, and antibody fragments that retain specific binding ability to antigens.
- Antibody may further bind to another portion such as a member of a specific binding pair of biotin or the like (member of biotin-avidin specific binding pair). Further, “antibody” also include Fab', Fv, F(ab')2, and other antibody fragments that retain specific binding ability to antigens.
- Polynucleotide and “nucleic acid” are interchangeably used in the entire description herein, and include DNA molecules (for example, cDNA or genome DNA), RNA molecules, (for example, mRNA), DNA or RNA analogs generated using nucleotide analogs (for example, peptide nucleic acid and non-natural nucleotide analog), and hybrids thereof.
- Nucleic acid molecule may be single-stranded or double-stranded.
- Hybridization or “hybridize” means to form a hydrogen bond (this can be Watson-Crick hydrogen bond, Hoogsteen hydrogen bond, or reverse Hoogsteen hydrogen bond) between complementary nucleoside bases or complementary nucleotide bases.
- adenine and thymine are complementary nucleic acid bases that are paired through formation of a hydrogen bond.
- complementary means ability to form correct pairing between two nucleotides.
- this polynucleotide and this DNA are considered to be complementary to each other at that position.
- This polynucleotide and this DNA are complementary to each other, when a sufficient number of corresponding positions in the respective molecules are occupied by nucleotides that can form hydrogen bonds with each other. Therefore, the terms "specifically hybridize” and “complementary” are used to indicate a sufficient degree of complementarity or correct pairing that allows stable and specific binding to occur between this polynucleotide and this DNA target.
- a polynucleotide can be hybridized to a base sequence of a detection target region or an evaluation target region under a stringent condition, they are "complementary".
- Stringent condition means a condition that a polynucleotide is selectively hybridized to a specific nucleic acid sequence and is hardly or not at all hybridized to another sequence.
- a person skilled in the art could select such a “stringent condition” as appropriate.
- a “stringent condition” can be set with reference to conditions and the like regarding short chain nucleotide hybridization described in Molecular Cloning, A Laboratory Manual, second edition [J. Sambrook et al., Cold Spring Harbor Laboratory Press, issued in 1989 ], for example.
- stringent condition examples include, but not limited thereto, a condition that: in an environment of 44°C, hybridization is performed in a pH7.4 solution containing 30 to 70 mass% formamide; and then, washing is performed under a condition of 60°C or higher by use of 2 ⁇ SSC (composition of 1 ⁇ SSC: 0.15 M sodium chloride, 0.015 M sodium citrate, pH7.0).
- Detection target region is, among DNA sequence regions present in the nucleus of a cell, a DNA sequence region which serves as the target for detection of the presence or absence of any of the abnormalities of gene amplification, deletion, translocation, and inversion.
- Evaluation target region is, among DNA sequence regions present in the nucleus of a cell, a DNA sequence region that increases in association with DNA replication in S phase of the cell cycle, and in which neither amplification nor sequence change due to genomic abnormality occurs.
- the evaluation target region is, among DNA sequence regions present in the nucleus of a cell, a part of a DNA sequence region excluding any DNA sequence region where amplification occurs.
- the evaluation target region is set as the evaluation target region, and for example, the centromere region of chromosome 17 may be set as the evaluation target region.
- the evaluation target region is, among DNA sequence regions present in the nucleus of a cell, a part of a DNA sequence region excluding any DNA sequence region where deletion occurs.
- the evaluation target region may be any region on the genome. A DNA sequence region that is moved to another chromosome due to translocation may be set as the evaluation target region, or a DNA sequence region that includes the cut point caused by translocation may be set as the evaluation target region.
- BCR gene or ABL gene may be set as the evaluation target region.
- the evaluation target region may be any region on the genome.
- a DNA sequence region that is moved due to inversion may be set as the evaluation target region, or a DNA sequence region that includes the cut point caused by inversion may be set as the evaluation target region.
- Nucleic acid staining dye is a substance that stains the entirety of the nucleic acid in a cell.
- the nucleic acid staining dye emits fluorescence having a wavelength that is different from the wavelengths of the respective fluorescence substances of the detection probe and the evaluation probe which are hybridized to specific regions of DNA to label the specific regions with the fluorescences, respectively.
- the nucleic acid staining dye includes intercalaters for specifically staining the nucleic acid and fluorescent dyes that bind to the minor groove. Examples of the intercalater include known cyanin-based, acridine-based, and phenanthridium-based dyes.
- Examples of the cyanin-based intercalater include SYBR (registered trademark) Green I, and Thiazole orange.
- Examples of the acridine-based intercalater include Acridin orange.
- Examples of the phenanthridium-based intercalater include propidium Iodide and Ethidium bromide.
- Examples of the dye that binds to the minor groove include known dyes such as DAPI, HOECHST, and the like.
- Examples of HOECHST include HOECHST 33342, HOECHST 33258, and the like.
- Cell may be a natural cell or an artificially modified cell (for example, fused cell, iPS cell).
- the cell may be a somatic cell or a germ cell. Examples of such a cell include, but not limited thereto, embryonic stem cell, somatic stem cell, differentiated cell (for example, epidermal cell, pancreatic parenchymal cell, pancreatic duct cell, hepatocyte, blood cell, cardiomyocyte, skeletal muscle cell, osteoblast, skeletal myoblast, neuron, vascular endothelial cell, pigment cell, smooth muscle cell, adipocyte, osteocyte, chondrocyte, etc.).
- the cell of animal species preferably, vertebrate derived cells are used, and more preferably, mammal derived cells are used. Still more preferably, primate (for example, chimpanzee, Japanese macaque, human) derived cells are used. Most preferably, human derived cells are used.
- the detection is preferably performed in a state where cell clusters are disaggregated into individual cells.
- the cells are fixed by a polar organic solvent such as methanol or ethanol.
- Sample means a specimen that includes cells, and in which the detection probe and the evaluation probe having been hybridized to DNA in the cells and the entirety of the nucleic acid in each cell has been stained.
- the nucleic acid is stained by the nucleic acid staining dye, and the evaluation probe is caused to be hybridized to the genome, whereby a sample is prepared.
- the cells are fixed in order to suppress nucleic acid degradation and the like.
- a known fixative such as ethanol, methanol, or formaldehyde can be used.
- the evaluation probe Before causing the evaluation probe to be hybridized to genome DNA, it is preferable to denature the genome DNA by a known technique such as heating or chemical treatment using a surfactant, to make the genome DNA single stranded. This also applies to the case where both of the evaluation probe and the detection probe (hereinafter, these may be simply collectively referred to as "probe”) are used.
- a known technique such as heating or chemical treatment using a surfactant
- the detection probe and the evaluation probe that have been nonspecifically hybridized to DNA may be removed by washing.
- the probe can be washed by use of a solution having a low salt concentration.
- a blocking process may be performed to reduce the background before the antibody is caused to react.
- a blocking agent BSA, skim milk, or the like can be used.
- a B/F separation process may be performed in which the labeled antibody bound to the target substance is separated from the labeled antibody that is not bound to the target substance and thus free, whereby the free labeled antibody may be removed.
- the B/F separation process can be performed through centrifuging, for example.
- the blocking process and/or the B/F separation process described above can be performed for the reaction between the primary antibody and the polynucleotide of the probe. Further, also when the labeled secondary antibody is caused to react, the blocking process and/or the B/F separation process described above can be performed.
- the nucleic acid staining and the hybridization of the evaluation probe may be performed at the same time or may be performed separately.
- the staining and the hybridization can be performed at the same time by mixing together the cells and a staining reagent that includes the nucleic acid staining dye and the evaluation probe.
- the nucleic acid staining may be performed at the same time as the hybridization between the polynucleotide and the genome DNA, or may be performed at the same time as the antibody reaction.
- the order of performing these is not limited in particular.
- excitation light is applied to the prepared sample, and information of generated fluorescence is obtained.
- Information of fluorescence generated by applying the excitation light to the nucleic acid staining dye which stains the nucleic acid in each cell, and information of fluorescence generated by applying the excitation light to the fluorescent dye of the evaluation probe are obtained.
- an analysis target cell is selected.
- cells can be selected in each of which the proportion between the fluorescence intensity from the nucleic acid staining dye and the fluorescence intensity from the fluorescent dye of the evaluation probe is in a certain range.
- cells in each of which the proportion between the fluorescence intensity from the nucleic acid staining dye and the fluorescence intensity from the fluorescent dye of the evaluation probe is in a predetermined numerical value range can be selected as the analysis target cells.
- the analysis target cells can be selected in the following manner: in a histogram data having an axis that represents the above-described proportion obtained from each cell in the sample, the proportion of the median thereof is identified; and then, cells in a range having a predetermined width relative to the identified median proportion are selected as the analysis target cells.
- only measurement data of the analysis target cells may be extracted from measurement data obtained by measuring the respective cells in the sample, or alternatively, only the analysis target cells may be separated from other cells by physical means and collected, from among all the cells in the sample.
- the physical means for example, a configuration may be employed in which bubbles are generated by heat and are caused to collide with cells flowing in a flow path, thereby separating the cells from other cells.
- a configuration may be employed in which one of bifurcated flow paths is opened/closed to change the direction of the liquid flowing in the flow path, whereby only the desired cells are caused to flow in one flow path to be collected.
- Genomic abnormality can be detected on the basis of the fluorescence intensity obtained from the fluorescence substance of the detection probe which has been bound to DNA of each selected cell.
- genomic abnormality may be detected by calculating the rate between the fluorescence intensity from the fluorescence substance of the detection probe and the fluorescence intensity from the fluorescence substance of the evaluation probe.
- a cell in which the value obtained by dividing the fluorescence intensity from the fluorescence substance of the detection probe by the fluorescence intensity from the fluorescence substance of the evaluation probe exceeds a threshold may be detected as a cell in which genomic abnormality has occurred.
- the difference between the fluorescence intensity from the fluorescence substance of the detection probe and the fluorescence intensity from the fluorescence substance of the evaluation probe is calculated, and then, a cell in which the difference exceeds a threshold may be detected as a cell in which genomic abnormality has occurred.
- Embodiment 1 is obtained by applying the present disclosure to a FISH-based method for detecting, as an abnormal cell, a cell in which only a specific DNA sequence region has been amplified.
- Embodiment 1 cells that have become cancerous due to amplification of Her2 gene are detected abnormal cells.
- a cell detection method for detecting an abnormal cell includes a sample preparation step, a light receiving step, a selection step, and a detection step.
- a case will be described in which an operator performs the cell detection method shown in FIG. 1 , by using a flow cytometer and a processing apparatus capable of analyzing the intensity of fluorescence obtained by the flow cytometer.
- the operator performs hybridization of the detection probe to the detection target region of DNA in the nucleus, hybridization of the evaluation probe to the evaluation target region of DNA in the nucleus, and staining of the nucleic acid in the cell, thereby preparing a sample.
- the sample includes cells collected from a subject.
- the detection target region is Her2 gene
- the evaluation target region is the sequence of a part of a DNA sequence region excluding Her2 gene in chromosome 17.
- the sequence of a part of a DNA sequence region excluding Her2 gene in chromosome 17 will be referred to as "Ch17".
- the evaluation target region is, among DNA sequence regions present in the nucleus of a cell, a DNA sequence region that increases in association with replication of DNA in S phase of the cell cycle and in which neither amplification nor sequence change due to genomic abnormality occurs.
- the evaluation target region may be any region, among DNA sequence regions in the nucleus, excluding any DNA sequence region where amplification occurs. From this viewpoint, an example of the evaluation target region is the centromere region of chromosome 17, for example.
- the detection probe includes: a polynucleotide (Her2 DNA probe) which specifically binds to Her2 gene being the detection target region; a primary antibody (Rabbit anti-DNP Antibody); a secondary antibody (Goat anti-Rabbit Antibody); and a fluorescent dye (Alexa Fluor (registered trademark) 647).
- the polynucleotide is labeled with dinitrophenol (DNP).
- DNP dinitrophenol
- the evaluation probe includes: a polynucleotide (Ch17 DNA Probe) which specifically binds to Ch17 being the evaluation target region; a primary antibody (Mouse anti-DIG Antibody); a secondary antibody (Goat anti-Mouse Antibody); and a fluorescent dye (Alexa Fluor (registered trademark) 488).
- the polynucleotide is labeled with digoxigenin (DIG).
- DIG digoxigenin
- the nucleus is stained by a nucleic acid staining dye for specifically staining the nucleic acid, specifically, a fluorescent dye (HOECHST 33342) which binds to the minor groove of AT sequence of DNA.
- a nucleic acid staining dye for specifically staining the nucleic acid
- a fluorescent dye HOECHST 33342
- fluorescent dye included in the detection probe As the fluorescent dye included in the detection probe, the fluorescent dye included in the evaluation probe, and the fluorescent dye for staining the entirety of the nucleic acid in the nucleus, different kinds of fluorescent dyes are used that respectively generate fluorescences having different wavelengths when lights having predetermined wavelengths are respectively applied thereto.
- the operator uses a flow cytometer to cause the sample prepared in step S11 to flow in the flow cell, to cause light to be applied to the sample flowing in the flow cell, and to cause a light receiving unit to receive the fluorescence from the fluorescent dye included in the detection probe, the fluorescence from the fluorescent dye included in the evaluation probe, and the fluorescence from the nucleic acid staining dye.
- a fluorescence microscope instead of the flow cytometer, a fluorescence microscope may be used.
- Axio Imager manufactured by Zeiss can be used, for example.
- the operator disposes the sample on a base (for example, slide glass), and operates the microscope to apply light to the sample on the base.
- a base for example, slide glass
- any support body made of metal or of any other appropriate solid may be used.
- a base plate made of a silicon wafer may be used.
- step S12 as a result of the light receiving unit receiving fluorescences, with respect to each cell, the intensity of the fluorescence from the fluorescent dye included in the detection probe, the intensity of the fluorescence from the fluorescent dye included in the evaluation probe, and the intensity of the fluorescence from the nucleic acid staining dye are obtained.
- "Intensity of fluorescence” here means the peak value in the fluorescence signal waveform (the horizontal axis represents time, and the vertical axis represents intensity) outputted from the light receiving unit.
- the intensity of fluorescence not limited to the peak value of the fluorescence signal waveform, the area of the fluorescence signal waveform may be used.
- the fluorescent dye included in the detection probe bound to the detection target region, the fluorescent dye included in the evaluation probe bound to the evaluation target region, and the fluorescent dye staining the nucleic acid in the nucleus generate fluorescences respectively having different wavelengths as a result of application of light.
- the fluorescent dye included in the detection probe bound to the detection target region, the fluorescent dye included in the evaluation probe bound to the evaluation target region, and the fluorescent dye staining the nucleic acid in the nucleus generate fluorescences respectively having different wavelengths as a result of application of light.
- three kinds of fluorescences having different wavelengths are received by different light receiving units, respectively, it is possible to distinguish the detection target region, the evaluation target region, and the entirety of the nucleus from one another.
- an image capturing step and a brightness obtaining step may be performed.
- the operator uses a flow cytometer that can capture particle images, to cause the sample prepared in step S11 to flow in the flow cell, to cause light to be applied to the sample flowing in the flow cell, and to cause an image capturing unit to capture images of the fluorescence from the fluorescent dye included in the detection probe, the fluorescence from the fluorescent dye included in the evaluation probe, and the fluorescence from the nucleic acid staining dye.
- an image of the fluorescence from the fluorescent dye included in the detection probe, an image of the fluorescence from the fluorescent dye included in the evaluation probe, and an image of the fluorescence from the nucleic acid staining dye are obtained.
- the operator uses a processing apparatus to calculate the brightness in each image.
- a brightness value indicating the brightness/darkness is obtained for each pixel.
- a value based on gradation is used as the brightness value, for example.
- the captured image is converted into a monochrome image and then a brightness value is obtained, for example. The brightness value is obtained for each of all the pixels on the image.
- a histogram is created in which the horizontal axis represents brightness value and the vertical axis represents the number of pixels.
- a curve represented by a broken line is generated in accordance with the number of pixels, and the area of the range surrounded by this curve is calculated as the brightness of the image.
- the brightness of the image may be the total of the brightness values of all the pixels.
- the operator performs calculation as described above by using a processing apparatus, and calculates the brightness in each image.
- the brightness of the image thus calculated corresponds to the intensity of fluorescence generated by the light receiving unit receiving fluorescences. Therefore, the intensity of fluorescence to be used in the following process may be replaced with the brightness in the image of fluorescence.
- the processing apparatus selects analysis target cells. More specifically, in step S13, the processing apparatus determines, as an analysis target cell, a cell in which the intensity of the fluorescence from the fluorescent dye included in the evaluation probe and the intensity of the fluorescence from the nucleic acid staining dye are in a relationship in which the hybridization state of the evaluation probe to the evaluation target region is evaluated as being appropriate.
- the processing apparatus extracts data of intensity of the fluorescence from the fluorescent dye included in the evaluation probe and data of intensity of the fluorescence from the fluorescent dye included in the detection probe, which have been obtained from the analysis target cell.
- a scattergram 100 is created in which the vertical axis represents the intensity of the fluorescence from the fluorescent dye included in the evaluation probe, and the horizontal axis represents the intensity of the fluorescence from the nucleic acid staining dye.
- a dot is plotted so as to correspond to each cell included in the sample.
- a region 101 is set in which the proportion between the intensity of the fluorescence from the fluorescent dye included in the evaluation probe and the intensity of the fluorescence from the nucleic acid staining dye is evaluated as being in a predetermined range.
- the region 101 is set as follows, for example. For each cell, calculated is the proportion between the intensity of the fluorescence from the fluorescent dye included in the evaluation probe and the intensity of the fluorescence from the nucleic acid staining dye. As shown in FIG. 4B , on the basis of the proportion calculated for each of all the cells, a histogram is created in which the horizontal axis represents the proportion and the vertical axis represents the number of particles. In the created histogram, the median proportion is identified. Then, the region that surrounds the particles in the range having a predetermined width relative to the identified median proportion is set as the region 101.
- the shape of the region 101 set in the scattergram 100 is not limited to the shape shown in FIG. 4A , and may be a shape shown in FIG. 5A or 5B .
- the region 101 shown in FIG. 5A is a region that has a predetermined width across a straight line 101a assumed as the center line.
- the slope of the straight line 101a is the median proportion calculated as above, and the straight line 101a passes through the origin. That is, the straight line 101a is a straight line whose vertical axis values and horizontal axis values can be regarded as being proportional to each other.
- the region 101 shown in FIG. 5B is a region surrounded by a curve and having a predetermined width across the straight line 101a assumed as the center line.
- the width of the region 101 across the straight line 101a assumed as the center line in FIG. 5A, 5B is set so as to allow accurate selection of cells in which appropriate hybridization has occurred.
- the width of the region 101 is set so as to include cells in 3 to 5% range of variation across the straight line 101a assumed as the center line.
- the staining of the entirety of the nucleus is not realized by binding of a fluorescence labeled probe through hybridization, but is performed by the nucleic acid staining dye.
- the staining is performed to the entirety of the nucleic acid in the nucleus by the nucleic acid staining dye, but the amount of a gene, such as Her2 gene, that is locally amplified is small relative to the entirety of the nucleic acid. Therefore, the intensity of fluorescence obtained from the entirety of the nucleic acid staining dye changes, substantially in accordance with increase of the amount of nucleic acid in the nucleus associated with DNA replication in S phase of the cell cycle.
- the evaluation target region is, among DNA sequence regions present in the nucleus of a cell, a DNA sequence region in which neither amplification nor sequence change due to genomic abnormality occurs. Since the evaluation target region increases in association with DNA replication in S phase of the cell cycle, if appropriate hybridization of the evaluation probe to the evaluation target region has occurred in the sample preparation step of step S11, the intensity of the fluorescence from the fluorescent dye included in the evaluation probe changes, in accordance with the intensity of the fluorescence from the entirety of the nucleic acid staining dye.
- cells in which appropriate hybridization has occurred are included in the region 101 for which it can be considered that the proportion between the intensity of the fluorescence from the fluorescent dye included in the evaluation probe and the intensity of the fluorescence from the nucleic acid staining dye is in a predetermined range.
- the region 102 above the region 101 and the region 103 below the region 101 include cells for which it can be considered that appropriate hybridization of the evaluation probe to the evaluation target region has not occurred therein.
- the region 102 is a region in which the fluorescence from the fluorescent dye included in the evaluation probe has high intensity, and thus, the region 102 includes cells for which it is considered that nonspecific binding of the evaluation probe has occurred therein. Nonspecific binding of the evaluation probe occurs when the evaluation probe binds to a DNA sequence region other than the evaluation target region, for example.
- the region 103 is a region in which the fluorescence from the fluorescent dye included in the evaluation probe has low intensity, and thus, the region 103 includes cells for which it is considered that decrease of staining efficiency of the evaluation probe has occurred therein. Decrease of the staining efficiency of the evaluation probe is caused by poor hybridization of the evaluation probe, for example.
- the region 101 is set. Then, the cells in the region 101 are selected as the analysis target cells.
- the region 101 may be a region that is set in advance on the basis of a previous sample and that is stored in the processing apparatus. In a case where the region 101 is set in advance, a plot is made on the scattergram at the time when the intensity of fluorescence of one cell is obtained, and if this cell is included in the region 101, this cell may be selected as the analysis target cell.
- the scattergram 100 is created in the processing apparatus.
- the processing apparatus performs processing, using a virtual coordinate space having an axis of the intensity of the fluorescence from the nucleic acid staining dye and an axis of the intensity of the fluorescence from the fluorescent dye included in the evaluation probe, thereby selecting the analysis target cells.
- processing is performed in the virtual coordinate space having two axes of fluorescence intensities, whereby cell selection is performed. It should be noted that the processing apparatus may select cells by creating a scattergram as described above.
- step S13 only the cells in which appropriate hybridization of the evaluation probe to the evaluation target region has occurred are selected.
- appropriate hybridization of the evaluation probe to the evaluation target region it is considered that hybridization of the detection probe to the detection target region has also appropriately occurred.
- cells in which appropriate hybridizations of the evaluation probe and the detection probe have occurred are selected.
- “Bright field” shows a bright field image of a cell.
- “Ch17” shows a captured image of the fluorescence from the fluorescent dye included in the evaluation probe, i.e., the fluorescence corresponding to Ch17.
- "Nucleus” shows a captured image of the fluorescence from the nucleic acid staining dye.
- "Her2” shows a captured image of the fluorescence from the fluorescent dye included in the detection probe, i.e., the fluorescence corresponding to Her2 gene.
- Four images arranged in the horizontal direction are images obtained from a single cell. Five cells shown in FIG. 6 are normal cells in which Her2 gene is not amplified and in which double-strand DNA is present. Therefore, it can be assumed that in any of these cells, if appropriate hybridization has occurred, two bright points corresponding to Ch17 and two bright points corresponding to Her2 gene can be identified.
- the presence of two Ch17 bright points and two Her2 gene bright points is clearly observed.
- the Ch17 bright point and the Her2 gene bright point are difficult to be identified because fluorescence is generated from the entirety of the cell.
- the Ch17 bright point and the Her2 gene bright point are difficult to be identified because the intensity of fluorescence is not sufficient.
- the cells in the regions 102 and 103 cannot be appropriately evaluated.
- abnormal cells cannot be accurately detected. That is, in the case of the cells in the regions 102 and 103, there is a risk that false-positive and/or false-negative are determined.
- the cells included the region 101 of the scattergram 100 i.e., only the cells for which it is considered that appropriate hybridization has occurred therein, can be selected as the analysis target cells. Therefore, poorly stained cells are less likely to be mixed in the selected analysis target cells, and thus, abnormal cells can be accurately detected in the detection step.
- the operator uses the processing apparatus to detect abnormal cells from the analysis target cells, on the basis of the fluorescence from the fluorescent dye included in the detection probe. More specifically, in step S14, on the basis of the ratio between the intensity of the fluorescence from the fluorescent dye included in the detection probe, and the intensity of the fluorescence from the fluorescent dye included in the evaluation probe, the processing apparatus detects abnormal cells from the analysis target cells. Specifically, for each cell, the intensity of the fluorescence from the fluorescent dye included in the detection probe is divided by the intensity of the fluorescence from the fluorescent dye included in the evaluation probe.
- the amplification of the detection target region may be determined only on the basis of the intensity of the fluorescence from the fluorescent dye included in the detection probe exceeding a predetermined threshold.
- abnormal cells may be detected on the basis of the distribution of the fluorescence from the fluorescent dye included in the detection probe and the distribution of the fluorescence from the fluorescent dye included in the evaluation probe in the image. For example, the number of bright points corresponding to the detection probe is divided by the number of bright points corresponding to the evaluation probe. Then, if the result of the division exceeds a predetermined threshold, the cell may be detected as an abnormal cell.
- the cell may be detected as an abnormal cell if the difference between the number of bright points corresponding to the detection probe and the number of bright points corresponding to the evaluation probe exceeds a predetermined threshold. Still alternatively, the total area, in the image, of the fluorescence from the fluorescent dye included in the detection probe is divided by the total area, in the image, of the fluorescence from the fluorescent dye included in the evaluation probe. Then, if the result of the division exceeds a predetermined threshold, the cell may be detected as an abnormal cell.
- the cells for which it is considered that appropriate hybridization has occurred are selected as the analysis target cells.
- the detection step of step S14 with respect to each selected cell, whether or not the cell is an abnormal cell is determined. Thus, if the detection step is performed after the selection step, only with respect to each of the cells in which appropriate hybridization has occurred, whether or not the cell is an abnormal cell is determined. Thus, the accuracy of detecting abnormal cells in the detection step can be enhanced.
- Embodiment 1 cells that have become cancerous due to amplification of Her2 gene can be accurately detected as abnormal cells. Therefore, in a case of breast cancer in which Her2 gene is amplified in accordance with progress of disease condition or the like, a medical doctor or the like can accurately determine the disease condition on the basis of the detected abnormal cells. Since Her2 gene is one of the prognostic factors of breast cancer, a medical doctor or the like can appropriately determine a therapeutic strategy for the patient on the basis of the detected abnormal cells.
- Her2 gene is set as the detection target region serving as an index for therapeutic strategy determination.
- another disease may be set as the treatment target, and in accordance with the target disease, another gene may be set as the detection target region serving as an index for determining a therapeutic strategy.
- MCF7 which is Her2 gene amplification negative was used.
- SK-BR-3 which is Her2 gene amplification positive was used.
- each tube was centrifuged at 1500 rpm for 1 minute, and the supernatant was removed. 300 ⁇ L of PBS was put in each tube, to resuspend the content. While lightly agitating, 700 ⁇ L of Carnoy's solution was added to each tube, to obtain Carnoy's solution having a final concentration of 70%. In a 4°C environment, sedimentation of the content was prevented with each tube being agitated, until 20 minutes elapsed.
- Her2 DNA cocktail probe includes: Her2 DNA probe labeled with dinitrophenol (DNP); and Ch17 DNA probe labeled with digoxigenin (DIG).
- DNP dinitrophenol
- DIG digoxigenin
- the Ch17 DNA probe labeled with DIG manufactured by Ventana is configured to be hybridized to the sequence of a part of a DNA sequence region excluding Her2 gene in chromosome 17.
- each tube of (1) was centrifuged at 1500 rpm for 1 minute, and the supernatant was removed. 1 mL of Reaction Buffer (manufactured by Ventana, #950-300) was put in each tube, and washing was performed. This washing was performed twice. 120 ⁇ L of the reagent for hybridization was added to each tube, to suspend the content well. The content of each tube was dispensed into two 0.2 mL tubes. That is, two tubes each containing MCF7 cells were prepared, and two tubes each containing SK-BR-3 cells were prepared. In a 95°C environment, each tube was heated for 5 minutes by a thermal cycler, to dissociate DNA into single strands. In a 44°C environment, hybridization was conducted overnight (about 16 hours).
- Reaction Buffer manufactured by Ventana, #950-300
- 2xSSC (manufactured by Ventana, #650-012) was heated to 65°C by a heat block in advance. 100 ⁇ L of 2xSSC was added to each tube of (2). In a 24°C room temperature environment, each tube was centrifuged at 1500 rpm for 1 minute. After the centrifugation, the supernatant in each tube was removed. The procedure of: adding 100 ⁇ L of 2xSSC to each tube; heating each tube by a thermal cycler for 3 minutes in a 65°C environment; centrifuging each tube at 1500 rpm for 1 minute in a 24°C room temperature environment; and removing the supernatant, was performed three times in total. 100 ⁇ L of Reaction Buffer was put in each tube, to resuspend the content.
- a blocking reagent 3 mL of a 1% BSA/Reaction buffer was prepared. In a 24°C room temperature environment, each tube of (3) was centrifuged at 1500 rpm for 1 minute, and the supernatant was removed. 100 ⁇ L of the blocking reagent was added to each tube, to suspend the content. Blocking was performed for 20 minutes in a 37°C environment.
- each tube of (5) was centrifuged at 1500 rpm for 1 minute, and the supernatant was removed. 100 ⁇ L of the secondary antibody/nucleus staining reaction reagent was added to each tube, to suspend the content. In a 37°C environment, secondary antibody/nucleus staining reaction was performed for 20 minutes in a light-blocked state.
- each tube of (6) was centrifuged at 1500 rpm for 1 minute, and the supernatant was removed.
- the sample in each of the four tubes having been subjected to the procedure of (1) to (7) was measured by an imaging flow cytometer (ImageStream X Mark II Imaging Flow Cytometer) manufactured by Amnis. Laser lights respectively having wavelengths of 405 nm, 488 nm, 642 nm, and 785 nm were applied to the sample flowing in the flow cell of the flow cytometer. Then, light corresponding to the fluorescence from the fluorescent dye included in the detection probe, light corresponding to the fluorescence from the fluorescent dye included in the evaluation probe, light corresponding to the fluorescence from the nucleic acid staining dye, and light corresponding to the bright field were received, and the intensity and the image of each fluorescence were obtained.
- an imaging flow cytometer ImageStream X Mark II Imaging Flow Cytometer
- the sample not having been subjected to the primary antibody reaction was caused to flow in the flow cell. Then, for each particle contained in the sample, obtained were: a bright field image; the intensity of the light corresponding to the fluorescence from the fluorescent dye included in the evaluation probe; the intensity of the light corresponding to the fluorescence from the fluorescent dye included in the detection probe; and the intensity of the light corresponding to the fluorescence from the nucleic acid staining dye.
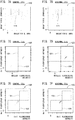
- a scattergram 110 whose vertical axis represented the sphericity of the particle in the bright field image, and whose horizontal axis represented the area of the particle in the bright field image.
- a region 111 of the scattergram 110 was set as the region where cells that could be the analysis target were distributed.
- a scattergram 120 was created whose vertical axis represented the intensity of the light corresponding to the fluorescence from the fluorescent dye included in the evaluation probe, and whose horizontal axis represented the intensity of the light corresponding to the fluorescence from the nucleic acid staining dye. Only very weak fluorescence is generated from most of minute particles. Thus, the group of cells having fluorescence of a predetermined intensity or higher was set as the analysis target. Therefore, a region 121 of the scattergram 120 was set as the region where cells that could be the analysis target were distributed, and a region 122 of the scattergram 120 was set as the region where minute particles that could not be the analysis target were distributed.
- a scattergram 130 was created whose vertical axis represented the intensity of the light corresponding to the fluorescence from the fluorescent dye included in the detection probe, and whose horizontal axis represented the intensity of the j light corresponding to the fluorescence from the fluorescent dye included in the evaluation probe. From the cells in the sample not having been subjected to the primary antibody reaction, although intrinsic fluorescence is slightly generated, fluorescence having an intensity higher than the predetermined intensity is not generated. Thus, in the scattergram 130, a region 132 which included substantially all the cells in this sample was set as the region where the cells not having been subjected to the primary antibody reaction were distributed. Then, in the scattergram 130, a region 131 in which the values in the vertical axis and in the horizontal axis are both greater than those in the region 132 was set as the region where the cells that could be the analysis target were distributed.
- cells to be used as the analysis target were selected. These two tubes were caused to respectively hold a sample that contained control cells, and a sample that contained abnormal cells. Each sample was caused to flow in the flow cell. Then, for each particle contained in the sample, obtained were: a bright field image; the intensity of the light corresponding to the fluorescence from the fluorescent dye included in the evaluation probe; the intensity of the light corresponding to the fluorescence from the fluorescent dye included in the detection probe; and the intensity of the light corresponding to the fluorescence from the nucleic acid staining dye.
- the scattergram 110 similar to that in FIG. 7A, 7B was created.
- the region 111 similar to that in FIG. 7A, 7B was set.
- the scattergram 120 similar to that in FIG. 7C, 7D was created as shown in FIG. 8C, 8D .
- the region 121similar to that in FIG. 7C, 7D was set.
- the scattergram 130 similar to that in FIG. 7E, 7F was created as shown in FIG. 8E, 8F .
- the region 131 similar to that in FIG. 7E, 7F was set.
- the scattergram 100 similar to that in FIG. 4A was created as shown in FIG. 9A, 9B .
- the region 101 was set for which it could be considered that the proportion between the intensity of the fluorescence from the fluorescent dye included in the evaluation probe and the intensity of the fluorescence from the nucleic acid staining dye was in a predetermined range.
- the particles included in the region 101 in FIG. 9A, 9B were selected as the analysis target cells.
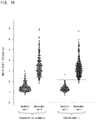
- a threshold for the value obtained by the division was set so as to realize the maximum sensitivity and the maximum specificity.
- Sensitivity is the value obtained by dividing the number of cells determined as abnormal because the cells are above the threshold, by the actual number of abnormal cells contained in the sample.
- Specificity is the value obtained by dividing the number of cells determined as normal because the cells are below the threshold, by the number of control cells contained in the sample.
- sensitivity and specificity were both 94.5%.
- sensitivity and specificity were both 99.1%, and were better than those of Comparative example.
- another value may be used as the threshold.
- the maximum value of the values obtained by the division of the respective control cells in Embodiment 1 may be used as the threshold.
- the minimum value of the values obtained by the division of the respective abnormal cells in Embodiment 1 may be used as the threshold.
- the present verification if the cells in which appropriate hybridization has occurred are selected by using the region 101 of the scattergram 100 as in Embodiment 1, sensitivity and specificity can be improved. Thus, according to Embodiment 1, abnormal cells and normal cells can be accurately detected, and thus, drug therapy effect can be accurately monitored.
- Embodiment 2 is obtained by applying the present disclosure to a FISH-based method for detecting, as an abnormal cell, a cell in which translocation has occurred.
- the method for detecting an abnormal cell in which translocation has occurred will be described using an example of translocation that occurs between chromosome 9 and chromosome 22, the translocation observed in chronic myeloid leukemia.
- the sequence of ABL gene is in chromosome 9
- the sequence of BCR gene is in chromosome 22.
- the sequence of BCR gene will be referred to as "BCR region portion”
- the sequence of ABL gene will be referred to as "ABL region portion”.
- the ABL region portion is moved to chromosome 22.
- a BCR-ABL fusion gene is formed as shown in FIG. 11B .
- the ABL region portion is labeled with fluorescence so as to generate red fluorescence
- the BCR region portion is labeled with fluorescence so as to generate green fluorescence as shown in FIG. 11A, 11B , for example.
- the image of a normal cell becomes as shown in FIG 11C
- the image of an abnormal cell becomes as shown in FIG. 11D .
- the cell image shown in FIG 11C, 11D is obtained by combining an image based on the red fluorescence generated from the cell and an image based on the green fluorescence generated from the cell.
- FIG. 11C since the red bright point and the green bright point are separated from each other, it is seen that the cell is a normal cell.
- the cell is an abnormal cell in which BCR-ABL fusion gene has been formed.
- the medical doctor or the like can diagnose the possibility of chronic myeloid leukemia.
- the BCR region portion and a nucleic acid sequence adjacent to the BCR region portion may be each labeled with fluorescence so as to generate green fluorescence, for example.
- the nucleic acid sequence adjacent to the BCR region portion will be referred to as "BCR adjacent region portion”.
- FIG. 12C in a case of a normal cell, DNA in the nucleus is double-stranded, and thus, two green bright points appear, according to the state shown in FIG. 12A .
- FIG. 12D in a case of an abnormal cell, due to separation of chromosome, so-called break-apart, the BCR adjacent region portion has been cut from chromosome 22 and moved to chromosome 9, whereby the number of the green bright points has increased.
- the ABL region portion in chromosome 9 is moved to the place in chromosome 22 where the BCR adjacent region portion has been. Accordingly, in the case of FIG. 12D , it is seen that the cell is an abnormal cell.
- the ABL region portion and a nucleic acid sequence adjacent to the ABL region portion may be labeled with fluorescence so as to generate green fluorescence. Also in this case, as in FIG. 12C, 12D , an abnormal cell caused by break-apart can be detected.
- step S11 to S14 shown in FIG. 1 are performed, whereby abnormal cells are detected.
- the evaluation target region is the BCR region portion or the ABL region portion. If the evaluation target region is the BCR region portion, the detection target region is set to the ABL region portion. If the evaluation target region is the ABL region portion, the detection target region is set to the BCR region portion. That is, it is sufficient that the combination of the detection target region and the evaluation target region is the BCR region portion and the ABL region portion.
- the evaluation probe is bound to the evaluation target region and the detection probe is bound the detection target region through hybridization. Therefore, as in Embodiment 1, through steps S11 to S13, cells in which appropriate hybridization has occurred can be selected on the basis of the intensity of the fluorescence from the fluorescent dye included in the evaluation probe and the intensity of the fluorescence from the nucleic acid staining dye.
- step S14 in order to determine the distributions of the ABL region portion and the BCR region portion, an image of the fluorescence from the fluorescent dye included in the detection probe and an image of the fluorescence from the fluorescent dye included in the evaluation probe are used. Therefore, in Embodiment 2, these images are obtained in the light receiving step of step S12.
- step S14 on the basis of the distribution of the fluorescence from the fluorescent dye included in the detection probe and the distribution of the fluorescence from the fluorescent dye included in the evaluation probe in the images obtained in step S12, the processing apparatus detects abnormal cells from the analysis target cells. Specifically, if the position of a bright point based on the detection probe and the position of a bright point based on the evaluation probe overlap each other, thus causing a bright point of a predetermined color in the combined image as shown in FIG. 11D , the processing apparatus determines that translocation has occurred. Then, the processing apparatus detects, as an abnormal cell, the cell in which translocation has occurred.
- the operator may determine, through visual observation, a cell in which the position of a bright point based on the detection probe and the position of a bright point based on the evaluation probe are close to each other or overlapped each other, as an abnormal cell in which translocation has occurred.
- the BCR region portion and a nucleic acid sequence adjacent to the BCR region portion are each labeled with fluorescence as shown in FIG. 12A .
- the evaluation target region is the BCR region portion or the BCR adjacent region portion. If the evaluation target region is the BCR region portion, the detection target region is set to the BCR adjacent region portion. If the evaluation target region is the BCR adjacent region portion, the detection target region is set to the BCR region portion. That is, it is sufficient that the combination of the detection target region and the evaluation target region is the BCR region portion and the BCR adjacent region portion. It should be noted that the combination of the detection target region and the evaluation target region may be the ABL region portion and a nucleic acid sequence adjacent to the ABL region portion.
- the evaluation probe is bound to the evaluation target region, and the detection probe is bound to the detection target region through hybridization.
- the evaluation probe and the detection probe of this case are configured to be hybridized to the BCR region portion and the BCR adjacent region portion, and thus have substantially the same configuration. Then, as in the case of dual fusion, through steps S11 to S13, cells in which appropriate hybridization has occurred are selected on the basis of the intensity of the fluorescence from the fluorescent dye included in the evaluation probe and the fluorescence from the nucleic acid staining dye.
- step S14 the processing apparatus detects abnormal cells from the analysis target cells on the basis of the distribution of the fluorescence from the fluorescent dye included in the detection probe and the distribution of the fluorescence from the fluorescent dye included in the evaluation probe in the obtained images.
- the detection target region or the evaluation target region has been moved to another chromosome, it is considered that translocation has occurred.
- FIG. 12D if the number of the bright point based on the detection probe and the evaluation probe has increased, it is determined that translocation has occurred. Then, the cell in which translocation has occurred is detected as an abnormal cell.
- the operator may detect, through visual observation, a cell in which translocation has occurred.
- Embodiment 2 with respect to each cell for which it is considered that appropriate hybridization has occurred, whether or not the cell is an abnormal cell is determined.
- the accuracy of detecting abnormal cells can be enhanced.
- the abnormal cell in which translocation has occurred between chromosome 9 and chromosome 22 is accurately detected, and thus, the medical doctor or the like can accurately determine the disease condition of myeloid leukemia.
- Embodiment 3 is obtained by applying the present disclosure to a FISH-based method for detecting, as an abnormal cell, a cell in which deletion has occurred.
- a predetermined DNA sequence region is in a predetermined chromosome.
- an abnormal cell i.e., a deletion positive cell
- the predetermined DNA sequence region is lost from the chromosome.
- the detection target region is set to be the sequence of at least a part of a DNA sequence region that is deleted
- the evaluation target region is set to be the sequence of a part of a DNA sequence region excluding the DNA sequence region that is deleted.
- the processing apparatus when the processing apparatus has determined that the intensity of the fluorescence from the fluorescent dye included in the detection probe is lower than or equal to a predetermined threshold, the processing apparatus can detect the abnormal cell in which deletion has occurred.
- the operator may detect, through visual observation, the abnormal cell in which deletion has occurred.
- Embodiment 4 is obtained by applying the present disclosure to a FISH-based method for detecting, as an abnormal cell, a cell in which inversion has occurred in a chromosome.
- the order of the DNA base sequence on a chromosome is partially inversed.
- a probe that binds to both of a specific gene and a DNA sequence region adjacent thereto is mixed in the sample. Then, if fluorescence from the fluorescent dye included in the probe is detected, it is possible to determine that the cell is a normal cell in which inversion has not occurred. If the fluorescence from the fluorescent dye included in the probe is not detected, it can be considered that the gene has been cut from the chromosome and inversed and thus binding of the probe has not occurred. Therefore, it is possible to determine that the cell is an abnormal cell in which inversion has occurred.
- the detection target region is set to a region that extends across the specific gene and the DNA sequence region adjacent thereto, and the evaluation target region is set to the specific gene where inversion occurs.
- the present disclosure can be applied to detections of abnormal cells by determining various genomic abnormalities (gene amplification, translocation, deletion, inversion, and the like).
- Embodiment 5 is obtained by applying the present disclosure to a cell detection apparatus which detects abnormal cells on the basis of the cell detection method according to Embodiment 1.
- a cell detection apparatus 10 includes a processing unit 11, a sample preparation unit 12, an optical detection unit 13, a signal processing unit 14, a display unit 15, and an input unit 16.
- the processing unit 11 is implemented by: a microcomputer and a CPU, etc.; and a storage unit 11a.
- the storage unit 11a is implemented by a RAM, a ROM, a hard disk, and the like. In the storage unit 11a, process programs to be executed by the processing unit 11 are stored.
- the processing unit 11 transmits/receives signals to/from the components of the cell detection apparatus 10 to control the components.
- the sample preparation unit 12 prepares a sample by mixing cells and reagents.
- the optical detection unit 13 includes a flow cell 200, light sources 211 to 214, light receiving units 221 to 223, an image capturing unit 224, condenser lenses 231 to 239, dichroic mirrors 241 to 244, a half mirror 251, a filter 252, and an optical unit 253.
- the light sources 211 to 214 are each implemented by a semiconductor laser light source. Lights emitted from the light sources 211 to 214 are laser lights having wavelengths ⁇ 11 to ⁇ 14, respectively. The wavelengths ⁇ 11 to ⁇ 14 are respectively 405 nm, 488 nm, 642 nm, and 785 nm, for example.
- the condenser lenses 231 to 234 condense lights emitted from the light sources 211 to 214, respectively.
- the dichroic mirror 241 reflects light having the wavelength ⁇ 12, and allows light having the wavelength ⁇ 13 to pass therethrough.
- the dichroic mirror 242 reflects light having the wavelength ⁇ 11, and allows lights having the wavelengths ⁇ 12 and ⁇ 13 to pass therethrough. Thus, lights having the wavelengths ⁇ 11 to ⁇ 14 emitted from the light sources 211 to 214 are applied to the sample flowing in a flow path 201 of the flow cell 200.
- the condenser lens 235 condenses the fluorescences having the wavelengths ⁇ 21 to ⁇ 23 generated from the sample flowing in the flow cell 200, and light having the wavelength ⁇ 14 and having passed through the sample flowing in the flow cell 200.
- the half mirror 251 allows substantially a half of the lights having passed through the condenser lens 235 to pass through the half mirror 251, and reflects substantially a half thereof to the filter 252.
- the filter 252 allows the fluorescences having the wavelengths ⁇ 21 to ⁇ 23 to pass therethrough, and blocks unnecessary light.
- the dichroic mirror 243 reflects the fluorescence having the wavelength ⁇ 21, and allows the fluorescences having the wavelengths ⁇ 22 and ⁇ 23 to pass therethrough.
- the dichroic mirror 244 reflects the fluorescence having the wavelength ⁇ 22 and allows the fluorescence having the wavelength ⁇ 23 to pass therethrough.
- the condenser lenses 236 to 238 condense fluorescences having wavelengths ⁇ 21 to ⁇ 23, respectively.
- the light receiving units 221 to 223 receive fluorescences having the wavelengths ⁇ 21 to ⁇ 23 and output signals corresponding to the intensities of the received fluorescences, respectively.
- the light receiving units 221 to 223 are each implemented by a photomultiplier. Since the light receiving units 221 to 223 are each implemented by the photomultiplier, the light receiving units 221 to 223 can generate signals corresponding to the intensities of the fluorescences with high sensitivity.
- the optical unit 253 is composed of four dichroic mirrors in combination.
- the four dichroic mirrors of the optical unit 253 reflect the fluorescences having the wavelengths ⁇ 21 to ⁇ 23 and the light having the wavelength ⁇ 14 at angles slightly different from one other, to be separated on the light receiving surface of the image capturing unit 224.
- the condenser lens 239 condenses the fluorescences having the wavelengths ⁇ 21 to ⁇ 23 and the light having the wavelength ⁇ 14.
- the image capturing unit 224 is implemented by a TDI (time delay integration) camera.
- the image capturing unit 224 receives the fluorescences having the wavelengths ⁇ 21 to ⁇ 23 and the light having the wavelength ⁇ 14. Then, the image capturing unit 224 outputs, as image capture signals, pieces of image information of each particle which correspond to the fluorescences having the wavelengths ⁇ 21 to ⁇ 23 and the light having the wavelength ⁇ 14, respectively.
- the signal processing unit 14 is implemented by a storage unit and a plurality of circuits for processing signals. On the basis of the signal outputted from each of the light receiving units 221 to 223, the signal processing unit 14 calculates the intensities of the fluorescences for each particle.
- the processing unit 11 stores the intensities of the fluorescences calculated for each particle, into the storage unit 11a. On the basis of the image capture signals outputted from the image capturing unit 224, the processing unit 11 generates images of each particle, and stores the generated images into the storage unit 11a, for each particle.
- the display unit 15 is implemented by a display and displays detection results and the like of abnormal cells.
- the input unit 16 is implemented by a mouse and a keyboard. The operator inputs instructions to the cell detection apparatus 10 via the input unit 16.
- the abnormal cell detection process is executed by the processing unit 11 controlling the components of the cell detection apparatus 10.
- step S101 the processing unit 11 drives the sample preparation unit 12, and causes the sample preparation unit 12 to prepare a sample by mixing: cells; a reagent including the detection probe to be hybridized to the detection target region in each cell; a reagent including the evaluation probe to be hybridized to the evaluation target region in each cell; and a reagent including the nucleic acid staining dye. Accordingly, as shown in FIGS. 2A and 2B , the detection probe including the fluorescent dye binds to the detection target region, and the evaluation probe including the fluorescent dye binds to the evaluation target region.
- step S102 the processing unit 11 causes the sample prepared in step S101 to flow in the flow cell 200.
- step S103 the processing unit 11 drives the light sources 211 to 214 to apply lights to the sample flowing in the flow cell 200.
- the processing unit 11 causes the light receiving units 221 to 223 to receive fluorescences having the wavelengths ⁇ 21 to ⁇ 23 generated from each particle in the sample, and obtains intensities of the fluorescences having wavelengths ⁇ 21 to ⁇ 23.
- step S105 as in step S13 of Embodiment 1, on the basis of the intensity of the fluorescence from the fluorescent dye included in the evaluation probe and the intensity of the fluorescence from the nucleic acid staining dye, the processing unit 11 selects analysis target cells. Specifically, on the basis of the intensities of the fluorescences having the wavelengths ⁇ 21 and ⁇ 22 calculated by the signal processing unit 14, the processing unit 11 selects the cells in the region 101 of the scattergram 100, as analysis target cells. Also in this case, the processing unit 11 does not actually use the scattergram 100, but performs processing, using a virtual coordinate space having two axes of intensities of fluorescences having wavelengths ⁇ 21 and ⁇ 22, thereby selecting analysis target cells. Also in this case, as shown in the verification of Embodiment 1, it is preferable to remove unnecessary particles.
- step S106 the processing unit 11 detects abnormal cells from the analysis target cells, on the basis of the fluorescence from the fluorescent dye included in the detection probe. Specifically, the processing unit 11 uses the intensities of the fluorescences having the wavelengths ⁇ 22 and ⁇ 23 calculated by the signal processing unit 14. For each analysis target cell, the processing unit 11 divides the intensity of the fluorescence having the wavelength ⁇ 23 by the intensity of the fluorescence having the wavelength ⁇ 22. Then, the processing unit 11 detects cells for each of which the result of the division exceeds a predetermined threshold, as abnormal cells in which the detection target region has been amplified. Alternatively, in step S106, the processing unit 11 may obtain bright points in each image generated from the image capture signal from the image capturing unit 224, and may detect abnormal cells on the basis of the bright points.
- a cell in which translocation, deletion, or inversion as described in Embodiments 2 to 4 has occurred may be detected as an abnormal cell.
- the processing unit 11 obtains the distribution of the fluorescence on the basis of the images generated from the image capture signals from the image capturing unit 224, and detects an abnormal cell in which translocation has occurred, on the basis of the fluorescence distribution.
- the processing unit 11 detects a cell in which the intensity of the fluorescence from the fluorescent dye included in the detection probe is lower than or equal to a predetermined threshold, as an abnormal cell in which deletion or inversion has occurred.
- the processing unit 11 may obtain bright points in the images generated from the image capture signals from the image capturing unit 224, and may detect a cell in which the number of the bright points is smaller than that of a normal cell, as an abnormal cell in which deletion or inversion has occurred.
- the processing unit 11 may cause the display unit 15 to display a visual observation result input screen 300 for receiving a result of images classified on the basis of visual observation.
- the visual observation result input screen 300 includes an image display region 310, buttons 321 to 324, a result display region 330, and a save button 340.
- the processing unit 11 Upon receiving an instruction to start visual observation input, the processing unit 11 causes the display unit 15 to display the visual observation result input screen 300 regarding the target sample.
- the image display region 310 is obtained on the basis of the target sample, and shows images of the cells selected in step S105.
- the images in the image display region 310 are configured to be selectable. If an image is selected, this image is surrounded by a double line, as with the image on the up left in the image display region 310.
- the buttons 321 to 324 each receives a visual observation result of the image selected in the image display region 310. If the operator determines, by viewing the selected image, that gene amplification, gene fusion due to translocation, division due to translocation, or deletion has occurred in the cell shown in the image, the operator presses a corresponding one of the buttons 321 to 324 via the input unit 16. Accordingly, the value of the corresponding item in the result display region 330 is increased.
- the result display region 330 shows, of all the cells included in the sample, the numbers of cells in which gene amplification, fusion, division, or deletion has occurred, respectively. That is, the result display region 330 shows the number of cells inputted by the operator via the buttons 321 to 324.
- the processing unit 11 stores, into the storage unit 11a, the result values shown in the result display region 330. In this manner, the operator can input the state of each cell by viewing the image, and can store the inputted result in the storage unit 11a.
- On the visual observation result input screen 300 only the cells that are stained well are selected and shown. Thus, the operator can efficiently determine the state of each cell by observing the image of the well-stained cell.
- Embodiment 6 is obtained by applying the present disclosure to a cell selection apparatus configured to select cells.
- a cell selection apparatus 20 according to Embodiment 6 additionally has a particle selection unit 21 and a reservoir 22, compared with the cell detection apparatus 10 according to Embodiment 5.
- the configuration of the flow cell 200 of the optical detection unit 13 is different from that of Embodiment 5.
- the other configurations of Embodiment 6 are the same as those of Embodiment 5.
- the flow cell 200 of Embodiment 6 has flow paths 202 and 203 formed therein, in addition to the flow path 201.
- the flow path 202 is formed on the extension line of the flow path 201.
- the flow path 203 is branched from the flow path 201, at a position between the flow paths 201 and 202.
- the flow path 202 is connected to a discard unit not shown.
- the flow path 203 is connected to the reservoir 22.
- the particle selection unit 21 is set at the flow path 202.
- the particle selection unit 21 includes a member 21a and a drive unit for projecting the member 21a into the flow path 202.
- the sample flowing in the flow path 201 is not sent to the flow path 203, but is sent to the discard unit via the flow path 202.
- the member 21a is located at a position for blocking the flow path 202, the sample flowing in the flow path 201 is not sent to the flow path 202, but is sent to the reservoir 22 via the flow path 203.
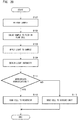
- the flow chart shown in FIG. 20 has step S111 to S113, instead of steps S105 and S106 in FIG. 16 .
- step S101 as in Embodiment 5, the processing unit 11 causes a sample to be prepared.
- step S102 the processing unit 11 drives the particle selection unit 21, to cause the flow path 202 to be open in advance, thereby causing the sample to flow from the sample preparation unit 12 to the flow path 201 of the flow cell 200.
- step S103 as in Embodiment 5, the processing unit 11 causes lights to be applied to the sample. At this time, as shown in FIG. 19 , the lights emitted from the light sources 211 to 214 are applied to the particle at a position 201a in the flow path 201, and the lights generated from the particle are received by the light receiving units 221 to 223 and the image capturing unit 224.
- step S104 as in Embodiment 5, the processing unit 11 obtains the intensities of the fluorescences generated from the particle.
- step S111 on the basis of the intensities of the fluorescences having the wavelengths ⁇ 21 and ⁇ 22 generated from the particle at the position 201a, the processing unit 11 determines whether or not this particle is in the region 101 of the scattergram 100 shown in FIG. 4A . That is, with respect to the cell at the position 201a, the processing unit 11 determines whether or not appropriate hybridization has occurred, on the basis of the intensities of the intensity of the fluorescence from the fluorescent dye included in the evaluation probe, and the fluorescence from the nucleic acid staining dye.
- the processing unit 11 determines that appropriate hybridization has occurred with respect to the cell at the position 201a, the processing unit 11 drives, in step S112, the particle selection unit 21 to block the flow path 202 at the time when this cell is located at a position 201b in the flow path 201, thereby sending this cell to the reservoir 22.
- the processing unit 11 drives, in step S113, the particle selection unit 21 to open the flow path 202 at the time when this cell is located at the position 201b, thereby sending this cell to the discard unit.
- a cell in which appropriate hybridization has occurred is selected as an analysis target, to be sent to the reservoir 22.
- an analysis target for example, if abnormal cell detection is performed by the cell detection apparatus 10 or another detection apparatus by use of the cells held in the reservoir 22, accurate abnormal cell detection can be performed.
- sample preparation is performed, with Her2 gene set as the detection target region and with Ch17 set as the evaluation target region.
- sample preparation may be performed, with a combination of the detection target region and the evaluation target region set as in Embodiments 2 to 4. Also in this case, cells in which appropriate hybridization has occurred can be selected as the analysis target.
Landscapes
- Chemical & Material Sciences (AREA)
- Life Sciences & Earth Sciences (AREA)
- Health & Medical Sciences (AREA)
- Organic Chemistry (AREA)
- Zoology (AREA)
- Engineering & Computer Science (AREA)
- Wood Science & Technology (AREA)
- Proteomics, Peptides & Aminoacids (AREA)
- Immunology (AREA)
- Physics & Mathematics (AREA)
- General Health & Medical Sciences (AREA)
- Biochemistry (AREA)
- Analytical Chemistry (AREA)
- Molecular Biology (AREA)
- General Engineering & Computer Science (AREA)
- Microbiology (AREA)
- Bioinformatics & Cheminformatics (AREA)
- Biotechnology (AREA)
- Genetics & Genomics (AREA)
- Biophysics (AREA)
- Optics & Photonics (AREA)
- Chemical Kinetics & Catalysis (AREA)
- Nuclear Medicine, Radiotherapy & Molecular Imaging (AREA)
- General Physics & Mathematics (AREA)
- Pathology (AREA)
- Measuring Or Testing Involving Enzymes Or Micro-Organisms (AREA)
- Investigating Or Analysing Biological Materials (AREA)
- Investigating, Analyzing Materials By Fluorescence Or Luminescence (AREA)
- Apparatus Associated With Microorganisms And Enzymes (AREA)
Claims (16)
- Procédé de sélection de cellules pour sélectionner des cellules cibles d'analyse pour détecter une anomalie génomique d'une région cible de détection dans un ADN dans les cellules cibles d'analyse, comprenant :une étape de préparation d'échantillon qui comprend la préparation d'un échantillon en effectuant : une coloration de la totalité du noyau dans chacune des cellules par un premier colorant fluorescent; et une hybridation par rapport à une région cible d'évaluation dans l'ADN dans chaque cellule par une sonde d'évaluation comprenant un deuxième colorant fluorescent, l'échantillon comprenant une cellule anormale dans laquelle une anomalie génomique est apparue au niveau de la région cible de détection et une cellule normale dans laquelle une anomalie génomique n'est pas apparue au niveau de la région cible de détection ;une étape de réception de lumière qui comprend l'application d'une lumière sur l'échantillon et la réception d'une fluorescence provenant du premier colorant fluorescent et d'une fluorescence provenant du deuxième colorant fluorescent ; etune étape de sélection qui comprend la sélection, en tant que cellules cibles d'analyse comprenant la cellule anormale et la cellule normale, des cellules dont l'intensité de la fluorescence provenant du premier colorant fluorescent est corrélée à l'intensité de la fluorescence provenant du deuxième colorant fluorescent, dans lequelle premier colorant fluorescent est un colorant qui émet une fluorescence présentant une première longueur d'onde, etle deuxième colorant fluorescent est un colorant qui émet une fluorescence présentant une deuxième longueur d'onde différente de la première longueur d'onde.
- Procédé de sélection de cellules selon la revendication 1, dans lequel
dans l'étape de réception de lumière, une lumière est appliquée sur l'échantillon s'écoulant dans une cellule d'écoulement, et la fluorescence provenant du premier colorant fluorescent et la fluorescence provenant du deuxième colorant fluorescent sont reçues. - Procédé de sélection de cellules selon la revendication 1, dans lequel
dans l'étape de réception de lumière, une lumière est appliquée sur l'échantillon disposé sur une base, et la fluorescence provenant du premier colorant fluorescent et la fluorescence provenant du deuxième colorant fluorescent sont reçues au moyen d'un microscope. - Procédé de sélection de cellules selon l'une quelconque des revendications 1 à 3, dans lequel
dans l'étape de sélection, une cellule pour laquelle une proportion entre l'intensité de la fluorescence provenant du premier colorant fluorescent et l'intensité de la fluorescence provenant du deuxième colorant fluorescent est évaluée comme étant dans une plage prédéterminée est sélectionnée comme étant la cellule cible d'analyse. - Procédé de sélection de cellules selon l'une quelconque des revendications 1 à 4, dans lequel
l'anomalie génomique est l'une parmi une amplification, une délétion, une translocation, et une inversion de gène. - Procédé de sélection de cellules selon la revendication 5, dans lequel
dans le cas où l'anomalie génomique est une amplification de gène, la région cible d'évaluation est, parmi les régions de séquences d'ADN dans un noyau de la cellule, une séquence d'une partie d'une région de séquence d'ADN excluant toute région de séquence d'ADN où une amplification se produit en raison de l'anomalie génomique, et
dans le cas où l'anomalie génomique est une délétion, la région cible d'évaluation est, parmi les régions de séquence d'ADN dans le noyau de la cellule, une séquence d'une partie d'une région de séquence d'ADN excluant toute région de séquence d'ADN où une délétion se produit en raison de l'anomalie génomique. - Procédé de sélection de cellules selon l'une quelconque des revendications 1 à 6, dans lequel
la sonde d'évaluation comporte un polynucléotide qui est complémentaire à la région cible d'évaluation et auquel le deuxième colorant fluorescent est lié. - Procédé de sélection de cellules selon l'une quelconque des revendications 1 à 7, dans lequel
dans l'étape de réception de lumière, une image de la cellule dans l'échantillon est capturée ; et
dans l'étape de sélection, la cellule cible d'analyse est sélectionnée sur la base de la brillance d'une image de la fluorescence provenant du premier colorant fluorescent et de la brillance d'une image de la fluorescence provenant du deuxième colorant fluorescent. - Procédé de détection de cellules pour sélectionner des cellules cibles d'analyse pour détecter une anomalie génomique d'une région cible de détection dans un ADN dans les cellules cibles d'analyse, comprenant :une étape de préparation d'échantillon qui comprend la préparation d'un échantillon en effectuant : une coloration de la totalité du noyau dans chacune des cellules par un premier colorant fluorescent; une hybridation par rapport à une région cible d'évaluation dans l'ADN dans chaque cellule par une sonde d'évaluation comprenant un deuxième colorant fluorescent; et une hybridation par rapport à une région cible de détection dans l'ADN dans la cellule par une sonde de détection comprenant un troisième colorant fluorescent, l'échantillon comprenant une cellule anormale dans laquelle une anomalie génomique est apparue au niveau de la région cible de détection et une cellule normale dans laquelle une anomalie génomique n'est pas apparue au niveau de la région cible de détection ;une étape de réception de lumière qui comprend l'application d'une lumière sur l'échantillon et la réception d'une fluorescence provenant du premier colorant fluorescent, d'une fluorescence provenant du deuxième colorant fluorescent, et d'une fluorescence provenant du troisième colorant fluorescent ;une étape de sélection qui comprend la sélection, en tant que cellules cibles d'analyse comprenant la cellule anormale et la cellule normale, des cellules dont l'intensité de la fluorescence provenant du premier colorant fluorescent est corrélée à l'intensité de la fluorescence provenant du deuxième colorant fluorescent ; etune étape de détection qui comprend la détection d'une cellule anormale à partir de la cellule cible d'analyse sur la base de la fluorescence provenant du troisième colorant fluorescent, dans lequelle premier colorant fluorescent est un colorant qui émet une fluorescence présentant une première longueur d'onde,le deuxième colorant fluorescent est un colorant qui émet une fluorescence présentant une deuxième longueur d'onde différente de la première longueur d'onde, etle troisième colorant fluorescent est un colorant qui émet une fluorescence présentant une troisième longueur d'onde différente des première et deuxième longueurs d'onde.
- Procédé de détection de cellules selon la revendication 9, dans lequel
dans l'étape de détection, la cellule anormale est détectée à partir de la cellule cible d'analyse, en comparant un seuil à un rapport entre l'intensité de la fluorescence provenant du troisième colorant fluorescent et l'intensité de la fluorescence provenant du deuxième colorant fluorescent. - Procédé de détection de cellules selon la revendication 10, dans lequel
dans l'étape de détection, une cellule dans laquelle une valeur obtenue en divisant l'intensité de la fluorescence provenant du troisième colorant fluorescent par l'intensité de la fluorescence provenant du deuxième colorant fluorescent dépasse un seuil est détectée comme étant la cellule anormale. - Procédé de détection de cellules selon l'une quelconque des revendications 9 à 11, dans lequel
la région cible de détection est un gène Her2,
la région cible d'évaluation est une séquence d'une partie d'une région de séquence d'ADN excluant le gène Her2 dans le chromosome 17, et
dans l'étape de détection, une cellule dans laquelle le gène Her2 a été amplifié est détectée comme étant la cellule anormale. - Procédé de détection de cellule selon la revendication 12, dans lequel
une combinaison de la région cible de détection et de la région cible d'évaluation est un gène BCR et un gène ABL, et
dans l'étape de détection, une cellule dans laquelle le gène BCR et le gène ABL ont été transloqués pour former un gène de fusion BCR-ABL est détectée comme étant la cellule anormale. - Appareil de sélection de cellules pour sélectionner des cellules cibles d'analyse pour détecter une anomalie génomique d'une région cible de détection dans un ADN dans les cellules cibles d'analyse, comprenant :une unité de préparation d'échantillon configurée pour préparer un échantillon en mélangeant des cellules, un réactif de coloration d'acide nucléique qui comprend un premier colorant fluorescent pour colorer la totalité du noyau dans chaque cellule, et un réactif qui comprend une sonde d'évaluation comprenant un deuxième colorant fluorescent et configurée pour s'hybrider à une région cible d'évaluation dans l'ADN dans la cellule, l'échantillon comprenant une cellule anormale dans laquelle une anomalie génomique est apparue au niveau de la région cible de détection et une cellule normale dans laquelle une anomalie génomique n'est pas apparue au niveau de la région cible de détection ;une cellule d'écoulement configurée pour permettre à l'échantillon de s'écouler à l'intérieur ;une source de lumière configurée pour appliquer une lumière sur l'échantillon s'écoulant dans la cellule d'écoulement,une unité de réception de lumière configurée pour recevoir une fluorescence provenant du premier colorant fluorescent et une fluorescence provenant du deuxième colorant fluorescent ; etune unité de traitement, dans lequelle premier colorant fluorescent est un colorant qui émet une fluorescence présentant une première longueur d'onde,le deuxième colorant fluorescent est un colorant qui émet une fluorescence présentant une deuxième longueur d'onde différente de la première longueur d'onde, etl'unité de traitement est configurée pour sélectionner, en tant que cellules cibles d'analyse comprenant la cellule anormale et la cellule normale, des cellules dont l'intensité de la fluorescence provenant du premier colorant fluorescent est corrélée à l'intensité de la fluorescence provenant du deuxième colorant fluorescent.
- Appareil de sélection de cellules selon la revendication 14, dans lequel
l'unité de réception de lumière est configurée pour capturer une image de la cellule dans l'échantillon ; et
l'unité de traitement
obtient, sur la base de l'image de la cellule, une brillance d'une image de la fluorescence provenant du premier colorant fluorescent, et une brillance d'une image de la fluorescence provenant du deuxième colorant fluorescent, et
sélectionne la cellule cible d'analyse sur la base de la brillance de l'image de la fluorescence provenant du premier colorant fluorescent et de la brillance de l'image de la fluorescence provenant du deuxième colorant fluorescent. - Appareil de détection de cellules pour sélectionner des cellules cibles d'analyse pour détecter une anomalie génomique d'une région cible de détection dans un ADN dans les cellules cibles d'analyse, comprenant :une unité de préparation d'échantillon configurée pour préparer un échantillon en mélangeant des cellules, un réactif de coloration d'acide nucléique qui comprend un premier colorant fluorescent pour colorer la totalité du noyau dans chaque cellule, un réactif qui comprend une sonde d'évaluation comprenant un deuxième colorant fluorescent et configurée pour s'hybrider à une région cible d'évaluation dans l'ADN dans la cellule, et un réactif qui comprend une sonde de détection comprenant un troisième colorant fluorescent et configurée pour s'hybrider à une région cible de détection dans l'ADN dans la cellule, l'échantillon comprenant une cellule anormale dans laquelle une anomalie génomique est apparue au niveau de la région cible de détection et une cellule normale dans laquelle une anomalie génomique n'est pas apparue au niveau de la région cible de détection ;une cellule d'écoulement configurée pour permettre à l'échantillon de s'écouler à l'intérieur;une source de lumière configurée pour appliquer une lumière sur l'échantillon s'écoulant dans la cellule d'écoulement ;une unité de réception de lumière configurée pour recevoir une fluorescence provenant du premier colorant fluorescent, une fluorescence provenant du deuxième colorant fluorescent, et une fluorescence provenant du troisième colorant fluorescent; etune unité de traitement, dans lequelle premier colorant fluorescent est un colorant qui émet une fluorescence présentant une première longueur d'onde,le deuxième colorant fluorescent est un colorant qui émet une fluorescence présentant une deuxième longueur d'onde différente de la première longueur d'onde,le troisième colorant fluorescent est un colorant qui émet une fluorescence présentant une troisième longueur d'onde différente des première et deuxième longueurs d'onde, etl'unité de traitement est configurée poursélectionner, en tant que cellules cibles d'analyse comprenant la cellule anormale et la cellule normale, des cellules dont l'intensité de la fluorescence provenant du premier colorant fluorescent est corrélée à l'intensité de la fluorescence provenant du deuxième colorant fluorescent, etdétecter une cellule anormale à partir de la cellule cible d'analyse sur la base de la fluorescence provenant du troisième colorant fluorescent.
Applications Claiming Priority (1)
| Application Number | Priority Date | Filing Date | Title |
|---|---|---|---|
| JP2015234215A JP6703824B2 (ja) | 2015-11-30 | 2015-11-30 | 細胞選択方法、細胞検出方法、細胞選択装置、および細胞検出装置 |
Publications (3)
| Publication Number | Publication Date |
|---|---|
| EP3173490A2 EP3173490A2 (fr) | 2017-05-31 |
| EP3173490A3 EP3173490A3 (fr) | 2017-08-30 |
| EP3173490B1 true EP3173490B1 (fr) | 2018-08-29 |
Family
ID=57460320
Family Applications (1)
| Application Number | Title | Priority Date | Filing Date |
|---|---|---|---|
| EP16200882.5A Active EP3173490B1 (fr) | 2015-11-30 | 2016-11-28 | Procédé de sélection de cellules, procédé de détection de cellules, appareil de sélection de cellules et appareil de détection de cellules |
Country Status (4)
| Country | Link |
|---|---|
| US (1) | US11060134B2 (fr) |
| EP (1) | EP3173490B1 (fr) |
| JP (1) | JP6703824B2 (fr) |
| CN (1) | CN107034269B (fr) |
Families Citing this family (8)
| Publication number | Priority date | Publication date | Assignee | Title |
|---|---|---|---|---|
| JP7042045B2 (ja) * | 2017-08-10 | 2022-03-25 | シスメックス株式会社 | 試料分析装置 |
| JP7054619B2 (ja) | 2017-11-30 | 2022-04-14 | シスメックス株式会社 | 画像分析装置および画像分析方法 |
| CN109496230A (zh) * | 2018-02-09 | 2019-03-19 | 柴崎株式会社 | 细菌检测装置以及细菌检测方法 |
| JP7271092B2 (ja) * | 2018-05-25 | 2023-05-11 | シスメックス株式会社 | 試薬選択支援装置、細胞分析システム、試薬の選択の支援方法、コンピュータプログラム及び記憶媒体 |
| EP3767587B1 (fr) * | 2019-07-19 | 2024-10-23 | Euroimmun Medizinische Labordiagnostika AG | Détection de la présence des différents types de motifs fluorescents d'anticorps antinucléaires et dispositif associé |
| JP2021097648A (ja) * | 2019-12-23 | 2021-07-01 | 横河電機株式会社 | 核酸配列計測装置及び核酸配列計測方法 |
| BR102023003038A2 (pt) * | 2022-03-17 | 2024-01-02 | Sysmex Corporation | Método para classificar glóbulos brancos em subpopulações |
| JP2024075125A (ja) * | 2022-11-22 | 2024-06-03 | シスメックス株式会社 | 有形成分検出方法、有形成分検出装置およびプログラム |
Family Cites Families (37)
| Publication number | Priority date | Publication date | Assignee | Title |
|---|---|---|---|---|
| US5200313A (en) * | 1983-08-05 | 1993-04-06 | Miles Inc. | Nucleic acid hybridization assay employing detectable anti-hybrid antibodies |
| JP3495752B2 (ja) * | 1992-12-11 | 2004-02-09 | キヤノン株式会社 | 生標的個体の検出方法およびプローブ |
| US5437980A (en) * | 1993-05-17 | 1995-08-01 | Molecular Probes, Inc. | Phenanthridium dye staining of nucleic acids in living cells |
| EP2369007B1 (fr) * | 1996-05-29 | 2015-07-29 | Cornell Research Foundation, Inc. | Détection de différences entre des séquences d'acides nucléiques faisant appel à la réaction de détection par ligation en chaîne couplée à la réaction de polymérisation en chaîne |
| US6060240A (en) * | 1996-12-13 | 2000-05-09 | Arcaris, Inc. | Methods for measuring relative amounts of nucleic acids in a complex mixture and retrieval of specific sequences therefrom |
| WO1998035012A2 (fr) * | 1997-02-12 | 1998-08-13 | Chan Eugene Y | Procedes et produits permettant d'analyser des polymeres |
| US8131053B2 (en) | 1999-01-25 | 2012-03-06 | Amnis Corporation | Detection of circulating tumor cells using imaging flow cytometry |
| US6249341B1 (en) | 1999-01-25 | 2001-06-19 | Amnis Corporation | Imaging and analyzing parameters of small moving objects such as cells |
| US6355435B1 (en) * | 1999-09-10 | 2002-03-12 | Board Of Trustees Of Michigan State University | Methods for detecting and enumerating Campylobacter jejuni in environmental samples and for identifying antibiotic-resistant strains |
| EP2278030B1 (fr) * | 2000-04-10 | 2017-05-24 | Taxon Biosciences, Inc. | Procédés pour l'étude et l'analyse génétique de populations |
| DE10106826C1 (de) * | 2001-02-14 | 2002-11-21 | Jakob Izbicki | Medium zur Züchtung von Tumorzellen |
| US7888060B2 (en) * | 2001-03-30 | 2011-02-15 | Nanoprobes, Inc. | Method for detecting a target using enzyme directed deposition of elemental metal |
| AU2002326718A1 (en) * | 2001-08-21 | 2003-03-03 | Mclaughlin Research Institute | Tramdorins and methods of using tramdorins |
| DE60235491D1 (de) * | 2001-11-28 | 2010-04-08 | Bio Rad Laboratories | Paralleles scoring von polymorphismen mittels amplifikation und fehlerkorrektur |
| US20030104439A1 (en) | 2001-11-30 | 2003-06-05 | Finch Rosalynde J. | Methods of identifying cellular target molecules |
| DE60229890D1 (de) * | 2002-09-30 | 2008-12-24 | Hoffmann La Roche | Oligonukleotide zur genotypisierung des thymidylat-synthase gens |
| CA2536949A1 (fr) * | 2003-09-08 | 2005-03-24 | Health Research, Inc. | Detection de modifications chromosiques 13q14 |
| US7354706B2 (en) * | 2003-09-09 | 2008-04-08 | The Regents Of The University Of Colorado, A Body Corporate | Use of photopolymerization for amplification and detection of a molecular recognition event |
| US8105768B2 (en) | 2005-03-09 | 2012-01-31 | Abbott Laboratories | Methods of identifying patients for treatment with HER-2/neu inhibitors based on detection of HER-2/neu and TOP2A gene copy number |
| JP4745030B2 (ja) | 2005-11-15 | 2011-08-10 | シスメックス株式会社 | 血液分析装置 |
| EP2530167A1 (fr) * | 2006-05-11 | 2012-12-05 | Raindance Technologies, Inc. | Dispositifs microfluidiques |
| CA2663286A1 (fr) * | 2006-09-15 | 2008-03-20 | The Governors Of The University Of Alberta | Analyse automatisee des poissons, puce microfluidique circulante et procede d'immobilisation de cellules sur une puce microfluidique |
| WO2008048931A1 (fr) * | 2006-10-16 | 2008-04-24 | Celula Inc. | Procédés et compositions pour le développement différentiel de cellules fœtales dans le sang maternel et leur utilisation |
| US20090208965A1 (en) | 2006-10-25 | 2009-08-20 | Ikonisys, Inc. | Automated method for detecting cancers and high grade hyperplasias |
| FR2920967B1 (fr) * | 2007-09-14 | 2009-10-23 | Sederma Soc Par Actions Simpli | Utilisation de l'hydroxymethionine en tant qu'actif anti age |
| US20100323345A1 (en) * | 2008-02-13 | 2010-12-23 | Gary Borisy | Methods and compositions for identifying cells by combinatorial fluorescence imaging |
| US8951725B2 (en) * | 2008-04-14 | 2015-02-10 | Abbott Laboratories | Diagnostic methods for determining prognosis of non-small cell lung cancer |
| WO2011027268A2 (fr) * | 2009-09-01 | 2011-03-10 | Koninklijke Philips Electronics N.V. | Dispositifs et procédés de sélection par micropuce |
| IN2012DN02337A (fr) | 2009-10-12 | 2015-08-21 | Ventana Med Syst Inc | |
| CN103097524B (zh) * | 2010-04-28 | 2016-08-03 | Atyr医药公司 | 与丙氨酰-tRNA合成酶的蛋白片段相关的治疗、诊断和抗体组合物的创新发现 |
| US20130225623A1 (en) * | 2010-10-27 | 2013-08-29 | Mount Sinai School Of Medicine | Methods of Treating Psychiatric or Neurological Disorders with MGLUR Antagonists |
| JP5916991B2 (ja) * | 2010-11-09 | 2016-05-11 | オリンパス株式会社 | 遺伝子異常細胞の解析方法 |
| EP2520926B1 (fr) * | 2011-05-05 | 2022-06-15 | Sysmex Corporation | Analyseur de sang, procédé d'analyse de sang et produit de programme informatique |
| US10660882B2 (en) * | 2012-03-26 | 2020-05-26 | Nippon Chemiphar Co., Ltd. | Prophylactic or therapeutic agent for giant cell tumors occurring in bone and soft tissue or for chondrosarcoma |
| EP2925863B1 (fr) * | 2012-11-30 | 2020-07-15 | Vestion Inc. | Cellules souches cardiaques et leurs procédés d'identification et d'utilisation |
| US9493742B2 (en) * | 2013-03-15 | 2016-11-15 | Emory University | Purification of cell mixtures using molecular beacons targeting cell specific RNA |
| US10323271B2 (en) | 2014-03-20 | 2019-06-18 | Konica Minolta, Inc. | Probe reagent and fish using probe reagent |
-
2015
- 2015-11-30 JP JP2015234215A patent/JP6703824B2/ja active Active
-
2016
- 2016-11-18 CN CN201611016107.0A patent/CN107034269B/zh active Active
- 2016-11-28 EP EP16200882.5A patent/EP3173490B1/fr active Active
- 2016-11-29 US US15/363,503 patent/US11060134B2/en active Active
Non-Patent Citations (1)
| Title |
|---|
| None * |
Also Published As
| Publication number | Publication date |
|---|---|
| JP6703824B2 (ja) | 2020-06-03 |
| CN107034269B (zh) | 2022-04-01 |
| US20170152552A1 (en) | 2017-06-01 |
| JP2017101975A (ja) | 2017-06-08 |
| CN107034269A (zh) | 2017-08-11 |
| EP3173490A2 (fr) | 2017-05-31 |
| US11060134B2 (en) | 2021-07-13 |
| EP3173490A3 (fr) | 2017-08-30 |
Similar Documents
| Publication | Publication Date | Title |
|---|---|---|
| EP3173490B1 (fr) | Procédé de sélection de cellules, procédé de détection de cellules, appareil de sélection de cellules et appareil de détection de cellules | |
| AU2021203139B2 (en) | Simultaneous quantification of gene expression in a user-defined region of a cross-sectioned tissue | |
| US8088715B2 (en) | Detection of circulating tumor cells in peripheral blood with an automated scanning fluorescence microscope | |
| DK2279266T3 (en) | PROCEDURE FOR DETECTING IGF1R DIFFERENCES IN CIRCULATING TUMOR CELLS USING FISH | |
| EP4368992A2 (fr) | Quantification simultanée d'une pluralité de protéines dans une région définie par l'utilisateur d'un tissu en coupe transversale | |
| CA2825453C (fr) | Procede d'analyse des translocations chromosomiques et systeme associe | |
| AU2012228424A1 (en) | A method of analyzing chromosomal translocations and a system therefore | |
| CN117222894A (zh) | 使用免疫检查点抑制剂治疗癌症的方法 | |
| CN105603109A (zh) | 一种单通道下检测bcr/abl基因融合的探针标记方法 | |
| Hsieh et al. | Location and biomarker characterization of circulating tumor cells | |
| Swansbury et al. | Fluorescence in situ hybridization methods and troubleshooting applied to fixed cell suspensions | |
| JP2019103489A (ja) | 粒子測定方法、検体処理方法、および粒子撮像装置 |
Legal Events
| Date | Code | Title | Description |
|---|---|---|---|
| PUAI | Public reference made under article 153(3) epc to a published international application that has entered the european phase |
Free format text: ORIGINAL CODE: 0009012 |
|
| AK | Designated contracting states |
Kind code of ref document: A2 Designated state(s): AL AT BE BG CH CY CZ DE DK EE ES FI FR GB GR HR HU IE IS IT LI LT LU LV MC MK MT NL NO PL PT RO RS SE SI SK SM TR |
|
| AX | Request for extension of the european patent |
Extension state: BA ME |
|
| PUAL | Search report despatched |
Free format text: ORIGINAL CODE: 0009013 |
|
| RIC1 | Information provided on ipc code assigned before grant |
Ipc: C12Q 1/68 20060101AFI20170718BHEP |
|
| AK | Designated contracting states |
Kind code of ref document: A3 Designated state(s): AL AT BE BG CH CY CZ DE DK EE ES FI FR GB GR HR HU IE IS IT LI LT LU LV MC MK MT NL NO PL PT RO RS SE SI SK SM TR |
|
| AX | Request for extension of the european patent |
Extension state: BA ME |
|
| RIC1 | Information provided on ipc code assigned before grant |
Ipc: C12Q 1/68 20060101AFI20170725BHEP |
|
| 17P | Request for examination filed |
Effective date: 20180223 |
|
| RBV | Designated contracting states (corrected) |
Designated state(s): AL AT BE BG CH CY CZ DE DK EE ES FI FR GB GR HR HU IE IS IT LI LT LU LV MC MK MT NL NO PL PT RO RS SE SI SK SM TR |
|
| GRAP | Despatch of communication of intention to grant a patent |
Free format text: ORIGINAL CODE: EPIDOSNIGR1 |
|
| INTG | Intention to grant announced |
Effective date: 20180423 |
|
| GRAS | Grant fee paid |
Free format text: ORIGINAL CODE: EPIDOSNIGR3 |
|
| GRAA | (expected) grant |
Free format text: ORIGINAL CODE: 0009210 |
|
| AK | Designated contracting states |
Kind code of ref document: B1 Designated state(s): AL AT BE BG CH CY CZ DE DK EE ES FI FR GB GR HR HU IE IS IT LI LT LU LV MC MK MT NL NO PL PT RO RS SE SI SK SM TR |
|
| REG | Reference to a national code |
Ref country code: GB Ref legal event code: FG4D |
|
| REG | Reference to a national code |
Ref country code: CH Ref legal event code: EP |
|
| REG | Reference to a national code |
Ref country code: AT Ref legal event code: REF Ref document number: 1035187 Country of ref document: AT Kind code of ref document: T Effective date: 20180915 |
|
| REG | Reference to a national code |
Ref country code: IE Ref legal event code: FG4D |
|
| REG | Reference to a national code |
Ref country code: DE Ref legal event code: R096 Ref document number: 602016005157 Country of ref document: DE |
|
| REG | Reference to a national code |
Ref country code: NL Ref legal event code: MP Effective date: 20180829 |
|
| REG | Reference to a national code |
Ref country code: LT Ref legal event code: MG4D |
|
| PG25 | Lapsed in a contracting state [announced via postgrant information from national office to epo] |
Ref country code: LT Free format text: LAPSE BECAUSE OF FAILURE TO SUBMIT A TRANSLATION OF THE DESCRIPTION OR TO PAY THE FEE WITHIN THE PRESCRIBED TIME-LIMIT Effective date: 20180829 Ref country code: IS Free format text: LAPSE BECAUSE OF FAILURE TO SUBMIT A TRANSLATION OF THE DESCRIPTION OR TO PAY THE FEE WITHIN THE PRESCRIBED TIME-LIMIT Effective date: 20181229 Ref country code: RS Free format text: LAPSE BECAUSE OF FAILURE TO SUBMIT A TRANSLATION OF THE DESCRIPTION OR TO PAY THE FEE WITHIN THE PRESCRIBED TIME-LIMIT Effective date: 20180829 Ref country code: BG Free format text: LAPSE BECAUSE OF FAILURE TO SUBMIT A TRANSLATION OF THE DESCRIPTION OR TO PAY THE FEE WITHIN THE PRESCRIBED TIME-LIMIT Effective date: 20181129 Ref country code: NL Free format text: LAPSE BECAUSE OF FAILURE TO SUBMIT A TRANSLATION OF THE DESCRIPTION OR TO PAY THE FEE WITHIN THE PRESCRIBED TIME-LIMIT Effective date: 20180829 Ref country code: GR Free format text: LAPSE BECAUSE OF FAILURE TO SUBMIT A TRANSLATION OF THE DESCRIPTION OR TO PAY THE FEE WITHIN THE PRESCRIBED TIME-LIMIT Effective date: 20181130 Ref country code: FI Free format text: LAPSE BECAUSE OF FAILURE TO SUBMIT A TRANSLATION OF THE DESCRIPTION OR TO PAY THE FEE WITHIN THE PRESCRIBED TIME-LIMIT Effective date: 20180829 Ref country code: SE Free format text: LAPSE BECAUSE OF FAILURE TO SUBMIT A TRANSLATION OF THE DESCRIPTION OR TO PAY THE FEE WITHIN THE PRESCRIBED TIME-LIMIT Effective date: 20180829 Ref country code: NO Free format text: LAPSE BECAUSE OF FAILURE TO SUBMIT A TRANSLATION OF THE DESCRIPTION OR TO PAY THE FEE WITHIN THE PRESCRIBED TIME-LIMIT Effective date: 20181129 |
|
| REG | Reference to a national code |
Ref country code: AT Ref legal event code: MK05 Ref document number: 1035187 Country of ref document: AT Kind code of ref document: T Effective date: 20180829 |
|
| PG25 | Lapsed in a contracting state [announced via postgrant information from national office to epo] |
Ref country code: HR Free format text: LAPSE BECAUSE OF FAILURE TO SUBMIT A TRANSLATION OF THE DESCRIPTION OR TO PAY THE FEE WITHIN THE PRESCRIBED TIME-LIMIT Effective date: 20180829 Ref country code: LV Free format text: LAPSE BECAUSE OF FAILURE TO SUBMIT A TRANSLATION OF THE DESCRIPTION OR TO PAY THE FEE WITHIN THE PRESCRIBED TIME-LIMIT Effective date: 20180829 Ref country code: AL Free format text: LAPSE BECAUSE OF FAILURE TO SUBMIT A TRANSLATION OF THE DESCRIPTION OR TO PAY THE FEE WITHIN THE PRESCRIBED TIME-LIMIT Effective date: 20180829 |
|
| PG25 | Lapsed in a contracting state [announced via postgrant information from national office to epo] |
Ref country code: CZ Free format text: LAPSE BECAUSE OF FAILURE TO SUBMIT A TRANSLATION OF THE DESCRIPTION OR TO PAY THE FEE WITHIN THE PRESCRIBED TIME-LIMIT Effective date: 20180829 Ref country code: RO Free format text: LAPSE BECAUSE OF FAILURE TO SUBMIT A TRANSLATION OF THE DESCRIPTION OR TO PAY THE FEE WITHIN THE PRESCRIBED TIME-LIMIT Effective date: 20180829 Ref country code: IT Free format text: LAPSE BECAUSE OF FAILURE TO SUBMIT A TRANSLATION OF THE DESCRIPTION OR TO PAY THE FEE WITHIN THE PRESCRIBED TIME-LIMIT Effective date: 20180829 Ref country code: EE Free format text: LAPSE BECAUSE OF FAILURE TO SUBMIT A TRANSLATION OF THE DESCRIPTION OR TO PAY THE FEE WITHIN THE PRESCRIBED TIME-LIMIT Effective date: 20180829 Ref country code: AT Free format text: LAPSE BECAUSE OF FAILURE TO SUBMIT A TRANSLATION OF THE DESCRIPTION OR TO PAY THE FEE WITHIN THE PRESCRIBED TIME-LIMIT Effective date: 20180829 Ref country code: ES Free format text: LAPSE BECAUSE OF FAILURE TO SUBMIT A TRANSLATION OF THE DESCRIPTION OR TO PAY THE FEE WITHIN THE PRESCRIBED TIME-LIMIT Effective date: 20180829 Ref country code: PL Free format text: LAPSE BECAUSE OF FAILURE TO SUBMIT A TRANSLATION OF THE DESCRIPTION OR TO PAY THE FEE WITHIN THE PRESCRIBED TIME-LIMIT Effective date: 20180829 |
|
| PG25 | Lapsed in a contracting state [announced via postgrant information from national office to epo] |
Ref country code: SK Free format text: LAPSE BECAUSE OF FAILURE TO SUBMIT A TRANSLATION OF THE DESCRIPTION OR TO PAY THE FEE WITHIN THE PRESCRIBED TIME-LIMIT Effective date: 20180829 Ref country code: SM Free format text: LAPSE BECAUSE OF FAILURE TO SUBMIT A TRANSLATION OF THE DESCRIPTION OR TO PAY THE FEE WITHIN THE PRESCRIBED TIME-LIMIT Effective date: 20180829 Ref country code: DK Free format text: LAPSE BECAUSE OF FAILURE TO SUBMIT A TRANSLATION OF THE DESCRIPTION OR TO PAY THE FEE WITHIN THE PRESCRIBED TIME-LIMIT Effective date: 20180829 |
|
| REG | Reference to a national code |
Ref country code: DE Ref legal event code: R097 Ref document number: 602016005157 Country of ref document: DE |
|
| PLBE | No opposition filed within time limit |
Free format text: ORIGINAL CODE: 0009261 |
|
| STAA | Information on the status of an ep patent application or granted ep patent |
Free format text: STATUS: NO OPPOSITION FILED WITHIN TIME LIMIT |
|
| PG25 | Lapsed in a contracting state [announced via postgrant information from national office to epo] |
Ref country code: LU Free format text: LAPSE BECAUSE OF NON-PAYMENT OF DUE FEES Effective date: 20181128 Ref country code: MC Free format text: LAPSE BECAUSE OF FAILURE TO SUBMIT A TRANSLATION OF THE DESCRIPTION OR TO PAY THE FEE WITHIN THE PRESCRIBED TIME-LIMIT Effective date: 20180829 |
|
| 26N | No opposition filed |
Effective date: 20190531 |
|
| REG | Reference to a national code |
Ref country code: BE Ref legal event code: MM Effective date: 20181130 |
|
| REG | Reference to a national code |
Ref country code: IE Ref legal event code: MM4A |
|
| PG25 | Lapsed in a contracting state [announced via postgrant information from national office to epo] |
Ref country code: SI Free format text: LAPSE BECAUSE OF FAILURE TO SUBMIT A TRANSLATION OF THE DESCRIPTION OR TO PAY THE FEE WITHIN THE PRESCRIBED TIME-LIMIT Effective date: 20180829 |
|
| PG25 | Lapsed in a contracting state [announced via postgrant information from national office to epo] |
Ref country code: IE Free format text: LAPSE BECAUSE OF NON-PAYMENT OF DUE FEES Effective date: 20181128 |
|
| PG25 | Lapsed in a contracting state [announced via postgrant information from national office to epo] |
Ref country code: BE Free format text: LAPSE BECAUSE OF NON-PAYMENT OF DUE FEES Effective date: 20181130 |
|
| PG25 | Lapsed in a contracting state [announced via postgrant information from national office to epo] |
Ref country code: MT Free format text: LAPSE BECAUSE OF NON-PAYMENT OF DUE FEES Effective date: 20181128 |
|
| PG25 | Lapsed in a contracting state [announced via postgrant information from national office to epo] |
Ref country code: TR Free format text: LAPSE BECAUSE OF FAILURE TO SUBMIT A TRANSLATION OF THE DESCRIPTION OR TO PAY THE FEE WITHIN THE PRESCRIBED TIME-LIMIT Effective date: 20180829 |
|
| PG25 | Lapsed in a contracting state [announced via postgrant information from national office to epo] |
Ref country code: PT Free format text: LAPSE BECAUSE OF FAILURE TO SUBMIT A TRANSLATION OF THE DESCRIPTION OR TO PAY THE FEE WITHIN THE PRESCRIBED TIME-LIMIT Effective date: 20180829 |
|
| PG25 | Lapsed in a contracting state [announced via postgrant information from national office to epo] |
Ref country code: MK Free format text: LAPSE BECAUSE OF NON-PAYMENT OF DUE FEES Effective date: 20180829 Ref country code: HU Free format text: LAPSE BECAUSE OF FAILURE TO SUBMIT A TRANSLATION OF THE DESCRIPTION OR TO PAY THE FEE WITHIN THE PRESCRIBED TIME-LIMIT; INVALID AB INITIO Effective date: 20161128 Ref country code: CY Free format text: LAPSE BECAUSE OF FAILURE TO SUBMIT A TRANSLATION OF THE DESCRIPTION OR TO PAY THE FEE WITHIN THE PRESCRIBED TIME-LIMIT Effective date: 20180829 |
|
| REG | Reference to a national code |
Ref country code: CH Ref legal event code: PL |
|
| PG25 | Lapsed in a contracting state [announced via postgrant information from national office to epo] |
Ref country code: CH Free format text: LAPSE BECAUSE OF NON-PAYMENT OF DUE FEES Effective date: 20191130 Ref country code: LI Free format text: LAPSE BECAUSE OF NON-PAYMENT OF DUE FEES Effective date: 20191130 |
|
| PGFP | Annual fee paid to national office [announced via postgrant information from national office to epo] |
Ref country code: FR Payment date: 20250930 Year of fee payment: 10 |
|
| PGFP | Annual fee paid to national office [announced via postgrant information from national office to epo] |
Ref country code: DE Payment date: 20250930 Year of fee payment: 10 |
|
| PGFP | Annual fee paid to national office [announced via postgrant information from national office to epo] |
Ref country code: GB Payment date: 20251001 Year of fee payment: 10 |