EP3633603B1 - Verfahren und system zur analyse der gewebedichte - Google Patents
Verfahren und system zur analyse der gewebedichte Download PDFInfo
- Publication number
- EP3633603B1 EP3633603B1 EP17916087.4A EP17916087A EP3633603B1 EP 3633603 B1 EP3633603 B1 EP 3633603B1 EP 17916087 A EP17916087 A EP 17916087A EP 3633603 B1 EP3633603 B1 EP 3633603B1
- Authority
- EP
- European Patent Office
- Prior art keywords
- density
- tissue
- segmentations
- tissue density
- bar chart
- Prior art date
- Legal status (The legal status is an assumption and is not a legal conclusion. Google has not performed a legal analysis and makes no representation as to the accuracy of the status listed.)
- Active
Links
Images


Classifications
-
- G—PHYSICS
- G16—INFORMATION AND COMMUNICATION TECHNOLOGY [ICT] SPECIALLY ADAPTED FOR SPECIFIC APPLICATION FIELDS
- G16H—HEALTHCARE INFORMATICS, i.e. INFORMATION AND COMMUNICATION TECHNOLOGY [ICT] SPECIALLY ADAPTED FOR THE HANDLING OR PROCESSING OF MEDICAL OR HEALTHCARE DATA
- G16H30/00—ICT specially adapted for the handling or processing of medical images
- G16H30/20—ICT specially adapted for the handling or processing of medical images for handling medical images, e.g. DICOM, HL7 or PACS
-
- A—HUMAN NECESSITIES
- A61—MEDICAL OR VETERINARY SCIENCE; HYGIENE
- A61B—DIAGNOSIS; SURGERY; IDENTIFICATION
- A61B6/00—Apparatus or devices for radiation diagnosis; Apparatus or devices for radiation diagnosis combined with radiation therapy equipment
- A61B6/02—Arrangements for diagnosis sequentially in different planes; Stereoscopic radiation diagnosis
- A61B6/03—Computed tomography [CT]
- A61B6/032—Transmission computed tomography [CT]
-
- A—HUMAN NECESSITIES
- A61—MEDICAL OR VETERINARY SCIENCE; HYGIENE
- A61B—DIAGNOSIS; SURGERY; IDENTIFICATION
- A61B6/00—Apparatus or devices for radiation diagnosis; Apparatus or devices for radiation diagnosis combined with radiation therapy equipment
- A61B6/46—Arrangements for interfacing with the operator or the patient
- A61B6/461—Displaying means of special interest
- A61B6/463—Displaying means of special interest characterised by displaying multiple images or images and diagnostic data on one display
-
- A—HUMAN NECESSITIES
- A61—MEDICAL OR VETERINARY SCIENCE; HYGIENE
- A61B—DIAGNOSIS; SURGERY; IDENTIFICATION
- A61B6/00—Apparatus or devices for radiation diagnosis; Apparatus or devices for radiation diagnosis combined with radiation therapy equipment
- A61B6/50—Apparatus or devices for radiation diagnosis; Apparatus or devices for radiation diagnosis combined with radiation therapy equipment specially adapted for specific body parts; specially adapted for specific clinical applications
-
- A—HUMAN NECESSITIES
- A61—MEDICAL OR VETERINARY SCIENCE; HYGIENE
- A61B—DIAGNOSIS; SURGERY; IDENTIFICATION
- A61B6/00—Apparatus or devices for radiation diagnosis; Apparatus or devices for radiation diagnosis combined with radiation therapy equipment
- A61B6/52—Devices using data or image processing specially adapted for radiation diagnosis
- A61B6/5211—Devices using data or image processing specially adapted for radiation diagnosis involving processing of medical diagnostic data
- A61B6/5217—Devices using data or image processing specially adapted for radiation diagnosis involving processing of medical diagnostic data extracting a diagnostic or physiological parameter from medical diagnostic data
-
- G—PHYSICS
- G06—COMPUTING OR CALCULATING; COUNTING
- G06T—IMAGE DATA PROCESSING OR GENERATION, IN GENERAL
- G06T11/00—Two-dimensional [2D] image generation
- G06T11/10—Texturing; Colouring; Generation of textures or colours
-
- G—PHYSICS
- G06—COMPUTING OR CALCULATING; COUNTING
- G06T—IMAGE DATA PROCESSING OR GENERATION, IN GENERAL
- G06T11/00—Two-dimensional [2D] image generation
- G06T11/20—Drawing from basic elements
- G06T11/26—Drawing of charts or graphs
-
- G—PHYSICS
- G06—COMPUTING OR CALCULATING; COUNTING
- G06T—IMAGE DATA PROCESSING OR GENERATION, IN GENERAL
- G06T12/00—Tomographic reconstruction from projections
- G06T12/30—Image post-processing, e.g. metal artefact correction
-
- G—PHYSICS
- G06—COMPUTING OR CALCULATING; COUNTING
- G06T—IMAGE DATA PROCESSING OR GENERATION, IN GENERAL
- G06T7/00—Image analysis
-
- G—PHYSICS
- G06—COMPUTING OR CALCULATING; COUNTING
- G06T—IMAGE DATA PROCESSING OR GENERATION, IN GENERAL
- G06T7/00—Image analysis
- G06T7/0002—Inspection of images, e.g. flaw detection
- G06T7/0012—Biomedical image inspection
-
- G—PHYSICS
- G06—COMPUTING OR CALCULATING; COUNTING
- G06T—IMAGE DATA PROCESSING OR GENERATION, IN GENERAL
- G06T7/00—Image analysis
- G06T7/0002—Inspection of images, e.g. flaw detection
- G06T7/0012—Biomedical image inspection
- G06T7/0014—Biomedical image inspection using an image reference approach
-
- G—PHYSICS
- G06—COMPUTING OR CALCULATING; COUNTING
- G06T—IMAGE DATA PROCESSING OR GENERATION, IN GENERAL
- G06T7/00—Image analysis
- G06T7/10—Segmentation; Edge detection
- G06T7/11—Region-based segmentation
-
- G—PHYSICS
- G06—COMPUTING OR CALCULATING; COUNTING
- G06T—IMAGE DATA PROCESSING OR GENERATION, IN GENERAL
- G06T7/00—Image analysis
- G06T7/10—Segmentation; Edge detection
- G06T7/136—Segmentation; Edge detection involving thresholding
-
- G—PHYSICS
- G16—INFORMATION AND COMMUNICATION TECHNOLOGY [ICT] SPECIALLY ADAPTED FOR SPECIFIC APPLICATION FIELDS
- G16H—HEALTHCARE INFORMATICS, i.e. INFORMATION AND COMMUNICATION TECHNOLOGY [ICT] SPECIALLY ADAPTED FOR THE HANDLING OR PROCESSING OF MEDICAL OR HEALTHCARE DATA
- G16H30/00—ICT specially adapted for the handling or processing of medical images
- G16H30/40—ICT specially adapted for the handling or processing of medical images for processing medical images, e.g. editing
-
- G—PHYSICS
- G06—COMPUTING OR CALCULATING; COUNTING
- G06T—IMAGE DATA PROCESSING OR GENERATION, IN GENERAL
- G06T2207/00—Indexing scheme for image analysis or image enhancement
- G06T2207/10—Image acquisition modality
- G06T2207/10072—Tomographic images
- G06T2207/10081—Computed x-ray tomography [CT]
-
- G—PHYSICS
- G06—COMPUTING OR CALCULATING; COUNTING
- G06T—IMAGE DATA PROCESSING OR GENERATION, IN GENERAL
- G06T2207/00—Indexing scheme for image analysis or image enhancement
- G06T2207/20—Special algorithmic details
- G06T2207/20072—Graph-based image processing
-
- G—PHYSICS
- G06—COMPUTING OR CALCULATING; COUNTING
- G06T—IMAGE DATA PROCESSING OR GENERATION, IN GENERAL
- G06T2207/00—Indexing scheme for image analysis or image enhancement
- G06T2207/30—Subject of image; Context of image processing
- G06T2207/30004—Biomedical image processing
- G06T2207/30061—Lung
-
- G—PHYSICS
- G06—COMPUTING OR CALCULATING; COUNTING
- G06T—IMAGE DATA PROCESSING OR GENERATION, IN GENERAL
- G06T2207/00—Indexing scheme for image analysis or image enhancement
- G06T2207/30—Subject of image; Context of image processing
- G06T2207/30004—Biomedical image processing
- G06T2207/30096—Tumor; Lesion
Definitions
- the present disclosure relates to a method and system for image display and processing, and in particular, relates to a tissue density analysis method and system.
- CT computed tomography
- a user When a tissue density analysis is performed, a user needs to divide a target tissue or lesion into multiple segments or multiple intervals according to the CT value, and evaluate the target tissue or lesion according to a proportion of a region corresponding to a CT interval or a CT segment in the target tissue.
- CN101105862A relates to a self-adapting adjustment method for medical image window parameters.
- US20150235085A1 relates to an image processing apparatus etc. that can precisely recognize multiple regions with density value fluctuation in an image with a simple operation in a process of recognizing a specific region from the image.
- JP2003102723A relates to a medical image display device and its control method.
- flow charts are used to illustrate the operations performed by the system. It is to be expressly understood, the operations above or below are or are not implemented in order. Conversely, the operations are performed in inverted order, or simultaneously. Besides, one or more other operations are added to the flow charts, or one or more operations are omitted from the flow charts.
- the present disclosure describes a method of tissue density analysis.
- a tissue density is divided into one or more CT intervals based on CT values. Distributions of different CT intervals or density intervals in the tissue or lesion to be analyzed are represented by a plurality of charts. By displaying the plurality of charts at the same time, the user sets the density interval of the tissue lesions easily, and obtain the density analysis results intuitively.
- FIG. 1 is a schematic diagram of an application scenario illustrating an exemplary tissue density analysis system according to some embodiments of the present disclosure.
- a tissue density analysis system 100 includes an imaging device 110, a storage device 130, and a tissue density analysis device 120.
- the imaging device 110 generates an image by scanning a target object.
- the image is a medical image.
- the image is a head image, a chest image, an abdominal image, a pelvic image, a perineal image, a limb image, a spine image, a vertebra image, or the like.
- the head image includes a brain image, a skull image, or the like.
- the chest image includes an entire chest image, a heart image, a breast image, or the like.
- the abdominal image includes an entire abdominal image, a kidney image, a liver image, a lung image, or the like.
- the image includes, but not limited to, an omnidirectional digitized image, a digitized tomogram image, a phase contrast map, a computed radiography (CR) image, a multimodal image, or the like.
- the image is a two-dimensional image or a three-dimensional image.
- the format of the image includes a JPEG format, a TIFF format, a GIF format, an FPX format, or the like.
- the image is stored in the storage device 130, or be transmitted to the tissue density analysis device 120 for image processing.
- the storage device 130 stores image and/or information related to the image.
- the image and the information related to the image is provided by the imaging device 110, the tissue density analysis device 120, or an external device of the tissue density analysis system 100.
- the storage device 130 stores user input information, information obtained from the network 150, or the like.
- the information related to the image includes an algorithm, a sample, a model, a parameter for image processing, real-time data during image processing, or the like.
- the storage device 130 is a hierarchical database, a networked database, or a relational database.
- the storage device 130 is a local database or a remote database.
- the storage device 130 or other storage devices in the tissue density analysis system 100 digitizes information and store the digitized information using a storage device that operates electrically, optically, or magnetically.
- the storage device 130 or the other storage devices in the tissue density analysis system 100 is a device that uses electrical energy to store information, such as a random-access memory (RAM), a read only memory (ROM), or the like.
- the random access memory includes, but is not limited to, a decimal counter, a select tube, a delay line memory, a Williams tube, a dynamic random access memory (DRAM), a static random access memory (SRAM), a thyristor random access memory (T-RAM), a zero capacitance random access memory (Z-RAM), or the like, or any combination thereof.
- the read-only memory includes, but is not limited to, a bubble memory, a magnetic button line memory, a thin film memory, a magnetic plate line memory, a magnetic core memory, a drum memory, an optical disk drive, a hard disk, a magnetic tape, a anon-volatile memory (NVRAM), a phase change memory, a magneto-resistive random storage memory, a ferroelectric random access memory, a non-volatile static random access memory, a programmable read-only memory, a shielded heap read memory, a floating connection gate random access memory, a nano random access memory, a track memory, a variable resistance memory, a programmable metallization unit, or the like, or any combination thereof.
- NVRAM anon-volatile memory
- the storage device 130 or the other storage devices in the tissue density analysis system 100 is a device that uses magnetic energy to store information, such as a hard disk, a floppy disk, a magnetic tape, a magnetic core memory, a magnetic bubble memory, a USB flash drive, a memory, or the like.
- the storage device 130 or the other storage devices in the tissue density analysis system 100 is a device that optically stores information, such as a CD, a DVD, or the like.
- the storage device 130 is a device that stores information using a magneto-optical method, such as a magneto-optical disk, or the like.
- the access mode of the storage device 130 or other storage devices in the tissue density analysis system 100 is a random storage, a serial access storage, a read-only storage, or the like, or any combination thereof.
- the storage device 130 or the other storage device in the tissue density analysis system 100 is a non-permanent memory or a permanent memory.
- the storage device 130 described above is merely an example, and the storage device 130 used in the tissue density analysis system 100 is not limited thereto.
- the storage device 130 is a part of the tissue density analysis device 120, a part of the imaging device 110, or exists independently of the tissue density analysis device 120 and the imaging device 110. In some embodiments, the storage device 130 is connected to other modules or devices in the tissue density analysis system 100 via the network 150.
- the connections between the storage device 130 and the other modules or devices in the tissue density analysis system 100 includes a wired connection, a wireless connection, or a combination thereof.
- the tissue density analysis device 120 obtains image data from the imaging device 110, and/or the storage device 130.
- the tissue density analysis device 120 analyzes the obtained image data.
- the analysis includes a tissue density analysis, an airway analysis, or the like.
- the tissue density analysis includes a tissue or lesion density display, a tissue or lesion density adjustment, or the like.
- the tissue density analysis device 120 displays tissue or lesion density analysis data to the user in a variety of forms simultaneously.
- the forms includes a table, a histogram, a CT value bar chart, or the like.
- the tissue density analysis device 120 displays the processed image data via a display device, store the processed data in the storage device 130, or transmit the processed data to a device other than the tissue density analysis system 100.
- the tissue density analysis device 120 includes one or more processors, storages, or the like.
- the tissue density analysis device 120 includes a central processor (CPU), an application specific integrated circuit (ASIC), a dedicated instruction set processor (ASIP), an image processor (GPU), a physical computing processor (PPU), a digital signal processor (DSP), a field programmable gate array (FPGA), a programmable logic device (PLD), a controller, a micro control unit, a processor, a microprocessor, an advanced RISC machine processor, or the like, or any combination thereof.
- CPU central processor
- ASIC application specific integrated circuit
- ASIP dedicated instruction set processor
- GPU graphics processing unit
- PPU physical computing processor
- DSP digital signal processor
- FPGA field programmable gate array
- PLD programmable logic device
- the tissue density analysis system 100 also includes one or more terminal devices 140.
- the terminal device 140 performs information interaction with the imaging device 110, the storage device 130, and the tissue density analysis device 120. For example, the terminal device 140 obtains processed image data from the tissue density analysis device 120. In some embodiments, the terminal device 140 obtains image data from the imaging device 110 and transmit the image data to the tissue density analysis device 120 for image processing.
- the one or more terminal devices 140 include a desktop 140-1, a handset 140-2, a tablet computer 140-3, or the like.
- the one or more terminal devices 140 include one or more input devices, one or more control panels, or the like.
- the one or more input devices include a keyboard, a touch screen, a mouse, a voice input device, a scanning device, an information recognition device (such as a human eye recognition system, a fingerprint recognition system, a brain monitoring system, etc.), a remote controller, or the like.
- the tissue density analysis system 100 is connected to the network 150.
- the network 150 is a wireless network, a mobile network, a wired network, or the like.
- the wireless network includes a Bluetooth, a WLAN, a Wi-Fi, a WiMax, or the like.
- the mobile network includes a 2G, a 3G, a 4G, or the like.
- the wired network includes a local area network (LAN), a wide area network (WANs), a private network, or the like.
- the storage device 130 and the tissue density analysis device 120 in the tissue density analysis system 100 executes operational instructions via a cloud computing platform.
- the cloud computing platform includes a storage cloud platform based on data storage, a computational cloud platform based on data processing, and an integrated cloud computing platform that combines computing, data storage and data processing. For example, image data generated by the tissue density analysis system 100 is processed or stored by a cloud computing platform.
- tissue density analysis system 100 is merely provided for the purposes of illustration, and not intended to limit the scope of the present disclosure.
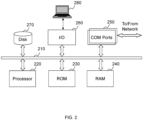
- FIG. 2 is a schematic diagram of an exemplary system configuration illustrating a tissue density analysis device according to some embodiments of the present disclosure.
- the tissue density analysis device 120 includes a data bus 210, a processor 220, a read only memory (ROM) 230, a random access memory (RAM) 240, a communication port 250, an input/output port 260, a hard disk 270, and a display 280 connected to the input/output port 260.
- the connection between hardware in the tissue density analysis device 120 is wired, wireless, or a combination of thereof.
- the hardware is local, remote, or a combination of thereof.
- the data bus 210 is configured to transfer data and/or information.
- hardware in the tissue density analysis device 120 transmits data via the data bus 210.
- the processor 220 sends data to a storage or other hardware such as the input/output port 260 via the data bus 210.
- the data is real data, an instruction code, state information, control information.
- the data bus 210 is an industry standard (ISA) bus, an extended industry standard (EISA) bus, a video electronic standard (VESA) bus, an external component interconnect standard (PCI) bus, or the like.
- the processor 220 is used for logic operations, data processing, and instruction generation. In some embodiments, the processor 220 obtains data/instructions from an internal storage.
- the storage includes a read only memory (ROM), a random-access memory (RAM), a cache (not shown in FIG. 2 ), or the like.
- the processor 220 includes a plurality of sub-processors configured to implement different functions of the system.
- the read only memory 230 is used for the power-on self-test of the tissue density analysis device 120, an initialization of each functional module in the tissue density analysis device 120, a driver of the input/output of the tissue density analysis device 120, or the like.
- the read only memory includes a programmable read only memory (PROM), a programmable erasable read only memory (EPROM), or the like.
- the random-access memory 240 is used to store an operating system, an application, data, or the like.
- the random-access memory 240 includes a static random-access memory (SRAM), a dynamic random-access memory (DRAM), or the like.
- the communication port 250 is configured to connect the operating system with an external network to implement communications between them.
- the communication port 250 includes an FTP port, an HTTP port, or a DNS port.
- the input/output port 260 is configured to exchange and control data and information between an external device or a circuit and the processor 220.
- the input/output port 260 includes a USB port, a PCI port, an IDE port, or the like.
- the hard disk 270 is configured to store information and data generated by the tissue density analysis device 120, or information and data received from outside the tissue density analysis device 120.
- the hard disk 270 includes a mechanical hard disk (HDD), a solid-state hard disk (SSD), or a hybrid hard disk (HHD).
- the display 280 is configured display information and data generated by the tissue density analysis system 100 to the user.
- the display 280 includes a physical display, such as a display with a speaker, an LCD display, an LED display, an OLED display, an electronic ink display (E-Ink), or the like.
- FIG. 3 is a schematic diagram illustrating an exemplary mobile device for implementing one or more specific systems in the present disclosure according to some embodiments of the present disclosure.
- the mobile device 300 includes a terminal device 140.
- the user receives or transmit information related to the tissue density analysis system 100 via the mobile device 300.
- the mobile device 300 includes a smartphone, a personal digital assistant (PDA), a tablet computer, a handheld game player, smart glasses, a smart watch, a wearable device, a virtual reality device, a display enhancement device, or the like, or any combination thereof.
- PDA personal digital assistant
- the mobile device 300 includes one or more central processors (CPUs) 340, one or more image processors (GPUs) 330, a display 320, a memory 360, one or more communication modules 310, a storage 390, and one or more input/output devices 350.
- the one or more communication modules 310 is configured in the mobile device 300, or connected to the mobile device 300 as a removable external device.
- the mobile device 300 also includes a system bus, a controller, or the like.
- the central processor 340 downloads the mobile device operating system (e.g., iOS, Android, Windows Phone, etc.) 370 and one or more applications 380 from the storage 390 into the memory 360.
- the mobile device operating system e.g., iOS, Android, Windows Phone, etc.
- the one or more applications 380 includes a web page or other mobile application software (App) for receiving and transmitting information related to the tissue density analysis system 100.
- the user obtains or provide information via the input/output device 350.
- the information is transmitted to the tissue density analysis system 100, or a device unit in the tissue density analysis system 100.
- the computer hardware platform is used as a hardware platform for one or more components (e.g., the tissue density analysis system 100 and a portion thereof), to implement their functions.
- the hardware components, the operating systems, and the programming languages are inherently traditional, and those skilled in the art applies these techniques to tissue density analysis.
- a computer with a user interface is a personal computer (PC), other workstations or terminal devices.
- a programmed computer serves as a server. Since those skilled in the art are familiar with the structure, programming and general operations of the computer used in the present disclosure, detailed explanations are not repeated herein.
- FIG. 4 is a schematic diagram illustrating an exemplary tissue density analysis device according to some embodiments of the present disclosure.
- the tissue density analysis device 120 includes an acquisition module 410, a display module 420, a processing module 430, and a storage module 440. Connections between modules in the tissue density analysis device 120 is wired, wireless, or a combination thereof. The module is local, remote, or a combination thereof.
- the acquisition module 410 is configured to obtain image data.
- the acquisition module 410 obtains image data from the imaging device 110, the storage device 130, the storage module 440, or outside of the tissue density analysis system 100.
- the function of the acquisition module 410 is implemented by the processor 220 in FIG. 2 .
- the acquisition module 410 obtains original image data, digitized image data, an image model, an operational instruction, or the like, from the imaging device 110.
- the acquisition module 410 obtains standard tissue density analysis image data, partial tissue density analysis image data, or the like, from the storage device 130 or the storage module 440.
- the acquisition module 410 obtains standard tissue density analysis image data, image data that requires tissue density analysis, image data after tissue density analysis, or the like, from outside of the tissue density analysis system 100.
- the image data is a head image, a chest image, an abdominal image, a pelvic image, a perineal image, a limb image, a spine image, a vertebral image, or the like, including a lesion tissue.
- the image data includes, but is not limited to, an omnidirectional digitized image, a digitized tomogram, a phase contrast map, computed radiography (CR) image, a multimodal image, or the like.
- an image including a tissue or a lesion is referred to as a medical image or an image.
- the image data includes pixel information, a CT value of each point in the image, a volume represented by each point in the image, an initial density interval and a volume distribution of the tissue to be analyzed, or the like.
- the acquisition module 410 sends the obtained image data to the display module 420, the processing module 430, or the storage module 440.
- the acquisition module 410 sends the obtained image data to the display module 420 for display.
- the acquisition module 410 sends the obtained image data to the processing module 430 for tissue density analysis or processing.
- the acquisition module 410 sends the obtained image data to the storage module 440 for storage.
- the acquisition module 410 receives a data acquisition instruction from the processor 220 and complete a corresponding data acquisition operation.
- the display module 420 is configured to display a target tissue or lesion in obtained image data.
- the function of the display module 420 is implemented by the display 280 in FIG. 2 .
- the display module 420 displays the medical image of the target tissue and a corresponding CT value bar chart simultaneously.
- the CT value bar chart represents a range of CT values.
- the CT value bar chart includes one or more sliders.
- the one or more sliders divide the CT values into one or more CT intervals or density segmentations.
- the one or more CT intervals is represented by one or more color bars or grayscale bars.
- the color bar is a line segment represented by one color, for example, red, orange, yellow, green, blue, purple, black, white, or the like.
- the grayscale bar is a line segment represented by black, white, or a transition color from black to white.
- the display module 420 displays a medical image of the target tissue, a CT value bar chart, a histogram, and/or a table corresponding to the target tissue, simultaneously.
- the histogram is associated with the target tissue and the CT value bar chart.
- the histogram represents a volume distribution of regions having different CT values in the target tissue.
- the table is associated with the target tissue, the CT value bar and the histogram.
- the table represents volumes and volume percentages of different CT intervals in the target tissue.
- the medical image, the histogram, and the table of the target tissue is divided into one or more regions according to one or more CT intervals of the CT value bar chart.
- the display module 420 represents a CT interval in one color.
- a color of a region representing a CT interval in the medical image, the histogram, and the table of the target tissue is consistent with a color representing the CT interval in the CT value bar chart.
- the color of the data strip in a CT interval in the histogram is consistent with the color of the color bar in the corresponding section in the CT value bar chart.
- the medical image of the target tissue, the CT value bar chart, the histogram, and/or the table representing the CT interval distribution on the medical image of the target tissue is displayed on different display interfaces in different combinations.
- the different display interfaces include a tiled display or an overlapping display.
- the processing module 430 is configured to adjust a density segmentation or a CT interval.
- the processing module 430 also is configured to determine a volume and a volume percentage of at least one CT interval.
- the processing module 430 adjusts the division of the CT interval by adjusting one or more sliders in the CT value bar chart. For example, the processing module 430 modifies one or more CT intervals, adds one or more CT intervals, or deletes one or more CT intervals.
- the processing module 430 determines and adjusts image data representing different CT intervals in the histogram and/or the table according to an adjustment result of the CT interval on the CT value bar chart.
- the image data in the CT value bar chart, the histogram, and/or the table is adjusted or changed simultaneously, such that the data in each chart corresponds to each other. For example, if the CT intervals on the CT value bar chart change from two intervals to three intervals, the processing module 430 divides data in the histogram into three parts, and/or adjust data in the table to three groups. In some embodiments, the processing module 430 determines a volume and a volume percentage corresponding to each section after the CT interval adjustment according to the image data obtained by the acquisition module 410 and the CT value bar chart.
- the image data includes a CT value of each point in the image, a volume represented by each point in the image, an initial density interval and a volume distribution of the tissue to be analyzed, or the like.
- the processing module 430 determines different colors for different CT intervals.
- the colors include, but are not limited to, red, orange, yellow, green, blue, purple, black, white, or the like.
- a CT value bar chart have two CT intervals represented by yellow and purple color bars, respectively.
- the processing module 430 determines a color different from the colors of the other two CT intervals, e.g., green, for the added CT interval in the CT value bar chart, the histogram, and/or the table.
- a CT value bar chart has four CT intervals represented by pink, blue, orange, and white color bars, respectively.
- the processing module 430 determines other colors for the four CT intervals in the histogram, and/or the table corresponding to the CT value bar chart, e.g., red, gold, purple, and yellow, respectively. In some embodiments, the processing module 430 adjusts the background color of the displayed page. In some embodiments, the processing module 430 adjusts the arrangement of the CT image of the target tissue, the CT value bar chart, the histogram, and/or the table representing the CT interval distribution on the medical image of the target tissue. The arrangement includes a left-right juxtaposition arrangement, an upper and lower juxtaposition arrangement, a wraparound arrangement centered on the medical image of the target tissue, or the like, or any combination thereof.
- the processing module 430 adjusts the arrangement of the medical image, the CT value bar chart, the histogram, and/or the table from the left-right juxtaposition arrangement to the upper and lower juxtaposition arrangement.
- the arrangement refers to an arrangement in any order.
- the CT value bar chart, the medical image, the histogram, and/or the table is arranged from left to right successively.
- the table, the histogram, the CT value bar chart, and the medical image is arranged from upper to lower successively.
- the processing module 430 sends the processed image data to the display module 420 for display, or to the storage module 440 for storage.
- the storage module 440 is configured to store image data or operational instructions.
- the function of the storage module 440 is implemented by the hard disk 270, the read only memory 230, the random-access memory 240 shown in FIG. 2 , or the like, or any combination thereof.
- the storage module 440 stores image data and/or operation instructions obtained by the acquisition module 410, real time data generated by the processing module 430, processed image data, or the like.
- the operational instructions include a volume and/or volume percentage algorithm, a permutation algorithm, a color configuration algorithm, or the like.
- the storage module 440 includes, but not limited to, various types of storage devices such as a solid-state hard disk, a mechanical hard disk, a USB flash memory, an SD memory card, an optical disk, a random-access memory (RAM), or a read only memory (ROM).
- the storage module 440 is a storage device included in the system, or an external storage device of the system, such as a storage on a cloud storage server.
- tissue density analysis device 120 is merely provided for the purposes of illustration, and not intended to limit the scope of the present disclosure.
- the modules are combined in any way.
- the modules form a subsystem and are connected to other modules.
- the acquisition module 410 and the display module 420 are integrated into a single module.
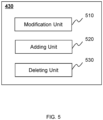
- the modification unit 510 is configured to modify a density segmentation or a CT interval.
- the modification unit 510 modifies the CT interval by moving a slider on the CT value bar chart. For example, the modification unit 510 moves the slider left and right via a mouse, a screen touch, a voice, or the like.
- the modification unit 510 modifies the CT interval by modifying the CT value corresponding to the slider on the CT value bar chart.
- the CT value corresponding to the slider is displayed above the CT value bar chart or the slider.
- the CT value corresponding to the slider is displayed below the CT value bar chart or the slider. As shown in FIG.
- the CT value above the CT value bar chart or the slider is reasonably arranged to avoid a layout problem includes threshold information overlaps or a densely arrangement due to a small segmentation or CT interval.
- the modification unit 510 modifies the CT interval to a new CT interval by clicking or double-clicking the CT value corresponding to a slider on the CT value bar chart and inputting the new CT value.
- the modification unit 510 adjusts the CT interval on the CT value bar chart by modifying the CT value or the CT interval in the table.
- the modification unit 510 determines and adjusts image data representing different CT intervals in the histogram and/or the table according to the modified CT interval.
- the image data includes volumes and/or volume percentages, or the like, of different CT intervals in the tissue to be analyzed.
- the modification unit 510 adjusts colors of different CT intervals.
- a CT value bar chart has three CT intervals represented by blue, green, and orange color bars, respectively.
- the modification unit 510 adjusts the colors of the corresponding three CT intervals in the CT value bar chart, the histogram, and/or the table to white, purple, and gold, respectively.
- the modification unit 510 adjusts an arrangement of the medical image of the target tissue, the CT value bar chart, the histogram, and/or the table.
- the modification unit 510 arranges the CT value bar chart, the histogram, and/or the table in an upper and lower juxtaposition arrangement.
- the modification unit 510 arranges the medical image of the target tissue, and the CT value bar chart, the histogram, and/or the table in a left-right juxtaposition arrangement.
- the modification unit 510 adjusts this arrangement to a wraparound arrangement centered on the medical image of the target tissue.
- the CT value bar chart, the histogram, and the table are arranged on an upper side, a left side, and a right side of the medical image of the target tissue.
- the adding unit 520 is configured to add a density segmentation or a CT interval.
- the adding unit 520 adds a CT interval on the CT value bar chart.
- the adding unit 520 adds a CT interval by clicking or double clicking a point on the CT value bar chart.
- the adding unit 520 determines a CT value of the CT interval by sliding the slider left and right.
- the adding unit 520 clicks or double clicks a point on the CT value bar chart, and modify a CT value corresponding to the point, to add a new CT interval.
- the adding unit 520 adds a CT interval by voice.
- the adding unit 520 determines and adjust image data representing different CT intervals in the histogram and/or the table based on the adjusted CT intervals.
- the image data includes volumes and/or volume percentages of different CT intervals in the tissue to be analyzed, or the like.
- the adding unit 520 determines a color for a newly added CT interval.
- a CT value bar chart has two CT intervals represented by orange and blue color bars, respectively.
- the adding unit 520 determines a color for the newly added CT interval on the CT value bar chart, the histogram, and/or the table. The color is different from the colors of the two CT intervals, such as white.
- the deleting unit 530 deletes a density segmentation or a CT interval. In some embodiments, the deleting unit 530 deletes one or more CT intervals from the CT value bar chart. For example, the deleting unit 530 deletes a CT segment value corresponding to a slider by moving a slider up and down. Therefore, two CT intervals including the CT segment value are adjusted to one CT interval. The up and down movement is implemented by a mouse, a screen touch, or the like. The CT segment value is any CT value between two endpoints of the CT value bar chart. As another example, the deleting unit 530 deletes one or more CT intervals by modifying a CT segment value to be deleted to a CT segment value to be reserved.
- 722 corresponds to 716 in the CT value bar chart 750 and a region between 719 and 718 in the histogram 760.
- 723 represents that a volume of a region with CT values between -333 and -119 is 11 mm 3 , and a volume percentage in the tissue density analysis region 701 is 19%.
- 723 corresponds to 715 in the CT value bar chart 750, and a region between 718 and 720 in the histogram 760.
- 724 represents that the tissue density analysis region 701 does not include a region with CT values between -119 and 0. 724 corresponds to 714 in the CT value bar chart 750, and a region between 720 and 707 in the histogram 760.
Landscapes
- Engineering & Computer Science (AREA)
- Health & Medical Sciences (AREA)
- Medical Informatics (AREA)
- Life Sciences & Earth Sciences (AREA)
- Physics & Mathematics (AREA)
- Radiology & Medical Imaging (AREA)
- General Health & Medical Sciences (AREA)
- Nuclear Medicine, Radiotherapy & Molecular Imaging (AREA)
- Public Health (AREA)
- Theoretical Computer Science (AREA)
- General Physics & Mathematics (AREA)
- Computer Vision & Pattern Recognition (AREA)
- Surgery (AREA)
- Animal Behavior & Ethology (AREA)
- Optics & Photonics (AREA)
- Biomedical Technology (AREA)
- Heart & Thoracic Surgery (AREA)
- Molecular Biology (AREA)
- High Energy & Nuclear Physics (AREA)
- Veterinary Medicine (AREA)
- Biophysics (AREA)
- Pathology (AREA)
- Epidemiology (AREA)
- Primary Health Care (AREA)
- Quality & Reliability (AREA)
- Human Computer Interaction (AREA)
- Physiology (AREA)
- Pulmonology (AREA)
- Oral & Maxillofacial Surgery (AREA)
- Dentistry (AREA)
- Apparatus For Radiation Diagnosis (AREA)
Claims (11)
- System (100) zur Gewebedichteanalyse, umfassend:ein Erfassungsmodul (410), das dazu konfiguriert ist, Bilddaten und Gewebedichteverteilungsdaten eines Zielgewebes zu erhalten, wobei die Gewebedichteverteilungsdaten auf den Bilddaten basierende CT-Werte beinhalten;ein Anzeigemodul (420), das dazu konfiguriert ist:die Bilddaten anzuzeigen; unddie Gewebedichteverteilungsdaten in einer Vielzahl von Diagrammen anzuzeigen, die Dichtesegmentierungen beinhalten, wobei die Vielzahl von Diagrammen ein CT-Wert-Balkendiagramm (750), ein Histogramm (760) und eine Tabelle (770) beinhaltet, wobei das Histogramm (760) eine Volumenverteilung von Bereichen mit unterschiedlichen CT-Werten im Zielgewebe darstellt und die Tabelle (770) Volumina und Volumenanteile der Dichtesegmentierungen darstellt; undein Verarbeitungsmodul (430), das dazu konfiguriert ist:
basierend auf mindestens einem von einer Anmerkung, einem Klick, einem Doppelklick oder einer Spracheingabe die in der Vielzahl von Diagrammen angezeigten Gewebedichteverteilungsdaten durch Anpassen mindestens eines Teils der Dichtesegmentierungen zu verarbeiten, beinhaltend:Anpassen einer Aufteilung der Dichtesegmentierungen durch Anpassen eines oder mehrerer Schieberegler im CT-Wert-Balkendiagramm (750); undAnpassen der Dichtesegmentierungen im Histogramm (760) und/oder der Tabelle (770) entsprechend einem Anpassungsergebnis der Dichtesegmentierungen des CT-Wert-Balkendiagramms (750), wobeidie Volumina und die Volumenanteile in der Tabelle (770) basierend auf den angepassten Dichtesegmentierungen neu bestimmt werden; undAnpassen der Bilddaten basierend auf dem Anpassungsergebnis des mindestens einen Teils der Dichtesegmentierungen;wobei das Anzeigemodul (420) weiter dazu konfiguriert ist, die angepassten Bilddaten und die verarbeiteten Gewebedichteverteilungsdaten anzuzeigen. - System nach Anspruch 1, wobei das Verarbeitungsmodul (430) weiter dazu konfiguriert ist:
den mindestens einen Teil der Dichtesegmentierungen über einen oder mehrere Schwellenwerte für die Gewebedichtesegmentierung anzupassen. - System nach Anspruch 2, wobei das Verarbeitungsmodul (430) weiter dazu konfiguriert ist:
mit dem mindestens einen der Anmerkung, des Klicks, des Doppelklicks oder der Spracheingabe einen Schwellenwert für die Gewebedichtesegmentierung zu ändern, einen Schwellenwert für die Gewebedichtesegmentierung hinzuzufügen und/oder einen Schwellenwert für die Gewebedichtesegmentierung zu löschen. - System nach einem der Ansprüche 1 bis 3, wobei das Verarbeitungsmodul (430) weiter dazu konfiguriert ist:
die Gewebedichteverteilungsdaten in der Vielzahl von Diagrammen gleichzeitig entsprechend dem Anpassungsergebnis zu aktualisieren. - System nach Anspruch 4, wobei das Verarbeitungsmodul (430) weiter dazu
konfiguriert ist:
mindestens eines von Farb- oder Statistikdaten einer selben Dichtesegmentierung in der Vielzahl von Diagrammen gleichzeitig entsprechend dem Anpassungsergebnis zu aktualisieren. - Verfahren zur Gewebedichteanalyse, umfassend:Erhalten von Bilddaten und Gewebedichteverteilungsdaten eines Zielgewebes, wobei die Gewebedichteverteilungsdaten auf den Bilddaten basierende CT-Werte beinhalten;Anzeigen der Bilddaten; undAnzeigen der Gewebedichteverteilungsdaten in einer Vielzahl von Diagrammen, die Dichtesegmentierungen beinhalten, wobei die Vielzahl von Diagrammen ein CT-Wert-Balkendiagramm (750), ein Histogramm (760) und eine Tabelle (770) beinhaltet, wobei das Histogramm (760) eine Volumenverteilung von Bereichen mit unterschiedlichen CT-Werten im Zielgewebe darstellt, und die Tabelle (770) Volumina und Volumenanteile der Dichtesegmentierungen darstellt;Verarbeiten der in der Vielzahl von Diagrammen angezeigten Gewebedichteverteilungsdaten basierend auf mindestens einem von einer Anmerkung, einem Klick, einem Doppelklick oder einer Spracheingabe durch Anpassen mindestens eines Teils der Dichtesegmentierungen, beinhaltend:Anpassen einer Aufteilung der Dichtesegmentierungen durch Anpassen eines oder mehrerer Schieberegler im CT-Wert-Balkendiagramm (750); undAnpassen der Dichtesegmentierungen im Histogramm (760) und/oder der Tabelle (770) entsprechend einem Anpassungsergebnis der Dichtesegmentierungen des CT-Wert-Balkendiagramms (750), wobeidie Volumina und die Volumenanteile in der Tabelle (770) basierend auf den angepassten Dichtesegmentierungen neu bestimmt werden;Anpassen der Bilddaten basierend auf dem Anpassungsergebnis des mindestens einen Teils der Dichtesegmentierungen; undAnzeigen der angepassten Bilddaten und der verarbeiteten Gewebedichteverteilungsdaten.
- Verfahren nach Anspruch 6, wobei Anpassen mindestens eines Teils der Dichtesegmentierungen basierend auf mindestens einem von einer Anmerkung, einem Klick, einem Doppelklick oder einer Spracheingabe Folgendes umfasst:
Anpassen des mindestens einen Teils der Dichtesegmentierungen durch einen oder mehrere Schwellenwerte für die Gewebedichtesegmentierung. - Verfahren nach Anspruch 7, wobei Anpassen eines oder mehrerer Schwellenwerte für die Gewebedichtesegmentierung umfasst:
Ändern eines Schwellenwerts für die Gewebedichtesegmentierung, Hinzufügen eines Schwellenwerts für die Gewebedichtesegmentierung und/oder Löschen eines Schwellenwerts für die Gewebedichtesegmentierung mit dem mindestens einen der Anmerkung, des Klicks, des Doppelklicks oder der Spracheingabe. - Verfahren nach einem der Ansprüche 6 bis 8, weiter umfassend:
gleichzeitiges Aktualisieren der Gewebedichteverteilungsdaten in der Vielzahl von Diagrammen entsprechend dem Anpassungsergebnis. - Verfahren nach Anspruch 9, weiter umfassend:
gleichzeitiges Aktualisieren von mindestens einem von Farb- oder Statistikdaten einer selben Dichtsegmentierung in der Vielzahl von Diagrammen entsprechend dem Anpassungsergebnis. - Nichtflüchtiges computerlesbares Medium, das ein Computerprogrammprodukt speichert, wobei das Computerprogrammprodukt Anweisungen beinhaltet, die dazu konfiguriert sind:Bilddaten und Gewebedichteverteilungsdaten eines Zielgewebes zu erhalten, wobei die Gewebedichteverteilungsdaten auf den Bilddaten basierende CT-Werte beinhalten;die Bilddaten anzuzeigen;die Gewebedichteverteilungsdaten in einer Vielzahl von Diagrammen anzuzeigen, die Dichtesegmentierungen beinhalten, wobei die Vielzahl von Diagrammen ein CT-Wert-Balkendiagramm (750), ein Histogramm (760) und eine Tabelle (770) beinhaltet, wobei das Histogramm (760) eine Volumenverteilung von Bereichen mit unterschiedlichen CT-Werten im Zielgewebe darstellt und die Tabelle (770) Volumina und Volumenanteile der Dichtesegmentierungen darstellt;basierend auf mindestens einem von einer Anmerkung, einem Klick, einem Doppelklick oder einer Spracheingabe die in der Vielzahl von Diagrammen angezeigten Gewebedichteverteilungsdaten durch Anpassen mindestens eines Teils der Dichtesegmentierungen zu verarbeiten, beinhaltend:Anpassen einer Aufteilung der Dichtesegmentierungen durch Anpassen eines oder mehrerer Schieberegler im CT-Wert-Balkendiagramm (750); undAnpassen der Dichtesegmentierungen im Histogramm (760) und/oder der Tabelle (770) entsprechend einem Anpassungsergebnis der Dichtesegmentierungen des CT-Wert-Balkendiagramms (750), wobeidie Volumina und die Volumenanteile in der Tabelle (770) basierend auf den angepassten Dichtesegmentierungen neu bestimmt werden;Anpassen der Bilddaten basierend auf dem Anpassungsergebnis des mindestens einen Teils der Dichtesegmentierungen; undAnzeigen der angepassten Bilddaten und der verarbeiteten Gewebedichteverteilungsdaten.
Applications Claiming Priority (1)
| Application Number | Priority Date | Filing Date | Title |
|---|---|---|---|
| PCT/CN2017/091226 WO2019000418A1 (zh) | 2017-06-30 | 2017-06-30 | 组织密度分析方法及系统 |
Publications (3)
| Publication Number | Publication Date |
|---|---|
| EP3633603A1 EP3633603A1 (de) | 2020-04-08 |
| EP3633603A4 EP3633603A4 (de) | 2020-06-17 |
| EP3633603B1 true EP3633603B1 (de) | 2025-05-07 |
Family
ID=64740821
Family Applications (1)
| Application Number | Title | Priority Date | Filing Date |
|---|---|---|---|
| EP17916087.4A Active EP3633603B1 (de) | 2017-06-30 | 2017-06-30 | Verfahren und system zur analyse der gewebedichte |
Country Status (3)
| Country | Link |
|---|---|
| US (2) | US11664112B2 (de) |
| EP (1) | EP3633603B1 (de) |
| WO (1) | WO2019000418A1 (de) |
Families Citing this family (1)
| Publication number | Priority date | Publication date | Assignee | Title |
|---|---|---|---|---|
| US11131842B2 (en) * | 2020-03-02 | 2021-09-28 | Tencent America LLC | Method and apparatus for displaying information ring and augmented reality display for microscope |
Citations (1)
| Publication number | Priority date | Publication date | Assignee | Title |
|---|---|---|---|---|
| JP2003102723A (ja) * | 2001-09-27 | 2003-04-08 | Ge Medical Systems Global Technology Co Llc | 医療用画像表示装置、及びその制御方法 |
Family Cites Families (43)
| Publication number | Priority date | Publication date | Assignee | Title |
|---|---|---|---|---|
| US5734384A (en) * | 1991-11-29 | 1998-03-31 | Picker International, Inc. | Cross-referenced sectioning and reprojection of diagnostic image volumes |
| US5978696A (en) * | 1997-10-06 | 1999-11-02 | General Electric Company | Real-time image-guided placement of anchor devices |
| JP3453085B2 (ja) * | 1998-07-23 | 2003-10-06 | ジーイー横河メディカルシステム株式会社 | X線ct装置 |
| US6711433B1 (en) * | 1999-09-30 | 2004-03-23 | Siemens Corporate Research, Inc. | Method for providing a virtual contrast agent for augmented angioscopy |
| US20030132936A1 (en) * | 2001-11-21 | 2003-07-17 | Kevin Kreeger | Display of two-dimensional and three-dimensional views during virtual examination |
| US6898263B2 (en) * | 2002-11-27 | 2005-05-24 | Ge Medical Systems Global Technology Company, Llc | Method and apparatus for soft-tissue volume visualization |
| US7529339B2 (en) * | 2003-12-12 | 2009-05-05 | University Of Western Ontario | Method and system for optimizing dose delivery of radiation |
| US7446769B2 (en) * | 2004-02-10 | 2008-11-04 | International Business Machines Corporation | Tightly-coupled synchronized selection, filtering, and sorting between log tables and log charts |
| CN100589760C (zh) * | 2004-11-26 | 2010-02-17 | 株式会社东芝 | X射线ct装置和图像处理装置 |
| US20060164418A1 (en) * | 2005-01-25 | 2006-07-27 | Hao Ming C | Method and system for automated visualization using common scale |
| CN1891155A (zh) * | 2006-05-26 | 2007-01-10 | 北京思创贯宇科技开发有限公司 | 一种基于ct图像的组织成分分析方法 |
| JP5139441B2 (ja) * | 2006-11-30 | 2013-02-06 | コーニンクレッカ フィリップス エレクトロニクス エヌ ヴィ | 血管構造の可視化 |
| DK2108166T3 (da) * | 2007-02-02 | 2013-09-23 | Exxonmobil Upstream Res Co | Modellering og udformning af et brøndboresystem, der udligner vibrationer |
| US8321781B2 (en) * | 2007-02-08 | 2012-11-27 | Microsoft Corporation | User interface pane for an interactive chart |
| US8806321B2 (en) * | 2007-06-26 | 2014-08-12 | Oracle International Corporation | Interactive controls and information visualization using histogram equalization |
| CN100456325C (zh) * | 2007-08-02 | 2009-01-28 | 宁波大学 | 一种医学图像窗口参数的自适应调整方法 |
| JP5304986B2 (ja) | 2008-03-31 | 2013-10-02 | 株式会社日立メディコ | 超音波診断装置 |
| US8406493B2 (en) * | 2008-07-17 | 2013-03-26 | The Henry M. Jackson Foundation For The Advancement Of Military Medicine, Inc. | Multi-grayscale overlay window |
| US20100205007A1 (en) * | 2009-02-06 | 2010-08-12 | Indu Rekha Meesa | Method of Pathologic Correlation for Radiology Resident Education |
| EP2233065B8 (de) * | 2009-03-23 | 2015-11-25 | Nidek Co., Ltd. | Ophthalmische Beobachtungsvorrichtung |
| JP5436076B2 (ja) * | 2009-07-14 | 2014-03-05 | キヤノン株式会社 | 画像処理装置、画像処理方法およびプログラム |
| JP4691732B1 (ja) * | 2010-07-30 | 2011-06-01 | 国立大学法人 岡山大学 | 組織抽出システム |
| US20120108960A1 (en) * | 2010-11-03 | 2012-05-03 | Halmann Menachem Nahi | Method and system for organizing stored ultrasound data |
| US9412414B2 (en) * | 2011-02-16 | 2016-08-09 | Apple Inc. | Spatial conform operation for a media-editing application |
| JP2013099520A (ja) * | 2011-10-14 | 2013-05-23 | Toshiba Corp | X線コンピュータ断層撮像装置、医用画像処理装置、及び医用画像処理方法 |
| CN104105445B (zh) * | 2012-08-30 | 2017-06-16 | 东芝医疗系统株式会社 | X射线ct装置、图像处理装置以及图像处理方法 |
| US9396395B2 (en) * | 2012-09-07 | 2016-07-19 | Hitachi Medical Corporation | Image processing apparatus and image processing method, configured to apply threshold conditions to specify target pixel |
| EP2929327B1 (de) * | 2012-12-05 | 2019-08-14 | Perimeter Medical Imaging, Inc. | System und verfahren für oct-bildgebung mit breitem feld |
| CN104583982B (zh) * | 2012-12-11 | 2017-03-22 | 威尔森信息通信株式会社 | 医疗支援系统及其方法 |
| EP2830018A1 (de) * | 2013-07-25 | 2015-01-28 | Statlife | Computerimplementiertes Verfahren zur Klassifizierung eines Bildes |
| JP6354979B2 (ja) * | 2014-03-31 | 2018-07-11 | 株式会社ニデック | 眼底撮影装置 |
| CO7020178A1 (es) * | 2014-05-14 | 2014-08-11 | Leon Ricardo Antonio Mendoza | Método para la segmentación y cuantificación automática de tejidos corporales |
| JP6632267B2 (ja) * | 2015-09-04 | 2020-01-22 | キヤノン株式会社 | 眼科装置、表示制御方法およびプログラム |
| US20170086766A1 (en) * | 2015-09-30 | 2017-03-30 | Curvebeam Llc | System for assessing bone fusion |
| TWI632479B (zh) * | 2016-11-30 | 2018-08-11 | 財團法人金屬工業研究發展中心 | 醫學影像建模系統以及醫學影像建模方法 |
| US10169851B2 (en) * | 2017-05-02 | 2019-01-01 | Color Enhanced Detection, Llc | Methods for color enhanced detection of bone density from CT images and methods for opportunistic screening using same |
| US10152571B1 (en) * | 2017-05-25 | 2018-12-11 | Enlitic, Inc. | Chest x-ray differential diagnosis system |
| CN107392893A (zh) * | 2017-06-30 | 2017-11-24 | 上海联影医疗科技有限公司 | 组织密度分析方法及系统 |
| US10403011B1 (en) * | 2017-07-18 | 2019-09-03 | Palantir Technologies Inc. | Passing system with an interactive user interface |
| US10657410B2 (en) * | 2018-04-13 | 2020-05-19 | Siemens Healthcare Gmbh | Method and system for abnormal tissue detection using z-scores in a joint histogram |
| US11615508B2 (en) * | 2020-02-07 | 2023-03-28 | GE Precision Healthcare LLC | Systems and methods for consistent presentation of medical images using deep neural networks |
| US20230351586A1 (en) * | 2020-07-06 | 2023-11-02 | Exini Diagnostics Ab | Systems and methods for artificial intelligence-based image analysis for detection and characterization of lesions |
| EP4235569B1 (de) * | 2022-02-28 | 2025-09-24 | Optos plc | Vorverarbeitung von oct-b-scans für die oct-angiographie |
-
2017
- 2017-06-30 EP EP17916087.4A patent/EP3633603B1/de active Active
- 2017-06-30 WO PCT/CN2017/091226 patent/WO2019000418A1/zh not_active Ceased
-
2019
- 2019-12-30 US US16/729,601 patent/US11664112B2/en active Active
-
2023
- 2023-03-10 US US18/181,591 patent/US12062427B2/en active Active
Patent Citations (1)
| Publication number | Priority date | Publication date | Assignee | Title |
|---|---|---|---|---|
| JP2003102723A (ja) * | 2001-09-27 | 2003-04-08 | Ge Medical Systems Global Technology Co Llc | 医療用画像表示装置、及びその制御方法 |
Also Published As
| Publication number | Publication date |
|---|---|
| US11664112B2 (en) | 2023-05-30 |
| US20200135329A1 (en) | 2020-04-30 |
| EP3633603A4 (de) | 2020-06-17 |
| WO2019000418A1 (zh) | 2019-01-03 |
| US12062427B2 (en) | 2024-08-13 |
| US20230215545A1 (en) | 2023-07-06 |
| EP3633603A1 (de) | 2020-04-08 |
Similar Documents
| Publication | Publication Date | Title |
|---|---|---|
| US12002131B2 (en) | Image color adjustment method and system | |
| Cheng et al. | Contour-aware semantic segmentation network with spatial attention mechanism for medical image | |
| Yao et al. | Virtual elastography ultrasound via generative adversarial network for breast cancer diagnosis | |
| US11462316B2 (en) | Systems and methods for evaluating medical image | |
| CN111430012B (zh) | 使用实时边缘感知刷来半自动地分割3d医学图像的系统和方法 | |
| US10366494B2 (en) | Image segmentation method and electronic device therefor | |
| CN112529834A (zh) | 病理图像模式在3d图像数据中的空间分布 | |
| CN111462115B (zh) | 医学图像显示方法、装置和计算机设备 | |
| WO2021135774A1 (zh) | 肿瘤预测方法、装置、云平台及计算机可读存储介质 | |
| US20250156676A1 (en) | Machine learning-based automated abnormality detection in medical images and presentation thereof | |
| CN111951272B (zh) | 脑部影像的分割方法、装置、计算机设备和可读存储介质 | |
| US20210391078A1 (en) | Deep learning model learning device and method for cancer region | |
| US20190005648A1 (en) | Method and system for determining a volume of interest | |
| CN103337074A (zh) | 一种基于主动轮廓模型分割乳腺dce-mri病灶的方法 | |
| CN111489318B (zh) | 医学图像增强方法和计算机可读存储介质 | |
| US20200320778A1 (en) | System and method for image processing | |
| CN114332132A (zh) | 图像分割方法、装置和计算机设备 | |
| KR102565222B1 (ko) | 유방 종괴 검출에 대한 정보 제공 방법 및 이를 이용한 디바이스 | |
| CN107392893A (zh) | 组织密度分析方法及系统 | |
| AU2019430369B2 (en) | VRDS 4D medical image-based vein Ai endoscopic analysis method and product | |
| Yang et al. | Improving diagnostic precision in thyroid nodule segmentation from ultrasound images with a self-attention mechanism-based Swin U-Net model | |
| US12062427B2 (en) | Method and system for tissue density analysis | |
| CN114783591A (zh) | 一种脑肿瘤三维可视化辅助诊断系统 | |
| Yang et al. | Multi-class semantic segmentation of breast tissues from MRI images using U-Net based on Haar wavelet pooling | |
| Abdel-Wahab et al. | Deep learning framework for breast cancer detection and segmentation using EfficientNet and U-Net with hyperparameter optimization |
Legal Events
| Date | Code | Title | Description |
|---|---|---|---|
| STAA | Information on the status of an ep patent application or granted ep patent |
Free format text: STATUS: THE INTERNATIONAL PUBLICATION HAS BEEN MADE |
|
| PUAI | Public reference made under article 153(3) epc to a published international application that has entered the european phase |
Free format text: ORIGINAL CODE: 0009012 |
|
| STAA | Information on the status of an ep patent application or granted ep patent |
Free format text: STATUS: REQUEST FOR EXAMINATION WAS MADE |
|
| 17P | Request for examination filed |
Effective date: 20191231 |
|
| AK | Designated contracting states |
Kind code of ref document: A1 Designated state(s): AL AT BE BG CH CY CZ DE DK EE ES FI FR GB GR HR HU IE IS IT LI LT LU LV MC MK MT NL NO PL PT RO RS SE SI SK SM TR |
|
| AX | Request for extension of the european patent |
Extension state: BA ME |
|
| REG | Reference to a national code |
Ref country code: DE Ref legal event code: R079 Free format text: PREVIOUS MAIN CLASS: G06T0007000000 Ipc: G16H0030000000 |
|
| A4 | Supplementary search report drawn up and despatched |
Effective date: 20200514 |
|
| RIC1 | Information provided on ipc code assigned before grant |
Ipc: G06T 7/00 20170101ALI20200508BHEP Ipc: A61B 6/00 20060101ALI20200508BHEP Ipc: G16H 30/00 20180101AFI20200508BHEP Ipc: G16H 30/40 20180101ALI20200508BHEP Ipc: G06T 7/11 20170101ALI20200508BHEP |
|
| DAV | Request for validation of the european patent (deleted) | ||
| DAX | Request for extension of the european patent (deleted) | ||
| STAA | Information on the status of an ep patent application or granted ep patent |
Free format text: STATUS: EXAMINATION IS IN PROGRESS |
|
| 17Q | First examination report despatched |
Effective date: 20230404 |
|
| REG | Reference to a national code |
Ref country code: DE Ref legal event code: R079 Free format text: PREVIOUS MAIN CLASS: G16H0030000000 Ipc: G16H0030400000 Ref country code: DE Ref legal event code: R079 Ref document number: 602017089397 Country of ref document: DE Free format text: PREVIOUS MAIN CLASS: G16H0030000000 Ipc: G16H0030400000 |
|
| GRAP | Despatch of communication of intention to grant a patent |
Free format text: ORIGINAL CODE: EPIDOSNIGR1 |
|
| STAA | Information on the status of an ep patent application or granted ep patent |
Free format text: STATUS: GRANT OF PATENT IS INTENDED |
|
| RIC1 | Information provided on ipc code assigned before grant |
Ipc: G06T 7/00 20170101ALI20250113BHEP Ipc: A61B 6/46 20240101ALI20250113BHEP Ipc: G16H 30/20 20180101ALI20250113BHEP Ipc: G16H 30/40 20180101AFI20250113BHEP |
|
| INTG | Intention to grant announced |
Effective date: 20250127 |
|
| GRAS | Grant fee paid |
Free format text: ORIGINAL CODE: EPIDOSNIGR3 |
|
| GRAA | (expected) grant |
Free format text: ORIGINAL CODE: 0009210 |
|
| STAA | Information on the status of an ep patent application or granted ep patent |
Free format text: STATUS: THE PATENT HAS BEEN GRANTED |
|
| AK | Designated contracting states |
Kind code of ref document: B1 Designated state(s): AL AT BE BG CH CY CZ DE DK EE ES FI FR GB GR HR HU IE IS IT LI LT LU LV MC MK MT NL NO PL PT RO RS SE SI SK SM TR |
|
| REG | Reference to a national code |
Ref country code: GB Ref legal event code: FG4D |
|
| REG | Reference to a national code |
Ref country code: CH Ref legal event code: EP |
|
| REG | Reference to a national code |
Ref country code: DE Ref legal event code: R096 Ref document number: 602017089397 Country of ref document: DE |
|
| REG | Reference to a national code |
Ref country code: IE Ref legal event code: FG4D |
|
| PGFP | Annual fee paid to national office [announced via postgrant information from national office to epo] |
Ref country code: DE Payment date: 20250617 Year of fee payment: 9 |
|
| PGFP | Annual fee paid to national office [announced via postgrant information from national office to epo] |
Ref country code: GB Payment date: 20250616 Year of fee payment: 9 |
|
| PGFP | Annual fee paid to national office [announced via postgrant information from national office to epo] |
Ref country code: FR Payment date: 20250616 Year of fee payment: 9 |
|
| REG | Reference to a national code |
Ref country code: NL Ref legal event code: MP Effective date: 20250507 |
|
| PG25 | Lapsed in a contracting state [announced via postgrant information from national office to epo] |
Ref country code: FI Free format text: LAPSE BECAUSE OF FAILURE TO SUBMIT A TRANSLATION OF THE DESCRIPTION OR TO PAY THE FEE WITHIN THE PRESCRIBED TIME-LIMIT Effective date: 20250507 Ref country code: ES Free format text: LAPSE BECAUSE OF FAILURE TO SUBMIT A TRANSLATION OF THE DESCRIPTION OR TO PAY THE FEE WITHIN THE PRESCRIBED TIME-LIMIT Effective date: 20250507 Ref country code: PT Free format text: LAPSE BECAUSE OF FAILURE TO SUBMIT A TRANSLATION OF THE DESCRIPTION OR TO PAY THE FEE WITHIN THE PRESCRIBED TIME-LIMIT Effective date: 20250908 |
|
| REG | Reference to a national code |
Ref country code: LT Ref legal event code: MG9D |
|
| PG25 | Lapsed in a contracting state [announced via postgrant information from national office to epo] |
Ref country code: GR Free format text: LAPSE BECAUSE OF FAILURE TO SUBMIT A TRANSLATION OF THE DESCRIPTION OR TO PAY THE FEE WITHIN THE PRESCRIBED TIME-LIMIT Effective date: 20250808 Ref country code: NO Free format text: LAPSE BECAUSE OF FAILURE TO SUBMIT A TRANSLATION OF THE DESCRIPTION OR TO PAY THE FEE WITHIN THE PRESCRIBED TIME-LIMIT Effective date: 20250807 |
|
| PG25 | Lapsed in a contracting state [announced via postgrant information from national office to epo] |
Ref country code: PL Free format text: LAPSE BECAUSE OF FAILURE TO SUBMIT A TRANSLATION OF THE DESCRIPTION OR TO PAY THE FEE WITHIN THE PRESCRIBED TIME-LIMIT Effective date: 20250507 Ref country code: NL Free format text: LAPSE BECAUSE OF FAILURE TO SUBMIT A TRANSLATION OF THE DESCRIPTION OR TO PAY THE FEE WITHIN THE PRESCRIBED TIME-LIMIT Effective date: 20250507 |
|
| REG | Reference to a national code |
Ref country code: AT Ref legal event code: MK05 Ref document number: 1793422 Country of ref document: AT Kind code of ref document: T Effective date: 20250507 |
|
| PG25 | Lapsed in a contracting state [announced via postgrant information from national office to epo] |
Ref country code: BG Free format text: LAPSE BECAUSE OF FAILURE TO SUBMIT A TRANSLATION OF THE DESCRIPTION OR TO PAY THE FEE WITHIN THE PRESCRIBED TIME-LIMIT Effective date: 20250507 |
|
| PG25 | Lapsed in a contracting state [announced via postgrant information from national office to epo] |
Ref country code: HR Free format text: LAPSE BECAUSE OF FAILURE TO SUBMIT A TRANSLATION OF THE DESCRIPTION OR TO PAY THE FEE WITHIN THE PRESCRIBED TIME-LIMIT Effective date: 20250507 |
|
| PG25 | Lapsed in a contracting state [announced via postgrant information from national office to epo] |
Ref country code: AT Free format text: LAPSE BECAUSE OF FAILURE TO SUBMIT A TRANSLATION OF THE DESCRIPTION OR TO PAY THE FEE WITHIN THE PRESCRIBED TIME-LIMIT Effective date: 20250507 |
|
| PG25 | Lapsed in a contracting state [announced via postgrant information from national office to epo] |
Ref country code: RS Free format text: LAPSE BECAUSE OF FAILURE TO SUBMIT A TRANSLATION OF THE DESCRIPTION OR TO PAY THE FEE WITHIN THE PRESCRIBED TIME-LIMIT Effective date: 20250807 |
|
| PG25 | Lapsed in a contracting state [announced via postgrant information from national office to epo] |
Ref country code: IS Free format text: LAPSE BECAUSE OF FAILURE TO SUBMIT A TRANSLATION OF THE DESCRIPTION OR TO PAY THE FEE WITHIN THE PRESCRIBED TIME-LIMIT Effective date: 20250907 |
|
| PG25 | Lapsed in a contracting state [announced via postgrant information from national office to epo] |
Ref country code: LV Free format text: LAPSE BECAUSE OF FAILURE TO SUBMIT A TRANSLATION OF THE DESCRIPTION OR TO PAY THE FEE WITHIN THE PRESCRIBED TIME-LIMIT Effective date: 20250507 |
|
| PG25 | Lapsed in a contracting state [announced via postgrant information from national office to epo] |
Ref country code: DK Free format text: LAPSE BECAUSE OF FAILURE TO SUBMIT A TRANSLATION OF THE DESCRIPTION OR TO PAY THE FEE WITHIN THE PRESCRIBED TIME-LIMIT Effective date: 20250507 Ref country code: SM Free format text: LAPSE BECAUSE OF FAILURE TO SUBMIT A TRANSLATION OF THE DESCRIPTION OR TO PAY THE FEE WITHIN THE PRESCRIBED TIME-LIMIT Effective date: 20250507 |
|
| PG25 | Lapsed in a contracting state [announced via postgrant information from national office to epo] |
Ref country code: CZ Free format text: LAPSE BECAUSE OF FAILURE TO SUBMIT A TRANSLATION OF THE DESCRIPTION OR TO PAY THE FEE WITHIN THE PRESCRIBED TIME-LIMIT Effective date: 20250507 |
|
| PG25 | Lapsed in a contracting state [announced via postgrant information from national office to epo] |
Ref country code: EE Free format text: LAPSE BECAUSE OF FAILURE TO SUBMIT A TRANSLATION OF THE DESCRIPTION OR TO PAY THE FEE WITHIN THE PRESCRIBED TIME-LIMIT Effective date: 20250507 |
|
| PG25 | Lapsed in a contracting state [announced via postgrant information from national office to epo] |
Ref country code: SK Free format text: LAPSE BECAUSE OF FAILURE TO SUBMIT A TRANSLATION OF THE DESCRIPTION OR TO PAY THE FEE WITHIN THE PRESCRIBED TIME-LIMIT Effective date: 20250507 Ref country code: RO Free format text: LAPSE BECAUSE OF FAILURE TO SUBMIT A TRANSLATION OF THE DESCRIPTION OR TO PAY THE FEE WITHIN THE PRESCRIBED TIME-LIMIT Effective date: 20250507 |
|
| REG | Reference to a national code |
Ref country code: CH Ref legal event code: H13 Free format text: ST27 STATUS EVENT CODE: U-0-0-H10-H13 (AS PROVIDED BY THE NATIONAL OFFICE) Effective date: 20260127 |
|
| PG25 | Lapsed in a contracting state [announced via postgrant information from national office to epo] |
Ref country code: IT Free format text: LAPSE BECAUSE OF FAILURE TO SUBMIT A TRANSLATION OF THE DESCRIPTION OR TO PAY THE FEE WITHIN THE PRESCRIBED TIME-LIMIT Effective date: 20250507 |
|
| REG | Reference to a national code |
Ref country code: DE Ref legal event code: R097 Ref document number: 602017089397 Country of ref document: DE |
|
| PG25 | Lapsed in a contracting state [announced via postgrant information from national office to epo] |
Ref country code: LU Free format text: LAPSE BECAUSE OF NON-PAYMENT OF DUE FEES Effective date: 20250630 |
|
| PG25 | Lapsed in a contracting state [announced via postgrant information from national office to epo] |
Ref country code: MC Free format text: LAPSE BECAUSE OF FAILURE TO SUBMIT A TRANSLATION OF THE DESCRIPTION OR TO PAY THE FEE WITHIN THE PRESCRIBED TIME-LIMIT Effective date: 20250507 |
|
| REG | Reference to a national code |
Ref country code: BE Ref legal event code: MM Effective date: 20250630 |
|
| PLBE | No opposition filed within time limit |
Free format text: ORIGINAL CODE: 0009261 |
|
| STAA | Information on the status of an ep patent application or granted ep patent |
Free format text: STATUS: NO OPPOSITION FILED WITHIN TIME LIMIT |
|
| REG | Reference to a national code |
Ref country code: CH Ref legal event code: L10 Free format text: ST27 STATUS EVENT CODE: U-0-0-L10-L00 (AS PROVIDED BY THE NATIONAL OFFICE) Effective date: 20260318 |
|
| PG25 | Lapsed in a contracting state [announced via postgrant information from national office to epo] |
Ref country code: IE Free format text: LAPSE BECAUSE OF NON-PAYMENT OF DUE FEES Effective date: 20250630 |
|
| 26N | No opposition filed |
Effective date: 20260210 |
|
| PG25 | Lapsed in a contracting state [announced via postgrant information from national office to epo] |
Ref country code: BE Free format text: LAPSE BECAUSE OF NON-PAYMENT OF DUE FEES Effective date: 20250630 |
|
| PG25 | Lapsed in a contracting state [announced via postgrant information from national office to epo] |
Ref country code: CH Free format text: LAPSE BECAUSE OF NON-PAYMENT OF DUE FEES Effective date: 20250630 |