EP3841650B1 - Éolienne et procédé pour détecter des oscillations de basse fréquence dans un réseau d'alimentation électrique - Google Patents
Éolienne et procédé pour détecter des oscillations de basse fréquence dans un réseau d'alimentation électrique Download PDFInfo
- Publication number
- EP3841650B1 EP3841650B1 EP19758725.6A EP19758725A EP3841650B1 EP 3841650 B1 EP3841650 B1 EP 3841650B1 EP 19758725 A EP19758725 A EP 19758725A EP 3841650 B1 EP3841650 B1 EP 3841650B1
- Authority
- EP
- European Patent Office
- Prior art keywords
- frequency
- test
- angle
- series
- measurements
- Prior art date
- Legal status (The legal status is an assumption and is not a legal conclusion. Google has not performed a legal analysis and makes no representation as to the accuracy of the status listed.)
- Active
Links
Images


Classifications
-
- G—PHYSICS
- G01—MEASURING; TESTING
- G01R—MEASURING ELECTRIC VARIABLES; MEASURING MAGNETIC VARIABLES
- G01R19/00—Arrangements for measuring currents or voltages or for indicating presence or sign thereof
- G01R19/25—Arrangements for measuring currents or voltages or for indicating presence or sign thereof using digital measurement techniques
- G01R19/2513—Arrangements for monitoring electric power systems, e.g. power lines or loads; Logging
-
- G—PHYSICS
- G01—MEASURING; TESTING
- G01R—MEASURING ELECTRIC VARIABLES; MEASURING MAGNETIC VARIABLES
- G01R23/00—Arrangements for measuring frequencies; Arrangements for analysing frequency spectra
- G01R23/16—Spectrum analysis; Fourier analysis
- G01R23/177—Analysis of very low frequencies
-
- H—ELECTRICITY
- H02—GENERATION; CONVERSION OR DISTRIBUTION OF ELECTRIC POWER
- H02J—ELECTRIC POWER NETWORKS; CIRCUIT ARRANGEMENTS OR SYSTEMS FOR SUPPLYING OR DISTRIBUTING ELECTRIC POWER; SYSTEMS FOR STORING ELECTRIC ENERGY
- H02J3/00—Circuit arrangements for AC mains or AC distribution networks
- H02J3/001—Arrangements for handling faults or abnormalities, e.g. emergencies or contingencies
- H02J3/0012—Arrangements for handling faults or abnormalities, e.g. emergencies or contingencies characterised by the contingency detection means in AC networks, e.g. using phasor measurement units [PMU], synchrophasors or contingency analysis
-
- H—ELECTRICITY
- H02—GENERATION; CONVERSION OR DISTRIBUTION OF ELECTRIC POWER
- H02J—ELECTRIC POWER NETWORKS; CIRCUIT ARRANGEMENTS OR SYSTEMS FOR SUPPLYING OR DISTRIBUTING ELECTRIC POWER; SYSTEMS FOR STORING ELECTRIC ENERGY
- H02J3/00—Circuit arrangements for AC mains or AC distribution networks
- H02J3/001—Arrangements for handling faults or abnormalities, e.g. emergencies or contingencies
- H02J3/0014—Arrangements for handling faults or abnormalities, e.g. emergencies or contingencies for preventing or reducing power oscillations in networks
- H02J3/00142—Oscillations concerning frequency
-
- H—ELECTRICITY
- H02—GENERATION; CONVERSION OR DISTRIBUTION OF ELECTRIC POWER
- H02J—ELECTRIC POWER NETWORKS; CIRCUIT ARRANGEMENTS OR SYSTEMS FOR SUPPLYING OR DISTRIBUTING ELECTRIC POWER; SYSTEMS FOR STORING ELECTRIC ENERGY
- H02J3/00—Circuit arrangements for AC mains or AC distribution networks
- H02J3/38—Arrangements for feeding a single network from two or more generators or sources in parallel; Arrangements for feeding already energised networks from additional generators or sources in parallel
- H02J3/381—Dispersed generators
-
- H—ELECTRICITY
- H02—GENERATION; CONVERSION OR DISTRIBUTION OF ELECTRIC POWER
- H02J—ELECTRIC POWER NETWORKS; CIRCUIT ARRANGEMENTS OR SYSTEMS FOR SUPPLYING OR DISTRIBUTING ELECTRIC POWER; SYSTEMS FOR STORING ELECTRIC ENERGY
- H02J2101/00—Supply or distribution of decentralised, dispersed or local electric power generation
- H02J2101/20—Dispersed power generation using renewable energy sources
- H02J2101/28—Wind energy
-
- Y—GENERAL TAGGING OF NEW TECHNOLOGICAL DEVELOPMENTS; GENERAL TAGGING OF CROSS-SECTIONAL TECHNOLOGIES SPANNING OVER SEVERAL SECTIONS OF THE IPC; TECHNICAL SUBJECTS COVERED BY FORMER USPC CROSS-REFERENCE ART COLLECTIONS [XRACs] AND DIGESTS
- Y02—TECHNOLOGIES OR APPLICATIONS FOR MITIGATION OR ADAPTATION AGAINST CLIMATE CHANGE
- Y02E—REDUCTION OF GREENHOUSE GAS [GHG] EMISSIONS, RELATED TO ENERGY GENERATION, TRANSMISSION OR DISTRIBUTION
- Y02E10/00—Energy generation through renewable energy sources
- Y02E10/70—Wind energy
- Y02E10/76—Power conversion electric or electronic aspects
Definitions
- the present invention relates to a method for detecting low-frequency oscillations, in particular subsynchronous resonances, in an electrical supply network.
- the present invention also relates to a wind energy system, namely a wind turbine or a wind farm, for detecting low-frequency oscillations, in particular subsynchronous resonances, in an electrical supply network.
- oscillations namely oscillations of the energy system, which can also be referred to as "Power System Oscillations" (PSO).
- PSO Power System Oscillations
- Their causes can be very diverse, and a clear and simple example is the oscillation of two directly coupled synchronous generators of conventional power plants, which feed into the grid more than 100 kilometers apart, for example.
- a single synchronous generator directly connected to the electrical supply network may be caused to oscillate at its natural frequency due to a local excitation, such as a sudden power consumption of the connected loads.
- Conventional electrical supply networks regularly address such problems by providing stable control of the synchronous generators feeding directly into the electrical supply network. A high inertia of these synchronous generators, together with a physically caused and/or The damping behavior caused by the structural design of the respective generator regularly prevents such vibrations from occurring too strongly in conventional networks.
- renewable energy generators especially wind turbines or wind farms, do not inherently exhibit such properties. In particular, they have virtually no physical properties that can counteract such low-frequency oscillations or prevent them from occurring in the first place.
- any countermeasures may even worsen the current situation.
- detecting low-frequency oscillations can be difficult because they are initially superimposed with the comparatively low amplitude of the mains frequency, i.e., the 50 Hz or 60 Hz voltage signal in the electrical supply network. Particularly when measuring voltage in the electrical supply network, interference and/or noise must be expected.
- such low-frequency oscillations fluctuate regularly. Depending on the excitation, they may be weak, strong, or even non-existent.
- German Patent and Trademark Office has searched the following prior art in the priority application for this application: DE 37 33 555 A1 and US 4,031,462 A .
- the present invention is therefore based on the object of addressing at least one of the above-mentioned problems.
- a solution is to be proposed that enables the fastest possible detection of low-frequency vibrations while simultaneously being able to detect very low-frequency vibrations.
- an alternative solution to previously known solutions is to be proposed.
- a method according to claim 1 serves to detect low-frequency oscillations in an electrical supply network, in particular to detect subsynchronous resonances in an electrical supply network.
- the electrical supply network is assumed to have a mains voltage with a nominal network frequency, with the low-frequency oscillations to be detected preferably having a lower frequency than the nominal network frequency. Therefore, in particular, anything having a lower frequency than the nominal network frequency is referred to and considered as a low-frequency oscillation.
- a frequency of the low-frequency oscillations is assumed to be less than half the nominal network frequency.
- low-frequency vibrations can have values of 1 Hz or less. However, they can also reach up to five times the nominal network frequency. Low-frequency vibrations are defined here as vibrations with a frequency of no more than five times the nominal network frequency, preferably with a frequency that corresponds to the nominal network frequency. In particular, low-frequency vibrations The oscillation does not have a frequency that corresponds to a multiple of the nominal grid frequency. It should be noted that the investigation and consideration of low-frequency oscillations is primarily intended to investigate or ensure the system stability of the electrical supply grid. This differs from an assessment of the grid quality or signal quality of the voltage signal in the electrical supply grid, where harmonics, especially integer harmonics, are particularly important.
- the method proposes recording at least one measurement series comprising multiple measurement points over a measurement period in order to perform a frequency analysis based on this.
- the measurement series thus comprises multiple measurement points or measured values that are distributed over the measurement period or were recorded distributed over the measurement period.
- the grid variables recorded include, in particular, the grid voltage, a feed-in current fed into the electrical supply grid or a grid frequency.
- a time-dependent sinusoidal test function for the same measurement period.
- a sinusoidal test function can be provided as a function on a process computer. It is proposed that the test function be characterized by a test frequency and a test angle as the phase angle.
- the amplitude can also be specified; in practical implementation, however, normalization of the amplitude, for example, to the value 1, is usually considered.
- the peak value of the sinusoidal variable can therefore assume the value 1, for example, whereby the scaling can be known in the process computer.
- the measurement series is multiplied by the test function in such a way that the measurement series is multiplied by the test function for each measurement point in order to obtain a test product for each measurement point.
- a measured value for a measurement point in the measurement series is multiplied by the corresponding function value of the test function, and this process is repeated for each measurement point.
- the test function is specified accordingly for a period of time that corresponds to the measurement period, or the test function is determined for the measurement period.
- the multiplication then occurs for each point in time during the measurement period for which a measured value is available. This measured value is then multiplied by the function value of the test function for the same point in time.
- test products are then added together to form a product sum, taking their signs into account. Negative test products are subtracted according to their absolute value. Each test product can have a negative sign if either the measured value or the function value in question was negative.
- test function and the measurement series are identical in frequency and phase, each test product will exhibit a positive value, and accordingly, the product sum will also be positive with a comparatively large amplitude.
- the measurement series then represents a function that corresponds to the test function.
- the test products would result in a sinusoidal function (incidentally, with twice the frequency for the test function) and without any DC component.
- the sum of the products would then be zero, at least if the test period corresponds to an integer multiple of the period of the signal under test.
- This phenomenon is known to electrical engineers as reactive power, when current and voltage are shifted by 90° to each other.
- the first example without a phase shift would correspond to a case with only real power.
- the result would be a sinusoidal signal with twice the frequency, shifted so strongly around the horizontal axis that just the smallest values of the sine function would touch the horizontal axis.
- This shift can also be understood or referred to as the DC component.
- the DC component would therefore be very high, in fact, at its highest.
- the product sum which can thus be interpreted as the DC component or can be representative of the DC component, can also serve as a measure of the correlation between the measurement series and the test function. If the measurement series and the test function are completely uncorrelated, the DC component becomes zero, at least theoretically for an infinite measurement period.
- the product sum is at least comparatively small if the measurement series and the test function are uncorrelated. If the test function correlates well and the phase angles of the measurement series and the test function match, a high DC component or a large product sum results. This allows the presence of a low-frequency oscillation to be determined based on frequency and phase. The low-frequency oscillation then has the frequency of the test function and the phase angle corresponding to the test angle of the test function.
- the amplitude of the low-frequency oscillation is preferably recorded, particularly as a function of the product sum. It has been particularly recognized that the amplitude can also be determined using the method for detecting a low-frequency oscillation based on frequency and phase.
- the method is carried out in such a way that the multiplication of the measurement series by the test function and the summation of the test products to form a product sum are repeated while varying the test frequency and the test angle in order to obtain multiple product sums.
- it is also advantageous to vary only the test frequency or the test angle but as long as neither the frequency of the low-frequency signal to be detected nor its phase is known, it is usually advantageous to vary the test frequency and test angle. If both values are varied, the result of the product sums can also be represented as a curved plane. The product sum would then be represented as a function of the test frequency and the test angle. This would result in a local maximum at the test frequency and test angle at which the best agreement between the measurement series and the test function exists.
- the multiplication of the measurement series by the test function and the summation of the test products to form a product sum be repeated while varying the test frequency and the test angle, so that a product sum is recorded for each test pair formed from a test frequency value and a test angle value.
- the recorded product sums can be represented as a curved surface in three-dimensional space depending on the test frequency values and the test angles, although they do not necessarily have to be represented.
- the test angle is preferably tested or varied from 0° to 360°. If necessary, it may be considered to test it only from 0° to 180° and, when searching for the maximum product sum, to search for the product sum with the maximum value.
- a low-frequency oscillation of a product sum in order to assume a low-frequency oscillation of a product sum, it is exclusively or additionally checked whether the product sum reaches at least a predetermined test amplitude. This is based in particular on the assumption that, based on practical implementation alone, a maximum product sum can be expected in every case if, as described, test frequencies and test angles are varied. This would then not yet be able to deduce that a low-frequency oscillation or a relevant low-frequency oscillation is actually present, because very small maxima can also be caused by measurement inaccuracies or other influences.
- Checking whether the product sum has reached at least a predetermined test amplitude also makes it possible to detect multiple low-frequency oscillations, if multiple low-frequency oscillations are present.
- checking for the achievement of a predetermined test amplitude can also detect a local maximum in this curved surface.
- a first test loop the multiplication of the measurement series by the test function and the addition of the test products are repeated while varying the test frequency.
- the test frequency is varied within a first frequency range in order to detect a low-frequency oscillation with an oscillation frequency.
- the oscillation frequency is initially recorded with a first accuracy.
- a second test loop the multiplication of the measurement series by the test function and the addition of the test products are repeated while varying the test frequency.
- the test frequency is then varied within a second frequency range during this repetition in the second test loop.
- the second frequency range is selected depending on the oscillation frequency detected in the first test loop in order to record the oscillation frequency with greater accuracy than in the first loop.
- the underlying idea here is that testing multiple test frequencies and multiple test angles can lead to a large number of tests. Therefore, it is proposed to install a first test loop that only varies the test frequency, possibly with a first frequency step size that is larger than a subsequent second frequency step size used in the second test loop. Such a first test loop should produce an initial peak in magnitude, at least near a frequency of a low-frequency oscillation.
- the range of this first peak can then be examined more precisely.
- the second frequency range is specified, which is smaller than the first frequency range. is, in particular, within the first frequency range.
- the test angle can then also be varied in this second test loop. This allows for high accuracy to be achieved without having to apply this high accuracy across the entire theoretical range resulting from the first frequency range and a complete 360° range for the test angle.
- the multiplication of the measurement series by the test function and the summation of the test products are repeated while varying the test angle.
- the test frequency and test angle are therefore varied.
- the test angle is varied within a first angular range, in particular in the range from 0° to 360°, which can preferably also be limited to 0° to 180° or another range comprising 180°. This is done in order to additionally detect the low-frequency oscillation using a phase angle of the oscillation.
- the sum of the products can have a small absolute value despite a good frequency match between the low-frequency oscillation and the test function if the phase angle and test angle deviate significantly. In this case, a low-frequency oscillation could be overlooked.
- the test angle be varied with a first angular increment, for example, in 5° increments.
- the multiplication of the measurement series by the test function and the summation of the test products are additionally repeated while varying the test angle, with the test angle being varied within a second angular range.
- This variation is preferably carried out with a second angular increment that is smaller than the first angular increment, for example, with a second angular increment of 1°.
- the second angular range is selected depending on the phase angle of the oscillation detected in the first test loop in order to detect the phase angle of the oscillation with greater accuracy than in the first loop.
- test frequency and the test angle in the first test loop thereby performing a first rough detection for at least one low-frequency oscillation, namely, to determine an approximate value of the frequency of the low-frequency oscillation and an approximate value of the phase angle of the low-frequency oscillation.
- the search can then be improved in a range around this frequency and angle by testing the test frequency and the test angle in a smaller frequency range and also a smaller angle range.
- the test frequency is varied in larger frequency steps than in the second test loop, and additionally or alternatively the test angle is varied in larger angular steps in the first test loop than in the second test loop.
- This allows a large frequency range to be tested in the first test loop with reasonable effort.
- a large angular range namely in particular the complete angular range from 0 to 360°, at least 0 to 180°, can also be tested.
- This allows an initial localization of a low-frequency oscillation to be carried out while still maintaining reasonable effort.
- a precise search with greater accuracy is then only required in the second test loop for a smaller range, namely both a smaller frequency range and a smaller angular range.
- the measurement period for analyzing a low-frequency frequency range be long, namely long enough that even the lowest frequency in the frequency range can still be detected. Accordingly, a shorter measurement period can be provided for a higher-frequency frequency range.
- the measurement times are further apart than with a shorter measurement period.
- a frequency range to be analyzed such as 0.1 Hz or below down to 50 Hz or even 250 Hz
- it is thus divided into a first and a second frequency range, and possibly into further frequency ranges.
- a series of measurements is recorded for each frequency range to be analyzed—i.e., to use the example, for the low-frequency range and the higher-frequency range. Therefore, two series of measurements are recorded for the above-mentioned example.
- the multiplication of the measurement series by the test function and the summation of the test products to a sum are then repeated, varying the test frequency and also or alternatively varying the test angle, in order to obtain multiple product sums for each measurement series. It is further proposed that for each measurement series, the product sums of the respective measurement series be evaluated to detect low-frequency vibration.
- the first frequency range which can also be referred to as the low-frequency frequency range
- the low-frequency frequency range can range from 0.02 to 2 Hz.
- a measurement period of at least 50 seconds should be used.
- the second frequency range which can also be referred to as the higher-frequency frequency range, could then range from 2 Hz to 250 Hz, for example.
- a measurement period of 0.2 seconds is sufficient even to record the lowest frequency of 2 Hz.
- a oscillation in such a second or higher-frequency frequency range can increase significantly within the 50-second test period of the first frequency range, in extreme cases even leading to a resonance catastrophe or at least a situation in which the amplitude of the low-frequency oscillation has become so large that initial damage can occur or the first shutdown processes can be initiated.
- the multiplication of the measurement series by the test function and the summation of the test products to a product sum be repeated under a specific variation of the test frequency.
- the test frequency is thereby varied in at least one frequency value having an upper and a lower frequency value.
- the frequency range is varied with a frequency step size, and the frequency step size is set as a function of the frequency range. This is done, in particular, such that the frequency step size is smaller than the lower frequency value, in particular smaller than 10% of the lower frequency value.
- the frequency step size be smaller than a predetermined percentage value, in particular that it be set smaller than 1%, in particular smaller than 0.2% of the upper frequency value.
- test frequency is varied across multiple frequency ranges, and the frequency step sizes of different frequency ranges are set differently from one another.
- each frequency step size is set greater than a predetermined percentage of the respective lower frequency value of the respective frequency range.
- the test frequency is therefore varied according to the respective frequency step size in the respective frequency range.
- the frequency step size is set depending on the frequency range and is particularly oriented towards the lowest frequency value of the respective frequency range. A percentage value based on the lower frequency value can be provided for this purpose.
- the frequency step size can also be based on the upper frequency value, although it is selected to be relatively much smaller in relation to the upper frequency value of the respective frequency range. In particular, this ensures that the variation of the test frequency is clearly specified and is selected differently for different frequency ranges. This means that the testing effort, namely due to the effort required for variation, can be adapted to the respective frequency range.
- the specifications also enable an automated test routine.
- Such a wind energy system can thus feed into the electrical grid and preferably also assumes support tasks to support the electrical grid.
- Such support tasks can become particularly necessary, or at least advantageous, when decentralized generators, such as such a wind energy system, feed a significant portion into the electrical grid or into a relevant section of the electrical grid.
- Various support tasks can arise, one of which may be responding to a low-frequency oscillation.
- a low-frequency oscillation is first detected, as precisely as possible according to frequency and phase, and if necessary also according to amplitude. Then it can be responded to.
- the wind energy system is prepared to implement at least one method according to the embodiments described above.
- the wind energy system comprises a process computer that is prepared to implement such a method.
- the method is implemented on the process computer. Implementing the method can include the recording of the measurement points or the measurement series or multiple measurement series being implemented by the process computer receiving corresponding values as measurement points or measured values and/or by the process computer controlling the recording means in order to thereby record the at least one measurement series.
- the recording device can, in particular, be a sensor that measures, for example, a voltage or a current.
- the multiplication unit can also be implemented in the same or a different process computer. The same applies to the addition unit, although these units can also form different device units.
- the evaluation device can also be implemented in one or the same process computer, or otherwise be provided as a separate element.
- Figure 1 shows a wind turbine 100 with a tower 102 and a nacelle 104.
- a rotor 106 with three rotor blades 108 and a spinner 110 is arranged on the nacelle 104.
- the rotor 106 is set into rotation by the wind and thereby drives a generator in the nacelle 104.
- FIG. 2 shows a wind farm 112 with, for example, three wind turbines 100, which may be identical or different.
- the three wind turbines 100 are thus representative of essentially any number of wind turbines in a wind farm 112.
- the wind turbines 100 provide their power, namely in particular the generated electricity, via an electrical farm grid 114.
- the currents or power generated by the individual wind turbines 100 are added together, and a transformer 116 is usually provided, which steps up the voltage in the farm and then feeds it into the supply grid 120 at the feed-in point 118, which is also generally referred to as a PCC.
- Figure 2 is only a simplified representation of a wind farm 112, which, for example, does not show a control system, although a control system is of course present.
- the farm network 114 can also be designed differently, for example, by also having a transformer at the output of each wind turbine 100, to name just one other embodiment.
- Both the wind turbine according to Figure 1 as well as the wind farm according to Figure 2 can each form a wind energy system.
- Figure 3 shows a flowchart 300 for recording multiple product sums.
- the signal to be examined is recorded and further initializations are performed.
- the signal to be examined can be a recorded time signal that is evenly sampled for examination in the flowchart 300 with the time steps ⁇ t.
- the signal to be examined can also already be present in such a sampled form; however, the time step size is advantageously selected here in order to also determine the total number of values to be examined.
- the measurement duration and thus the width of the measurement period is thus determined by t end .
- the following applies to time t: t 0 , 1 ⁇ ⁇ t , 2 ⁇ ⁇ t , ... , t end
- the frequency range to be examined can be defined in the start block 302, from a starting frequency f start to an end frequency f end .
- the control variable i is initialized for an outer loop 306.
- the frequency of iterations of this outer loop 306 corresponds to the frequency step number n, and this is checked accordingly in the first repetition query block 308, which follows the first increment block 310.
- the second initialization block 312 in which the control variable j is initialized for an inner loop 314. It is traversed according to the number of angular steps m, which is queried in the second repetition query 316, which follows the second increment block 318.
- a calculation block 320 is provided, which is run through (nxm) times.
- the reference frequency f ref is calculated, namely the frequency at which a summation product is calculated.
- ⁇ ref j ⁇ 2 ⁇ ⁇ / m
- the product sum is calculated.
- the signal to be examined, y(t), is multiplied by the sine function sin(2 ⁇ f ref t + ⁇ ref ) as a series of measurements, and the sum is calculated.
- a product is calculated for each point in time, and these products are summed. This can be done, for example, using a third innermost loop to illustrate it, in which time t runs up from 0 to t end , namely in time steps ⁇ t.
- the result is also normalized by multiplying by the time step ⁇ t and dividing by the end time t end , in such a way that the product sum DC prod is essentially independent of the time step ⁇ t.
- the product sum is therefore essentially independent of the number of summed products in terms of its absolute value.
- Figure 4 this block 400, namely the flowchart 400, and this builds on the flowchart 300 of the Figure 3 , which is indicated by the fact that the first block is designated as process block 300.
- the product sum with the largest value is selected from all the product sums calculated in the calculation block 320, namely Consideration of the sign. If, for simplification or reduction of effort, the test angle were varied not over 360°, but only over 180°—preferably, varying it only over 90° would also be considered—the largest value in terms of magnitude could also be sought here.
- the search is performed for all product sums that were specifically stored in a field, namely depending on the run through the outer loop 306 and the inner loop 314. These were run through with the outer control variable i and the inner control variable j, and these two control variables are then also used here to identify the maximum product sum, for example, in a data field. Accordingly, an assignment of these two control variables is made in the identification block 404; accordingly, the control variables i and j, for which the maximum product sum was found in the Max block 402, are identified as the selected outer and selected inner control variables i MaxDC and j MaxDC , respectively.
- These two selected control variables include the maximum value of the product sums detected in block 402, and this includes a reference frequency and a reference angle.
- the corresponding reference frequency and the corresponding reference angle can be calculated from the corresponding outer and inner control variables i, j, respectively.
- this frequency and angle it is assumed that this is the corresponding frequency of a low-frequency oscillation or the corresponding angle of a low-frequency oscillation, so that this assigned reference frequency is referred to as the frequency of the low-frequency oscillation f PSO , and the selected angle is referred to as the angle of the low-frequency oscillation ⁇ PSO .
- the frequency of the low-frequency oscillation f PSO and the angle of the low-frequency oscillation ⁇ PSO are calculated by substituting the corresponding selected control variables i MaxDC and j MaxDC for the respective external and internal control variables i and j, respectively.
- the angle of the low-frequency oscillation ⁇ PSO is given in radians, not degrees.
- an amplitude of the low-frequency oscillation A PSO can also be calculated, namely according to the equation:
- a PSO MaxDC / Summe sin 2 ⁇ ⁇ ⁇ f PSO ⁇ t + ⁇ PSO ⁇ sin 2 ⁇ ⁇ ⁇ f PSO ⁇ t + ⁇ PSO ⁇ ⁇ t / t end
- the amplitude of the low-frequency oscillation is thus determined by dividing the maximum product sum detected by a corresponding product sum of the reference signal multiplied by the reference signal for the entire time range under investigation.
- the product sum of the reference signal is thus determined by multiplying it by itself, which results in the maximum possible value because such a reference function is maximally correlated with itself. Thus, a factor remains for the less correlated product sum between the signal under investigation and the reference signal.
- This amplitude, A PSO is also a normalized value.
- the results can thus be output in the output block 408 and used further.
- Figure 5 illustrates in a three-dimensional representation 500 the totality of all product sums calculated in the calculation block 320 as a curved plane 502 as a function of the varied reference frequency f ref and the varied reference angle ⁇ ref .
- the reference frequency f ref can also be synonymously referred to as the test frequency
- the reference angle ⁇ ref can also be synonymously referred to as the test angle.
- a reference angle or test angle was varied from 0° to 360° and a reference frequency or test frequency was varied from 0 to 25 Hz. It can be seen that for frequencies that deviate significantly from this oscillation frequency of 8.25 Hz, the product sums plotted in the curved plane 502 essentially have the value 0. Near the oscillation frequency of 8.25 Hz, the amplitude increases in an oscillating manner towards the oscillation frequency.
- the reference angle or test angle also plays a major role.
- the absolute amplitude of the product sum is also maximum and accordingly the frequency of the low-frequency oscillation f PSO and the phase angle of the low-frequency oscillation ⁇ PSO can be read from the diagram or from the value field of the product sums.
- the flow chart of the Figure 3 and indirectly also the Figure 4 and also the diagram of the Figure 5 concern the case where the test frequency or reference frequency and also the test angle or reference angle were varied only once, each with many values, but without repeating the entire sequence of the outer and inner loop according to the flow chart 300 with new values.
- new values in the vicinity of the roughly identified maximum are determined in the start block 302, in particular based on the values for the frequency of the low-frequency oscillation f PSO and the phase angle of the low-frequency oscillation ⁇ PSO provided in the first run in the output block 408.
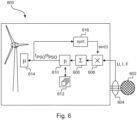
- Figure 6 shows a wind energy system 600, which is symbolically illustrated by a single wind turbine, but may also comprise multiple wind turbines. This system is configured to detect subsynchronous resonances in an electrical supply grid 602 into which this wind energy system 600 feeds.
- a recording means 604 is provided for recording at least one series of measurements of a grid variable, which can detect a grid voltage, an input current, or a grid frequency.
- the series of measurements thus recorded is sent to a multiplication unit 606, which can perform a multiplication by a test function sin(t).
- This test function sin(t) is mentioned only symbolically here and, as also described above, is more complex than such a sine function and can be varied at least with respect to some input variables.
- the result of this multiplication unit 606 is passed to an addition unit 608, in which the test products generated in the multiplication unit 606 are added to form a product sum.
- a product sum is the result of the addition unit 608, and this is passed to an evaluation device 610.
- the evaluation device searches for a maximum of all product sums received from the multiplication unit 606.
- a memory device 612 can be provided for receiving a data field, which is shown here as part of the evaluation device 610.
- the result of the evaluation device is, finally, if a low-frequency oscillation was found, its oscillation frequency f PSO and its phase angle ⁇ PSO .
- These values can then be further processed by another process computer 614, for example, to adjust the feed-in of the wind energy system 600 into the electrical supply grid 602 in such a way as to counteract such a detected oscillation.
- these two values i.e., the frequency and the phase angle of the low-frequency oscillation, can be fed back to a synthesis block 616, which generates the previously described test function, symbolically represented as sin(t), or adjusts it in a further loop. In particular, its input values are adjusted in the process.
- a well-known DFT method could be applied.
- a DFT method depending on the signal sampling rate, provides information over a broad frequency range, which is not necessarily useful.
- a DFT method for finer resolution in the frequency domain requires a correspondingly long time window in the time domain. It was recognized that the expected frequencies in the context of low-frequency oscillations are located in a limited frequency range and that this can be exploited, and other effective approaches that focus on such a limited frequency range can be helpful. It is also advantageous if corresponding approaches require a shorter time window.
- the invention is also based on the realization that energy systems are oscillatory systems that possess natural modes below and above the system frequency (50, 60 Hz). Upon excitation, such oscillations can impair system stability if they are not sufficiently damped.
- a new approach for detecting so-called power system oscillations (PSO) is proposed here. The goal is to achieve a possible, precise identification of the frequency, phase angle, and magnitude of power system oscillations (PSO) from a signal.
- PSO Power System Oscillations
- PSO power system oscillations
- the proposed method allows the identification of PSO (or other types of oscillations) and their main characteristics (frequency, phase angle and magnitude).
- the proposed method specifically aims to enable the precise identification of the frequency, phase angle, and magnitude of an oscillation in a measured signal using the shortest possible measurement window.
- the proposed approach is based on the principle that the DC component of the product of the signal under investigation with a sinusoidal reference signal at frequency f ref is only related to the component of the signal at frequency f ref . All other signal components that do not have the frequency of the reference signal are essentially averaged out, to put it simply.
- the underlying idea can be summarized as follows:
- the signal to be examined is multiplied by a sinusoidal reference signal.
- the phase angle of the reference signal is changed by m iterations in a loop over the entire range (0 to 2 ⁇ or 0° to 360°).
- the frequency of the reference signal is changed in another loop by n iterations in the frequency range to be examined (f start to f end ). This results in mxn products.
- the frequency and phase angle at which the DC component of the product is highest can be assumed to be the frequency and phase angle of the low-frequency oscillation.
- the magnitude of the low-frequency oscillation can also be determined. This process is essentially illustrated in Figures 3 and 4.
- n 1 and n 2 denote the first and second repetition numbers of the frequency variation loop, respectively.
- n 1 and m 2 denote the first and second repetition numbers of the phase angle variation loop, respectively.
- the number of spectral lines depends on the number of measurement points of the signal under investigation. With FFT, it is not possible to examine a subset of these spectral lines. In other words, there is no way to perform the FFT calculation for a limited frequency range. In contrast, the examination range for the frequency can be chosen arbitrarily with the proposed approach. Furthermore, it is possible to select the computational effort by selecting the examination resolution to match the available computing capacity.
Landscapes
- Engineering & Computer Science (AREA)
- Power Engineering (AREA)
- Physics & Mathematics (AREA)
- General Physics & Mathematics (AREA)
- Mathematical Physics (AREA)
- Measurement Of Mechanical Vibrations Or Ultrasonic Waves (AREA)
- Measuring Frequencies, Analyzing Spectra (AREA)
- Testing Electric Properties And Detecting Electric Faults (AREA)
Claims (11)
- Procédé d'identification d'oscillations de basse fréquence, en particulier de résonances sub-synchrones, dans un réseau d'alimentation électrique, dans lequel le réseau d'alimentation électrique présente une tension de réseau avec une fréquence nominale de réseau, comprenant les étapes- d'enregistrement d'au moins une série de mesures présentant plusieurs points de mesure d'une grandeur de réseau, en particulier de la tension de réseau, d'un courant d'injection ou d'une fréquence de réseau, sur un laps de temps de mesure pour effectuer une analyse de fréquence,- de multiplication de la série de mesures par une fonction de contrôle sinusoïdale dépendant du temps pour le même laps de temps de mesure, dans lequel- la fonction de contrôle se caractérise par une fréquence de contrôle et un angle de contrôle en tant qu'angle de phase, et- la série de mesures pour chaque point de mesure est multipliée par la fonction de contrôle pour obtenir, pour chaque point de mesure, un produit de contrôle,- d'addition des produits de contrôle, en tenant compte de leur signe, en une somme de produits, et- d'évaluation, en fonction de la somme de produits, si la série de mesures présente une oscillation de basse fréquence- avec une fréquence dans la plage de la fréquence de contrôle et- un angle de phase dans la plage de l'angle de contrôle.
- Procédé selon la revendication 1,
caractérisé en ce que- la multiplication de la série de mesures par la fonction de contrôle et l'addition des produits de contrôle en une somme de produits sont répétées en faisant varier la fréquence de contrôle et/ou en faisant varier l'angle de contrôle pour obtenir plusieurs sommes de produits, et- l'évaluation si la série de mesures présente une oscillation de basse fréquence en fonction est mise en œuvre en fonction des plusieurs sommes de produits obtenues, en particulier de telle sorte que- pour une somme de produits avec une amplitude maximale par rapport aux sommes de produits restantes, une oscillation de basse fréquence est enregistrée avec la fréquence et la phase de la fréquence de contrôle associée et de l'angle de contrôle associé, et/ou que- lors de l'identification d'une oscillation de basse fréquence, une amplitude de l'oscillation de basse fréquence est détectée, en particulier en fonction de la somme de produits. - Procédé selon la revendication 1 ou 2,
caractérisé en ce que- la multiplication de la série de mesures par la fonction de contrôle et l'addition des produits de contrôle en une somme de produits sont répétées en faisant varier la fréquence de contrôle et en faisant varier l'angle de contrôle si bien que- concernant chaque paire de contrôle formée à partir d'une valeur de fréquence de contrôle et d'une valeur de l'angle de phase, une somme de produits est enregistrée, dans lequel en particulier- les sommes de produits enregistrées peuvent être représentées dans l'espace tridimensionnel en tant que surface incurvée en fonction des valeurs de fréquence de contrôle et en fonction des angles de phase, et dans lequel- une valeur de fréquence de contrôle et un angle de contrôle d'une paire de contrôle, concernant laquelle la somme de produits forme un maximum par rapport aux sommes de produits enregistrées restantes, est adoptée en tant que fréquence et angle de phase d'une oscillation de basse fréquence. - Procédé selon l'une quelconque des revendications précédentes,
caractérisé en ce que
pour adopter une oscillation de basse fréquence d'une somme de produits, il est contrôlé exclusivement ou en supplément si la somme de produits atteint au moins une amplitude de contrôle prédéfinie. - Procédé selon l'une quelconque des revendications précédentes,
caractérisé en ce que- dans une première boucle de contrôle, la multiplication de la série de mesures par la fonction de contrôle et l'addition des produits de contrôle sont répétées en faisant varier la fréquence de contrôle, dans lequel- la fréquence de contrôle est variée dans une première plage de fréquences pour identifier une oscillation de basse fréquence avec une fréquence d'oscillation, dans lequel- la fréquence d'oscillation est détectée avec une première précision, et- dans une deuxième boucle de contrôle, la multiplication de la série de mesures par la fonction de contrôle et l'addition des produits de contrôle sont répétées en faisant varier la fréquence de contrôle, dans lequel- la fréquence de contrôle est variée dans une deuxième plage de fréquences, et- la deuxième plage de fréquences est choisie en fonction de la fréquence d'oscillation identifiée dans la première boucle de contrôle pour détecter la fréquence d'oscillation avec une précision plus élevée que dans la première boucle. - Procédé selon la revendication 5,
caractérisé en ce que- dans la première boucle de contrôle, la multiplication de la série de mesures par la fonction de contrôle et l'addition des produits de contrôle sont répétées en supplément en faisant varier l'angle de contrôle, dans lequel- l'angle de contrôle est varié dans une première plage d'angles, en particulier dans la plage de 0 à 360°, dans lequel- l'angle de contrôle est varié avec un premier incrément d'angle, et- dans la deuxième boucle de contrôle, la multiplication de la série de mesures par la fonction de contrôle et l'addition des produits de contrôle sont répétées en supplément en faisant varier l'angle de contrôle, dans lequel- l'angle de contrôle est varié dans une deuxième plage d'angles, en particulier avec un deuxième incrément d'angle, qui est inférieur au premier incrément d'angle, et- la deuxième plage d'angles est choisie en fonction de l'angle de phase de l'oscillation identifié dans la première boucle de contrôle pour détecter l'angle de phase de l'oscillation avec une précision plus élevée que dans la première boucle. - Procédé selon la revendication 5 ou 6,
caractérisé en ce que- dans la première boucle de contrôle, la fréquence de contrôle est variée en des incréments de fréquence plus importants que dans la deuxième boucle de contrôle, et/ou- dans la première boucle de contrôle, l'angle de contrôle est varié en des incréments d'angle plus importants que dans la deuxième boucle de contrôle. - Procédé selon l'une quelconque des revendications précédentes,
caractérisé en ce que- plusieurs séries de mesures de la grandeur de réseau, en particulier de la tension de réseau, du courant d'injection ou de la fréquence de réseau, sont enregistrées, dans lequel- chaque série de mesures est prévue pour analyser une plage de fréquences,- pour chaque série de mesures, un laps de temps de mesure est choisi en fonction de la plage de fréquences à analyser, et- pour chaque série de mesures, la multiplication de la série de mesures par la fonction de contrôle et l'addition des produits de contrôle en une somme de produits sont répétées en faisant varier la fréquence de contrôle et/ou en faisant varier l'angle de contrôle pour obtenir plusieurs sommes de produits pour chaque série de mesures, et- pour chaque série de mesures, respectivement les sommes de produits de la série de mesures concernée sont appréciées pour identifier une oscillation de basse fréquence. - Procédé selon l'une quelconque des revendications précédentes, caractérisé en ce que- la multiplication de la série de mesures par la fonction de contrôle et l'addition des produits de contrôle en une somme de produits sont répétées en faisant varier la fréquence de contrôle, dans lequel- la fréquence de contrôle est variée avec un incrément de fréquence dans au moins une plage de fréquences présentant une valeur de fréquence supérieure et une valeur de fréquence inférieure, et- l'incrément de fréquence est réglé en fonction de la plage de fréquences de telle sorte que- l'incrément de fréquence est inférieur à la valeur de fréquence inférieure, en particulier est inférieur à 10 % de la valeur de fréquence inférieure, et/ou que- l'incrément de fréquence est inférieur à une valeur prédéfinie en pourcentages, de préférence est inférieur à 1 %, en particulier est inférieur à 0,2 %, de la valeur de fréquence supérieure,- dans lequel de préférence la fréquence de contrôle est variée dans plusieurs plages de fréquences et les incréments de fréquence de différentes plages de fréquences sont réglés différemment les uns par rapport aux autres, dans lequel de préférence chaque incrément de fréquence est respectivement réglé de manière à être plus important qu'une partie en pourcentages prédéfinie de la valeur de fréquence inférieure respective de la plage de fréquences concernée.
- Système éolien, à savoir éolienne ou parc éolien, destiné à identifier des oscillations de basse fréquence, en particulier des résonances sub-synchrones, dans un réseau d'alimentation électrique, dans lequel le réseau d'alimentation électrique présente une tension de réseau avec une fréquence nominale de réseau, et le système éolien comprend- un moyen d'enregistrement destiné à enregistrer au moins une série de mesures présentant plusieurs points de mesure d'une grandeur de réseau, en particulier de la tension de réseau, d'un courant d'injection ou d'une fréquence de réseau, sur un laps de temps de mesure pour effectuer une analyse de fréquence,- une unité de multiplication destinée à multiplier la série de mesures par une fonction de contrôle sinusoïdale dépendant du temps pour le même laps de temps de mesure, dans lequel-- la fonction de contrôle se caractérise par une fréquence de contrôle et un angle de contrôle en tant qu'angle de phase, et-- la série de mesures est multipliée, pour chaque point de mesure, par la fonction de contrôle pour obtenir un produit de contrôle pour chaque point de mesure,- une unité d'addition destinée à additionner les produits de contrôle, en tenant compte de leur signe, en une somme de produits, et- un dispositif d'évaluation destiné à évaluer, en fonction de la somme de produits, si la série de mesures présente une oscillation de basse fréquence-- avec une fréquence dans la plage de la fréquence de contrôle et-- un angle de phase dans la plage de l'angle de contrôle.
- Système éolien selon la revendication 10, caractérisé en ce qu'il est préparé pour mettre en application un procédé selon l'une quelconque des revendications 1 à 9, dans lequel le système éolien présente de préférence en plus un calculateur de processus, sur lequel le procédé, au moins une partie de celui-ci, est mis en œuvre.
Priority Applications (1)
| Application Number | Priority Date | Filing Date | Title |
|---|---|---|---|
| EP25165679.9A EP4568047A3 (fr) | 2018-08-24 | 2019-08-23 | Eolienne et procéde pour détecter des oscillations de basse fréquence dans un réseau d'alimentation électrique |
Applications Claiming Priority (2)
| Application Number | Priority Date | Filing Date | Title |
|---|---|---|---|
| DE102018120768.9A DE102018120768A1 (de) | 2018-08-24 | 2018-08-24 | Windenergieanlage und Verfahren zum Erkennen niederfrequenter Schwingungen in einem elektrischen Versorgungsnetz |
| PCT/EP2019/072601 WO2020039077A1 (fr) | 2018-08-24 | 2019-08-23 | Éolienne et procédé pour détecter des oscillations de basse fréquence dans un réseau d'alimentation électrique |
Related Child Applications (1)
| Application Number | Title | Priority Date | Filing Date |
|---|---|---|---|
| EP25165679.9A Division EP4568047A3 (fr) | 2018-08-24 | 2019-08-23 | Eolienne et procéde pour détecter des oscillations de basse fréquence dans un réseau d'alimentation électrique |
Publications (3)
| Publication Number | Publication Date |
|---|---|
| EP3841650A1 EP3841650A1 (fr) | 2021-06-30 |
| EP3841650B1 true EP3841650B1 (fr) | 2025-03-26 |
| EP3841650C0 EP3841650C0 (fr) | 2025-03-26 |
Family
ID=67742438
Family Applications (2)
| Application Number | Title | Priority Date | Filing Date |
|---|---|---|---|
| EP19758725.6A Active EP3841650B1 (fr) | 2018-08-24 | 2019-08-23 | Éolienne et procédé pour détecter des oscillations de basse fréquence dans un réseau d'alimentation électrique |
| EP25165679.9A Pending EP4568047A3 (fr) | 2018-08-24 | 2019-08-23 | Eolienne et procéde pour détecter des oscillations de basse fréquence dans un réseau d'alimentation électrique |
Family Applications After (1)
| Application Number | Title | Priority Date | Filing Date |
|---|---|---|---|
| EP25165679.9A Pending EP4568047A3 (fr) | 2018-08-24 | 2019-08-23 | Eolienne et procéde pour détecter des oscillations de basse fréquence dans un réseau d'alimentation électrique |
Country Status (7)
| Country | Link |
|---|---|
| US (1) | US11899050B2 (fr) |
| EP (2) | EP3841650B1 (fr) |
| CN (1) | CN112602248A (fr) |
| CA (1) | CA3109200C (fr) |
| DE (1) | DE102018120768A1 (fr) |
| ES (1) | ES3031509T3 (fr) |
| WO (1) | WO2020039077A1 (fr) |
Families Citing this family (3)
| Publication number | Priority date | Publication date | Assignee | Title |
|---|---|---|---|---|
| CN111679125B (zh) * | 2020-06-04 | 2021-07-20 | 北京交通大学 | 一种电力系统振荡辨识的方法和装置 |
| EP3937328A1 (fr) * | 2020-07-10 | 2022-01-12 | Siemens Gamesa Renewable Energy A/S | Test d'un système électrique d'une éolienne |
| EP4170848A1 (fr) | 2021-10-20 | 2023-04-26 | Wobben Properties GmbH | Procédé d'amortissement des vibrations basse fréquence dans un réseau d'alimentation électrique |
Family Cites Families (11)
| Publication number | Priority date | Publication date | Assignee | Title |
|---|---|---|---|---|
| US4031462A (en) * | 1975-07-07 | 1977-06-21 | Motorola, Inc. | Frequency spectrum analyzer |
| CA1242484A (fr) * | 1985-11-20 | 1988-09-27 | Ecole Polytechnique | Methode et systeme de mesure de l'amplitude et de la phase des harmoniques dans un signal periodique |
| DE3733555A1 (de) * | 1987-10-03 | 1989-04-13 | Hartmann & Braun Ag | Verfahren zur messung der amplitude eines periodischen zeitabhaengigen elektrischen signales g(t) in einem signalgemisch u(t) |
| SE500683C2 (sv) | 1992-09-15 | 1994-08-08 | Asea Brown Boveri | Sätt och anordning för detektering och dämpning av svängningar vid eller nära en resonansbenägen frekvens i ett kraftöverföringssystem |
| US7508224B2 (en) * | 2006-04-07 | 2009-03-24 | Michael Lamar Williams | Method for measuring stability margin at a node of a polyphase power grid |
| RU2442180C1 (ru) * | 2010-10-07 | 2012-02-10 | Государственное образовательное учреждение высшего профессионального образования "Северо-Кавказский государственный технический университет" | Способ определения параметров гармоники несинусоидального электрического сигнала |
| KR20160037656A (ko) * | 2014-09-29 | 2016-04-06 | 삼성전자주식회사 | 에러 검출기 및 발진기의 에러 검출 방법 |
| CN104820164A (zh) * | 2015-04-14 | 2015-08-05 | 华南理工大学 | 一种电力系统低频振荡扰动源定位方法 |
| CN106841778B (zh) * | 2016-12-28 | 2020-02-04 | 国电南瑞科技股份有限公司 | 基于pmu实现的次同步和超同步谐波参数的处理方法 |
| US10983150B2 (en) * | 2017-08-28 | 2021-04-20 | General Electric Technology Gmbh | Systems and methods for detecting and evaluating oscillations in an electrical power grid |
| US11637428B2 (en) * | 2020-09-29 | 2023-04-25 | Mitsubishi Electric Power Products, Inc. | Selective power oscillation damping control system with damping ratio dynamic gain and method for the same |
-
2018
- 2018-08-24 DE DE102018120768.9A patent/DE102018120768A1/de not_active Withdrawn
-
2019
- 2019-08-23 ES ES19758725T patent/ES3031509T3/es active Active
- 2019-08-23 US US17/270,820 patent/US11899050B2/en active Active
- 2019-08-23 CA CA3109200A patent/CA3109200C/fr active Active
- 2019-08-23 WO PCT/EP2019/072601 patent/WO2020039077A1/fr not_active Ceased
- 2019-08-23 EP EP19758725.6A patent/EP3841650B1/fr active Active
- 2019-08-23 EP EP25165679.9A patent/EP4568047A3/fr active Pending
- 2019-08-23 CN CN201980055661.5A patent/CN112602248A/zh active Pending
Non-Patent Citations (1)
| Title |
|---|
| PENG SHUTAO ET AL: "The on-Line Monitoring of Time-Varying Amplitude and Frequency Characteristic of Sub-Synchronous Oscillation Based on Sliding Window FFT", 2018 CHINA INTERNATIONAL CONFERENCE ON ELECTRICITY DISTRIBUTION (CICED), IEEE, 17 September 2018 (2018-09-17), pages 1625 - 1630, XP033484121, DOI: 10.1109/CICED.2018.8592142 * |
Also Published As
| Publication number | Publication date |
|---|---|
| ES3031509T3 (en) | 2025-07-09 |
| CA3109200C (fr) | 2023-08-08 |
| WO2020039077A1 (fr) | 2020-02-27 |
| CN112602248A (zh) | 2021-04-02 |
| EP3841650C0 (fr) | 2025-03-26 |
| EP4568047A2 (fr) | 2025-06-11 |
| DE102018120768A1 (de) | 2020-02-27 |
| US11899050B2 (en) | 2024-02-13 |
| EP4568047A3 (fr) | 2025-08-13 |
| EP3841650A1 (fr) | 2021-06-30 |
| CA3109200A1 (fr) | 2020-02-27 |
| US20210341523A1 (en) | 2021-11-04 |
Similar Documents
| Publication | Publication Date | Title |
|---|---|---|
| EP3818608B1 (fr) | Procédé pour commander un parc éolien de manière à atténuer des oscillations sous-synchrones | |
| DE112018003079B4 (de) | Drehmaschinensystem-Diagnosevorrichtung, Leistungsumsetzvorrichtung, Drehmaschinensystem und Drehmaschinensystem-Diagnoseverfahren | |
| DE69818275T2 (de) | Qualitätsmessung der schweissung | |
| DE112014002494B4 (de) | Beschleunigungskompensation von Lastsensoren | |
| EP2769448B1 (fr) | Procédé d'alimentater un réseau en currant | |
| EP1537390B1 (fr) | Procede pour saisir des oscillations de la ligne d'arbres d'une machine electrique | |
| EP3841650B1 (fr) | Éolienne et procédé pour détecter des oscillations de basse fréquence dans un réseau d'alimentation électrique | |
| DE102013202261A1 (de) | Verfahren zum Überprüfen des Betriebs einer Windenergieanlage und Windenergieanlage | |
| EP3818613A1 (fr) | Procédé de détection d'oscillations à basse fréquence et dispositif de détection correspondant | |
| WO2020008036A1 (fr) | Système éolien et procédé pour détecter des oscillations de basse fréquence dans un réseau d'alimentation électrique | |
| DE102010053523A1 (de) | Verfahren zur Überwachung einer statischen und/oder dynamischen Stabilität einer Windenergieanlage | |
| DE102008017900A1 (de) | Verfahren zum Erfassen eines Fehlers in einer Drehfeldmaschine | |
| DE60221668T2 (de) | Verfahren zur überwachung eines hochspannungsnetzes | |
| EP2003759A1 (fr) | Procédé destiné à la détection de réseau pour île | |
| CH705536B1 (de) | Schaufelschwingungsmessvorrichtung. | |
| DE112018005613B4 (de) | Diagnosevorrichtung und diagnoseverfahren | |
| WO2016206876A1 (fr) | Procédé pour analyser un signal et dispositif pour mettre en œuvre le procédé | |
| DE112020007232T5 (de) | Motor-diagnosevorrichtung | |
| EP4170848A1 (fr) | Procédé d'amortissement des vibrations basse fréquence dans un réseau d'alimentation électrique | |
| EP1736664B1 (fr) | Procédé et arrangement permettant de mesurer une éolienne | |
| EP3252482B1 (fr) | Procede et dispositif de centre de controle destines a determiner un angle de phase d'une oscillation de puissance dans un reseau d'alimentation electrique | |
| DE102013218645B3 (de) | Verfahren und Anordnung zum Ermitteln der elektrischen Eigenschaften einer Windenergieanlage | |
| EP3766157A1 (fr) | Mesure d'harmoniques dans les réseaux électriques | |
| AT528537B1 (de) | Bestimmungsverfahren für eine Bestimmung eines DC-Stromwertes auf einer DC-Seite eines Inverters | |
| DE102019219689A1 (de) | Prüfverfahren zur Analyse eines elektrischen Prüfobjekts durch Analyse des eingehenden Stroms sowie entsprechende Prüfvorrichtung |
Legal Events
| Date | Code | Title | Description |
|---|---|---|---|
| STAA | Information on the status of an ep patent application or granted ep patent |
Free format text: STATUS: UNKNOWN |
|
| STAA | Information on the status of an ep patent application or granted ep patent |
Free format text: STATUS: THE INTERNATIONAL PUBLICATION HAS BEEN MADE |
|
| PUAI | Public reference made under article 153(3) epc to a published international application that has entered the european phase |
Free format text: ORIGINAL CODE: 0009012 |
|
| STAA | Information on the status of an ep patent application or granted ep patent |
Free format text: STATUS: REQUEST FOR EXAMINATION WAS MADE |
|
| 17P | Request for examination filed |
Effective date: 20210324 |
|
| AK | Designated contracting states |
Kind code of ref document: A1 Designated state(s): AL AT BE BG CH CY CZ DE DK EE ES FI FR GB GR HR HU IE IS IT LI LT LU LV MC MK MT NL NO PL PT RO RS SE SI SK SM TR |
|
| DAV | Request for validation of the european patent (deleted) | ||
| DAX | Request for extension of the european patent (deleted) | ||
| GRAP | Despatch of communication of intention to grant a patent |
Free format text: ORIGINAL CODE: EPIDOSNIGR1 |
|
| STAA | Information on the status of an ep patent application or granted ep patent |
Free format text: STATUS: GRANT OF PATENT IS INTENDED |
|
| INTG | Intention to grant announced |
Effective date: 20241104 |
|
| GRAS | Grant fee paid |
Free format text: ORIGINAL CODE: EPIDOSNIGR3 |
|
| GRAA | (expected) grant |
Free format text: ORIGINAL CODE: 0009210 |
|
| STAA | Information on the status of an ep patent application or granted ep patent |
Free format text: STATUS: THE PATENT HAS BEEN GRANTED |
|
| AK | Designated contracting states |
Kind code of ref document: B1 Designated state(s): AL AT BE BG CH CY CZ DE DK EE ES FI FR GB GR HR HU IE IS IT LI LT LU LV MC MK MT NL NO PL PT RO RS SE SI SK SM TR |
|
| REG | Reference to a national code |
Ref country code: GB Ref legal event code: FG4D Free format text: NOT ENGLISH |
|
| RIN1 | Information on inventor provided before grant (corrected) |
Inventor name: MALEKIAN BOROUJENI, KAVEH Inventor name: SCHWANKA TREVISAN, ARAMIS |
|
| REG | Reference to a national code |
Ref country code: CH Ref legal event code: EP |
|
| REG | Reference to a national code |
Ref country code: DE Ref legal event code: R096 Ref document number: 502019013119 Country of ref document: DE |
|
| REG | Reference to a national code |
Ref country code: IE Ref legal event code: FG4D Free format text: LANGUAGE OF EP DOCUMENT: GERMAN |
|
| U01 | Request for unitary effect filed |
Effective date: 20250327 |
|
| U07 | Unitary effect registered |
Designated state(s): AT BE BG DE DK EE FI FR IT LT LU LV MT NL PT RO SE SI Effective date: 20250402 |
|
| PG25 | Lapsed in a contracting state [announced via postgrant information from national office to epo] |
Ref country code: RS Free format text: LAPSE BECAUSE OF FAILURE TO SUBMIT A TRANSLATION OF THE DESCRIPTION OR TO PAY THE FEE WITHIN THE PRESCRIBED TIME-LIMIT Effective date: 20250626 |
|
| REG | Reference to a national code |
Ref country code: ES Ref legal event code: FG2A Ref document number: 3031509 Country of ref document: ES Kind code of ref document: T3 Effective date: 20250709 |
|
| PG25 | Lapsed in a contracting state [announced via postgrant information from national office to epo] |
Ref country code: NO Free format text: LAPSE BECAUSE OF FAILURE TO SUBMIT A TRANSLATION OF THE DESCRIPTION OR TO PAY THE FEE WITHIN THE PRESCRIBED TIME-LIMIT Effective date: 20250626 |
|
| PG25 | Lapsed in a contracting state [announced via postgrant information from national office to epo] |
Ref country code: HR Free format text: LAPSE BECAUSE OF FAILURE TO SUBMIT A TRANSLATION OF THE DESCRIPTION OR TO PAY THE FEE WITHIN THE PRESCRIBED TIME-LIMIT Effective date: 20250326 |
|
| PG25 | Lapsed in a contracting state [announced via postgrant information from national office to epo] |
Ref country code: GR Free format text: LAPSE BECAUSE OF FAILURE TO SUBMIT A TRANSLATION OF THE DESCRIPTION OR TO PAY THE FEE WITHIN THE PRESCRIBED TIME-LIMIT Effective date: 20250627 |
|
| U20 | Renewal fee for the european patent with unitary effect paid |
Year of fee payment: 7 Effective date: 20250731 |
|
| PG25 | Lapsed in a contracting state [announced via postgrant information from national office to epo] |
Ref country code: SM Free format text: LAPSE BECAUSE OF FAILURE TO SUBMIT A TRANSLATION OF THE DESCRIPTION OR TO PAY THE FEE WITHIN THE PRESCRIBED TIME-LIMIT Effective date: 20250326 |
|
| PGFP | Annual fee paid to national office [announced via postgrant information from national office to epo] |
Ref country code: ES Payment date: 20250917 Year of fee payment: 7 |
|
| PG25 | Lapsed in a contracting state [announced via postgrant information from national office to epo] |
Ref country code: PL Free format text: LAPSE BECAUSE OF FAILURE TO SUBMIT A TRANSLATION OF THE DESCRIPTION OR TO PAY THE FEE WITHIN THE PRESCRIBED TIME-LIMIT Effective date: 20250326 |
|
| PGFP | Annual fee paid to national office [announced via postgrant information from national office to epo] |
Ref country code: GB Payment date: 20250822 Year of fee payment: 7 |
|
| PG25 | Lapsed in a contracting state [announced via postgrant information from national office to epo] |
Ref country code: SK Free format text: LAPSE BECAUSE OF FAILURE TO SUBMIT A TRANSLATION OF THE DESCRIPTION OR TO PAY THE FEE WITHIN THE PRESCRIBED TIME-LIMIT Effective date: 20250326 |
|
| PG25 | Lapsed in a contracting state [announced via postgrant information from national office to epo] |
Ref country code: IS Free format text: LAPSE BECAUSE OF FAILURE TO SUBMIT A TRANSLATION OF THE DESCRIPTION OR TO PAY THE FEE WITHIN THE PRESCRIBED TIME-LIMIT Effective date: 20250726 |
|
| PG25 | Lapsed in a contracting state [announced via postgrant information from national office to epo] |
Ref country code: CZ Free format text: LAPSE BECAUSE OF FAILURE TO SUBMIT A TRANSLATION OF THE DESCRIPTION OR TO PAY THE FEE WITHIN THE PRESCRIBED TIME-LIMIT Effective date: 20250326 |
|
| PLBE | No opposition filed within time limit |
Free format text: ORIGINAL CODE: 0009261 |
|
| STAA | Information on the status of an ep patent application or granted ep patent |
Free format text: STATUS: NO OPPOSITION FILED WITHIN TIME LIMIT |
|
| REG | Reference to a national code |
Ref country code: CH Ref legal event code: L10 Free format text: ST27 STATUS EVENT CODE: U-0-0-L10-L00 (AS PROVIDED BY THE NATIONAL OFFICE) Effective date: 20260211 |
|
| 26N | No opposition filed |
Effective date: 20260105 |
|
| REG | Reference to a national code |
Ref country code: CH Ref legal event code: H13 Free format text: ST27 STATUS EVENT CODE: U-0-0-H10-H13 (AS PROVIDED BY THE NATIONAL OFFICE) Effective date: 20260324 |
|
| PG25 | Lapsed in a contracting state [announced via postgrant information from national office to epo] |
Ref country code: MC Free format text: LAPSE BECAUSE OF FAILURE TO SUBMIT A TRANSLATION OF THE DESCRIPTION OR TO PAY THE FEE WITHIN THE PRESCRIBED TIME-LIMIT Effective date: 20250326 |
|
| PG25 | Lapsed in a contracting state [announced via postgrant information from national office to epo] |
Ref country code: CH Free format text: LAPSE BECAUSE OF NON-PAYMENT OF DUE FEES Effective date: 20250831 |