EP4134675A1 - Procédé de mesure du temps de coagulation du sang - Google Patents
Procédé de mesure du temps de coagulation du sang Download PDFInfo
- Publication number
- EP4134675A1 EP4134675A1 EP21785245.8A EP21785245A EP4134675A1 EP 4134675 A1 EP4134675 A1 EP 4134675A1 EP 21785245 A EP21785245 A EP 21785245A EP 4134675 A1 EP4134675 A1 EP 4134675A1
- Authority
- EP
- European Patent Office
- Prior art keywords
- time
- coagulation
- reaction
- sample
- maximum
- Prior art date
- Legal status (The legal status is an assumption and is not a legal conclusion. Google has not performed a legal analysis and makes no representation as to the accuracy of the status listed.)
- Pending
Links
Images







Classifications
-
- G—PHYSICS
- G01—MEASURING; TESTING
- G01N—INVESTIGATING OR ANALYSING MATERIALS BY DETERMINING THEIR CHEMICAL OR PHYSICAL PROPERTIES
- G01N33/00—Investigating or analysing materials by specific methods not covered by groups G01N1/00 - G01N31/00
- G01N33/48—Biological material, e.g. blood, urine; Haemocytometers
- G01N33/483—Physical analysis of biological material
- G01N33/487—Physical analysis of biological material of liquid biological material
- G01N33/49—Blood
- G01N33/4905—Determining clotting time of blood
-
- G—PHYSICS
- G01—MEASURING; TESTING
- G01N—INVESTIGATING OR ANALYSING MATERIALS BY DETERMINING THEIR CHEMICAL OR PHYSICAL PROPERTIES
- G01N33/00—Investigating or analysing materials by specific methods not covered by groups G01N1/00 - G01N31/00
- G01N33/48—Biological material, e.g. blood, urine; Haemocytometers
- G01N33/50—Chemical analysis of biological material, e.g. blood, urine; Testing involving biospecific ligand binding methods; Immunological testing
- G01N33/86—Chemical analysis of biological material, e.g. blood, urine; Testing involving biospecific ligand binding methods; Immunological testing involving blood coagulating time or factors, or their receptors
-
- G—PHYSICS
- G01—MEASURING; TESTING
- G01N—INVESTIGATING OR ANALYSING MATERIALS BY DETERMINING THEIR CHEMICAL OR PHYSICAL PROPERTIES
- G01N2333/00—Assays involving biological materials from specific organisms or of a specific nature
- G01N2333/435—Assays involving biological materials from specific organisms or of a specific nature from animals; from humans
- G01N2333/745—Assays involving non-enzymic blood coagulation factors
- G01N2333/75—Fibrin; Fibrinogen
Definitions
- the present invention relates to a method for measuring blood coagulation time.
- a blood coagulation test is a test for diagnosing blood coagulability of a patient by adding a prescribed reagent to a blood specimen of the patient and measuring, for example, the blood coagulation time.
- Typical examples of the blood coagulation time include prothrombin time (PT), activated partial thromboplastin time (APTT), and thrombin time.
- the blood coagulation test can examine the hemostatic ability and fibrinolytic capacity of a patient.
- An abnormality in the blood coagulation ability mainly causes elongation of the coagulation time.
- elongation of coagulation time is caused by, for example, effect of an anticoagulant, reduction of a coagulation-participating component, congenital deficiency of a blood coagulation factor, and an acquired autoantibody that inhibits coagulation reaction.
- a mixed solution obtained by adding a reagent to a blood specimen is illuminated with light, and the coagulation reaction of the blood specimen is measured based on the resulting change in the amount of light.
- the scattered light intensity is sharply increased, by progression of coagulation, at a point of time after a certain amount of time has passed since the addition of the reagent to a blood specimen, then saturates as the coagulation reaction approaches the end, and reaches the plateau.
- the blood coagulation time can be measured based on such a temporal change in scattered light intensity.
- the method for calculating coagulation time by an automated analyzer several procedures, such as a percentage method and a differentiation method, are used (see Patent Literature 1).
- a percentage method typically, the time until the measured scattered light intensity reaches a certain percentage of the maximum value thereof is calculated as the coagulation time.
- the percentage method can quite accurately calculate the coagulation time not only of a normal sample but also of an abnormal sample, such as a low-fibrinogen sample, a chyle sample, and a hemolyzed blood sample.
- the automatic analysis based on the percentage method needs to set the sample measurement time long such that the maximum amount of scattered light can be detected even in an abnormal sample with low coagulability, such as a low-fibrinogen sample. Therefore, the analysis takes time.
- the time until the differential value of the amount of scattered light reaches the peak or a certain percentage thereof is calculated as the coagulation time.
- the abnormal sample with low coagulability such as a low-fibrinogen sample
- no clear peak of the differential value of the amount of scattered light is observed in some cases.
- two or more peaks of the differential value are observed in some cases.
- a procedure of calculating the coagulation time based on a single-peak curve formed by fitting of a differential value curve may be used, the fitting impairs the accurate information relating to the coagulability of a sample in some cases.
- photometric data from an analyzer include various noises caused by the apparatus, the reagent, and the condition of the sample, and the noises may produce false detection of the coagulation time.
- the automatic analysis of a blood specimen is required to calculate reliable coagulation time by removing the bad influence of noises.
- Patent Literature 1 JP-A-6-249855
- the present invention relates to a method for measuring blood coagulation time that can accurately measure coagulation time of blood specimens showing various blood coagulation reaction curves.
- the present invention provides the followings:
- the method of the present invention can shorten the analysis time for one sample and can improve the analysis efficiency, compared to a conventional percentage method.
- a blood specimen may be referred to as a sample.
- a general method for example, an optical method that measures the scattered light intensity, transmittance, absorbance, or the like, or a mechanical method that measures the viscosity of plasma is used.
- the coagulation reaction curve of a normal sample depends on the measurement method, but basically shows a sigmoid shape.
- a coagulation reaction curve based on the scattered light intensity of a normal sample is usually sharply increased by progression of coagulation at a point of time when a certain amount of time has passed since the addition of the reagent, and then reaches the plateau as the coagulation reaction approaches the end.
- the coagulation reaction curves of abnormal samples with coagulation disorder show various shapes depending on the cause of the abnormality, such as delay of the curve rise time and a gradual increase.
- the variety in the coagulation reaction curve of an abnormal sample makes accurate measurement of coagulation time in an automated analyzer difficult.
- an automated analyzer efficiently analyzes a large number of samples, it is desirable to promptly end the measurement after acquisition of necessary data of one sample and to start measurement of a next sample.
- a procedure has a risk of inviting the end of measurement too early due to the above-described false detection of the end of coagulation reaction at a too early point of time and causing missing of necessary data.
- the coagulation reaction measurement time for one sample is fixed as a sufficiently long time, it is possible to prevent data missing due to false detection of the end of coagulation reaction.
- such a procedure makes the measurement time of a large number of samples unnecessarily long and thereby reduces the total analysis efficiency.
- the present invention can prevent false detection of the coagulation time resulting from the abnormal shape of a coagulation reaction curve as described above to allow accurate coagulation time measurement.
- minimum necessary coagulation reaction measurement time can be applied to individual coagulation time measurements of various blood specimens including a normal sample and an abnormal sample, the analysis time for one sample can be shortened.
- the present invention relates to a method for measuring the blood coagulation time of a blood specimen.
- the method for measuring blood coagulation time of the present invention (hereinafter, also referred to as the method of the present invention) measures the coagulation reaction of a subject blood specimen mixed with a reagent.
- the blood coagulation time is measured based on the data in the time series of the coagulation reaction obtained by this measurement.
- Examples of the blood coagulation time to be measured by the method of the present invention include prothrombin time (PT), activated partial thromboplastin time (APTT), and coagulation time in fibrinogen (Fbg) concentration measurement.
- PT prothrombin time
- APTT activated partial thromboplastin time
- Fbg fibrinogen
- APTT activated partial thromboplastin time
- PT prothrombin time
- plasma of a subject is preferably used as the subject blood specimen.
- An anticoagulant that is usually used in a coagulation test may be added to the sample.
- plasma is obtained by sampling blood with a blood collection tube containing sodium citrate and then performing centrifugation.
- a coagulation time measurement reagent is added to the subject specimen to start blood coagulation reaction.
- the coagulation reaction of the mixed solution prepared by addition of the reagent can be measured.
- the coagulation time measurement reagent to be used can be arbitrarily selected depending on the measurement purpose.
- the reagents for measuring various types of coagulation time are commercially available (for example, APTT reagent Coagpia APTT-N, manufactured by Sekisui Medical Co., Ltd.).
- a general method for example, an optical method that measures the amount of scattered light, transmittance, absorbance, or the like, or a mechanical method that measures the viscosity of plasma may be used.
- the point of time of starting coagulation reaction can be typically defined as the point of time at which the coagulation reaction is started by adding a reagent to a sample, but another timing may be defined as the point of time of starting the reaction.
- the time for continuing the measurement of coagulation reaction may be, for example, from several tens of seconds to about 7 minutes since the point of time of mixing a sample and a reagent. This measurement time may be an arbitrarily determined fixed value or may be until the point of time at which the end of coagulation reaction of each sample is detected.
- measurement of a sample may be ended at a point of time at which the coagulation time of the sample is determined before the completion of coagulation reaction, and measurement of a next sample may be started.
- measurement of the state of progress of the coagulation reaction is repeated at predetermined intervals. For example, measurement may be performed at 0.1 second intervals.
- the temperature of the mixed solution during the measurement is, for example, 30°C or more and 40°C or less under normal conditions, preferably 35°C or more and 39°C or less.
- Various conditions of measurement can be appropriately set depending on the subject specimen, reagent, measurement methods, and so on.
- a series of procedure in the above-described measurement of coagulation reaction can be performed using an automated analyzer.
- An example of the automated analyzer is automated blood coagulation analyzer CP3000 (manufactured by Sekisui Medical Co., Ltd.).
- the procedure may be partially manually performed.
- preparation of subject specimens is performed by a human, and the subsequent procedure can be performed with an automated analyzer.
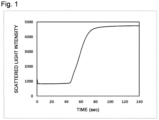
- Figure 1 shows an example of measurement data.
- the horizontal axis of Figure 1 represents the time (coagulation reaction time) passed after addition of a calcium chloride solution (the point of time of start of reaction), and the vertical axis represents the amount of scattered light. Since the coagulation reaction of the mixed solution progresses, the scattered light intensity increases with time.
- a coagulation reaction curve such a curve showing the change in the amount of coagulation reaction with respect to the time of the coagulation reaction.
- a coagulation reaction curve based on the amount of scattered light as shown in Figure 1 is usually sigmoid-like.
- a coagulation reaction curve based on the amount of transmitted light is usually inverse sigmoid-like.
- data analysis using a coagulation reaction curve based on the amount of scattered light will be described.
- the measurement data R(i) (measured values of the amount of scattered light) about coagulation reaction measured from the point of time of starting reaction is successively acquired by an analyzer.
- "i" represents the measuring point number.
- the R(i) represents the measured value after 0.1 ⁇ i seconds since the start of measurement.
- the measured values are subjected to smoothing processing by a known method.
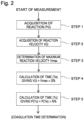
- zero point adjustment treatment which is subtraction of the amount of scattered light derived from the reaction solution before the reaction, is performed. Accordingly, the acquired measurement data R(i) are successively subjected to smoothing processing and zero point adjustment to acquire reaction P(i) (step 1).
- the smoothing processing of measurement data can use any of various known methods relating to noise removal.
- the smoothing processing include filtering processing and processing by determining the difference value or the differential value by calculation of an average slope within the intervals described later and then integrating the values.
- the smoothed measured value may be adjusted such that the value at the point of time of starting measurement is 0.
- the measurement data R(i) may be subjected to initial fluctuation removing treatment.
- the initial fluctuation removing treatment may be performed such that all values during from the time of starting photometry until previously determined time of removing initial fluctuation are 0.
- the reaction P(i) constitutes a coagulation reaction curve subjected to smoothing and zero point adjustment.
- Reaction velocity V(i) is acquired from the determined reaction P(i) (step 2).
- V(i) is obtained by primary differentiation of P(i).
- the differentiation treatment can be performed by an arbitrary procedure, for example, by calculation of the average slope value within the intervals.
- a certain number of measuring points before and after each measuring point i for example, (2K + 1) measuring points from i - K to i + K can be used.
- the average slope value means the slope value obtained by linear approximation of these plurality of measuring points.
- FIG. 3 shows the normal sample in the left and the elongation sample in the right. In the horizontal axis, the time is converted into the time from the point of time of starting reaction.
- the reaction P has an early rising point and a large rising slope, and the reaction velocity V has a high peak top position and an almost left-right symmetric shape.
- the reaction P has a late rising point and a small rising slope
- the reaction velocity V has a low peak top position (in this example, lower than 1/6 of the normal sample) and a left-right asymmetric shape, a bimodal shape, not having a single peak.
- the method of the present invention calculates coagulation time Tc using the values of the above-described reaction P(i) and reaction velocity V(i).
- the method of the present invention can acquire P(i) and V(i) in parallel to the coagulation reaction measurement process.
- the maximum reaction velocity Vmax is determined based on V(i) acquired so far (step 3).
- the Vmax most simply represents the maximum value of V(i) acquired so far.
- the Vmax is preferably the value of the peak top of the maximum peak after V(i) exceeded a prescribed threshold for removing noises.
- Vmax when a peak of successively obtained V(i) has a prescribed width, the value of the peak top of the peak is determined as Vmax.
- Figure 4 shows a conceptual scheme of an embodiment of the Vmax determination procedure.
- S1 to S6 show, in the time series, V(i) acquired during from a point of time (T1) of the reaction initial stage to a point of time (Tt) of Vmax determination.
- T1 point of time
- Tt point of time
- V(i) shows V(i) until a point of time T1 immediately after the rising of coagulation reaction.
- Vs is the velocity threshold for excluding initial noises.
- Vp is a tentative peak and represents the maximum value of V(i) acquired after V(i) exceeds the Vs until the latest measuring point.
- Vp is represented by the function Vp(t) at time t or the function Vp(i) of a measuring point.
- K is represented by the function K(t) at time t or the function K(i) of a measuring point.
- K(T4) in the figure represents K at the point of time T4 and corresponds to the time width from the point of time T3 of the peak top until time T4.
- K(i) at the point of time T4 is the value obtained by multiplying the K(T4) by the measurement frequency (number of measuring points/sec) of coagulation reaction measurement.
- Tt is the point (the point of time or measuring point) at which V(i) decreased until a prescribed value, after the VmaxO detection, while K(i) > Ks is maintained.
- Tt in S6 is defined as a point of time at which V(i) is decreased to 50% of VmaxO, but can be arbitrarily set.
- Tt is a point at which V(i) is 40% to 95% of VmaxO.
- K(i) is reset to 0, and S2 to S5 are carried out again to detect new VmaxO.
- Table 1 shows the states of V(i) in S1 to S5.
- V(i) does not exceed the velocity threshold Vs within the measurement time, it is judged that there is no coagulation reaction.
- V(i) exceeds the Vs within the measurement time but the maximum value continuation width K does not exceed the threshold Ks, it is judged that the coagulation reaction is not ended yet. Even if the detection end point Tt cannot be detected after detection of VmaxO and Vmax is not determined, it is judged that the coagulation reaction is not ended yet.
- Vmax can be determined based on the peak width W of V(i).
- the peak width W is the width (time or number of measuring points) between the latest point and the point at which the height of V(i) is X% of a tentative peak Vp before the latest point and before Vp.
- X is 1 or more and less than 100 and is preferably 40 to 95.
- X is preferably larger than parameter S that is used for calculating a calculation start point Te described later, but may be equal to or smaller than the S.
- X is preferably 41 to 80
- X is preferably 40 to 95.
- the peak width W may be called as "X% peak width" according to X as the reference.
- Vp is successively detected, and the peak width W(t) at time t or the peak width W(i) at a measuring point i are determined.
- Vp at Tt may be defined as true maximum value Vmax.
- the peak width W does not exceed a threshold Ws within the measurement time, it is judged that the coagulation reaction is not ended yet.
- the maximum value continuation width threshold Ks, and the peak width threshold Ws fixed values previously determined can be respectively used.
- appropriate Vs, Ks, and Ws can be set by measuring coagulation time for a reference sample pack including a normal sample and various types of abnormal samples and using the resulting data of V(i) for the pack.
- Vs is set to a value smaller than the smallest Vmax in those of each sample determined from the measurement data of the reference sample pack.
- Ks and Ws the maximum value continuation width K and peak width W of each sample of the reference sample pack were determined by the above process, and appropriate values may be set as Ks and Ws based on the determined K and W, respectively.
- Ks is set to a value smaller than the smallest value of the maximum values of K(i) (hereinafter, referred to as Kmax) determined for each sample
- Ws is set to a value smaller than the smallest value of the maximum values of W(i) (hereinafter, referred to as Wmax) determined for each sample.
- the velocity threshold Vs, the maximum value continuation width threshold Ks, and the peak width threshold Ws may be functions of time t or measuring point i. Even when Vs, Ks, and Ws are functions of t or i, the functions may be set based on the values of Vmax, Ks, and Ws determined from each sample of the reference sample pack, as in the above.
- Vs can be set as a function represented by a curve showing a value always smaller than Vmax on a graph plotting the Vmax determined from each sample against VmaxT.
- Ks and Ws can be set as functions represented as curves showing values always smaller than Kmax and Wmax, respectively, on a graph plotting the Kmax and Wmax determined from each sample against VmaxT.
- Vs, Ks, and Ws can be determined as functions of measuring point i by converting t in the above equations into i. Even when the reaction velocity V(i) is small or bimodal as often observed in abnormal samples, Vmax can be appropriately detected by using variable values as Vs, Ks, and Ws.
- Figure 5 shows relationships between V(i) and Vp(i), W(i), or K (i) .
- a to D of Figure 5 show V(i) and relationships between V(i) and Vp(i), W(i), or K(i) in a normal sample with normal APTT.
- E to H of Figure 5 show V(i) and relationships between V(i) and Vp(i), W(i), or K(i) in an abnormal (FVIII deficiency) sample.
- V(i) is indicated by an alternate long and short dash line until a point of time at which V(i), after Vmax, arrives at 70% of Vmax (detection end point Tt) and thereafter by a dotted line.
- Vp(i), W(i), and K(i) are indicated by a solid line.
- W(i) uses a 70% peak width.
- V(i) of the normal sample shows a unimodal peak, and Vp(i) increases until V(i) reaches the peak (Vmax) and is then constant.
- W(i) increases until the detection end point Tt and is then constant.
- K(i) increases until the detection end point Tt.
- V(i) of the abnormal sample shown in E to H of Figure 5 shows an approximately bimodal peak including a large number of small peaks, and the second peak is the maximum value Vmax.
- Vp(i) stepwise increases as V(i) reaches a higher peak and is constant after V(i) reached Vmax. W(i) increases until the detection end point Tt and is then constant. K(i) is reset to 0 at every time at which a higher V(i) peak appears, and thereby a peak of K(i) corresponding to a peak of V(i) appears.
- a point Te at which V(i) is S% of Vmax (100%) after the time of VmaxT is determined (step 4).
- Te is a point of time (or measuring point) that is recognized such that the coagulation reaction proceeded to a considerable extent and is calculated based on a ratio of V(i) to maximum reaction velocity Vmax (hereinafter also referred to as "maximum velocity ratio").
- S% corresponds to a maximum velocity ratio
- VmaxT ⁇ Te can be determined within a range of larger than 0 and smaller than 100 and is preferably 1 to 95 and more preferably 5 to 95. The smaller S is, the better the measurement precision of the coagulation time tends to be, but the longer the required measurement time is.
- S is further preferably 5 to 40 and further preferably 5 to 20.
- S is further preferably 5 to 40 and further preferably 5 to 15.
- Te is used as the calculation start point of coagulation time.
- N may be 0 ⁇ N ⁇ 100 and is preferably 10 to 70 and more preferably 20 to 60.
- the coagulation time Tc based on the maximum velocity ratio calculated by the method of the present invention has a high correlation with the coagulation time by a percentage method, which is a conventional common method (for example, a method for calculating the time for P(i) to reach a certain percentage of its maximum value Pmax as the coagulation time). Accordingly, the coagulation time of a subject specimen can be precisely determined by the method of the present invention. Furthermore, in the method of the present invention, coagulation time measurement that is unlikely to receive influences, such as measurement noise and early reaction, and has higher reliability is possible by the step of detecting a true peak of reaction velocity V(i) (step 3 described above).
- reaction velocity V(i) arrived at a prescribed threshold (Vmax ⁇ S%) after reaching maximum reaction velocity Vmax. Accordingly, in the method of the present invention, it is not necessary to continue the measurement until the coagulation reaction reaches the plateau, unlike the conventional percentage method. Furthermore, also when a large number of samples are analyzed by an automated analyzer, according to the method of the present invention, it is not necessary to set a long measurement time for an abnormal sample with low coagulability, unlike the conventional percentage method. Accordingly, according to the present invention, it is possible to reduce or optimize the analysis time of samples and thereby improve the analysis efficiency.
- a normal blood includes coagulation factors, such as coagulation factors I to XIII, and abnormality and deficiency of these coagulation factors lead to abnormality of coagulability.
- the coagulation factor concentration of a subject specimen can be measured using a dedicated reagent for each coagulation factor based on the coagulation time of a measurement sample prepared from the subject specimen. Accordingly, the coagulation factor concentration of the subject specimen can be measured using the coagulation time of the measurement sample measured by the method of the present invention.
- the coagulation factor concentration is measured based on a standard curve showing a relationship between coagulation time and coagulation factor concentration.
- the coagulation factor concentration of the subject specimen can be calculated by applying the coagulation time of the measurement sample measured by the method of the present invention to a standard curve made in advance.
- the coagulation factor to be measured by the method of the present invention include factor I (fibrinogen), factor VIII, and factor IX.
- the X% peak width W for Vmax determination it is preferable to use a peak width of from 75% to 95%.
- X is preferably larger than S, but may be equal to or smaller than S.
- the method for measuring blood coagulation time of the present invention has been described above by the case of coagulation reaction measurement based on scattered light intensity as an example.
- the method of the present invention can be applied to a method for measuring blood coagulation time using another method for measuring coagulation reaction (for example, a method for measuring blood coagulation reaction based on transmittance, absorbance, viscosity, or the like) by those skilled in the art.
- a method for measuring blood coagulation reaction based on transmittance, absorbance, viscosity, or the like for example, the positive and negative of reaction P(i) obtained from an inverse sigmoid-like coagulation reaction curve based on the amount of transmitted light or the like becomes reversed with respect to those based on the amount of scattered light described above.
- the signs of P(i) and V(i) in the above-described steps 1 to 4 are reversed, for example, the minimum reaction velocity Vmin is determined instead of the maximum reaction velocity Vmax.
- Coagpia APTT-N manufactured by Sekisui Medical Co., Ltd. was used.
- Coagulation reaction measurement was performed using an automated blood coagulation analyzer CP3000 (manufactured by Sekisui Medical Co., Ltd.). Each (50 ⁇ L) of the samples was dispensed in a cuvette (reaction container) and was then warmed at 37°C for 45 seconds, the APTT reagent (50 ⁇ L) warmed to about 37°C was then added to the cuvette, and, after 171 seconds, a calcium chloride solution (50 ⁇ L) was further added thereto to start coagulation reaction. The reaction was performed while keeping the temperature about 37°C.
- the measurement (photometry) of coagulation reaction was performed by irradiating the cuvette with light having a wavelength of 660 nm from an LED light as a light source and measuring the amount of 90-degree side scattered light at 0.1 seconds intervals.
- the maximum measurement time was 360 seconds (number of data: 3600, 0.1 seconds intervals).
- Reaction P(i) was produced by subjecting the photometric data from each sample to smoothing processing including noise removal and then performing zero point adjustment treatment such that the scattered light intensity at the point of time of starting photometry is 0.
- the primary differential value V(i) was calculated from the P(i).
- the APTT of each sample was measured by a percentage method. That is, the point of time at which P(i) arrived at the maximum value Pmax within the measurement time was determined as the coagulation reaction end point, and the point of time at which P(i) reached 50% of the amount of scattered light at the coagulation reaction end point was determined as APTT.
- Table 2 shows the category and number of subject specimens and the minimum and maximum values of APTT in the samples of each category.
- Vmax Maximum reaction velocity Vmax was detected from V(i) obtained for each sample.
- the tentative maximum value VmaxO when the maximum value continuation width K(i) exceeded the maximum value continuation width threshold Ks and then reached the detection end point Tt (the point of time at which V(i) became 70% of Vmax) was determined as Vmax.
- the velocity threshold Vs was determined as a function represented by the following equation according to the process of Reference Example 1 described later. Ks was set to 2.2.
- Vs i ⁇ 83 + 158214 / i 2 i represents a measuring point .
- the Te and Tc determined for each S are referred to as Tes and Tcs, respectively, according to the corresponding S. For example, Te and Tc when S is 5 are referred to as Te 5 and Tc 5 , respectively.
- Figure 6 shows examples of measured Te and Tc, and APTT by a percentage method.
- a and B of Figure 6 show the P(i) (the above) and V(i) (the below) of samples of which the APTT by a percentage method were minimum (27.2 sec) and maximum (141.2 sec), respectively, together with the point of time of Pmax (rhombus), APTT (triangle) by a percentage method based on Pmax, Te 40 and Te 20 (square), and Tc 40 and Tc 20 (circle).
- Pmax rhombus
- APTT triangle
- Tc 40 and Tc 20 marked with circles were close to APTT, marked with a triangle, by a percentage method (conventional method) based on Pmax, and it was suggested that they reflect APTT.
- the time taken for P(i) to become the maximum value Pmax was about 360 seconds, and the differences between the time of Pmax and the time of Te 40 or Te 20 were about 320 seconds in A of Figure 6 and were about 140 to 160 seconds in B of Figure 6 . It was shown that APTT can be calculated 140 seconds or more faster compared to the known percentage method based on Pmax by determining Te and Tc based on the maximum velocity ratio.
- FIG 7 shows a primary regression line of Tc 5 with respect to APTT by a percentage method for 24 samples.
- Tc 5 had a high correlation with APTT by a percentage method. The correlation between APTT by a percentage method and Tc was evaluated.
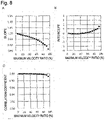
- Each Tc (Tc 5 to Tc 95 ) when S was 5 to 95 was subjected to primary regression analysis with APTT by a percentage method, and the slope, intercept, and correlation coefficient of the regression line were determined.
- Figure 8 shows the slopes, intercepts, and correlation coefficients of the primary regression lines of Tc 5 to Tc 95 with respect to APTT by a percentage method.
- the slopes of the regression lines were 0.86 to 1.00, the intercepts were -0.1 to 1.6, and the correlation coefficients were 0.992 to 1.000 (A to C of Figure 8 ). It was confirmed that the APTT measuring method based on maximum velocity ratio has performance satisfying In-vitro diagnostic drug approval criteria, "comparing to control measurement method, the correlation coefficient is 0.9 or more, and the slope of regression line equation is 0.9 to 1.1", by the Ministry of Health, Labour and Welfare.
- Tc 5 to T C95 of 24 samples were compared to a control (APTT by a percentage method).
- Each row of the tables of A and B of Figure 9 represents Tc (from the left, Tc 5 to Tc 95 ) of each sample.
- Tc is represented by gray color.
- Tc 5 to Tc 40 of all samples agreed with the control within an error of ⁇ 5%
- Tc 5 to Tc 20 of all samples agreed with the control within an error of ⁇ 3%.
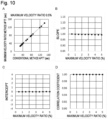
- Tc 0.5 to Tc 5 were subjected to primary regression analysis with APTT by a percentage method by the same process as in 2.1) above, and the slope, intercept, and correlation coefficient of the regression line were determined.
- the primary regression line of Tc 0.5 with respect to APTT by a percentage method for 24 samples is shown in A of Figure 10
- the slopes, intercepts, and correlation coefficients of the primary regression lines of Tc 0.5 to Tc 5 with respect to APTT by a percentage method are shown in B to D, respectively, of Figure 10 .
- All of Tc 0.5 to Tc 5 had very high correlations with APTT by a percentage method.
- Figure 11 is a table comparing Tc 0.5 to Tc 5 with a control (APTT by a percentage method) for 24 samples by the same process as in 2.2).
- Tc 0.5 to Tc 5
- control APTT by a percentage method
- the coagulation reaction measurement was performed using an automated blood coagulation analyzer CP3000 (manufactured by Sekisui Medical Co., Ltd.). Each (50 ⁇ L) of the samples was dispensed in a cuvette (reaction container) and was then warmed at 37°C for 45 seconds, and a thromboplastin solution (100 ⁇ L) warmed to about 37°C was then added to the cuvette to start coagulation reaction. The reaction was performed while keeping the temperature about 37°C.
- the measurement (photometry) of coagulation reaction was performed by irradiating the cuvette with light having a wavelength of 660 nm from an LED light as a light source and measuring the amount of 90-degree side scattered light at 0.1 seconds intervals. The maximum measurement time was 300 seconds (number of data: 3000, 0.1 seconds intervals).
- Reaction P(i) was produced by subjecting the photometric data from each sample to smoothing processing including noise removal and then performing zero point adjustment treatment such that the scattered light intensity at the point of time of starting photometry is 0.
- the primary differential value V(i) was calculated from the P (i) .
- the PT of each sample was measured by a percentage method.
- the point of time at which P(i) arrived at the maximum value Pmax within the measurement time was determined as the coagulation reaction end point, and the point of time at which P(i) arrived at 45% of the amount of scattered light at the coagulation reaction end point was determined as PT.
- Table 3 shows the category and number of subject specimens and the minimum and maximum values of PT in the samples of each category. [Table 3] Sample category Number of samples PT (sec) Minimum value PT (sec) Maximum value Normal plasma 9 11.4 12.1 PT-INR 1-2 5 9.5 23.4 PT-INR 2-3 5 20.6 28.6 PT-INR 3-4 4 31.3 51.6
- Vmax Maximum reaction velocity Vmax was detected from the V(i) obtained for each sample by the same process as in Example 1.
- the velocity threshold Vs was determined as a function represented by the following equation according to the process of Reference Example 1 described later. Ks was set to 0.8.
- Vs i ⁇ 148 + 51935 / i 2 i represents a measuring point .
- Figure 12 shows examples of measured Te and Tc and PT by a percentage method.
- a and B of Figure 12 show the P(i) (the above) and V(i) (the below) of samples of which the PT by a percentage method were minimum (9.5 sec) and maximum (51.6 sec), respectively, together with the point of time of Pmax (rhombus), PT (triangle) by a percentage method based on Pmax, Te 40 and Te 15 (square), and Tc 40 and Tc 15 (circle) .
- Tc 40 and Tc 15 marked with circles were close to PT, marked with a triangle, by a percentage method (conventional method) based on Pmax, and it was suggested that they reflect PT.
- the time taken for P(i) to become the maximum value Pmax was about 300 seconds, and the differences between the time of Pmax and the time of Te 40 or Te 15 were about 285 seconds in A of Figure 12 and were about 240 to 250 seconds in B of Figure 12 . It was shown that PT can be calculated 240 seconds or more faster compared to the conventional percentage method based on Pmax by determining Te and Tc based on the maximum velocity ratio.
- Tc 5 to T C95 was subjected to primary regression analysis with PT measured by a percentage method by the same process as in 2.1) of Example 1, and the slope, intercept, and correlation coefficient of each regression line were determined.
- FIG 13 shows a primary regression line of Tc 5 with respect to PT by a percentage method for 23 samples.
- Tc 5 had a high correlation with PT by a percentage method. The correlation between PT by a percentage method and Tc was evaluated.
- Each Tc (Tc 5 to Tc 95 ) when S was 5 to 95 was subjected to primary regression analysis with PT by a percentage method, and the slope, intercept, and correlation coefficient of each regression line were determined.
- Figure 14 shows the slopes, intercepts, and correlation coefficients of the primary regression lines of Tc 5 to T C95 with respect to PT by a percentage method.
- the slopes of the regression lines were 0.91 to 1.00, the intercepts were 0.0 to 0.2, and the correlation coefficients were all 1.000 (A to C of Figure 14 ). It was confirmed that the PT measuring method based on maximum velocity ratio has performance satisfying In-vitro diagnostic drug approval criteria, "comparing to control measurement method, the correlation coefficient is 0.9 or more, and the slope of regression line equation is 0.9 to 1.1", by the Ministry of Health, Labour and Welfare.
- Tc 5 to Tc 95 of 23 samples were compared to a control (PT by a percentage method).
- Each row of the tables of A and B of Figure 15 represents Tc (from the left, Tc 5 to Tc 95 ) of each sample.
- Tc is within ⁇ 5% (A of Figure 15 ) or ⁇ 3% (B of Figure 15 ) of the control, it is represented by gray color.
- Tc 5 to Tc 40 of all samples agreed with the control within an error of ⁇ 5%
- Tc 5 to Tc 15 of all samples agreed with the control within an error of ⁇ 3%.
- Human fibrinogen Human Fibrinogen manufactured by Enzyme Research Laboratories, Product name: FIB 2
- Human fibrinogen-removed plasma Fibrinogen Deficient Human Plasma manufactured by Affinity Biologicals Inc., Product name: Fg Deficient Plasma
- sample 10 and a physiological saline solution were mixed at volume ratios of 1 : 9, 7 : 3, and 10 : 0 to prepare three samples with fibrinogen concentration ([Fbg]) of 98 mg/dL, 686 mg/dL, and 980 mg/dL, respectively.
- the fibrinogen measurement reagents As the fibrinogen measurement reagents, the thrombin reagent and sample diluent included in Coagpia Fbg (manufactured by Sekisui Medical Co., Ltd.) were used.
- the coagulation reaction measurement was performed using an automated blood coagulation analyzer CP3000 (manufactured by Sekisui Medical Co., Ltd.). A sample (10 ⁇ L) and the sample diluent (90 ⁇ L) were dispensed in a cuvette and were warmed at 37°C for 45 seconds, and a thrombin reagent (50 ⁇ L) warmed to about 37°C was then added to the cuvette to start coagulation reaction. The reaction was performed while keeping the temperature about 37°C.
- the coagulation reaction measurement was performed by irradiating the cuvette with light having a wavelength of 660 nm from an LED light as a light source and measuring the amount of 90-degree side scattered light at 0.1 seconds intervals.
- the maximum measurement time was 300 seconds (number of data: 3000, 0.1 seconds intervals).
- the measurement of coagulation reaction was performed twice for each of three standard samples and ten concentration series samples.
- Reaction P(i) was produced by subjecting the photometric data from each sample to smoothing processing including noise removal and then performing zero point adjustment treatment such that the scattered light intensity at the point of time of starting photometry is 0.
- the primary differential value V(i) was calculated from the P(i).
- the calculation start point of a percentage method was determined based on the integrated value ratio Z(i) of reaction P(i) (see Patent Literature 1).
- the integrated value ratio Z(i) reflects the trend of change in P(i). That is, Z(i) is large in the reaction initial stage in which P(i) increases and then asymptotically approaches 1 as P(i) approaches the plateau.
- Z(i) was calculated from P(i) by the following equation, and the point at which Z(i) became smaller than a threshold Zs was defined as the calculation start point of a percentage method.
- Zs was set to 1.05.
- Coagulation times of three standard samples and ten concentration series samples were measured by a percentage method. That is, when P(i) at the calculation start point was defined as 100%, the point of time at which P(i) arrived at 63% was determined as the coagulation time.
- the coagulation time of each sample was measured twice based on the coagulation reaction measurement each performed twice.
- averages of the duplicate measurements were calculated, and logarithms of the averages were plotted with respect to the logarithms of [Fbg] (mg/dL) of the standard samples to produce a standard curve by a percentage method. According to the produced standard curve, the fibrinogen concentration ([Fbg] arithmetic value by a percentage method, mg/dL) of each of the concentration series samples was calculated.
- Vmax was detected from the V(i) obtained for each sample by the same process as in Example 1.
- Tc 5 to Tc 95 of ten concentration series samples were calculated twice for each to obtain data for 20 samples.
- Tc 5 to Tc 95 of the three standard samples were calculated twice for each, and averages of the duplicate measurements were calculated.
- Logarithms of the averages were plotted with respect to the logarithms of [Fbg] (mg/dL) of the standard samples to produce a standard curve by Tc. According to the produced standard curve, the fibrinogen concentration ([Fbg] arithmetic value by maximum velocity ratio, mg/dL) of each of the concentration series samples was calculated.
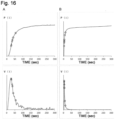
- Figure 16 shows examples of measured Te and Tc and coagulation time by a percentage method.
- a and B of Figure 16 show the P(i) (the above) and V(i) (the below) of samples of which the [Fbg] was the minimum (98 mg/dL) and maximum (980 mg/dL), respectively, together with the calculation start point (rhombus) by an integrated value ratio, coagulation time (triangle) by a percentage method based on the calculation start point, Te 75 and Te 30 (square), and Tc 75 and Tc 30 (circle).
- Tc 75 and Tc 30 marked with circles were close to the coagulation time by a percentage method (conventional method) marked with a triangle, and it was suggested that they reflect coagulation time.
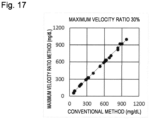
- the [Fbg] arithmetic value based on Tc 30 had a high correlation with the [Fbg] arithmetic value by a percentage method.
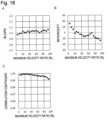
- Figure 18 shows the slopes, intercepts, and correlation coefficients of [Fbg] arithmetic values calculated from Tc 5 to Tc 95 with respect to [Fbg] arithmetic values by a percentage method.
- the slopes of the regression lines were 0.97 to 1.06, the intercepts were -27.1 to 32.0, and the correlation coefficients were 0.992 to 0.999 (A to C of Figure 18 ). It was confirmed that the fibrinogen concentration measuring method based on maximum velocity ratio leads to the results similar to those of a standard method based on a percentage method and accordingly has performance satisfying In-vitro diagnostic drug approval criteria, "comparing to control measurement method, the correlation coefficient is 0.9 or more, and the slope of regression line equation is 0.9 to 1.1", by the Ministry of Health, Labour and Welfare.
- Each row of the tables of A and B of Figure 19 represents Tc (from the left, Tc 5 to Tc 95 ) of each sample.
- Tc 20 to Tc 95 of all samples agreed with the expected values within an error of ⁇ 10%
- Tc 30 to Tc 75 of all samples agreed with the expected values within an error of ⁇ 5%.
- a coagulation time measuring method based on the maximum velocity ratio by the present method was compared to the method described in Patent Literature 1 (a coagulation time measuring method using the integrated value ratio Z(i) of reaction P(i)).
- Z(i) is a ratio of the integrated value of P(i) in a first measurement interval and the integrated value of P(i) in a second measurement interval adjacent to the first interval and reflects the trend of change in P(i).
- Z(i) is large in the reaction initial stage in which P(i) increases and then asymptotically approaches 1 as P(i) approaches the plateau.
- the time at which Z(i) satisfies a prescribed value after Z(i) became smaller than a threshold Zs is determined as coagulation time.
- the coagulation time measuring method based on Z(i) is disclosed as a highly reliable coagulation time measuring method that can accurately measure coagulation time of not only a normal sample but also an abnormal sample, such as a low-fibrinogen sample.
- the accuracy of the coagulation time measuring method according to the present method based on maximum velocity ratio was evaluated by comparison with the coagulation time measuring method using integrated value ratio.
- Reaction P(i) was produced by subjecting the photometric data from each sample to smoothing processing including noise removal and then performing zero point adjustment treatment such that the scattered light intensity at the point of time of starting photometry is 0.
- the primary differential value V(i) was calculated from the P(i).
- the integrated value ratio Z(i) of the reaction P(i) was calculated by the following equation.
- Figure 20 shows graphs of P(i) and V(i) (the left), P(i) and Z(i) (the middle), and enlarged Z(i) (the right) of two samples A (the above) and B (the below).
- sample A immediately after the start of measurement, no clear peak (initial peak) was observed in V(i), but a plurality of initial peaks was observed in Z(i). It was inferred that these initial peaks reflect the turbulence in turbidity when a sample and a mixed solution of reagents are mixed in the reaction container (cuvette).
- Vmax of reaction velocity V(i) during the measurement period was determined.
- the smallest value of the Vmax obtained from each sample was determined, and 50% of the smallest Vmax was defined as Vs.
- the determined Vs was 36 in the APTT group, 107 in the PT group, and 17 in the Fbg group.
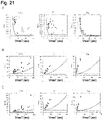
- a of Figure 21 shows the distributions of Vmax and calculated Vs of, from the left, the APTT group, the PT group, and the Fbg group.
- Vmax was plotted with respect to VmaxT.
- the circle mark indicates data of a normal control
- the triangle indicates data of an abnormal control.
- the dotted line indicates fixed value Vs
- the solid line indicates function Vs.
- the function Vs is represented as a function of time t (sec). In every group, the Vmax tends to decrease with an increase of VmaxT, and as a result, the function Vs is represented as a curve that decreases with time and is eventually substituted by the fixed value Vs.
- Kmax The maximum value (Kmax) of K(i) changes depending on the detection end point Tt, i.e., the value of V(Tt)/VmaxO ratio.
- K(i) recedes from VmaxT with an increase in Tt (a decrease in V(Tt)/VmaxO ratio), and therefore Kmax increases.
- K(i) approaches VmaxT with a decrease in Tt (an increase in V(Tt)/VmaxO ratio), and therefore Kmax decreases.
- the distribution of Kmax was investigated using the measurement data of the reference sample pack and varying the setting of the V(Tt)/VmaxO ratio (%) from 50% to 90% in 10% increments.
- Kmax depends on the time of the reaction velocity peak, consequently the coagulation time, that is, Kmax increases with an increase in coagulation time, and Kmax decreases with a decrease in coagulation time.
- Ks may be defined as a function of time or measuring point.
- the constant b was defined as a fixed value of Ks (dotted line in each graph) and was set as a value of 60% of the smallest Kmax, and was 2.2 seconds in the APTT group, 0.8 seconds in the PT group, and 1.1 seconds in the Fbg group.
- the coefficient a was appropriately set not to overlap the distribution of Kmax and was 0.0004 in every group.
- the maximum value (Wmax) of W(i) had the same tendency as Kmax, i.e., a tendency of depending on time.
- Kmax i.e., a tendency of depending on time.
- the minimum and maximum values in the distribution of Wmax were investigated by varying the set value of V(Tt)/VmaxO ratio (%) from 50% to 90% in 10% increments.
- FIG. 21 shows the distributions of Wmax and calculated Ws when the V(Tt)/VmaxO ratio was set to 70% in, from the left, the APTT group, the PT group, and the Fbg group.
- Wmax was plotted with respect to VmaxT. It was revealed that Wmax increases with an increase in VmaxT, and Wmax decreases with a decrease in VmaxT.
- a calculation equation: Ws(t) constant b + coefficient a ⁇ t 2 (solid line in each graph) could be determined from the data in the graphs.
- the constant b was defined as a fixed value of Ws and was set as a value of 60% of the smallest Wmax, and was 3.4 seconds in the APTT group, 1.6 seconds in the PT group, and 1.9 seconds in the Fbg group.
- the coefficient a was appropriately set not to overlap the distribution of Wmax and was 0.0005 in every group.
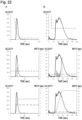
- Figure 22 shows relationships between reaction velocity V(t) and velocity threshold Vs (the above), maximum value continuation width K(t) and Ks (the middle), and peak width W(t) and Ws (the below) in the sample (A) with the smallest APTT and the sample (B) with the largest APTT in Example 1 during the Vmax detection process.
- V(t) is indicated by a solid line until the point of time at which V(t), after Vmax, arrived at 70% of Vmax (detection end point Tt) and thereafter by a dotted line.
- W(t) indicates 70% peak width.
- Vs was calculated by the following equation according to the above-described Reference Example 1. However, when a calculated value was less than 36, Vs was set to 36. As Ks and Ws, the following fixed values were used.
- Vs t ⁇ 83 + 158214 / t 2 t is time sec
- Vs (alternate long and short dash) following the above equation was very large in the reaction initial stage but decreased with time. It was revealed that false detection of the initial peak derived from early reaction or noises in the reaction initial stage can be prevented by setting Vs to vary as above.
- K(t) indicated by a thin dotted line shows one sharp triangular shape exceeding the threshold Ks in A of the figure, but in B of the figure, K(t) fluctuates up and down corresponding to peak appearance of V(t) and exceeded the threshold Ks (alternate long and short dash).
- W(t) indicated by a thin dotted line increased with time in both A and B of the figure, exceeded the threshold Ws (alternate long and short dash), and became maximum value Wmax when V(t) exceeded VmaxT and arrived at 70% of Vmax.
- Wmax was 5.7 seconds in A of the Figure due to its sharp peak shape and was 82 seconds in B of the Figure due to the bimodal wide peak shape.
- K(t) exceeded Ks at the detection end point Tt
- Vmax can be correctly detected by using K(t) or W(t) not only when V(t) has a single peak arriving at Vmax as in A, but also when a pre-peak appears before the reaction velocity V arrives at Vmax as in B.
Landscapes
- Health & Medical Sciences (AREA)
- Life Sciences & Earth Sciences (AREA)
- Engineering & Computer Science (AREA)
- Biomedical Technology (AREA)
- Hematology (AREA)
- Chemical & Material Sciences (AREA)
- Physics & Mathematics (AREA)
- Urology & Nephrology (AREA)
- Immunology (AREA)
- Molecular Biology (AREA)
- General Physics & Mathematics (AREA)
- General Health & Medical Sciences (AREA)
- Food Science & Technology (AREA)
- Medicinal Chemistry (AREA)
- Pathology (AREA)
- Analytical Chemistry (AREA)
- Biochemistry (AREA)
- Ecology (AREA)
- Biophysics (AREA)
- Biotechnology (AREA)
- Cell Biology (AREA)
- Microbiology (AREA)
- Investigating Or Analysing Biological Materials (AREA)
- Investigating Or Analysing Materials By The Use Of Chemical Reactions (AREA)
Applications Claiming Priority (2)
| Application Number | Priority Date | Filing Date | Title |
|---|---|---|---|
| JP2020068877 | 2020-04-07 | ||
| PCT/JP2021/014697 WO2021206107A1 (fr) | 2020-04-07 | 2021-04-07 | Procédé de mesure du temps de coagulation du sang |
Publications (2)
| Publication Number | Publication Date |
|---|---|
| EP4134675A1 true EP4134675A1 (fr) | 2023-02-15 |
| EP4134675A4 EP4134675A4 (fr) | 2024-01-17 |
Family
ID=78024151
Family Applications (1)
| Application Number | Title | Priority Date | Filing Date |
|---|---|---|---|
| EP21785245.8A Pending EP4134675A4 (fr) | 2020-04-07 | 2021-04-07 | Procédé de mesure du temps de coagulation du sang |
Country Status (5)
| Country | Link |
|---|---|
| US (1) | US20230213497A1 (fr) |
| EP (1) | EP4134675A4 (fr) |
| JP (1) | JP7712020B2 (fr) |
| CN (1) | CN115443409A (fr) |
| WO (1) | WO2021206107A1 (fr) |
Families Citing this family (4)
| Publication number | Priority date | Publication date | Assignee | Title |
|---|---|---|---|---|
| WO2024143525A1 (fr) | 2022-12-28 | 2024-07-04 | 積水メディカル株式会社 | Méthode d'analyse de capacité de coagulation sanguine d'un échantillon sanguin |
| WO2024143524A1 (fr) | 2022-12-28 | 2024-07-04 | 積水メディカル株式会社 | Procédé d'analyse de la capacité de coagulation d'un échantillon sanguin |
| EP4650782A1 (fr) | 2023-01-13 | 2025-11-19 | Sekisui Medical Co., Ltd. | Procédé d'analyse de réaction de coagulation sanguine |
| CN121969938A (zh) | 2023-10-03 | 2026-05-01 | 积水医疗株式会社 | 凝血异常的因素的推断方法 |
Family Cites Families (14)
| Publication number | Priority date | Publication date | Assignee | Title |
|---|---|---|---|---|
| JPS5469497A (en) * | 1977-11-12 | 1979-06-04 | Kyoto Daiichi Kagaku Kk | Method and device for measuring blood solidification time |
| JPH04318463A (ja) * | 1991-04-17 | 1992-11-10 | Kyoto Daiichi Kagaku:Kk | 血液凝固時間の測定方法 |
| JP2934557B2 (ja) * | 1992-07-10 | 1999-08-16 | 国際試薬株式会社 | 血液凝固時間測定方法とその装置 |
| JP2938302B2 (ja) * | 1993-02-25 | 1999-08-23 | 国際試薬株式会社 | 血液凝固時間測定方法とその装置 |
| JP4334171B2 (ja) | 2001-12-03 | 2009-09-30 | シスメックス株式会社 | 血液凝固反応解析方法 |
| JP2008209350A (ja) * | 2007-02-28 | 2008-09-11 | Matsushita Electric Ind Co Ltd | 血液凝固時間測定装置 |
| JP5029638B2 (ja) | 2009-03-18 | 2012-09-19 | 株式会社島津製作所 | 血液凝固分析装置 |
| JP5889480B2 (ja) | 2013-04-02 | 2016-03-22 | 株式会社日立ハイテクノロジーズ | 自動分析装置及び分析方法 |
| JP6871673B2 (ja) * | 2015-03-31 | 2021-05-12 | 学校法人東日本学園 | 血液検体を判定するための方法、装置及びコンピュータプログラム、並びに血液検体分析装置 |
| JP7002718B2 (ja) * | 2017-04-24 | 2022-02-10 | シスメックス株式会社 | 血液検体の分析方法、分析装置及びコンピュータプログラム |
| JP7235282B2 (ja) * | 2017-11-07 | 2023-03-08 | 積水メディカル株式会社 | 血液凝固機能の評価方法 |
| EP4083630A4 (fr) * | 2019-12-26 | 2024-01-10 | Sekisui Medical Co., Ltd. | Procédé de mesure du temps de coagulation sanguine |
| US12566185B2 (en) * | 2020-03-06 | 2026-03-03 | Sekisui Medical Co., Ltd. | Blood coagulation time measurement method |
| CN116472354A (zh) * | 2020-10-29 | 2023-07-21 | 积水医疗株式会社 | 凝血反应的检测方法 |
-
2021
- 2021-04-07 EP EP21785245.8A patent/EP4134675A4/fr active Pending
- 2021-04-07 CN CN202180026835.2A patent/CN115443409A/zh active Pending
- 2021-04-07 WO PCT/JP2021/014697 patent/WO2021206107A1/fr not_active Ceased
- 2021-04-07 JP JP2022514099A patent/JP7712020B2/ja active Active
- 2021-04-07 US US17/995,682 patent/US20230213497A1/en active Pending
Also Published As
| Publication number | Publication date |
|---|---|
| JPWO2021206107A1 (fr) | 2021-10-14 |
| CN115443409A (zh) | 2022-12-06 |
| WO2021206107A1 (fr) | 2021-10-14 |
| JP7712020B2 (ja) | 2025-07-23 |
| EP4134675A4 (fr) | 2024-01-17 |
| US20230213497A1 (en) | 2023-07-06 |
Similar Documents
| Publication | Publication Date | Title |
|---|---|---|
| EP4134675A1 (fr) | Procédé de mesure du temps de coagulation du sang | |
| US12566185B2 (en) | Blood coagulation time measurement method | |
| JP7402468B2 (ja) | 血液検体の血液凝固特性の分析方法 | |
| JP7235282B2 (ja) | 血液凝固機能の評価方法 | |
| US7663738B2 (en) | Method for automatically detecting factors that disturb analysis by a photometer | |
| EP3882628B1 (fr) | Procede d'analyse pour analyser les caractéristiques de coagulation d'un spécimen sanguin | |
| EP4083630A1 (fr) | Procédé de mesure du temps de coagulation sanguine | |
| EP4303586A1 (fr) | Procédé d'estimation de facteur de temps de coagulation prolongé | |
| JP7220055B2 (ja) | 血液凝固機能の評価方法 | |
| EP3555632B1 (fr) | Détermination de bilirubine dans un échantillon | |
| JP7458037B2 (ja) | 凝固因子インヒビター力価の測定方法 | |
| JP4464534B2 (ja) | 破砕赤血球の測定方法 | |
| EP4239078A1 (fr) | Procédé de détection d'une réaction de coagulation sanguine | |
| EP4397978A1 (fr) | Méthode de détection d'anomalie de réaction de coagulation sanguine | |
| CN121969938A (zh) | 凝血异常的因素的推断方法 | |
| US12130236B2 (en) | Method for creating a database for determining a light transmission aggregometry reference value, and method and device for carrying out a light transmission aggregometry measurement | |
| US20040219680A1 (en) | Method and apparatus for determining anticoagulant therapy factors | |
| EP1588164B1 (fr) | Amelioration de la qualité d'une analyse hématologique | |
| JPS58172537A (ja) | 光散乱測定装置 | |
| CA1062501A (fr) | Methode et appareil pour depister les deficiences au niveau des reactions enzymatiques et particullerement les taux de facteurs de coagulation dans le plasma sanguin | |
| Tunjić et al. | Utječe li lipemija na najčešće koagulacijske pretrage? | |
| EP1473568A2 (fr) | Procédé et appareil pour déterminer des facteurs de thérapie d'anticoagulation | |
| Weber et al. | Evaluation of the SureStep® Pro Blood Glucose Analyzer for Point-of-Care Testing in Neonates. |
Legal Events
| Date | Code | Title | Description |
|---|---|---|---|
| STAA | Information on the status of an ep patent application or granted ep patent |
Free format text: STATUS: THE INTERNATIONAL PUBLICATION HAS BEEN MADE |
|
| PUAI | Public reference made under article 153(3) epc to a published international application that has entered the european phase |
Free format text: ORIGINAL CODE: 0009012 |
|
| STAA | Information on the status of an ep patent application or granted ep patent |
Free format text: STATUS: REQUEST FOR EXAMINATION WAS MADE |
|
| 17P | Request for examination filed |
Effective date: 20221019 |
|
| AK | Designated contracting states |
Kind code of ref document: A1 Designated state(s): AL AT BE BG CH CY CZ DE DK EE ES FI FR GB GR HR HU IE IS IT LI LT LU LV MC MK MT NL NO PL PT RO RS SE SI SK SM TR |
|
| DAV | Request for validation of the european patent (deleted) | ||
| DAX | Request for extension of the european patent (deleted) | ||
| A4 | Supplementary search report drawn up and despatched |
Effective date: 20231214 |
|
| RIC1 | Information provided on ipc code assigned before grant |
Ipc: G16H 50/30 20180101ALI20231208BHEP Ipc: G01N 33/49 20060101ALI20231208BHEP Ipc: G01N 33/86 20060101AFI20231208BHEP |
|
| STAA | Information on the status of an ep patent application or granted ep patent |
Free format text: STATUS: EXAMINATION IS IN PROGRESS |
|
| 17Q | First examination report despatched |
Effective date: 20250515 |