EP4359877B1 - Procédé et système d'amélioration du processus de production dans une installation technique - Google Patents
Procédé et système d'amélioration du processus de production dans une installation technique Download PDFInfo
- Publication number
- EP4359877B1 EP4359877B1 EP22786002.0A EP22786002A EP4359877B1 EP 4359877 B1 EP4359877 B1 EP 4359877B1 EP 22786002 A EP22786002 A EP 22786002A EP 4359877 B1 EP4359877 B1 EP 4359877B1
- Authority
- EP
- European Patent Office
- Prior art keywords
- phase
- test
- data
- anomaly
- phases
- Prior art date
- Legal status (The legal status is an assumption and is not a legal conclusion. Google has not performed a legal analysis and makes no representation as to the accuracy of the status listed.)
- Active
Links
Images

Classifications
-
- G—PHYSICS
- G05—CONTROLLING; REGULATING
- G05B—CONTROL OR REGULATING SYSTEMS IN GENERAL; FUNCTIONAL ELEMENTS OF SUCH SYSTEMS; MONITORING OR TESTING ARRANGEMENTS FOR SUCH SYSTEMS OR ELEMENTS
- G05B19/00—Program-control systems
- G05B19/02—Program-control systems electric
- G05B19/418—Total factory control, i.e. centrally controlling a plurality of machines, e.g. direct or distributed numerical control [DNC], flexible manufacturing systems [FMS], integrated manufacturing systems [IMS] or computer integrated manufacturing [CIM]
- G05B19/41875—Total factory control, i.e. centrally controlling a plurality of machines, e.g. direct or distributed numerical control [DNC], flexible manufacturing systems [FMS], integrated manufacturing systems [IMS] or computer integrated manufacturing [CIM] characterised by quality surveillance of production
-
- G—PHYSICS
- G05—CONTROLLING; REGULATING
- G05B—CONTROL OR REGULATING SYSTEMS IN GENERAL; FUNCTIONAL ELEMENTS OF SUCH SYSTEMS; MONITORING OR TESTING ARRANGEMENTS FOR SUCH SYSTEMS OR ELEMENTS
- G05B23/00—Testing or monitoring of control systems or parts thereof
- G05B23/02—Electric testing or monitoring
- G05B23/0205—Electric testing or monitoring by means of a monitoring system capable of detecting and responding to faults
- G05B23/0218—Electric testing or monitoring by means of a monitoring system capable of detecting and responding to faults characterised by the fault detection method dealing with either existing or incipient faults
- G05B23/0224—Process history based detection method, e.g. whereby history implies the availability of large amounts of data
- G05B23/024—Quantitative history assessment, e.g. mathematical relationships between available data; Functions therefor; Principal component analysis [PCA]; Partial least square [PLS]; Statistical classifiers, e.g. Bayesian networks, linear regression or correlation analysis; Neural networks
-
- G—PHYSICS
- G05—CONTROLLING; REGULATING
- G05B—CONTROL OR REGULATING SYSTEMS IN GENERAL; FUNCTIONAL ELEMENTS OF SUCH SYSTEMS; MONITORING OR TESTING ARRANGEMENTS FOR SUCH SYSTEMS OR ELEMENTS
- G05B2219/00—Program-control systems
- G05B2219/30—Nc systems
- G05B2219/32—Operator till task planning
- G05B2219/32187—Correlation between controlling parameters for influence on quality parameters
-
- G—PHYSICS
- G05—CONTROLLING; REGULATING
- G05B—CONTROL OR REGULATING SYSTEMS IN GENERAL; FUNCTIONAL ELEMENTS OF SUCH SYSTEMS; MONITORING OR TESTING ARRANGEMENTS FOR SUCH SYSTEMS OR ELEMENTS
- G05B2219/00—Program-control systems
- G05B2219/30—Nc systems
- G05B2219/32—Operator till task planning
- G05B2219/32201—Build statistical model of past normal proces, compare with actual process
Definitions
- the invention relates to a method and a corresponding system for improving the production process in a technical plant in which a process engineering process with at least one process step is carried out.
- the invention further relates to an associated computer program and computer program product.
- Process engineering deals with the technical and economic implementation of all processes in which substances or raw materials are modified according to their type, properties, and composition.
- process engineering facilities such as refineries, steam crackers, or other reactors are used, where the process is usually carried out using automation technology.
- Process engineering processes are generally divided into two groups: continuous processes and discontinuous, so-called batch processes.
- a complete production process i.e., starting from specific reactants to the finished product, can also be a mixture of both process groups.
- the continuous process runs without interruptions. It is a flow process, meaning there is a constant inflow or outflow of material, energy, or information. Continuous processes are preferred for processing large quantities with few product changes.
- An example would be a power plant that generates electricity or a refinery that extracts fuel from crude oil.
- Discontinuous processes are all batch processes that run according to recipes in a batch-oriented manner, for example, according to ISA-88. These recipes contain the information, which process steps are carried out sequentially or in parallel to produce a specific product with specific quality requirements. Materials or substances are often used at different times, in portions and non-linearly within the respective sub-process. This means that the product passes through one or more reactors and remains there until the reaction is complete and the next production or process step can be carried out. Batch processes therefore generally run step by step with at least one process step.
- the process steps can therefore run on different units (physical devices in which the process is executed) and/or with different control strategies and/or different quantities. Sequential functional control (SFC) or step chains are often used.
- a process step is the smallest unit of a process model.
- a so-called phase or function corresponds to a process step.
- Such phases can run sequentially (heating the reactor, stirring within the reactor, and cooling the reactor) or in parallel, such as “stirring” and "maintaining a constant temperature.”
- a batch process typically contains several process steps or phases.
- a process step or phase runs under optimal conditions in the context of a specific recipe, with a given control strategy, and in a specific sub-plant or plant unit. It is further expected that each run of this batch phase is identical. Furthermore, All measurements connected to the system show the same trend (time series of a sensor value), starting from the start time of the phase to the end time of the phase. This behavior can be referred to as a "golden batch.”
- a golden batch thus indicates the best production status achieved to date in terms of quality, quantity, runtime, and minimum possible waste.
- a common method for detecting problems in batch processes is monitoring process values using alarm thresholds. If a threshold for a specific process value is violated, the plant operator is notified by the process control system. Setting these thresholds is very complex, and multivariate deviations within the univariate thresholds cannot be detected.
- a second way to identify problems in batch processes is to evaluate laboratory measurements of the finished product. If a laboratory measurement is outside the quality specifications, process engineers can review trend data from the corresponding batch phases. Ultimately, it is the job of process experts to determine the cause of a specific problem and initiate measures to resolve the issue and prevent it from occurring in the future. This approach to root cause determination is very costly and requires qualified and experienced process experts.
- Another disadvantage is that if the problem is discovered due to an out-of-process laboratory measurement, there is already a time lag between the phase in which the problem was discovered and the current phase of production. This means that production problems are often discovered too late and after the fact.
- EP 3 726 318 A1 A computer-implemented method for controlling a technical device in which a batch process is running is known.
- a control module accesses a reference time series (R, R(1), R(2)) with data from a previously performed batch run. This reference time series is related to a parameter (660-1) of the technical device.
- the control module receives a production time series (P) with data, identifies a subseries (R(1)A, R(2)A) of the reference time series (R, R(1), R(2)), and compares the received time series (P) with this subseries. This comparison provides an indication of the similarity or dissimilarity between the time series. If similarity is determined, the module controls the technical devices during the continuation of the production run by using the parameter (660-1) as a control parameter and/or providing the operator with a recommendation from the reference time series for adjusting the parameter.
- the object of the present invention to provide a data-based, simple method and system for improving the production process for batch processes, which, in particular, allows a user to easily determine "golden batches” and, based on these, offer further analyses of the production process, and which does not require complex physical modeling of complex nonlinear dynamic processes.
- the invention is based on the object of providing a suitable computer program and computer program product.
- Embodiments of the invention which can be used individually or in combination with one another are the subject of the subclaims.
- the basic idea of the present invention is to use a data model-based determination of a similarity measure to obtain more detailed information and analyses about the production process from batch process step runs in order to optimize the production process.
- Data-driven anomaly detection is typically used to detect deviations from the normal state.
- anomaly detection is used to calculate the phase similarities between the current phase run and historical phase runs for process optimization.
- the invention accordingly relates to a method and system for improving the production process in a technical plant in which a process engineering process with at least one process step takes place, wherein data records characterizing a run of a process step with values of process variables are recorded time-dependently and stored in a data memory.
- multivariate trend data from multiple runs of a process step are used to train a model for detecting anomalies.
- the data records of one run are selected as the test phase and the data records of at least one further run are selected as the reference phase.
- the model for detecting anomalies is used to determine a deviation between the process values of the test and reference phases for each time stamp of the test phase and is weighted with a tolerance for the anomaly detection. From the weighted deviations between the process values of the test and reference phases, anomaly states are identified and evaluated, by means of which a phase similarity measure of the test phase in comparison to a reference phase is calculated, which is used for the analysis and subsequent optimization of the process.
- the advantages of the method and system according to the invention are manifold, because the determination of the phase similarity measure can be used and combined in many different ways.
- the known data of the Historical reference phases can be used to make statements about optimizing future test phases.
- the historical reference phase is a process step that results in high-quality products (e.g., a synthetic material with high purity)
- the set control and operating parameters for this process step can be reproduced.
- phase similarity can also be used to perform robust anomaly detection based on the deviations detected between the test and reference phases.
- the effort required for modeling is completely eliminated.
- the learning process of the data model used can advantageously be largely automated. If few or no historical data sets are available, a single reference phase is generally sufficient to make initial rough statements about existing anomalies. Since the invention is particularly suitable for batch processes, it can be advantageously used within the pharmaceutical industry in the production of medications or vaccines.
- the method according to the invention also has the advantage of analyzing new data from batch phases that were not used during model training.
- These new data sets can be data sets from a phase that has already been completed or from a phase that is currently running. In the latter case, the system compares the phases up to the current relative timestamp, whereby the relative timestamp is always measured from the beginning of the phase.
- metadata of the reference phases are taken into account in the optimization of the process by creating a correlation between the phase similarity measure of the test phase and the reference phase with the metadata of the reference phase and, based on this correlation, determining statements about the test phase and/or a root cause analysis is carried out based on the metadata.
- the method according to the invention offers a completely new type of root cause analysis.
- the metadata of a historical reference phase can, for example, identify data on the quality of a historical run or contain data on errors that occurred or data on the energy consumed during the run. If, for example, a problem occurs a second time, this metadata provides important information for a rapid root cause analysis (in comparison to the current situation).
- the most similar historical runs of the phase can be determined using the method according to the invention.
- a process engineer can analyze the difference (e.g. in the trend data) between these most similar historical runs and the current run. Focusing on a few similar historical runs also allows a rapid root cause analysis in this case.
- the metadata provides important information for a faster root cause analysis (compared to the current situation).
- the method according to the invention can be used to find the most similar historical runs of the phase compared to a test phase.
- a process engineer can analyze the difference (e.g., in the trend data) between these most similar historical runs and the current run. If only a few similar historical runs are considered, the root cause analysis can be accelerated.
- Another advantage of the method according to the invention is that the model training does not require metadata.
- a system according to the invention can be built completely without historical records of metadata, which significantly reduces the effort for system implementation in a plant. reduced.
- this metadata can be used as labels for model training, e.g., to balance the number of "good” (usually, most runs are good) runs with the small number of error or "bad” runs using standard techniques such as oversampling or sample weights.
- the anomaly states are calculated by determining, time stamp by time stamp, the magnitude of the differences or mathematical distances of the process variables, their tolerances, and/or the difference in the runtimes of the phases for identical process variables in the test and reference phases for each process step. This is a particularly simple and robust approach.
- the anomaly states are evaluated using weightings and/or averaging and/or categories. This allows individual influencing factors to be evaluated in terms of their importance. This advantageously results in certain anomaly states having a greater influence on the result of the phase similarity measure.
- the evaluation of the anomaly states follows a previously defined hierarchy.
- a decision strategy can be advantageously implemented as to how certain deviations should be weighted. For example, the different durations of the runs of the test and reference phases can be given greater weight than the fact which value of the process variable is greater or smaller than the comparable value per timestamp. If sensor-related deviations or uncertainties determine the run, this can be compared to the different phase runs according to the circumstances. of the system. This advantageously allows for a flexible calculation of the phase similarity measure, adapted to the respective situation and system.
- similar phases are grouped based on the calculated phase similarity metrics, and a root cause analysis is performed for the grouping using the metadata. This allows, for example, a first approximation to draw conclusions about a systematic error or an indication of very well-adjusted operating parameters of the technical system. If several similar phases are correlated with similar metadata, initial indications of a specific behavior can be consolidated.
- the phase similarity measure is ranked, and the phases with the highest agreement between test and reference phases are displayed on the display unit.
- This display can also be combined with the display of metadata of the corresponding reference phase. In this way, it is advantageous to trace which parameters have a particular influence on the similarity between the test and reference phases.
- system can refer to a hardware system, such as a computer system consisting of servers, networks, and storage units, or a software system, such as a software architecture or a larger software program.
- a hardware system such as a computer system consisting of servers, networks, and storage units
- a software system such as a software architecture or a larger software program.
- An IT infrastructure such as a cloud structure with its services.
- Components of such an infrastructure are typically servers, storage, networks, databases, software applications and services, data directories, and data management systems.
- Virtual servers in particular, also belong to a system of this type.
- the system according to the invention can also be part of a computer system that is spatially separate from the location of the technical system.
- the connected external system then advantageously has the evaluation unit, which can access the components of the technical system and/or the associated data storage devices, and which is designed to visualize the calculated results and transmit them to a display unit.
- the evaluation unit can access the components of the technical system and/or the associated data storage devices, and which is designed to visualize the calculated results and transmit them to a display unit.
- Local implementations on computer systems of the technical plant can also be advantageous.
- an implementation on a server of the process control system or on-premise, i.e., within a technical plant, is particularly suitable for safety-relevant processes.
- the method according to the invention is thus preferably implemented in software or in a software/hardware combination, so that the invention also relates to a computer program with computer-executable program code instructions for implementing the diagnostic method.
- the invention also relates to a computer program product, in particular a data carrier or a storage medium, with such a computer-executable computer program.
- a computer program can, as described above, be loaded into a memory of a server of a process control system, so that the monitoring of the operation of the technical system is carried out automatically, or the computer program can be stored in a memory of a remote service computer or be loadable into it in the case of cloud-based monitoring of a technical system.
- GUI graphical user interface
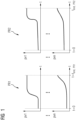
- Fig. 1 simplified and schematic graphs with multivariate time series data of a batch process step for two runs are shown.
- the trends or time series of different process variables pv for a first run PR1 of a process step or phase are shown.
- the trends or time series of the same process variables pv for a second run PR2 of the same process step or phase are shown.
- the term time series presupposes that data is not generated continuously, but discretely (at specific time stamps), but at finite time intervals.
- a large number of data records of process variables pv which characterize the operation of the plant, are recorded as a function of time t and stored in a data storage device (often an archive).
- Time-dependent here therefore means either at specific individual points in time with time stamps or with a sampling rate at regular intervals or almost continuously.
- the data sets of the first run PR1 therefore contain n process variables pv with the corresponding time stamps, where n is any natural number.
- Process variables are usually recorded using sensors. Examples of process variables are temperature T, pressure P, flow rate F, fill level L, density or gas concentration of a medium.
- pv1(t) (pv1 (t1), pv1(t2), pv1(t3) ... pv1 (tN)) where N is any natural number and corresponds to the number of time stamps in a process step.
- one process step of a batch process is designated as a test phase tp and at least one process step as a reference phase rf is selected.
- a pairwise similarity between the test phase tp and at least one of the reference phases is then determined.
- anomaly states are identified as (see Fig. 2 ) of the test phase tp with respect to each existing reference phase rp:
- the detection of anomaly states in multivariate data is often carried out using a data-based anomaly detection model, such as that used in EP 3 282 399 B1 is known.
- the detection of process anomalies is performed purely data-based using so-called "self-organizing maps" (SOMs).
- SOMs self-organizing maps
- anomaly detection is not limited to this type of model.
- Another data-driven model such as a neural network or another machine learning model, can also be used. It should be emphasized that the model must be able to make its anomaly statement with respect to a reference phase and not generally with respect to a learned normal data distribution.
- the model used should fundamentally represent the process behavior. If the model is trained with historical "good” data, it represents the normal behavior of the process. Training with historical "bad” data is also possible to represent faulty process behavior. This means that any process behavior can be represented based on the historical data. The only requirement is that the trained data is representative of all operating modes and events occurring during operation.
- Good data can be determined by reviewing historical batch phases by process experts or by analyzing, for example, the laboratory values of the batch process product to derive the conditions under which historical runs of the phase can be considered good.
- multivariate trend data from several runs of the phase (cf. Fig. 1 ) are used to train the anomaly detection model. Specifically, this means that the model knows the tolerance of the process based on historical fluctuations in the multivariate trend data.
- the anomaly detection model therefore requires the following input data: The multivariate trend data of a test batch phase (new data) and the multivariate trend data of at least one reference batch phase (historical data).
- the corresponding phase pairs can be selected by a user in one embodiment or can be determined automatically based on existing quality data.
- the test phase will usually be a phase of a current run, but it is also conceivable that any run of the corresponding phase is used as the test phase.
- For the reference phase a historical phase run is used as an additional run.
- the anomaly detection model is used to determine the deviation between the process values of the test and reference phases for each timestamp of the test phase and weighted with an anomaly detection tolerance.
- the result corresponds to a weighted deviation between the process values of the test and reference phases, which can be converted into preliminary anomaly states using threshold values.
- filters can be applied to the weighted deviation.
- Temporal deviations between the process values of the test and reference phases are then analyzed. Finally, this results in a multivariate trend of anomaly states of the test phase with respect to the reference phase, which in turn is converted into the phase similarity measure.
- the anomaly state of the corresponding timestamp is evaluated with a similarity count or a similarity degree of, for example, 1, and the anomaly state of this timestamp receives this value. If there is a deviation, the anomaly state of the corresponding timestamp is evaluated with a similarity degree of 0 in this exemplary embodiment, and the anomaly state of this timestamp receives this value.
- the phase similarity measure for a process variable can then be calculated as the sum of the individual assessed anomaly states of the individual timestamps of the test phase divided by the number of timestamps of the test phase. (Optionally, the anomaly states without assessment can also be used.) For multiple process variables, the sum measure is calculated across all anomaly states of the process variables.
- the "overall" phase similarity measure can now be calculated, for example, as the average of the similarity measures of the individual process variables. Alternatively, it is also conceivable that the worst similarity measure is displayed as the "overall" phase similarity measure, so that the probability that the similarity between the test and reference phases is better is certainly higher.
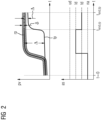
- Figure 2 shows a simplified example of the procedure for calculating anomaly states using two graphs.
- the upper graph shows the trend of a test phase tp and the trend of a reference phase rp with its tolerance 2 ⁇ for a process variable pv and a selected process step.
- the last valid value of the process variable of the reference phase is retained until the end time of the test phase, and the tolerance band is continued in the same way.
- the lower graph of Fig. 2 the anomaly state as is also plotted against time t.
- the lower graph shows the anomaly state as in a simplified manner for a single process value pv plotted against time.
- the respective deviations ⁇ between the data sets comprising the one process variable pv of the test phase tp and the data sets comprising the one process variable pv of the reference phase rp were calculated and the result assigned to the respective category.
- there is no anomaly or the deviation is below a threshold value.
- These anomaly states are assigned to the category na.
- the anomaly states of the subsequent time stamps are assigned to the category ld, since per time stamp the process value of the test phase is smaller than the corresponding process value of the reference phase.
- the anomaly states of the timestamps following this category are assigned to the td category, since differences exist between the duration of the test and reference phases.
- anomaly states are categorical quantities. For example, short spikes in process values due to a network problem that have no impact on the process (only an incorrect sensor reading from the system, but not an incorrect process value at the physical plant). Other similarity measures such as the Euclidean distance or the Manhattan distance would be very sensitive to these short random spikes. The approach described above is robust to these fluctuations because each timestamp has only a limited similarity value.
- further ratings can be assigned to the anomaly states, such as the duration of the test phase being shorter than expected or a rating for anomaly states where the deviation is exceptionally large (outliers), or a weighting that takes into account the number of deviating process values per timestamp.
- individual weightings can be assigned to the individual categories of anomaly states.
- a hierarchy or a tree structure can be created.
- the anomaly states of all process variables of the test and reference phases are statistically evaluated jointly depending on the time stamps and analyzed and evaluated according to a hierarchy.
- the phase similarity between the runs of the test and reference phases can, for example, be determined by a Hierarchy characterizing summands plus a scaling factor (determines the order within a hierarchy level). For example, if there are no sensor deviations (ie all anomaly states can be assigned to the category na of the Fig.2 assigned) or there are no temporal deviations between the data sets of the process variables of the test and reference phase, the phase similarity can be calculated by a value + (1- weighted deviation between test and reference phase averaged over all timestamps and process variables / maximum deviation) * 0.1.
- phase similarity measure is determined, which is used to optimize the process.
- the phase similarity measure can advantageously be normalized to values between zero and one for better comparability.
- the calculated phase similarity metrics can now be used to perform valuable statistical analysis.
- the reference phases with the greatest similarity to the test phase can be displayed. This can be ranked or sorted.
- the calculated phase similarity metrics can support and accelerate root cause analysis, for example, of symptoms of a faulty production process in batch processes.
- phase similarity measure preferably normalized to [0, 1]
- runs of different reference phases here, runs 1 to 3
- Similarity measure to run 4 Historical records Run 1 0.72 Phase OK.
- Run 2 0.98 Valve V2 clogged, needs to be cleaned Run 3 0.66 Phase OK.
- the information from the reference phase can also include, for example, unique identifiers, precise start and end times of the historical run, and metadata of the historical run.
- a quality statement from the reference run can be derived from the product quality previously determined in the laboratory.
- the metadata can contain records of failures in the corresponding run (e.g., clogged valve) or initial solutions (e.g., valve cleaning required). Records about energy consumption, material consumption, material properties or other historical comments recorded by plant operators or process engineers for the reference run under consideration are conceivable.
- Metadata can also be configured for each use case.
- metadata can originate from different information sources and can be accessed either manually or automatically.
- FIG. 3 There, an embodiment of a system S is shown which is designed to carry out the method according to the invention.
- the system S comprises two units for storing data.
- the data memory Sp1 contains a large number of historical data records with the multivariate trends of the phase runs. All historical data records, data records containing values from a large number of process variables with corresponding time stamps, can be used to learn the model for anomaly determination.
- a separate unit L (not shown) can also be provided for training the model for anomaly determination, which unit uses the historical data records with time-dependent measured values of process variables and is connected to the data memory Sp1 for this purpose.
- This unit L can advantageously be operated offline, since the learning process is often computationally intensive, which is particularly the case when data records from many reference phases are available.
- the computing unit C is connected to the memory unit Sp1.
- the computing unit C is part of an evaluation unit A.
- Different units A and C are conceivable, or only one unit in the form of a server, which combines all functions (calculation and evaluation) in one application.
- the evaluation unit A and/or the computing unit C can also be connected to a control system of a technical plant TA or a computer of a technical sub-plant TA, in which a process engineering process with at least one process step runs, via a communication interface, via which the multivariate data records of the test phase runs are transmitted (e.g. on request).
- an automation system or a process control system controls, regulates and/or monitors a process engineering process.
- the process control system is connected to a large number of field devices (not shown). Measuring transducers and sensors are used to record process variables, such as temperature T, pressure P, flow rate F, fill level L, density or gas concentration of a medium.
- phase similarity measures are displayed on the user interface of a display unit B for visualization.
- the display unit B can also be connected directly to the system or, depending on the implementation, can be connected to the system via a data bus, for example.
- the phase similarity measures are displayed on the user interface in conjunction with metadata.
- the display unit B is connected to the storage unit Sp2, in which the metadata of the reference phases or the historical runs of the phases are stored.
- a communication connection between the evaluation unit A and/or the calculation unit C is also conceivable in order to calculate correlations between the metadata and the phase similarity measure.
- the user interface of the control unit displays the reference phases with the highest degree of agreement with the test phases.
- the associated metadata of the reference phases is displayed.
- a system user or operator O or a process expert can review the result and determine the cause of problems.
- the dashed lines f1 and f2 indicate feedback to the metadata store, which is either automatically retrieved from available data sources such as the control system of the technical plant TA or generated by comments from the system user O. This means that a system user O can enter comments or metadata records in an input field of the user interface during the root cause analysis for the test phase currently being analyzed. By storing this metadata, the system becomes more intelligent over time and can be considered a self-learning system.
- a configurable selection of the temporal profiles of the process variables and/or anomaly states of the test and reference phases are displayed simultaneously and/or in correlation to one another as temporal profiles on a display unit. This facilitates monitoring of the process engineering process for a plant operator or the operator of a software application according to the invention.
- a configurable selection of results is particularly advantageous in order to be able to work efficiently on troubleshooting using the displayed results. Appropriate display allows plant operators to react quickly in critical situations and avoid errors. Fast interaction can save costs and time and avert more serious dangers.
- the system S for implementing the method according to the invention can, for example, also be implemented in a client-server architecture.
- the server with its data storage, serves to provide certain services, such as the system according to the invention, for processing a precisely defined task (here, the calculation of the phase similarity measure).
- the client here, the display unit B
- Typical servers are web servers for providing web page content, database servers for storing data, or application servers for providing programs.
- the interaction between the server and client takes place via suitable communication protocols such as http or jdbc.
- Another possibility is to use the method as an application in a cloud environment (e.g., Siemens MindSphere), with one or more servers hosting the inventive system in the cloud.
- the system can be implemented as an on-premise solution directly on the technical system, enabling a local connection to databases and computers at the control system level.
Landscapes
- Engineering & Computer Science (AREA)
- Physics & Mathematics (AREA)
- General Physics & Mathematics (AREA)
- Automation & Control Theory (AREA)
- General Engineering & Computer Science (AREA)
- Manufacturing & Machinery (AREA)
- Quality & Reliability (AREA)
- Artificial Intelligence (AREA)
- Evolutionary Computation (AREA)
- Mathematical Physics (AREA)
- Testing And Monitoring For Control Systems (AREA)
Claims (10)
- Procédé d'amélioration de l'opération de production dans une installation technique, dans laquelle se déroule une opération de la technique de procédé ayant au moins un stade opératoire,
dans lequel on saisit, en fonction du temps (t0, t1, ..., tN) par des valeurs de variables (pv1, pv2, ..., pvn) opératoires, des ensembles de données caractérisant un passage (PR1, PR2) d'un stade opératoire et on les met dans une mémoire de données, caractérisé- en ce que l'on utilise des données de séparation multivariates de plusieurs passages d'un stade opératoire pour entraîner un modèle d'identification d'anomalies,- en ce que, par stade opératoire, on choisit les ensembles de données d'un passage (PR1) comme phase (tp) de test et les ensembles de données d'au moins un autre passage (PR2) comme phase (rp) de référence,- en ce que, pour chaque paire de passages, au moyen du modèle d'identification d'anomalies, on détermine, pour chaque estampille temporelle de la phase de test, un écart entre les valeurs opératoires de phase de test et de la phase de référence, et on le pondère par une détection de tolérance de l'anomalie,- en ce que l'on détermine et on évalue les états d'anomalie à partir des écarts pondérés entre les valeurs opératoires de la phase de test et de la phase de référence,- en ce que, au moyen des états d'anomalie évalués, on calcule une mesure de similitude de phase de la phase de test par rapport à une phase de référence, que l'on utilise pour l'analyse et ensuite l'optimisation de l'opération. - Procédé suivant la revendication 1,
caractérisé
en ce que l'on prend en compte des métadonnées des phases de référence lors de l'optimisation de l'opération, en établissant une corrélation entre la mesure de similitude de phase entre la phase de test et la phase de référence avec les métadonnées de la phase de référence et, sur la base de cette corrélation, on détermine des informations sur la phase de test et/ou on effectue une analyse de cause à l'aide des métadonnées. - Procédé suivant la revendication 1 ou 2,
caractérisé
en ce que le calcul des états d'anomalie s'effectue par le fait que, par stade opératoire, pour de mêmes variables opératoires de la phase de test et de la phase de référence, on détermine, estampille temporelle par estampille temporelle, la valeur des différences ou des distances mathématiques entre les valeurs des variables opératoires des phases envisagées, leur tolérance et/ou la différence des temps de parcours des phases. - Procédé suivant la revendication 1, 2 ou 3,
caractérisé
en ce que l'on effectue l'évaluation des états d'anomalie au moyen de pondérations et/ou de formations de moyennes et/ou de catégories. - Procédé suivant la revendication 1, 2 ou 3,
caractérisé
en ce que l'on effectue l'évaluation des états d'anomalie d'une hiérarchie définie à l'avance. - Procédé suivant l'une des revendications précédentes, caractérisé
en ce que l'on regroupe des phases semblables sur la base d'une mesure de similitude de phase et on effectue, pour le regroupement, une analyse de causes au moyen des métadonnées. - Procédé suivant l'une des revendications précédentes, caractérisé
en ce qu'un classement de la mesure de similitude de phase et on affiche les phases ayant la plus grande coïncidence entre la phase de test et la phase de référence. - Système (S) d'amélioration de l'opération de production dans une installation technique, dans laquelle se déroule une opération de la technique de procédé ayant au moins un stade opératoire, comprenant au moins :- une unité (Sp1, Sp2) de mise en mémoire d'ensembles de données historiques par des valeurs de variables (pv1, pv2,..., pvn) déterminées en fonction du temps (t0, t1, ..., tN), qui caractérisent un passage (Run1) d'un stade opératoire (Phase), et/ou de mise en mémoire de métadonnées, qui sont en liaison avec les ensembles de données historiques, et/ou de mise en mémoire de tolérance d'états d'anomalie, de similitudes de phase et/ou d'autres données, qui sont nécessaires pour effectuer le procédé suivant l'une des revendications 1 à 7,- une unité (C) informatique, qui est reliée à la au moins une unité (Sp1, Sp2) de mémoire et qui est constituée pour calculer les stades du procédé suivant l'une des revendications 1 à 7,- une unité (A) d'analyse d'ensemble de données en cours d'un passage d'une phase (tp) de test à l'aide de l'unité (C) informatique, et- une unité (B) d'affichage et d'édition des résultats de l'analyse déterminés au moyen de l'unité (A) d'analyse.
- Programme d'ordinateur, en particulier application logicielle, comprenant des instructions de code de programme, exécutables par ordinateur pour la mise en œuvre du procédé suivant l'une des revendications 1 à 7, lorsque le programme d'ordinateur est exécuté sur un ordinateur.
- Produit de programme d'ordinateur, en particulier support de données ou support de mémoire, comprenant un programme d'ordinateur, exécutable par ordinateur suivant la revendication 9.
Applications Claiming Priority (2)
| Application Number | Priority Date | Filing Date | Title |
|---|---|---|---|
| EP21197160.1A EP4152113A1 (fr) | 2021-09-16 | 2021-09-16 | Procédé et système d'amélioration du processus de production dans une installation technique |
| PCT/EP2022/075649 WO2023041647A1 (fr) | 2021-09-16 | 2022-09-15 | Procédé et système pour améliorer le processus de production dans une installation technique |
Publications (3)
| Publication Number | Publication Date |
|---|---|
| EP4359877A1 EP4359877A1 (fr) | 2024-05-01 |
| EP4359877C0 EP4359877C0 (fr) | 2025-05-14 |
| EP4359877B1 true EP4359877B1 (fr) | 2025-05-14 |
Family
ID=77801592
Family Applications (2)
| Application Number | Title | Priority Date | Filing Date |
|---|---|---|---|
| EP21197160.1A Withdrawn EP4152113A1 (fr) | 2021-09-16 | 2021-09-16 | Procédé et système d'amélioration du processus de production dans une installation technique |
| EP22786002.0A Active EP4359877B1 (fr) | 2021-09-16 | 2022-09-15 | Procédé et système d'amélioration du processus de production dans une installation technique |
Family Applications Before (1)
| Application Number | Title | Priority Date | Filing Date |
|---|---|---|---|
| EP21197160.1A Withdrawn EP4152113A1 (fr) | 2021-09-16 | 2021-09-16 | Procédé et système d'amélioration du processus de production dans une installation technique |
Country Status (4)
| Country | Link |
|---|---|
| US (1) | US20240411300A1 (fr) |
| EP (2) | EP4152113A1 (fr) |
| CN (1) | CN117940863A (fr) |
| WO (1) | WO2023041647A1 (fr) |
Families Citing this family (2)
| Publication number | Priority date | Publication date | Assignee | Title |
|---|---|---|---|---|
| CN120762377B (zh) * | 2025-07-11 | 2026-02-24 | 深圳市利和兴股份有限公司 | 一种陶瓷电容叠层机远程控制方法及系统 |
| CN120724364B (zh) * | 2025-08-29 | 2025-10-31 | 江西环林集团股份有限公司 | 一种生产数据异常分析方法及系统 |
Family Cites Families (4)
| Publication number | Priority date | Publication date | Assignee | Title |
|---|---|---|---|---|
| US7793292B2 (en) * | 2006-09-13 | 2010-09-07 | Fisher-Rosemount Systems, Inc. | Compact batch viewing techniques for use in batch processes |
| EP3282399B1 (fr) | 2016-08-11 | 2020-05-13 | Siemens Aktiengesellschaft | Procede de reconnaissance ameliore d'anomalies de processus d'une installation technique et systeme de diagnostic correspondant |
| EP3690581B1 (fr) * | 2019-01-30 | 2021-02-17 | Bühler AG | Système et procédé de détection et de mesure des anomalies de la signalisation provenant de composants utilisés dans des processus industriels |
| EP3726318B1 (fr) * | 2019-04-17 | 2022-07-13 | ABB Schweiz AG | Détermination mise en uvre par ordinateur d'un indicateur de qualité d'un cycle de lot de production en cours |
-
2021
- 2021-09-16 EP EP21197160.1A patent/EP4152113A1/fr not_active Withdrawn
-
2022
- 2022-09-15 WO PCT/EP2022/075649 patent/WO2023041647A1/fr not_active Ceased
- 2022-09-15 EP EP22786002.0A patent/EP4359877B1/fr active Active
- 2022-09-15 US US18/691,726 patent/US20240411300A1/en active Pending
- 2022-09-15 CN CN202280062833.3A patent/CN117940863A/zh active Pending
Also Published As
| Publication number | Publication date |
|---|---|
| EP4359877A1 (fr) | 2024-05-01 |
| EP4152113A1 (fr) | 2023-03-22 |
| US20240411300A1 (en) | 2024-12-12 |
| CN117940863A (zh) | 2024-04-26 |
| WO2023041647A1 (fr) | 2023-03-23 |
| EP4359877C0 (fr) | 2025-05-14 |
Similar Documents
| Publication | Publication Date | Title |
|---|---|---|
| DE102009006887B3 (de) | Verfahren und System zur Halbleiterprozesssteuerung und Überwachung unter Anwendung eines Datenqualitätsmaßes | |
| DE10007972B4 (de) | Diagnosevorrichtung und -verfahren in einem Prozeßsteuersystem | |
| WO2022171788A1 (fr) | Modèle de prédiction pour prédire des valeurs de paramètre de qualité de produit | |
| EP3279756B1 (fr) | Dispositif de diagnostic et procédé de surveillance du fonctionnement d'une installation technique | |
| EP3210088B1 (fr) | Procédé et système d'assistance pour la détection d'une défaillance dans une installation | |
| DE112011101738T5 (de) | Mehrstufiges Prozessmodellierungsverfahren | |
| DE102011102034A1 (de) | Online-Abbgleich eines prozessanalytischen Modells mit effektivem Prozessbetrieb | |
| EP3876060B1 (fr) | Procédé et unité de calcul destinés à l'analyse des causes d'un état anormal d'une machine | |
| EP3591482B1 (fr) | Surveillance d'une installation technique | |
| EP3232282B1 (fr) | Dispositif de diagnostic et procede de surveillance du fonctionnement d'une installation technique | |
| EP4359877B1 (fr) | Procédé et système d'amélioration du processus de production dans une installation technique | |
| DE112018005937T5 (de) | Messlösungsdienstleistungssystem | |
| DE112023002048T5 (de) | Erweiterte analytik für bio-/chemische und halbleiter-produktionsanlagen | |
| DE10008020A1 (de) | Diagnosevorrichtung in einem Prozeßsteuersystem, das Mehrgrößen-Regeltechniken verwendet | |
| EP4268029B1 (fr) | Procédé et système de supervision du fonctionnement d'une installation technique | |
| EP3686697B1 (fr) | Optimisation du régulateur pour un système de commande d'une installation technique | |
| EP4060441A1 (fr) | Procédé et système de détection des anomalies dans le fonctionnement d'une installation technique | |
| EP4127848B1 (fr) | Procédé et système de diagnostic de messages | |
| WO2022122686A1 (fr) | Chaîne de production pour la fabrication de composants semi-conducteurs | |
| EP4421571A1 (fr) | Procédé et système d'optimisation d'un processus de production dans une installation technique | |
| DE102019116139A1 (de) | Verfahren zum Überprüfen des Produktionsprozesses von Feldgeräten mittels eines Machine-Learning-, bzw. Prognosesystems | |
| DE102020121890A1 (de) | Verfahren zur Diagnose eines Steuer- und/oder Regelungssystems sowie Steuer- und/oder Regelungssystem | |
| EP4272042B1 (fr) | Analyse de causes d'une anomalie en fonction de symptômes simulés | |
| EP3657283A1 (fr) | Procédé de détermination d'un ensemble de données fusionnées | |
| DE102024209895A1 (de) | Computerimplementiertes Verfahren zum Finden einer Fehlerursache in einem industriellen Prozess |
Legal Events
| Date | Code | Title | Description |
|---|---|---|---|
| STAA | Information on the status of an ep patent application or granted ep patent |
Free format text: STATUS: UNKNOWN |
|
| STAA | Information on the status of an ep patent application or granted ep patent |
Free format text: STATUS: THE INTERNATIONAL PUBLICATION HAS BEEN MADE |
|
| PUAI | Public reference made under article 153(3) epc to a published international application that has entered the european phase |
Free format text: ORIGINAL CODE: 0009012 |
|
| STAA | Information on the status of an ep patent application or granted ep patent |
Free format text: STATUS: REQUEST FOR EXAMINATION WAS MADE |
|
| 17P | Request for examination filed |
Effective date: 20240123 |
|
| AK | Designated contracting states |
Kind code of ref document: A1 Designated state(s): AL AT BE BG CH CY CZ DE DK EE ES FI FR GB GR HR HU IE IS IT LI LT LU LV MC MK MT NL NO PL PT RO RS SE SI SK SM TR |
|
| DAV | Request for validation of the european patent (deleted) | ||
| DAX | Request for extension of the european patent (deleted) | ||
| GRAP | Despatch of communication of intention to grant a patent |
Free format text: ORIGINAL CODE: EPIDOSNIGR1 |
|
| STAA | Information on the status of an ep patent application or granted ep patent |
Free format text: STATUS: GRANT OF PATENT IS INTENDED |
|
| INTG | Intention to grant announced |
Effective date: 20250124 |
|
| GRAS | Grant fee paid |
Free format text: ORIGINAL CODE: EPIDOSNIGR3 |
|
| GRAA | (expected) grant |
Free format text: ORIGINAL CODE: 0009210 |
|
| STAA | Information on the status of an ep patent application or granted ep patent |
Free format text: STATUS: THE PATENT HAS BEEN GRANTED |
|
| AK | Designated contracting states |
Kind code of ref document: B1 Designated state(s): AL AT BE BG CH CY CZ DE DK EE ES FI FR GB GR HR HU IE IS IT LI LT LU LV MC MK MT NL NO PL PT RO RS SE SI SK SM TR |
|
| REG | Reference to a national code |
Ref country code: GB Ref legal event code: FG4D Free format text: NOT ENGLISH |
|
| REG | Reference to a national code |
Ref country code: CH Ref legal event code: EP |
|
| REG | Reference to a national code |
Ref country code: DE Ref legal event code: R096 Ref document number: 502022003986 Country of ref document: DE |
|
| REG | Reference to a national code |
Ref country code: IE Ref legal event code: FG4D Free format text: LANGUAGE OF EP DOCUMENT: GERMAN |
|
| U01 | Request for unitary effect filed |
Effective date: 20250515 |
|
| U07 | Unitary effect registered |
Designated state(s): AT BE BG DE DK EE FI FR IT LT LU LV MT NL PT RO SE SI Effective date: 20250521 |
|
| PG25 | Lapsed in a contracting state [announced via postgrant information from national office to epo] |
Ref country code: ES Free format text: LAPSE BECAUSE OF FAILURE TO SUBMIT A TRANSLATION OF THE DESCRIPTION OR TO PAY THE FEE WITHIN THE PRESCRIBED TIME-LIMIT Effective date: 20250514 |
|
| PG25 | Lapsed in a contracting state [announced via postgrant information from national office to epo] |
Ref country code: NO Free format text: LAPSE BECAUSE OF FAILURE TO SUBMIT A TRANSLATION OF THE DESCRIPTION OR TO PAY THE FEE WITHIN THE PRESCRIBED TIME-LIMIT Effective date: 20250814 Ref country code: GR Free format text: LAPSE BECAUSE OF FAILURE TO SUBMIT A TRANSLATION OF THE DESCRIPTION OR TO PAY THE FEE WITHIN THE PRESCRIBED TIME-LIMIT Effective date: 20250815 |
|
| PG25 | Lapsed in a contracting state [announced via postgrant information from national office to epo] |
Ref country code: PL Free format text: LAPSE BECAUSE OF FAILURE TO SUBMIT A TRANSLATION OF THE DESCRIPTION OR TO PAY THE FEE WITHIN THE PRESCRIBED TIME-LIMIT Effective date: 20250514 |
|
| PG25 | Lapsed in a contracting state [announced via postgrant information from national office to epo] |
Ref country code: HR Free format text: LAPSE BECAUSE OF FAILURE TO SUBMIT A TRANSLATION OF THE DESCRIPTION OR TO PAY THE FEE WITHIN THE PRESCRIBED TIME-LIMIT Effective date: 20250514 |
|
| PG25 | Lapsed in a contracting state [announced via postgrant information from national office to epo] |
Ref country code: RS Free format text: LAPSE BECAUSE OF FAILURE TO SUBMIT A TRANSLATION OF THE DESCRIPTION OR TO PAY THE FEE WITHIN THE PRESCRIBED TIME-LIMIT Effective date: 20250814 |
|
| PG25 | Lapsed in a contracting state [announced via postgrant information from national office to epo] |
Ref country code: IS Free format text: LAPSE BECAUSE OF FAILURE TO SUBMIT A TRANSLATION OF THE DESCRIPTION OR TO PAY THE FEE WITHIN THE PRESCRIBED TIME-LIMIT Effective date: 20250914 |
|
| U20 | Renewal fee for the european patent with unitary effect paid |
Year of fee payment: 4 Effective date: 20250919 |
|
| PG25 | Lapsed in a contracting state [announced via postgrant information from national office to epo] |
Ref country code: SM Free format text: LAPSE BECAUSE OF FAILURE TO SUBMIT A TRANSLATION OF THE DESCRIPTION OR TO PAY THE FEE WITHIN THE PRESCRIBED TIME-LIMIT Effective date: 20250514 |
|
| PG25 | Lapsed in a contracting state [announced via postgrant information from national office to epo] |
Ref country code: CZ Free format text: LAPSE BECAUSE OF FAILURE TO SUBMIT A TRANSLATION OF THE DESCRIPTION OR TO PAY THE FEE WITHIN THE PRESCRIBED TIME-LIMIT Effective date: 20250514 |
|
| PG25 | Lapsed in a contracting state [announced via postgrant information from national office to epo] |
Ref country code: SK Free format text: LAPSE BECAUSE OF FAILURE TO SUBMIT A TRANSLATION OF THE DESCRIPTION OR TO PAY THE FEE WITHIN THE PRESCRIBED TIME-LIMIT Effective date: 20250514 |
|
| PLBE | No opposition filed within time limit |
Free format text: ORIGINAL CODE: 0009261 |
|
| STAA | Information on the status of an ep patent application or granted ep patent |
Free format text: STATUS: NO OPPOSITION FILED WITHIN TIME LIMIT |
|
| REG | Reference to a national code |
Ref country code: CH Ref legal event code: L10 Free format text: ST27 STATUS EVENT CODE: U-0-0-L10-L00 (AS PROVIDED BY THE NATIONAL OFFICE) Effective date: 20260325 |
|
| 26N | No opposition filed |
Effective date: 20260217 |