EP4421571A1 - Procédé et système d'optimisation d'un processus de production dans une installation technique - Google Patents
Procédé et système d'optimisation d'un processus de production dans une installation technique Download PDFInfo
- Publication number
- EP4421571A1 EP4421571A1 EP23158366.7A EP23158366A EP4421571A1 EP 4421571 A1 EP4421571 A1 EP 4421571A1 EP 23158366 A EP23158366 A EP 23158366A EP 4421571 A1 EP4421571 A1 EP 4421571A1
- Authority
- EP
- European Patent Office
- Prior art keywords
- clusters
- cluster
- time series
- data set
- data
- Prior art date
- Legal status (The legal status is an assumption and is not a legal conclusion. Google has not performed a legal analysis and makes no representation as to the accuracy of the status listed.)
- Withdrawn
Links
Images


Classifications
-
- G—PHYSICS
- G05—CONTROLLING; REGULATING
- G05B—CONTROL OR REGULATING SYSTEMS IN GENERAL; FUNCTIONAL ELEMENTS OF SUCH SYSTEMS; MONITORING OR TESTING ARRANGEMENTS FOR SUCH SYSTEMS OR ELEMENTS
- G05B13/00—Adaptive control systems, i.e. systems automatically adjusting themselves to have a performance which is optimum according to some preassigned criterion
- G05B13/02—Adaptive control systems, i.e. systems automatically adjusting themselves to have a performance which is optimum according to some preassigned criterion electric
- G05B13/0265—Adaptive control systems, i.e. systems automatically adjusting themselves to have a performance which is optimum according to some preassigned criterion electric the criterion being a learning criterion
Definitions
- the invention relates to a method and a corresponding system for optimizing a production process in a technical plant in which a process engineering process with at least one process step takes place.
- the invention further relates to an associated computer program.
- Process engineering deals with the technical and economic implementation of all processes in which substances or raw materials are changed according to type, properties and composition.
- process engineering plants such as refineries, steam crackers or other reactors are used in which the process is usually carried out using automation technology.
- Process engineering processes are basically divided into two groups: continuous processes and discontinuous, so-called batch processes.
- a complete production process i.e. starting from certain reactants to the finished product, can also be a mixture of both process groups.
- the continuous process runs without interruptions. It is a flow process, which means there is a constant inflow or outflow of material, energy or information. Continuous processes are preferred when processing large quantities with few product changes.
- An example would be a power plant that produces electricity or a refinery that produces fuel from crude oil.
- Discontinuous processes are all batch processes that run in batch-oriented mode, for example according to ISA-88, according to recipes. These recipes contain the information, which process steps are carried out one after the other or in parallel to produce a specific product with specific quality requirements.
- the use of materials or substances often takes place at different times, in portions and non-linearly in the respective sub-process. This means that the product runs through one or more reactors and remains there until the reaction has taken place and the next production step or process step can be carried out. Batch processes therefore generally run step by step with at least one process step.
- the process steps can therefore run on different units (physical devices in which the process is carried out) and/or with different control strategies and/or different quantities. Sequential functional control (SFC) or step chains are often used.
- a process step is the smallest unit of a process model.
- a so-called phase or function corresponds to a process step.
- Such phases can run one after the other (heating the reactor, stirring within the reactor and cooling the reactor), but also in parallel to one another, such as “stirring” and "keeping the temperature constant”.
- a batch process usually contains several process steps or phases. In the production of a product, for example, each process step or phase is usually run through many times (for example, to produce a large amount of a reactant). The large number of runs of a process step are recorded with values of process variables over time and stored in a data storage device.
- a process step or phase is assumed to run under optimal conditions in the context of a specific recipe, with a given control strategy, and in a specific sub-system or plant unit. It is also expected that each run of a phase (at the same point in the recipe) is the same from batch to batch. In addition, all measurements connected to the system show the same trend (time series of a sensor value), starting with the start time of the phase to the end time of the phase. This behavior can be referred to as a "golden batch.” A golden batch thus indicates the best production state achieved so far in terms of quality, quantity, runtime, and the lowest possible amount of waste.
- a common method for detecting problems in batch processes is to monitor the process values using alarm thresholds. If a threshold value for a certain process value is violated, the operator of a plant is notified by the process control system. Setting these threshold values is very complex and multivariate Deviations within the univariate thresholds cannot be detected.
- a second way to identify problems in batch processes is to evaluate laboratory measurements of the finished product. If a laboratory measurement is outside of quality specifications, process engineers can review trend data from the corresponding batch phases. Finally, it is the job of the process experts to determine the cause of a specific problem and take action to resolve the problem and prevent it in the future. This approach to root cause determination is very costly and requires skilled and experienced process experts. Another disadvantage is that if the problem is discovered due to an out-of-process laboratory measurement, there is already a time lag between the phase in which the problem was discovered and the current phase of production. This means that production problems are often discovered too late and after the fact.
- the object of the present invention to provide a data-based, simple method and system for optimizing the production process for batch processes, which allows a user of the method in particular to better understand the general process behavior and to carry out further analyses of the production process based on this.
- the invention is based on the object of specifying a suitable computer program, in particular a software application.
- clustering can be used in data analysis to gain insights and recognize patterns in order to learn more about the data domain being investigated.
- the basic idea of the present invention is to obtain further statements and analyses about the production process by linking a data-driven grouping of multivariate time series data from many runs of batch process steps with a labeling by metadata in order to better understand and optimize the production process.
- the invention therefore relates to a method for optimizing a production process in a technical plant in which a process engineering process with at least one process step takes place, wherein a large number of data records from runs of a process step with values of process variables are recorded as a function of time and stored in a data memory.
- a process section of the process engineering process to be examined and the process variables to be examined are first selected.
- the historical data records of the associated runs are then selected for this process section and the selected process variables.
- the time series obtained in this way are combined into clusters using a machine learning (ML for short) method.
- the time series associated with the obtained clusters are visualized according to their affiliation, the individual clusters are marked and linked to metadata.
- the marked clusters linked to metadata can be used to optimize the production process.
- the advantages of the method according to the invention are manifold.
- the greatest advantage is that a potentially large amount of multivariate process data is reduced by the method according to the invention to groups or clusters of phase runs with similar behavior. This is done automatically using an ML algorithm.
- a user of the method according to the invention has the option of examining the clusters found using the ML model using different representations and by linking them with metadata. The linking can be done manually (by the user himself) or automatically using a suitable algorithm.
- the duration of the investigation i.e. the time period of the process that is to be examined (the process section), can advantageously be freely selected. It is not absolutely necessary that the process section to be examined must coincide with a process step or a phase.
- the process section can also be selected across phases.
- a process section comprises a fixed specific duration of the engineering process with a defined start and end time.
- the clusters can be visualized in a user interface in a particularly advantageous way, for example as bands.
- a user has the option of labeling and contextualizing the clusters using comments or various categorizations.
- the clusters can be labeled manually or automatically using a suitable algorithm. Any metadata can be stored, such as the causes of problems that have occurred, suggestions for solutions/corrections, or an assessment of how critical process behavior, which is reflected in the behavior of the cluster, is in the process section being examined.
- the user also receives information about which historical phase sequences have been summarized in a cluster and how the behavior of the cluster develops over time. A user thus gains a deeper insight into the process behavior, especially when a large number of phase runs are summarized in a cluster. If a labeled cluster is, for example, a process step that results in good product quality (for example, a synthetic material with high purity), the set control and operating parameters of this process section can be reproduced in order to optimize production.
- a time series of a process section can be selected for a new data set of the batch process (multivariate time series data of the process variables) and it can be checked to which cluster the data set to be examined belongs. This does not have to be a current data set. It is also possible to examine historical data sets. "New" in this context means that the data set has not yet been included in a clustering using the previously used ML method.
- a new data set of a process section is checked for at least one process variable using a metric adapted to the clustering method to determine whether or how well the values of the data set can be assigned to a previously identified cluster.
- the user is provided with at least parts of the metadata previously stored with the cluster, which can be used not only to optimize the production process, but also to monitor the production process.
- the stored metadata can be used by a user to evaluate or correct the current process in particular. If the new data from the batch phase matches a cluster, a user can be notified, for example, that a certain process behavior has been found. In the case of the analysis of historical data, the user can be provided with a summary of the process behavior found in connection with the cluster.
- Assigning phase runs to a cluster also offers the advantage that the cluster also takes into account the variation in the measurement data for this process behavior. The probability of a successful assignment can thus be increased compared to a pairwise determination of the similarity of the phases. In the case of automated assignment, statements about current process behavior can be made very quickly.
- the adjustment factor can be used to advantageously quantify the assignment of a new data set to a cluster. The quality and accuracy of the process monitoring can be significantly increased in this way.
- outliers are advantageously filtered out by smoothing the scaled deviations along the time axis. This could be achieved, for example, by a median filter that moves along the time axis and takes into account a large number of measured values instead of individual measured values, which is particularly advantageous for sensors with high noise levels.
- the method according to the invention for assigning a new data set to at least one cluster with its design variants can advantageously be used during ongoing operation of a technical system and can optionally also be carried out in real time. While the cluster analysis method is only partially suitable as an online method during ongoing operation by selecting certain runs and process variables, clustering and labeling, an assignment of new data sets to the previously saved clusters can be carried out much more quickly because the clusters are already there and the calculation of the adjustment factor can be carried out automatically. As soon as the user has the time series data of at least one process variable from a process section, it can be checked whether the time series can be assigned to a cluster. The user thus receives a statement about the process behavior very quickly. Using the metadata of the cluster found, ongoing operation can be influenced if necessary by modifying control parameters or setpoints or by adjusting process variables (such as temperature in a reactor, pressure or fill level).
- process variables such as temperature in a reactor, pressure or fill level
- the assignment of a new data set to a cluster can be initiated or triggered during operation when a certain condition is met. It is particularly advantageous to initiate cluster assignment when the runtime of the new data set corresponds to at least a predetermined fraction of the median of the runtimes of the cluster's time series. A user can therefore specify when an evaluation is useful. Alternatively, the trigger can also be set automatically. If the new data from the batch phase matches a cluster and a user is repeatedly notified that a certain process behavior has been found, the trigger can prevent a user from receiving too many notifications. Overall, the trigger function allows more flexible handling of cluster assignment.
- the process section can be selected according to a logic or data-driven, in particular based on data from the production process, e.g. through time series segmentation.
- the logic can be based, for example, on the implementation of the batch process in an automation system or a control system.
- certain process steps e.g. "A cluster analysis should only be carried out for heating up a reactor" or, for example, critical time periods in the course of a process can be specified by a user or an algorithm. This advantageously allows a flexible cluster analysis that is adapted to the respective situation and system.
- the grouping of the large number of time series of the phase runs into clusters is carried out using machine learning methods.
- a spatial distance metric of the Vectors here the time series data
- There are basically various methods for determining this distance such as the Euclidean or Minkowski metric.
- these are multivariate time series of different lengths. Therefore, so-called dynamic time warping methods can also be used.
- the use of distance metrics for time series data for clustering represents the most precise comparison option, but this also leads to great sensitivity, for example in relation to the noise of the measured process values.
- data-driven features of the time series e.g. the latent representation of an autoencoder that was trained on the data of the process section, are calculated. Both variants are also characterized by a high level of robustness and efficiency.
- the previously formulated task is also solved by using the method with all its variants, as explained above, for labeling groups of data sets, in particular time series data. If clustered data consisting of time series data is already available, a user can label it with so-called labels by marking it with metadata. In this way, a supervised method could advantageously be derived from the unsupervised machine learning method. For this purpose, the individual clusters, which are individually evaluated and labeled and therefore correspond to labeled data sets, would be available to a classification method. Based on this, further data analyses are possible. Another advantage is that the metadata can be used as labels for training the machine learning algorithm, e.g. to balance the usually high number of "good” runs with the small number of errors or "bad" runs.
- the previously formulated task is also solved by using the method with all its variants as previously explained for the root cause analysis of problems that occur during the production process in a technical plant.
- This is a particularly simple but very efficient type of root cause analysis if the metadata is of high quality. If the metadata linked to a cluster includes detailed and meticulous documentation of the historical process behavior by an expert, this knowledge can be very valuable in identifying and solving problems.
- the previously described task is also solved by a system for optimizing the production process in a technical plant.
- the term system can refer to a hardware system such as a computer system consisting of servers, networks and storage units as well as a software system such as a software architecture or a larger software program.
- a mixture of hardware and software is also conceivable, for example an IT infrastructure such as a cloud structure with its services.
- Components of such an infrastructure are usually servers, storage, networks, databases, software applications and services, data directories and data management.
- Virtual servers in particular also belong to a system of this type.
- the system according to the invention can also be part of a computer system which is spatially separated from the location of the technical system.
- the connected external system then advantageously has components which are designed to carry out the method according to the invention. In this way, for example, a coupling with a cloud infrastructure can be achieved, which further increases the flexibility of the overall solution.
- Local implementations on computer systems of the technical plant can also be advantageous.
- an implementation on a server of the process control system or on premise, i.e. within a technical plant, is particularly suitable for safety-relevant processes.
- the method according to the invention is thus preferably implemented in software or in a software/hardware combination, so that the invention also relates to a computer program, in particular a software application, with program code instructions that can be executed by a computer for implementing the method.
- a computer program can, as described above, be loaded into a memory of a server, e.g. a process control system, so that the monitoring of the operation of the technical system is carried out automatically, or the computer program can be stored in a memory of a remote service computer or can be loaded into it in the case of cloud-based monitoring of a technical system.
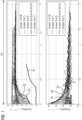
- Fig.1 the result of groupings of time series of a large number of data sets of runs of a batch process section is shown as an example for two process variables.
- the time series are trends or time series of different runs of the process variables shown flow F and temperature T, the values of which are plotted against time t.
- the time window shown here corresponds to a process section PA. 5 groups or clusters (group 1 to group 5) are shown for each process variable.
- the time series associated with the obtained clusters are marked by the line type in this embodiment according to their affiliation.
- the visualization according to the affiliation to clusters can be selected as desired.
- Group 1 comprises the time series data from 19 runs of the corresponding process variables.
- Group 2 comprises the time series from 7 runs
- group 3 comprises the time series from 3 runs
- group 4 comprises the time series from 3 runs
- group 5 comprises a single time series of a run (which, however, cannot be seen).
- group 4 the data sets of the individual runs R1, R2 and R3 are marked in the figure for the process variables T and F shown.
- the individual clusters are usually stored independently of each other.
- time series is used in this context in such a way that data is not recorded continuously, but discretely (at specific time stamps), but at finite time intervals.
- process variables that characterize the operation of the system, recorded as a function of time t and saved in a data storage device (often an archive).
- Time-dependent here therefore means either at specific individual points in time with time stamps or with a sampling rate at regular intervals or almost continuously.
- the data records of a run R1 therefore contain n values of the respective process variables with the respective time stamps, where n is any natural number.
- Process variables are usually recorded using sensors. Examples of process variables are temperature T, pressure P, flow rate F, fill level L, density or gas concentration of a medium.
- process section is chosen such that it covers any time period of the batch process.
- a process section can correspond to the duration of a batch phase, but can also only be a fraction of it. It can also be a time period that spans multiple phases, or it can also include several phases.
- a process section therefore corresponds to any time period of the process engineering process that can be selected with a fixed start time t0 and a fixed end time tend. It should be definable and repeatable.
- the clusters are usually marked with metadata manually by the user.
- the linking of the metadata can also be done automatically if, for example, certain characteristics of the cluster trigger an automatic process that information should be linked to the cluster.
- a user can select individual clusters from one or more cluster analyses to use them for monitoring new online data or for application to other historical data.
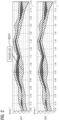
- This embodiment of the method according to the invention is demonstrated using Figure 3 clearly.
- Fig.3 are the groups or clusters of Fig.1 visualized as bands.
- the graphs shown are shown, for example, in the dashboard of a software application.
- a user now receives new data sets DAT_NEU_F and DAT_NEU_T from the ongoing operation of a process plant from runs of the process variables shown, the flow rate F and the temperature T, for the previously selected Process section PA.
- the user can now initiate an assignment of the new data set to one of the clusters shown for each process variable.
- An assignment to any cluster previously saved for the corresponding process variable would also be conceivable.
- the assignment algorithm is based on a metric adapted to the clustering process and checks whether or how well the values of the new data set can be assigned to a previously marked cluster. After the data set has been assigned to one or more clusters, at least parts of the metadata previously stored with the cluster can be output and used in addition to monitoring the production process. Contextualization offers the advantage that the user can be offered an optimization/solution suggestion directly if a match is found with a corresponding cluster. Since the clusters and the associated metadata can be monitored and maintained independently of the cluster analysis and selectively (i.e. only some of the clusters), the process offers the possibility of only keeping the stored clusters (possibly also with the associated metadata) that are relevant for the future. This means that, for example, special cases of phase runs or unusual behavior that occurred in the past for known reasons (e.g. the reactor had to be operated with a differently dimensioned replacement pump in May) can be excluded. In addition, this can reduce the number of useless notifications.
- a plant operator or process engineer can be shown a wide variety of information for the new data set in combination with the associated cluster.
- the exact content of the metadata can also be configured for each use case.
- the metadata comes from different information sources and can be accessed either manually or automatically.
- Figure 4 There, an embodiment of a system S is shown which is designed to carry out the method according to the invention.
- the system S comprises three units for storing data.
- at least one data store should be present. If there is more than one data store, any distribution of the data to be stored can be provided.
- data store Sp1 contains a large number of historical data records with the multivariate trends of the phase runs. All historical data records, data records which contain values from a large number of process variables with corresponding time stamps, can be used for the ML model for clustering.
- the computing unit C is connected to the storage unit Sp1.
- the computing unit C is part of a higher-level evaluation unit (not shown). Different units are conceivable in each case or just one unit in the form of a server on which an application with all the functions of calculation and evaluation is implemented.
- the evaluation unit and/or the computing unit C can also be connected to a control system of a technical system TA or a computer of a technical sub-system in which a process engineering process with at least one process step runs, via a communication interface, via which (e.g. on request) the multivariate data sets of the phase runs are transmitted.
- an automation system or a process control system controls, regulates and/or monitors a process engineering process.
- the process control system is connected to a large number of field devices (not shown).
- Transmitters and sensors are used to record process variables such as temperature T, pressure P, flow rate F, level L, density or gas concentration of a medium.
- the clusters determined by the computing unit C and other analysis results such as cluster bands and/or the associated characteristics of the individual clusters (such as means, standard deviations or autocorrelations) are stored in the Fig.4 outlined embodiment in a further storage unit Sp2.
- the clusters in their respective graphical design can be output on the graphical user interface of a display unit B for visualization.
- a system user or operator O or a process expert can identify the clusters by entering comments or metadata records in an input field of the user interface.
- the metadata can be stored in a further storage Sp3, which is automatically linked to Sp2, the storage for the cluster bands. It is also conceivable to have a system design in which the storage for the metadata is ordered or classified with regard to the phases, the batches of the plant equipment, etc.
- a single storage unit for the metadata in correlation with the clusters or cluster bands is also conceivable.
- this data set which contains time series data of a process section to be examined, is transmitted to a unit A, in which the membership of the new data set to the clusters already determined in the unit C is checked.
- the unit A can also receive a historical data set from the storage unit Sp1 with the historical multivariate data.
- the units and storage are communicatively linked.
- the display and control unit B can also be connected directly to the system or, depending on the implementation, can be connected to the system via a data bus, for example.
- the display unit is part of the system S.
- the user interface of the display and control unit B shows the clusters associated with a data set.
- the associated metadata is also displayed.
- a process expert can now check the result and determine the cause of problems. This means that a system user O can add comments or metadata records to an input field in the user interface during the root cause analysis for the clusters currently being analyzed. By saving this metadata, the system becomes more intelligent over time and can be viewed as an interactive, self-learning system.
- the system S for carrying out the method according to the invention can also be implemented in a client-server architecture, for example.
- the server with its data storage serves to provide certain services such as the system according to the invention, for processing a precisely defined task (here the calculation of the clusters and the assignment of new data sets to the existing clusters).
- the client (here unit B) is able to request and use the corresponding services from the server.
- Typical servers are web servers for providing web page content, database servers for storing data or application servers for providing programs.
- the interaction between the server and client takes place via suitable communication protocols such as http or jdbc.
- Another possibility is to use the method as an application in a cloud environment (e.g. Siemens MindSphere), whereby a or several servers host the system according to the invention in the cloud.
- the system can be implemented as an on-premise solution directly on the technical system, so that a local connection to databases and computers at the control system level is possible.
Landscapes
- Engineering & Computer Science (AREA)
- Artificial Intelligence (AREA)
- Health & Medical Sciences (AREA)
- Computer Vision & Pattern Recognition (AREA)
- Evolutionary Computation (AREA)
- Medical Informatics (AREA)
- Software Systems (AREA)
- Physics & Mathematics (AREA)
- General Physics & Mathematics (AREA)
- Automation & Control Theory (AREA)
- Testing And Monitoring For Control Systems (AREA)
Priority Applications (4)
| Application Number | Priority Date | Filing Date | Title |
|---|---|---|---|
| EP23158366.7A EP4421571A1 (fr) | 2023-02-23 | 2023-02-23 | Procédé et système d'optimisation d'un processus de production dans une installation technique |
| PCT/EP2024/053743 WO2024175442A1 (fr) | 2023-02-23 | 2024-02-14 | Procédé et système d'optimisation d'un processus de production dans une installation technique |
| EP24707697.9A EP4639292A1 (fr) | 2023-02-23 | 2024-02-14 | Procédé et système d'optimisation d'un processus de production dans une installation technique |
| CN202480014197.6A CN120731404A (zh) | 2023-02-23 | 2024-02-14 | 用于优化技术设施中的生产过程的方法和系统 |
Applications Claiming Priority (1)
| Application Number | Priority Date | Filing Date | Title |
|---|---|---|---|
| EP23158366.7A EP4421571A1 (fr) | 2023-02-23 | 2023-02-23 | Procédé et système d'optimisation d'un processus de production dans une installation technique |
Publications (1)
| Publication Number | Publication Date |
|---|---|
| EP4421571A1 true EP4421571A1 (fr) | 2024-08-28 |
Family
ID=85382726
Family Applications (2)
| Application Number | Title | Priority Date | Filing Date |
|---|---|---|---|
| EP23158366.7A Withdrawn EP4421571A1 (fr) | 2023-02-23 | 2023-02-23 | Procédé et système d'optimisation d'un processus de production dans une installation technique |
| EP24707697.9A Pending EP4639292A1 (fr) | 2023-02-23 | 2024-02-14 | Procédé et système d'optimisation d'un processus de production dans une installation technique |
Family Applications After (1)
| Application Number | Title | Priority Date | Filing Date |
|---|---|---|---|
| EP24707697.9A Pending EP4639292A1 (fr) | 2023-02-23 | 2024-02-14 | Procédé et système d'optimisation d'un processus de production dans une installation technique |
Country Status (3)
| Country | Link |
|---|---|
| EP (2) | EP4421571A1 (fr) |
| CN (1) | CN120731404A (fr) |
| WO (1) | WO2024175442A1 (fr) |
Citations (3)
| Publication number | Priority date | Publication date | Assignee | Title |
|---|---|---|---|---|
| US20200074370A1 (en) * | 2018-08-31 | 2020-03-05 | Kinaxis Inc. | Analysis and correction of supply chain design through machine learning |
| EP3696622A1 (fr) * | 2019-02-14 | 2020-08-19 | Rockwell Automation Technologies, Inc. | Validation de modèle intelligent et d'extensions d'ia pour un double numérique industriel |
| WO2022180120A1 (fr) * | 2021-02-24 | 2022-09-01 | Abb Schweiz Ag | Procédé et système de détection des points de changement industriels |
-
2023
- 2023-02-23 EP EP23158366.7A patent/EP4421571A1/fr not_active Withdrawn
-
2024
- 2024-02-14 EP EP24707697.9A patent/EP4639292A1/fr active Pending
- 2024-02-14 CN CN202480014197.6A patent/CN120731404A/zh active Pending
- 2024-02-14 WO PCT/EP2024/053743 patent/WO2024175442A1/fr not_active Ceased
Patent Citations (3)
| Publication number | Priority date | Publication date | Assignee | Title |
|---|---|---|---|---|
| US20200074370A1 (en) * | 2018-08-31 | 2020-03-05 | Kinaxis Inc. | Analysis and correction of supply chain design through machine learning |
| EP3696622A1 (fr) * | 2019-02-14 | 2020-08-19 | Rockwell Automation Technologies, Inc. | Validation de modèle intelligent et d'extensions d'ia pour un double numérique industriel |
| WO2022180120A1 (fr) * | 2021-02-24 | 2022-09-01 | Abb Schweiz Ag | Procédé et système de détection des points de changement industriels |
Also Published As
| Publication number | Publication date |
|---|---|
| CN120731404A (zh) | 2025-09-30 |
| WO2024175442A1 (fr) | 2024-08-29 |
| EP4639292A1 (fr) | 2025-10-29 |
Similar Documents
| Publication | Publication Date | Title |
|---|---|---|
| DE10007972B4 (de) | Diagnosevorrichtung und -verfahren in einem Prozeßsteuersystem | |
| EP3279756B1 (fr) | Dispositif de diagnostic et procédé de surveillance du fonctionnement d'une installation technique | |
| DE102021201296A1 (de) | Vorhersagemodell zum Vorhersagen von Produktqualitätsparameterwerten | |
| EP3665536B1 (fr) | Détermination de la cause d'une anomalie | |
| EP4217806B1 (fr) | Contrôle qualité pour produits fabriqués en série | |
| DE112019002030T5 (de) | Qualitätsüberprüfungs-Verwaltungssystem mit konfigurierbaren Ausnahmeregeln | |
| DE112011101738T5 (de) | Mehrstufiges Prozessmodellierungsverfahren | |
| EP3591482B1 (fr) | Surveillance d'une installation technique | |
| CN103488135A (zh) | 一种用于半导体生产加工过程监控的统计过程控制方法 | |
| DE10008020B4 (de) | Diagnosevorrichtung in einem Prozeßsteuersystem, das Mehrgrößen-Regeltechniken verwendet | |
| EP2881822A1 (fr) | Procédé implémenté par ordinateur et système de surveillance automatique et de détermination de l'état de l'intégralité des étapes de processus dans une unité de traitement | |
| DE112017005957T5 (de) | Informationsverarbeitungssystem und Informationsverarbeitungsverfahren | |
| DE102014223810A1 (de) | Verfahren und Assistenzsystem zur Erkennung einer Störung in einer Anlage | |
| DE112023002048T5 (de) | Erweiterte analytik für bio-/chemische und halbleiter-produktionsanlagen | |
| EP4359877B1 (fr) | Procédé et système d'amélioration du processus de production dans une installation technique | |
| EP4295202B1 (fr) | Procédé et système de mesure de composants, ainsi que programme | |
| DE102008045840B4 (de) | Verfahren zum Betreiben einer Prozess-Messstelle | |
| EP4268029B1 (fr) | Procédé et système de supervision du fonctionnement d'une installation technique | |
| EP4421571A1 (fr) | Procédé et système d'optimisation d'un processus de production dans une installation technique | |
| EP3686697B1 (fr) | Optimisation du régulateur pour un système de commande d'une installation technique | |
| EP4060441A1 (fr) | Procédé et système de détection des anomalies dans le fonctionnement d'une installation technique | |
| EP4505254B1 (fr) | Procédé et système mis en oeuvre par ordinateur pour la détection d'anomalie | |
| EP4127848B1 (fr) | Procédé et système de diagnostic de messages | |
| WO2024002725A1 (fr) | Dispositif de surveillance de l'état d'une machine | |
| EP2402832B1 (fr) | Procédé et système d'affichage pour le calibrage d'affichages normalisés de grandeurs de processus |
Legal Events
| Date | Code | Title | Description |
|---|---|---|---|
| PUAI | Public reference made under article 153(3) epc to a published international application that has entered the european phase |
Free format text: ORIGINAL CODE: 0009012 |
|
| STAA | Information on the status of an ep patent application or granted ep patent |
Free format text: STATUS: THE APPLICATION HAS BEEN PUBLISHED |
|
| AK | Designated contracting states |
Kind code of ref document: A1 Designated state(s): AL AT BE BG CH CY CZ DE DK EE ES FI FR GB GR HR HU IE IS IT LI LT LU LV MC ME MK MT NL NO PL PT RO RS SE SI SK SM TR |
|
| STAA | Information on the status of an ep patent application or granted ep patent |
Free format text: STATUS: THE APPLICATION IS DEEMED TO BE WITHDRAWN |
|
| 18D | Application deemed to be withdrawn |
Effective date: 20250301 |