EP4383097A1 - Validation d'une série temporelle binaire simulée - Google Patents
Validation d'une série temporelle binaire simulée Download PDFInfo
- Publication number
- EP4383097A1 EP4383097A1 EP22212185.7A EP22212185A EP4383097A1 EP 4383097 A1 EP4383097 A1 EP 4383097A1 EP 22212185 A EP22212185 A EP 22212185A EP 4383097 A1 EP4383097 A1 EP 4383097A1
- Authority
- EP
- European Patent Office
- Prior art keywords
- data set
- simulated
- time series
- algorithm
- measured
- Prior art date
- Legal status (The legal status is an assumption and is not a legal conclusion. Google has not performed a legal analysis and makes no representation as to the accuracy of the status listed.)
- Withdrawn
Links
Images



Classifications
-
- G—PHYSICS
- G06—COMPUTING OR CALCULATING; COUNTING
- G06F—ELECTRIC DIGITAL DATA PROCESSING
- G06F17/00—Digital computing or data processing equipment or methods, specially adapted for specific functions
- G06F17/10—Complex mathematical operations
- G06F17/18—Complex mathematical operations for evaluating statistical data, e.g. average values, frequency distributions, probability functions, regression analysis
-
- B—PERFORMING OPERATIONS; TRANSPORTING
- B61—RAILWAYS
- B61L—GUIDING RAILWAY TRAFFIC; ENSURING THE SAFETY OF RAILWAY TRAFFIC
- B61L1/00—Devices along the route controlled by interaction with the vehicle or train
- B61L1/16—Devices for counting axles; Devices for counting vehicles
- B61L1/169—Diagnosis
-
- B—PERFORMING OPERATIONS; TRANSPORTING
- B61—RAILWAYS
- B61L—GUIDING RAILWAY TRAFFIC; ENSURING THE SAFETY OF RAILWAY TRAFFIC
- B61L27/00—Central railway traffic control systems; Trackside control; Communication systems specially adapted therefor
- B61L27/60—Testing or simulation
-
- G—PHYSICS
- G06—COMPUTING OR CALCULATING; COUNTING
- G06N—COMPUTING ARRANGEMENTS BASED ON SPECIFIC COMPUTATIONAL MODELS
- G06N20/00—Machine learning
Definitions
- the invention relates to a computer-implemented method for evaluating a simulated data set which has a binary time series, in particular a binary time series from the field of rail vehicles, e.g. a binary time series of an axle counter.
- the invention also relates to a method for providing validated training data, in particular for an artificial intelligence (AI) algorithm.
- AI artificial intelligence
- the invention also relates to a device for data processing and a computer program product.
- the invention can thus relate to the technical field of the evaluation of (simulated) data sets, in particular with regard to rail vehicles.
- binary time series can refer to a data set in which binary data (e.g. 1 and 0 or "signal” and "no signal”) are recorded over a period of time.
- a practical example of this can be an axle counter (binary axle counting data), which is widely used in the field of rail vehicles.
- Axle counters are in particular electronic components for counting the wheel sets of passing rail vehicles and can be used, for example, to report track vacancy.
- sensors e.g. counting point, wheel sensor
- axles entering a track section can be counted and compared with outgoing axles.
- Each passing axle can represent a signal in the binary time series.
- a method for evaluating, a method for providing training data, a device for data processing, and a computer program product are described below.
- a device for data processing which has at least one processor and which is configured to carry out at least one of the methods described above.
- a computer program product which has instructions which, when the program is executed by a computer, cause the computer to carry out at least one of the methods described above.
- the invention may be based on the idea that a simulated binary time series (in particular of an axle counter) can be reliably evaluated if an acceptance criterion is determined based on a reference data set associated with measured data and it is determined whether the deviation between a simulated data set and a measured data set meets the acceptance criterion.
- the inventors have recognized that measured data sets also show a deviation under the same conditions, and that an acceptable simulated data set should be indistinguishable from the measured data sets in order to provide the most efficient and reliable evaluation criteria possible.
- an acceptable simulated data set should be indistinguishable from the measured data sets in order to provide the most efficient and reliable evaluation criteria possible.
- the actual distribution of the deviation between similar measured data sets. If this distribution is known, a robust Acceptance criterion must be defined. In other words, the unknown distribution should be approximated so that a confidence interval can be defined as an acceptance criterion.
- the simulation can be considered to be acceptably close to reality.
- the degree (of transformation) and the acceptance criteria can thus enable validation of the simulation data in practical applications.
- determining the deviation comprises: transforming (or transferring) the simulated data set to the measured data set or vice versa. This may have the advantage that these data sets can be efficiently compared (with a suitable distance metric) so that information is obtained which is indicative of how far the data sets deviate from each other.
- mathematical methods are transferred to the concrete application in a new way to determine the measure of the difference between two binary time series, so that the "cost” or “effort” of "overlapping” (transforming) the two time series can be determined.
- transforming comprises using a Probability density function (or probability density distribution).
- Probability density function or probability density distribution
- the transformation comprises an Optimal Transport Theory (OTT) algorithm, in particular an Earth Mover's Distance (EMD) algorithm.
- OTT Optimal Transport Theory
- EMD Earth Mover's Distance
- the "optimal transport theory” is understood to be a classic mathematical problem in which a given initial distribution is transformed into a desired target distribution.
- the optimal transport is the transformation that minimizes a defined cost function (least effort).
- the literature often uses the analogy of a pile of sand (source distribution) and a pit (target distribution), where the sand is to be transported from the pile to the pit using as little mechanical work as possible (weight times transport distance).
- EMD solves the Optimal Transport Problem exactly in one example (i.e. it does not just approximate it). This may become computationally intensive in the high-dimensional case.
- the transformation comprises a Dynamic Time Warping (DTW) algorithm, in particular a penalized-DTW algorithm.
- DTW Dynamic Time Warping
- DTW can refer in particular to an algorithm that enables an optimal alignment of two time series so that the matching areas of the two time series can be found and transformed into one another.
- the similarity of these time series can be quantified in the following way (also often referred to as costs):
- the cost function the effort
- costs arise when mapping the function values (0 ⁇ 1) and (1 ⁇ 0), whereas the mappings of the function values (0 ⁇ 0) and (1 ⁇ 1) remain free of charge.
- Penalized DTW is used in a preferred example.
- This method is an extension of DTW, which introduces additional costs when the transformed time series is contracted and expanded.
- the corresponding penalty parameter determines the influence of the penalty for contraction and expansion on the total costs and must always be selected to be greater than zero for the current application. Values for the penalty parameter that are too large have a negative impact on the optimization.
- p_penalty 0.1 has proven to be a suitable default value.
- providing the reference data set comprises providing two or more measured data sets. This can have the advantage that the reference data set can be created directly based on measured data sets without additional effort.
- the measured data sets can also have a particular reliability because they are (exclusively) real data.
- providing the reference data set comprises: artificially expanding of the measured data set. This is done in particular by applying a (particularly random) disturbance to the measured data set, e.g. through (random) noise and/or a random measurement error.
- noise can also be caused in the boundary conditions, e.g. vehicle parameters, clutch play, variable wheel diameters, wear, etc. This can have the advantage that the reference data set can be generated with little effort by varying the measured data.
- the database can be artificially expanded. To do this, suitable assumptions can first be made regarding an expected distribution of the unknown noise. If axle counters are used to record the signal (with spatial offset), the two generated time series can be used to further characterize the sensor noise. Based on the noise assumptions made, (n-1) randomly generated noise instances can be generated, which are overlaid with the original real time series. This then results in, for example, an artificially generated reference data set (of cardinality n), which can form the basis for the next steps.
- noise can be understood as the fact that different measurements under the same conditions produce different time series. For example, if a train passes the axle counting sensor several times at the same constant speed, non-identical binary time series will always be produced. These deviations can be attributed to measurement noise, for example.
- the reference data set is created by a combination of measured data sets and artificially extended data sets.
- providing the acceptance criterion comprises: providing, in particular random, subsets of the reference data set and determining a confidence interval based on the subsets.
- determining the confidence interval involves using a statistical algorithm, in particular a bootstrapping algorithm. This allows a non-parametric approach to be implemented, i.e. no assumptions regarding the form of the underlying distribution.
- the model structure is formed only from the data.
- a distribution of costs can be determined that makes it possible to determine whether another data series, e.g. a simulated one, deviates significantly (from a given confidence interval) and would therefore be unacceptable.
- k random subsets (batches), each consisting of a certain number of time series, are generated/randomly selected from the reference data set.
- a transformation cost matrix Ci (based on the specified distance metric, e.g. OTT or DWT) is determined between all time series contained in this batch.
- An average value (Cm of Ci) of the transformation costs is then calculated for each batch.
- a probability density function (PDF) of the costs between the time series is approximated in one example using the histogram method.
- the desired confidence interval can be determined using this PDF.
- the cost distribution (PDF) p(c) is approximated using a bootstrap distribution.
- a confidence interval is then determined, e.g. 95%.
- the acceptance criterion now requires that the costs between real and simulation data must lie within the determined confidence interval. For example, the (mean) value of the costs can lie within the determined confidence interval.
- the simulation results are considered to be "close” enough to the real distribution. Thus, the acceptance criterion of the simulation data is met. If the If the comparison value is outside the confidence interval, the simulation data is considered unacceptable.
- the binary time series has a plurality of peaks (signals). Determining the deviation and/or the acceptance criterion can then take into account at least one of the following parameters: peak time distribution, peak width, peak slope. This can have the advantage that, in addition to the pure time series, other parameters of the signals can also be taken into account, thus increasing the informative value.
- the method is used in connection with rail-bound vehicles.
- the axle counter application has already been discussed in detail above.
- the area of rail vehicles has particularly high requirements for safety and reliability and corresponding standards. Therefore, the use of the described evaluation method of binary time series can be particularly important and advantageous in this context.
- the simulated data that meet the acceptance criteria are used as training data.
- the requirements for simulated data can be particularly high.
- this training data in particular can be of particular importance in order to enable an acceptable reliability of the algorithm to be trained, in particular an AI algorithm.
- the training data is provided to an artificial intelligence (AI) algorithm.
- AI artificial intelligence
- Fulfilling the acceptance criterion can be a necessary approval requirement for the use of the simulated data in/on the AI algorithm.
- AI can refer in particular to computer-based approaches to mimic cognitive functions of a human mind, in particular learning and problem solving.
- a variety of different mathematical algorithms and computational models have been developed to implement AI functionalities, e.g. machine learning, deep learning, neural networks, genetic algorithms, kernel regression, etc.
- the main purpose of these approaches can be seen as improving an existing algorithm by training it with training data so that a learning effect occurs and the problem-solving ability of the algorithm improves over time. This can be done with or without human intervention (e.g. tweaking).
- training data for the AI algorithm can be artificially generated in sufficient quantities, advantageously without complex tests in reality.
- spatially relative terms such as “front” and “back”, “top” and “bottom”, “left” and “right”, etc. are used to describe the relationship of one element to another element as shown in the figures.
- the spatially relative terms may apply to orientations used that differ from the orientation shown in the figures.
- these spatially relative terms refer only to simplify the description and the orientation shown in the figures and are not necessarily limiting, since a device according to an embodiment of the invention may assume other orientations than those shown in the figures, particularly when used.
- Figure 1 shows a schematic overview of a method 100 for evaluating a simulated data set according to an exemplary embodiment of the invention.
- a data set which has a binary time series, in particular of an axle counter is simulated.
- a distance metric is selected by means of which the simulated data set 111 can be transferred or transformed to a real data set.
- algorithms from established and proven methods such as Optimal Transport Theory (OTT) or Dynamic Time Warping (DTW) can be used here.
- OTT Optimal Transport Theory
- DTW Dynamic Time Warping
- the aim is to determine how great the effort or costs are to transfer a simulated binary time series to a measured/real binary time series (or vice versa).
- a corresponding measured data set 112 is provided and a reference data set is created which is at least partially associated with the measured data set or is based on it.
- a large number of measured binary time series are present, so that this large number can already provide the reference data set.
- a large number of associated binary time series are artificially generated based on the measured data set. This can be done, for example, by applying random noise to the measured data set.
- the associated (artificial) binary time series are not to be viewed as simulated binary time series. On the basis of real time series, it is thus determined which "natural noise" arises when determining real time series, for example when generating binary time series for axle counting.
- an acceptance criterion is determined with respect to the simulated data set based on the reference data set.
- a statistical evaluation of the reference data set is carried out, e.g. using the established and proven bootstrapping algorithm. This allows a probability density function to be calculated, from which a confidence interval can then be determined. If a simulated data set lies within this confidence interval, it can be assumed that it meets the acceptance criterion.
- the actual evaluation of the simulated data set takes place.
- a deviation (or a difference) between the simulated data set 111 and the measured data set 112 and/or a data set associated with the measured data set is determined (e.g., using OTT or DWT). It is then determined whether the deviation between the data sets meets the acceptance criterion or lies within the confidence interval determined in step 130.
- Figure 2 shows a transformation (corresponds to step 110 (selection of the distance metric) and step 140 (determination of the deviation)) between a simulated data set 111 and a measured data set 112 according to an exemplary embodiment of the invention.
- Both data sets have a binary time series in which signals (peaks) are recorded along a time period.
- a transformation is necessary, which can be carried out, for example, using the methods described above.
- the simulated and real data are relatively far apart, so that an increased "cost" is necessary for the transformation. In this case, the simulated data set may not meet the acceptance criterion.
- FIG 3 illustrates the basic procedure of the Optimal Transport Theory (OTT).
- OTT Optimal Transport Theory
- Figure 4 shows a determination of an acceptance criterion according to an exemplary embodiment of the invention. This corresponds to the third method step 130, whereby a probability density distribution is obtained. A distribution density is obtained around a mean value (here 0.5) using the bootstrapping algorithm. This can be approximated to a curve that shows the probability density distribution.
- Figure 5 shows a real data set 112 according to an exemplary embodiment of the invention.
- the real binary time series (not shown) relate to five different train types that pass the axle counter at different speeds and different accelerations.
- a cluster of binary time series of train type 4 is extracted, the accelerations a and speeds v_0 of which are subject to such a small variance that the time series can be considered to be of the same type.
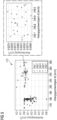
- Figure 6 shows an evaluation (this corresponds to the last step 140) of a simulated data set based on the acceptance criterion according to an exemplary Embodiment of the invention.
- C accepted max. C A
- the acceptance criterion was determined to be 1.89 ⁇ 10 -5 , based on the cluster (plot on the right) of Figure 5
- Lower values were considered acceptable, while higher values were considered unacceptable.
- the acceptable values can now be viewed as realistic simulated binary time series and can be used for further applications (in the rail vehicle sector), e.g. as training data for an AI.
- C/C A were determined for different simulated velocities/accelerations (C is the measured cost, so C/C A is the acceptance limit).
Landscapes
- Engineering & Computer Science (AREA)
- Physics & Mathematics (AREA)
- Data Mining & Analysis (AREA)
- General Physics & Mathematics (AREA)
- Mechanical Engineering (AREA)
- Theoretical Computer Science (AREA)
- Mathematical Physics (AREA)
- Computational Mathematics (AREA)
- Pure & Applied Mathematics (AREA)
- Mathematical Analysis (AREA)
- Mathematical Optimization (AREA)
- Probability & Statistics with Applications (AREA)
- General Engineering & Computer Science (AREA)
- Evolutionary Biology (AREA)
- Algebra (AREA)
- Bioinformatics & Computational Biology (AREA)
- Databases & Information Systems (AREA)
- Software Systems (AREA)
- Operations Research (AREA)
- Bioinformatics & Cheminformatics (AREA)
- Life Sciences & Earth Sciences (AREA)
- Health & Medical Sciences (AREA)
- Biomedical Technology (AREA)
- General Health & Medical Sciences (AREA)
- Automation & Control Theory (AREA)
- Management, Administration, Business Operations System, And Electronic Commerce (AREA)
Priority Applications (1)
| Application Number | Priority Date | Filing Date | Title |
|---|---|---|---|
| EP22212185.7A EP4383097A1 (fr) | 2022-12-08 | 2022-12-08 | Validation d'une série temporelle binaire simulée |
Applications Claiming Priority (1)
| Application Number | Priority Date | Filing Date | Title |
|---|---|---|---|
| EP22212185.7A EP4383097A1 (fr) | 2022-12-08 | 2022-12-08 | Validation d'une série temporelle binaire simulée |
Publications (1)
| Publication Number | Publication Date |
|---|---|
| EP4383097A1 true EP4383097A1 (fr) | 2024-06-12 |
Family
ID=84689179
Family Applications (1)
| Application Number | Title | Priority Date | Filing Date |
|---|---|---|---|
| EP22212185.7A Withdrawn EP4383097A1 (fr) | 2022-12-08 | 2022-12-08 | Validation d'une série temporelle binaire simulée |
Country Status (1)
| Country | Link |
|---|---|
| EP (1) | EP4383097A1 (fr) |
Cited By (1)
| Publication number | Priority date | Publication date | Assignee | Title |
|---|---|---|---|---|
| DE102024204664A1 (de) * | 2024-05-21 | 2025-11-27 | Siemens Mobility GmbH | Einstufiges Auswerten eines Achszähler-Zeitverlaufs |
Citations (4)
| Publication number | Priority date | Publication date | Assignee | Title |
|---|---|---|---|---|
| EP0530743A2 (fr) * | 1991-09-02 | 1993-03-10 | Stein GmbH | Dispositif de détection de roues de véhicules ferroviaires |
| DE102020201183A1 (de) * | 2020-01-31 | 2021-08-05 | Robert Bosch Gesellschaft mit beschränkter Haftung | Verfahren und Vorrichtung zur Simulation eines technischen Systems |
| DE102020117963A1 (de) * | 2020-07-08 | 2022-01-13 | Bayerische Motoren Werke Aktiengesellschaft | Verfahren, Vorrichtungen und Computerprogramme zum Trainieren eines Maschinenlern-Modells und zum Generieren von Trainingsdaten |
| DE102020213889A1 (de) * | 2020-11-04 | 2022-05-05 | Robert Bosch Gesellschaft mit beschränkter Haftung | Verfahren zum Validieren von Simulationsmodellen |
-
2022
- 2022-12-08 EP EP22212185.7A patent/EP4383097A1/fr not_active Withdrawn
Patent Citations (4)
| Publication number | Priority date | Publication date | Assignee | Title |
|---|---|---|---|---|
| EP0530743A2 (fr) * | 1991-09-02 | 1993-03-10 | Stein GmbH | Dispositif de détection de roues de véhicules ferroviaires |
| DE102020201183A1 (de) * | 2020-01-31 | 2021-08-05 | Robert Bosch Gesellschaft mit beschränkter Haftung | Verfahren und Vorrichtung zur Simulation eines technischen Systems |
| DE102020117963A1 (de) * | 2020-07-08 | 2022-01-13 | Bayerische Motoren Werke Aktiengesellschaft | Verfahren, Vorrichtungen und Computerprogramme zum Trainieren eines Maschinenlern-Modells und zum Generieren von Trainingsdaten |
| DE102020213889A1 (de) * | 2020-11-04 | 2022-05-05 | Robert Bosch Gesellschaft mit beschränkter Haftung | Verfahren zum Validieren von Simulationsmodellen |
Cited By (1)
| Publication number | Priority date | Publication date | Assignee | Title |
|---|---|---|---|---|
| DE102024204664A1 (de) * | 2024-05-21 | 2025-11-27 | Siemens Mobility GmbH | Einstufiges Auswerten eines Achszähler-Zeitverlaufs |
Similar Documents
| Publication | Publication Date | Title |
|---|---|---|
| DE102018128289B4 (de) | Verfahren und vorrichtung für eine autonome systemleistung und zur einstufung | |
| EP3393875B1 (fr) | Procédé de détection améliorée d'objets au moyen d'un système d'aide à la conduite | |
| DE102018130004B3 (de) | Auf einer support vector machine basierende intelligente fahrweise zum passieren von kreuzungen und intelligentes fahrsystem dafür | |
| DE102019220574A1 (de) | Verfahren und Vorrichtung zum Testen einer Maschine | |
| EP4383097A1 (fr) | Validation d'une série temporelle binaire simulée | |
| DE4121453C2 (de) | Näherungsschlußfolgerungsvorrichtung | |
| DE102019207319A1 (de) | Lehrdatenerzeugungseinrichtung und Lehrdatenerzeugungsverfahren | |
| EP3460727A1 (fr) | Procédé d'analyse d'un comportement fonctionnel d'un système technique et unité d'évaluation | |
| DE102021207613A1 (de) | Verfahren zur Qualitätssicherung eines Systems | |
| EP4000011B1 (fr) | Traitement de grandeurs d'entrée fondé sur des composants | |
| DE102019200828A1 (de) | Hauptobjektauswahl für eine Assistenzfunktion oder automatisierte Fahrfunktion eines Fahrerassistenz- oder Fahrsystems eines Kraftfahrzeugs | |
| DE102020214098A1 (de) | Verfahren zum Validieren von Simulationsmodellen | |
| DE102020110358A1 (de) | Ausbilden eines neuronalen Transformationsnetzwerks zur Datentransformation eines Trainingsdatensatzes | |
| EP4516623A1 (fr) | Approche basée sur le débogage pour évaluer un ensemble de données d'un compteur d'essieux | |
| DE102019114049A1 (de) | Verfahren zur Validierung eines Fahrerassistenzsystems mithilfe von weiteren generierten Testeingangsdatensätzen | |
| EP4435680A1 (fr) | Évaluation d'un ensemble de données sur la base d'une zone d'incertitude | |
| DE102023123146A1 (de) | Verfahren und System zur automatisierten Erkennung von Anomalien in Zeitreihendatensätzen | |
| EP4002217B1 (fr) | Procédé de réduction des données d'apprentissage | |
| DE102022213244A1 (de) | Fahrzeugsystem zur Erhöhung der Sicherheit eines Fahrzeugs, Verfahren und Verwendung | |
| DE112022006488T5 (de) | Informationsverarbeitungseinrichtung | |
| DE102021132025A1 (de) | Verfahren zum Bestimmen ähnlicher Szenarien, Trainingsverfahren und Trainingssteuergerät | |
| DE102020212235A1 (de) | Verfahren zur Qualitätssicherung eines beispielbasierten Systems | |
| EP4323862A1 (fr) | Procédé d'assurance qualité d'un système | |
| EP4191469A1 (fr) | Procédé de détermination des scénarios similaires, procédé d'apprentissage et appareil de commande d'apprentissage | |
| DE102019217951A1 (de) | Verfahren und Vorrichtung zum Bestimmen einer Domänendistanz zwischen mindestens zwei Datendomänen |
Legal Events
| Date | Code | Title | Description |
|---|---|---|---|
| PUAI | Public reference made under article 153(3) epc to a published international application that has entered the european phase |
Free format text: ORIGINAL CODE: 0009012 |
|
| STAA | Information on the status of an ep patent application or granted ep patent |
Free format text: STATUS: THE APPLICATION HAS BEEN PUBLISHED |
|
| AK | Designated contracting states |
Kind code of ref document: A1 Designated state(s): AL AT BE BG CH CY CZ DE DK EE ES FI FR GB GR HR HU IE IS IT LI LT LU LV MC ME MK MT NL NO PL PT RO RS SE SI SK SM TR |
|
| STAA | Information on the status of an ep patent application or granted ep patent |
Free format text: STATUS: THE APPLICATION IS DEEMED TO BE WITHDRAWN |
|
| 18D | Application deemed to be withdrawn |
Effective date: 20241213 |