EP4516925A1 - Dna-nachweisverfahren und dna-nachweiskit unter besonderer betrachtung der fluoreszenzintensitätsmessung und schmelzkurvenanalyse - Google Patents
Dna-nachweisverfahren und dna-nachweiskit unter besonderer betrachtung der fluoreszenzintensitätsmessung und schmelzkurvenanalyse Download PDFInfo
- Publication number
- EP4516925A1 EP4516925A1 EP24186547.6A EP24186547A EP4516925A1 EP 4516925 A1 EP4516925 A1 EP 4516925A1 EP 24186547 A EP24186547 A EP 24186547A EP 4516925 A1 EP4516925 A1 EP 4516925A1
- Authority
- EP
- European Patent Office
- Prior art keywords
- dna
- probe
- target
- fluorescent
- melting
- Prior art date
- Legal status (The legal status is an assumption and is not a legal conclusion. Google has not performed a legal analysis and makes no representation as to the accuracy of the status listed.)
- Pending
Links
Images




Classifications
-
- C—CHEMISTRY; METALLURGY
- C12—BIOCHEMISTRY; BEER; SPIRITS; WINE; VINEGAR; MICROBIOLOGY; ENZYMOLOGY; MUTATION OR GENETIC ENGINEERING
- C12Q—MEASURING OR TESTING PROCESSES INVOLVING ENZYMES, NUCLEIC ACIDS OR MICROORGANISMS; COMPOSITIONS OR TEST PAPERS THEREFOR; PROCESSES OF PREPARING SUCH COMPOSITIONS; CONDITION-RESPONSIVE CONTROL IN MICROBIOLOGICAL OR ENZYMOLOGICAL PROCESSES
- C12Q1/00—Measuring or testing processes involving enzymes, nucleic acids or microorganisms; Compositions therefor; Processes of preparing such compositions
- C12Q1/68—Measuring or testing processes involving enzymes, nucleic acids or microorganisms; Compositions therefor; Processes of preparing such compositions involving nucleic acids
- C12Q1/6844—Nucleic acid amplification reactions
- C12Q1/6851—Quantitative amplification
-
- C—CHEMISTRY; METALLURGY
- C12—BIOCHEMISTRY; BEER; SPIRITS; WINE; VINEGAR; MICROBIOLOGY; ENZYMOLOGY; MUTATION OR GENETIC ENGINEERING
- C12Q—MEASURING OR TESTING PROCESSES INVOLVING ENZYMES, NUCLEIC ACIDS OR MICROORGANISMS; COMPOSITIONS OR TEST PAPERS THEREFOR; PROCESSES OF PREPARING SUCH COMPOSITIONS; CONDITION-RESPONSIVE CONTROL IN MICROBIOLOGICAL OR ENZYMOLOGICAL PROCESSES
- C12Q1/00—Measuring or testing processes involving enzymes, nucleic acids or microorganisms; Compositions therefor; Processes of preparing such compositions
- C12Q1/68—Measuring or testing processes involving enzymes, nucleic acids or microorganisms; Compositions therefor; Processes of preparing such compositions involving nucleic acids
- C12Q1/6813—Hybridisation assays
- C12Q1/6816—Hybridisation assays characterised by the detection means
- C12Q1/6818—Hybridisation assays characterised by the detection means involving interaction of two or more labels, e.g. resonant energy transfer
Definitions
- the present invention relates to a DNA detection method and a DNA detection kit for analyzing a gene, and more specifically, to a DNA detection method and a DNA detection kit for detecting a gene using a fluorescent-labeled probe.
- PCR polymerase chain reaction
- real-time PCR real-time PCR
- digital PCR digital PCR
- DNA is detected using an intercalator or a fluorescent-labeled probe.
- a hydrolysis probe and a molecular beacon are often used in the DNA detection method using a fluorescent-labeled probe.
- the hydrolysis probe is degraded through the nuclease activity of DNA polymerase, the fluorescent dye is dissociated from the probe, thereby emitting fluorescence.
- the molecular beacon has a characteristic of not being degraded during PCR, the molecular beacon forms a stem-loop when it is present in a free form and binds to the loop portion of DNA to be detected.
- the molecular beacon forms a stem-loop when it is present in a free form and binds to the loop portion of DNA to be detected.
- the present inventors have developed a technique of applying an asymmetric PCR using a molecular beacon to digital PCR, and identifying the genotype of a target DNA with high sensitivity and high multiplex by melting curve analysis after amplification (PTL 1 and NPL 2).
- a detection method of digital PCR is shown below.
- a DNA polymerase, a primer set, and a fluorescent-labeled probe necessary for PCR are added to a limitedly diluted specimen to prepare a PCR reaction solution.
- the PCR reaction solution is divided into micro partitions such as wells or droplets. At this time, one molecule of the target DNA is contained or not contained in each partition.
- the target DNA in the micro partition is amplified by PCR.
- the target DNA can be quantified by measuring a fluorescence intensity of each micro partition after PCR and counting the number of micro partitions having a fluorescence intensity exceeding threshold.
- melting curve analysis is performed on the target DNA amplified in the micro partition and the molecular beacon after PCR, and a genotype of the target DNA can be identified by a difference in melting temperature (Tm).
- the present inventors have recognized for the first time that the magnitude of variation in melting temperature in the measurement data (distribution of melting temperatures measured when the target DNA is present or when the target DNA is not present) varies depending on the type of the target DNA and the sequence of the molecular beacon (Example 1).
- the beacons being modified with an identical fluorescent dye, based on the melting temperature, a large variation in melting temperature causes overlapping of distributions of melting temperatures of different target genes or target DNAs.
- a target DNA may be erroneously determined as a gene different from the target DNA, and a false positive may occur.
- an object of the present invention is to provide a DNA detection method and a DNA detection kit which can reduce the magnitude of variation in melting temperature of a target DNA to be identified based on a difference in melting temperatures, and accurately determine and quantify the target DNA.
- the present inventors have compared the melting curve of a gene having a large variation in melting temperature with the melting curve of a gene having a small variation in melting temperature, and found that the melting curve of the gene having a small variation in melting temperature has a large change in the fluorescence intensity accompanying the temperature change, and thus the magnitude of the peak of the differential curve of the melting curve is large. Further, the present inventors have revealed that, in a combination of a gene and a molecular beacon in which the variation in melting temperature is small, when the sequences of the gene and the molecular beacon are observed, the ratio at which a molecular beacon binding region of one strand of DNA excessively amplified by the asymmetric PCR forms a double-stranded structure is small.
- the present inventors have found that when an additive for preventing secondary structure formation of a nucleic acid such as DNA is added to a reaction solution, the reaction solution is divided into micro partitions, and PCR and melting curve analysis are performed in each of the micro partitions, resulting an increased change in the fluorescence intensity accompanying the temperature change of the melting curve, and a reduction in the variation in melting temperature, and thus completed the present invention.
- the present invention provides a DNA detection kit including:
- a DNA detection method and a DNA detection kit which can accurately and sensitively detect or quantify a target DNA, particularly a plurality of types of target genes or target DNAs, based on a difference in melting temperatures obtained by melting curve analysis. Therefore, the present invention is useful in the fields of basic research, test, drug discovery, and the like for detecting genes, identifying genotypes, and the like.
- the present invention provides a DNA detection method, and the method includes the steps of:
- the test biological sample may not be particularly limited as long as it is a biological sample that contains DNA containing or possibly containing a target DNA to be detected, and examples thereof include body fluid samples (such as blood and urine), tissues, and cultured cells, may include DNAs extracted and purified from these samples (such as genomic DNA and circulating DNA), or may include DNAs derived from mRNA extracted and purified from the samples (such as cDNA).
- synthesized DNA may be used as a test biological sample to design a suitable probe and/or primer.
- test biological sample is a body fluid sample, a tissue, a cultured cell, or the like
- DNA or the like available by pretreatment in advance for the amplification reaction performed by the method of the present invention.
- Methods for preparing DNA from such samples are known in the art, and kits for simply purifying DNA, and kits for extracting mRNA and synthesizing cDNA are also commercially available.
- the target DNA may be a site or region of specific DNA to be detected, and may include, for example, a gene, a mutation in a gene, a regulatory sequence of a gene, and a mutation in a regulatory sequence of a gene.
- the target DNA may be one type or a plurality of types.
- the reaction solution may be prepared by mixing a fluorescent-labeled probe for a target DNA, a primer set for amplifying a region containing the target DNA, a test biological sample, an enzyme, and an additive for preventing DNA secondary structure formation.
- the probe may be designed such that at least a part thereof has a sequence specific to the nucleotide sequence of the target DNA, i.e., a sequence complementary to the nucleotide sequence of the gene.
- probes are required for each of the plurality of target genes or target DNAs.
- the number of probes may be prepared depending on the type of the target DNA.
- a probe having a sequence complementary to the wild-type sequence may be prepared, and the target genetic mutation can also be detected based on a mismatched base, since a melting temperature lower than that of a completely complementary wild-type sequence may be observed when the mismatched base is included.
- probes that can be used in the present invention may be designed to have the length and nucleotide composition (melting temperature) which allow specific binding (hybridization).
- the length of a sequence portion specific to the target DNA may be preferably 10 bases or more, more preferably 15 to 50 bases, and still more preferably 15 to 30 bases, for example, about 20 bases.
- Tm melting temperature
- Known probe design software can be used to confirm Tm.
- the probe may be fluorescently labeled and specifically may contain a fluorescent dye, or may contain a fluorescent dye and a quenching dye (quencher).
- the fluorescence intensity of the fluorescent dye may be used to measure the binding between the DNA and the probe amplified in the amplification reaction to be described later.
- the fluorescent dye as well as the combination of the fluorescent dye and the quenching dye are well known in the art, and those skilled in the art can select an appropriate one in view of the amplification reaction and melting curve analysis.
- 3'-terminal and 5'-terminal sequences of the probe may have complementary sequence portions or interacting structures, and the probe in a free form (when not bound to the amplified DNA) may cause the fluorescent dye to be quenched.
- 3'-terminal and 5'-terminal sequences of the probe may have complementary sequence portions, and the 3'-terminal and 5'-terminal sequences of the probe may be bound to form a stem-loop structure. That is, the probe may preferably be a molecular beacon.
- the probes when the probe includes a plurality of types of probes, the probes may be labeled with an identical fluorescent dye.
- the designed probe can be chemically synthesized by a known oligonucleotide synthesis method, but may usually be synthesized using a commercially available chemical synthesizer.
- the primer set for amplifying the region containing the target DNA may be designed such that the probe described above can bind to a part of the region amplified using the primer set.
- a primer design method is well known in the art, and primers that can be used in the present invention may be designed to satisfy conditions allowing for specific annealing, for example, to have a length and nucleotide composition (melting temperature) that allows specific annealing.
- the length with a function as a primer may be preferably 10 bases or more, more preferably 15 to 50 bases, and still more preferably 15 to 30 bases, for example, about 20 bases.
- Tm melting temperature
- the designed primer can be can be chemically synthesized by a known oligonucleotide synthesis method, but may usually be synthesized using a commercially available chemical synthesizer.
- the enzyme may be a polymerase capable of performing an amplification reaction, i.e., an extension reaction using DNA as a template, and any known DNA polymerase can be used.
- the enzyme may be a DNA polymerase used in the amplification reaction performed with a cycle of temperature change.
- the additive for preventing DNA secondary structure formation is not particularly limited as long as it has a preventive effect on the DNA secondary structure formation.
- Examples of the additive for preventing DNA secondary structure formation may include betaine (e.g., trimethylglycine, carnitine, proline betaine, 2-(trimethylammonio)acetate), dimethylsulfoxide (DMSO), formamide, 7-deaza dGTP (7-deaza-2'-deoxyguanosine), and a nonionic surfactant (e.g., Triton X-100, Tween 20 or Nonidet P-40 (NP-40)).
- betaine e.g., trimethylglycine, carnitine, proline betaine, 2-(trimethylammonio)acetate
- DMSO dimethylsulfoxide
- formamide 7-deaza dGTP (7-deaza-2'-deoxyguanosine
- a nonionic surfactant e.g., Triton X-100, Tween 20 or
- a betaine zwitterion prevents DNA secondary structure formation by equally stabilizing both AT and GC base pairs
- DMSO and formamide prevent DNA secondary structure formation by reducing the hydrogen bonding between two DNA strands
- 7-deaza dGTP prevents DNA secondary structure formation by reducing the stability of double-stranded DNA
- the amount of each of the components to be mixed may be appropriately set for the amplification reaction to be described later.
- the amplification reaction may be performed by increasing the amount of either the forward primer or the reverse primer (asymmetric PCR).
- asymmetric PCR see, for example, Anal. Chem., 92, 11705-11713, 2020 (NPL 2).
- the reaction solution may be divided into a plurality of micro partitions, and an amplification reaction may be performed on each of the plurality of micro partitions.
- the amplification reaction in micro partitions is known in the art and is referred to, for example, as digital PCR (dPCR) (PTL 1 and NPL 1).
- dPCR digital PCR
- Known micro partitions may include wells, droplets, and the like, and are operated such that one molecule of the target DNA is contained or not contained in each of the micro partitions.
- the amplification reaction can be performed by any amplification reaction as long as it is an amplification reaction known in the art.
- the amplification reaction may be an amplification reaction that is performed with a cycle of temperature change, preferably the polymerase chain reaction (PCR).
- PCR polymerase chain reaction
- the amplification reaction may be performed by the asymmetric PCR.
- the binding between the DNA amplified in the amplification reaction and the probe may be measured.
- the binding between the DNA obtained by the amplification reaction and the probe may be measured by measuring a fluorescence intensity of each of the plurality of micro partitions while changing a temperature of each of the micro partitions.
- this step may include measuring a fluorescence intensity while changing a temperature of each of the micro partitions at a sampling interval of less than 1°C, for example at an interval of 0.01°C to 0.99°C, preferably at an interval of 0.3°C to 0.5°C.
- melting curve analysis may be performed on each of the micro partitions to calculate a melting temperature. Since the binding varies depending on the melting temperature, the melting temperature of the duplex between the amplified DNA and the probe can be calculated from the change in the binding (i.e., the change in the fluorescence intensity) accompanying the temperature change of the solution. Such an operation is referred to as melting curve analysis.
- the binding between the amplified DNA and the probe may be measured for each cycle of temperature change of the solution, and it may also be possible to determine the target DNA of interest from the relationship between the number of cycles and the change in the binding.
- the amplification reaction and the melting curve analysis may be performed as described above, and thus the presence or absence and/or the type of the target DNA may be determined for each micro partition from the fluorescence color (the type of the probe, i.e., the target DNA), the fluorescence intensity (binding), and the melting temperature.
- the target DNA may include a plurality of target genes or target DNAs
- melting curve analysis may be performed on each of the plurality of target genes or target DNAs to determine the presence or absence and/or the type of each of the target genes or target DNAs. Further, it may also be possible to quantify the copy number of target genes or target DNAs or the abundance ratio of the target DNA to the wild-type DNA in the test biological sample.
- the method may further include a step of counting a number of the target DNA by combining the determination results of the plurality of micro partitions based on the determination.
- the DNA detection method of the present invention will be specifically described with reference to the schematic view and diagrams of FIGS. 1 to 6 .
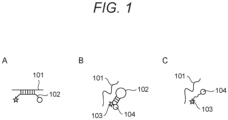
- FIG. 1 is a schematic view showing an example of a method for measuring a melting temperature of DNA using a fluorescent-labeled probe.
- the fluorescent-labeled probe may include molecular beacons and Pleiades probes.
- FIG. 1 will be described using a molecular beacon as an example.
- a fluorescent-labeled probe 102 which is a molecular beacon, may be configured as an oligonucleotide, and may have a sequence complementary to a sequence (amplified DNA 101) between a primer pair used in an amplification reaction for amplifying a target DNA.
- the molecular beacon may have sequence portions that are complementary to each other at both ends, and a fluorescent dye 103 may be provided at one end of the ends and a quenching dye (quencher) 104 may be provided at the other end.
- the fluorescent-labeled probe (molecular beacon) 102 may exist alone in a free form.
- the fluorescent-labeled probe (molecular beacon) 102 may form a stem-loop in a complementary sequence portion, the fluorescent dye 103 and the quencher 104 may be close to each other, and thus fluorescence may not be emitted.
- a structure with a high degree of freedom may be formed as in C of FIG. 1 .
- the fluorescent dye and the quenching dye may not be always separated, fluorescence remains quenched.
- an annealing step when the temperature is lowered to a temperature of about room temperature, a loop portion of the fluorescent-labeled probe (molecular beacon) 102 may be annealed to DNA 101 amplified in the specimen solution as shown in A of FIG. 1 .
- the fluorescent dye 103 and the quencher 104 may always be separated from each other, and thus the fluorescent-labeled probe 102 may emit strong fluorescence.
- the fluorescent-labeled probe (molecular beacon) 102 may be dissociated as shown in B of FIG. 1 again, and the fluorescence may be quenched.
- the fluorescence may remain quenched.
- the fluorescence intensity may be measured at any stage during heating or cooling.
- the fluorescence intensity can be measured in a similar manner.
- heating or cooling may be performed only to measure the fluorescence intensity, and then the fluorescence intensity may be measured.
- a change in the fluorescence intensity accompanying the temperature change may be plotted to create a melting curve, and the melting temperature can be calculated from the melting curve.
- the combination of the fluorescent dye 103 and the quencher 104 may not be particularly limited as long as it is a combination generally used for real-time PCR.
- the fluorescent dye 103 may include FAM, VIC, ROX, Cy3, and Cy5
- examples of the quencher 104 may include TAMRA, BHQ1, BHQ2, and BHQ3. All of them may be commonly used and may be available as commercial products.
- the two types of target genes or target DNAs can be distinguished and detected in one reaction system by preparing sequences of the fluorescent-labeled probe (molecular beacon) 102 that specifically bind to the target genes or target DNAs, and binding different fluorescent dyes thereto.
- the sequences of the molecular beacon may be designed such that the melting temperatures of two types of molecular beacons are different, and thus, even when an identical fluorescent dye is bound, the two types of target genes or target DNAs can be distinguished and detected in one reaction system.
- FIG. 2 shows an example of a result obtained by a method for determining and counting the presence or absence of a plurality of genes in each micro partition based on the melting temperature measured using a fluorescent-labeled probe in digital PCR (dPCR). Similarly to A of FIG.
- melting temperature distributions of two types of genes i.e., a melting temperature distribution 201 of a gene having a high melting temperature and a melting temperature distribution 202 of a gene having a low melting temperature
- a micro partition 203 containing a gene having a high melting temperature may erroneously be observed within the threshold of the melting temperature distribution 202 of a gene having a low melting temperature, and may be counted as a different gene.
- the melting temperature distributions 201 and 202 may be separated, and the probability of erroneous determination of the type of gene may be reduced.
- FIG. 3 shows graphs showing an example of melting curves of a micro partition containing a gene having a large or small variation in melting temperature.
- a of FIG. 3 shows an example of a melting curve of a gene having a small variation in melting temperature
- C and D of FIG. 3 show examples of a melting curve of a gene having a large variation in melting temperature.
- the fluorescent-labeled probe in a melting curve 302 of the micro partition (positive well) containing the target DNA, the fluorescent-labeled probe may bind to the corresponding DNA and may exhibit high fluorescence intensity at low temperature, and the fluorescent-labeled probe may be dissociated from the corresponding DNA with an increase in temperature, and thus the fluorescence intensity may decrease.
- a melting curve 303 of the micro partition (negative well) not containing the target DNA may have no change in the fluorescence intensity accompanying the temperature change, because the micro partition does not contain DNA to which the fluorescent-labeled probe binds.
- a differential curve is determined from A of FIG. 3 , a high peak is shown at 60°C as in B of FIG. 3 , and the temperature of the peak is a melting temperature (Tm) 301.
- Tm melting temperature
- the fluorescent-labeled probe in the melting curve 302 of the micro partition containing the target DNA, the fluorescent-labeled probe may bind to the corresponding DNA at low temperature, but the binding amount may be small, and the fluorescence intensity may be lower than that in A of FIG. 3 .
- the differential curve may have a low peak height and may become a broad peak (a peak having a shape that extends laterally and has a low height).
- E of FIG. 3 Another example of a melting curve when a gene having a large variation in melting temperature is measured is shown in E of FIG. 3 , and a differential curve thereof is shown in F of FIG. 3 .
- E of FIG. 3 in the melting curve 302 of the micro partition containing the target DNA, the fluorescent-labeled probe may bind to the corresponding DNA and may exhibit high fluorescence intensity at low temperature.
- the decrease in fluorescence intensity may be small, and the change in the fluorescence intensity accompanying the temperature change may be smaller than that in A of FIG. 3 .
- the fluorescent-labeled probe may be dissociated from the corresponding DNA, and then the fluorescent-labeled probe may form a secondary structure different from the stem-loop, and the fluorescent dye and the quenching dye may not quench without forming a close structure, and may emit fluorescence.
- F of FIG. 3 the differential curve has a low peak height and becomes a broad peak.
- C and E of FIG. 3 may have different shapes of melting curves, but may have a common feature that the change in the fluorescence intensity accompanying the temperature change is small.
- differential curves of the melting curves may both have broad peaks as in D and F of FIG. 3 . In the differential curve having a broad peak, the variation of melting temperature 301 may easily increase due to measurement errors.
- the melting curve when an additive for preventing DNA secondary structure formation is added to the reaction solution, the melting curve may change from the shapes of C and E in FIG. 3 to the shape of A in FIG. 3 . Further, the differential curve of the melting curve which is a broad peak may also change to a sharp peak as in B of FIG. 3 . As a result, the variation in the melting temperature 301 due to measurement errors may be reduced.
- FIG. 4 is a flowchart showing one embodiment of a DNA detection method including: adding an additive for preventing DNA secondary structure formation to a reaction solution; performing digital PCR using melting curve analysis; and quantifying the copy number of target DNA.
- probes corresponding to a plurality of target genes or target DNAs are designed (S401).
- a probe, a biological sample, an enzyme, a primer set, and an additive for preventing DNA secondary structure formation may be mixed, the mixture may be divided into wells, and then PCR may be performed in each of the wells (S402).
- a melting curve between the probe corresponding to each of the target genes or target DNAs and the amplified product (amplified DNA) may be obtained by melting curve analysis (S403).
- the presence or absence of the target DNA may be determined from the fluorescence color, fluorescence intensity, and melting temperature of each of the wells (S404). Finally, wells containing each of the target genes or target DNAs and wells not containing both target genes or target DNAs may be counted, and their starting concentrations may be calculated by Poisson correction (S405).
- a plurality of primers and a plurality of probes may be prepared in accordance with the target genes or target DNAs.
- an amplification reaction e.g., asymmetric PCR
- the plurality of probes may be designed by changing the melting temperature of DNA of the target genes or target DNAs or changing the type of fluorescent dye, and thus it may be possible to discriminate the type of target genes or target DNAs contained in the solution from the fluorescence color and melting temperature of the solution after the amplification reaction.
- PCR and melting curve analysis may be performed in the presence of the additive for preventing DNA secondary structure formation, or melting curve analysis may be performed in the presence of the additive for preventing DNA secondary structure formation, whereby a variation in melting temperature may be reduced and an error bar may also be reduced.
- the target DNA particularly a plurality of target genes or target DNAs, can be detected or quantified with accuracy and high sensitivity.
- the above-described method of the present invention can be more easily and simply performed by using a kit including at least an additive for preventing DNA secondary structure formation.
- the present invention provides a DNA detection kit, and the kit includes:
- the fluorescent-labeled probe may be as described in the previous section, and the fluorescent dye or the melting temperature may vary for each target DNA.
- the probe may contain a fluorescent dye and a quenching dye, 3'-terminal and 5'-terminal sequences of the probe may have complementary sequence portions or interacting structures, and the probe in a free form may cause the fluorescent dye to be quenched.
- the forward primer and the reverse primer may be as described in the previous section.
- concentrations of the forward primer and the reverse primer included in the kit of the present invention may be different, and the concentration of either the forward primer or the reverse primer may be made higher (for the asymmetric PCR).
- concentration of the primer that synthesizes the complementary strand of the fluorescent-labeled probe may be higher.
- the additive for preventing DNA secondary structure formation may be as described in the previous section.
- the additive for preventing DNA secondary structure formation may include at least one selected from the group consisting of betaine (e.g., trimethylglycine), dimethylsulfoxide (DMSO), formamide, 7-deaza dGTP, and a nonionic surfactant.
- the kit according to the present invention may further include a DNA polymerase.
- the DNA polymerase is also as described above and any DNA polymerase can be used.
- the kit according to the present invention may further include other components necessary for performing the amplification reaction, for example, a substrate. Further, the kit may include instructions describing the procedure and protocol for determining the target DNA.
- the DNA detection kit of the present invention can be used for performing the DNA detection method of the present invention described above.
- the DNA detection kit of the present invention can be used for detecting a target DNA by a combination of PCR and melting curve analysis, and an additive for preventing DNA secondary structure formation may be added when PCR and melting curve analysis are performed, or an additive for preventing DNA secondary structure formation may be added when melting curve analysis is performed.
- the DNA detection kit of the present invention may be useful for determining the presence or absence of the target DNA (particularly a plurality of target genes or target DNAs) and determining the positional relationship (cis form or trans form) of these target genes or target DNAs as alleles.
- the DNA detection kit of the present invention can be used for evaluating the phenotype (e.g., the possibility of affection of a disease or disorder or drug responsiveness) associated with the target DNA (particularly, genetic mutation).
- the phenotype e.g., the possibility of affection of a disease or disorder or drug responsiveness
- the target DNA particularly, genetic mutation
- Wild-type genomic DNA (final concentration: 133 molecules/ ⁇ L, genomic DNA reference standard (KRAS Wild Type Reference Standard, Catalog ID: HD710, manufactured by Horizon Discovery Ltd.) was prepared.
- a forward primer corresponding to each target DNA required for PCR (final concentration: 0.25 ⁇ M)
- a reverse primer corresponding to the target DNA (final concentration: 2.0 ⁇ M)
- a fluorescent-labeled probe corresponding to the target DNA (final concentration: 0.5 ⁇ M)
- 1x master mix including DNA polymerase and dNTP
- primer pair was added such that the concentration of the primer pair was asymmetric such that the complementary DNA strand of the fluorescent-labeled probe was excessively amplified (the concentration of the reverse primer was set high).
- Sequences of primers and probes are as follows.
- PCR reaction solution 15 ⁇ L was divided into 20,000 wells, and DNA was amplified by PCR.
- reaction was performed at 96°C for 10 minutes, followed by 59 cycles of cycles (60°C for 2 minutes, then 98°C for 30 seconds), and finally at 60°C for 2 minutes.
- a fluorescence image of the chip was acquired at an interval of 0.35°C by a digital PCR apparatus for melting curve analysis, a change in the fluorescence intensity of each well was observed from the obtained fluorescence image, and melting curves were measured and analyzed.
- FIG. 5 shows results of measuring the melting curve and the distribution of the melting temperature of each gene when an additive for preventing DNA secondary structure formation is not added.
- a and B of FIG. 5 show the distribution of the melting curve and melting temperature of the KRAS gene
- C and D of FIG. 5 show the distribution of the melting curve and melting temperature of the hTERT gene
- E and F of FIG. 5 show the distribution of the melting curve and melting temperature of the GNAS gene.
- the melting curve of the KRAS gene showed a large change in the fluorescence intensity accompanying the temperature change.
- the melting temperature had a small variation, and the variation was 0.33°C or less.
- C of FIG. 5 shows results of measuring the melting curve and the distribution of the melting temperature of each gene when an additive for preventing DNA secondary structure formation is not added.
- a and B of FIG. 5 show the distribution of the melting curve and melting temperature of the KRAS gene
- C and D of FIG. 5 show the distribution of the melting curve and melting temperature of the hTERT gene
- the melting curve of the hTERT gene showed a small change in the fluorescence intensity accompanying the temperature change.
- the melting temperature had a large variation, and the variation was 0.90°C.
- E of FIG. 5 in the melting curve of the GNAS gene, a difference in fluorescence intensity between the positive well containing the target DNA and the negative well not containing the target DNA was large at low temperature.
- a decrease in fluorescence intensity of the positive well due to an increase in temperature was small, and the fluorescence intensity remained high even at high temperature.
- a change in the fluorescence intensity accompanying the temperature change was small, the variation in the melting temperature was large as shown in F of FIG. 5 , and the variation was 0.97°C.
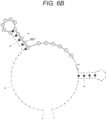
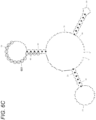
- FIGS. 6A , 6B , and 6C show the sequences (SEQ ID NOs: 10 to 12) of amplicons corresponding to KRAS, hTERT, and GNAS genes, respectively, along with predicted secondary structures and probe binding regions 601. Amplicons may form a double-stranded structure in themselves, as shown in FIGS. 6A to 6C . In FIGS. 6A to 6C , each region 601 to which the fluorescent-labeled probe binds is circled. FIG.
- FIGS. 6A and 6C show that, in the KRAS gene having a small variation in melting temperature, a ratio at which a fluorescent-labeled probe binding region of one strand of DNA excessively amplified by the asymmetric PCR forms a double-stranded structure is small. Meanwhile, referring to the sequences of the amplicons and the fluorescent-labeled probes of the hTERT and GNAS genes having a large variation in melting temperature, as shown in FIGS. 6B and 6C , the ratio at which the fluorescent-labeled probe binding region of one strand of DNA excessively amplified by the asymmetric PCR forms a double-stranded structure is large.
- the fluorescent-labeled probe is redesigned such that the fluorescent-labeled probe binding region of the KRAS gene is changed from a region in which the ratio of forming a double-stranded structure of one strand of DNA excessively amplified is low to a region in which the ratio described above is high, the fluorescence intensity at low temperature is reduced ( PCT/JP2022/024591 ).
- Example 2 From the results of Example 1, it was expected that the variation in melting temperature would be reduced by preventing the DNA secondary structure formation. Therefore, in this example, an example is shown in which the variation in melting temperature is reduced and the target DNA is accurately measured by adding an additive for preventing DNA secondary structure formation and performing real-time PCR using melting curve analysis.
- wild-type genomic DNA (final concentration: 133 molecules/ ⁇ L) was prepared.
- a forward primer corresponding to the hTERT gene required for PCR (final concentration: 0.25 ⁇ M)
- a reverse primer corresponding to the hTERT gene (final concentration: 2.0 ⁇ M)
- a fluorescent-labeled probe corresponding to the hTERT gene (final concentration: 0.5 ⁇ M)
- 1x master mix (including DNA polymerase and dNTP) were added.
- the additive trimethylglycine, DMSO, or formamide, i.e., a type of betaine, was added at different concentrations.
- the primer pair was added such that the concentration of the primer pair was asymmetric such that the complementary DNA strand of the fluorescent-labeled probe was excessively amplified (the concentration of the reverse primer was set high).
- Primers and probes are identical to the primers and probes used in Example 1.
- reaction was performed at 95°C for 20 minutes, followed by 60 cycles of cycles (95°C for 1 second, then 60°C for 20 seconds). After the reaction, a change in fluorescence intensity was observed with a real-time PCR apparatus while heating from 50°C to 95°C, and a melting curve was measured and analyzed.
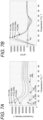
- FIG. 7A shows melting curves when betaine (trimethylglycine) was added at a concentration varying from 0 M to 1 M
- FIG. 7B shows differential curves of the melting curves
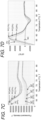
- FIG. 7C shows melting curves when DMSO was added at a concentration varying from 0% to 4%
- FIG. 7D shows differential curves of the melting curves
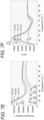
- FIG. 7E shows melting curves when formamide was added at a concentration varying from 0% to 4%
- FIG. 7F shows differential curves of the melting curves.
- PC represents a melting curve of a well containing a target DNA and a differential curve thereof
- NC represents a melting curve of a well not containing a target DNA and a differential curve thereof.
- Each numerical value in parentheses after PC and NC represents the concentration of each additive.
- trimethylglycine i.e., a type of betaine
- digital PCR using melting curve analysis was performed to evaluate the variation in melting temperature.
- Example 1 wild-type genomic DNA (final concentration: 133 molecules/ ⁇ L) was prepared.
- a forward primer corresponding to each target DNA required for PCR (final concentration: 0.25 ⁇ M)
- a reverse primer corresponding to the target DNA (final concentration: 2.0 ⁇ M)
- a fluorescent-labeled probe corresponding to the target DNA (final concentration: 0.5 ⁇ M)
- 0.5M trimethylglycine 0.5M trimethylglycine
- 1x master mix including DNA polymerase and dNTP
- the primer pair was added such that the concentration of the primer pair was asymmetric such that the complementary DNA strand of the fluorescent-labeled probe was excessively amplified (the concentration of the reverse primer was set high).
- Primers and probes are identical to the primers and probes used in Example 1.
- PCR reaction solution 15 ⁇ L was divided into 20,000 wells, and DNA was amplified by PCR.
- reaction was performed at 96°C for 10 minutes, followed by 59 cycles of cycles (60°C for 2 minutes, then 98°C for 30 seconds), and finally at 60°C for 2 minutes.
- a fluorescence image of the chip was acquired at an interval of 0.35°C by a digital PCR apparatus for melting curve analysis, a change in the fluorescence intensity of each well was observed from the obtained fluorescence image, and melting curves were measured and analyzed.
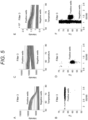
- FIG. 8 shows the results of performing digital PCR using melting curve analysis in the presence or absence of trimethylglycine to measure variations in the melting curve and melting temperature of the hTERT gene.
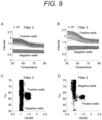
- FIG. 9 shows the results of measuring the melting curve of GNAS gene and the variation in melting temperature.
- A shows melting curves in the absence of trimethylglycine
- B shows melting curves in the presence of trimethylglycine
- C shows a distribution of melting temperature in the absence of trimethylglycine
- D shows a distribution of melting temperature in the presence of trimethylglycine. It can be seen that the variation in melting temperature is reduced in both the hTERT gene and the GNAS gene.
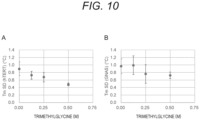
- a and B of FIG. 10 show graphs summarizing variations in trimethylglycine concentration and melting temperature for hTERT gene and GNAS gene.
- the higher the concentration of trimethylglycine the smaller the distribution of melting temperature.
- the distribution of hTERT gene melting temperature was reduced from 0.90°C to 0.48°C (47% reduction) (A in FIG. 10 ) and the distribution of GNAS gene Tm value was reduced from 0.97°C to 0.72°C (26% reduction) (B in FIG. 10 ).
- variations between measurements in a plurality of measurements were indicated by error bars in A and B of FIG. 10 .
- the error bar in each graph was reduced as the concentration of trimethylglycine was increased, which suggested that the addition of betaine such as trimethylglycine reduced the difference between the measurements of the distribution of melting temperature, and increased the reproducibility of the measurement results.
- an additive for preventing DNA secondary structure formation may be added and digital PCR using melting curve analysis is performed, as a result of which the variation in melting temperature is reduced, and the target DNA can be accurately identified based on the melting temperature, the fluorescent dye color, and the fluorescence intensity.
- SEQ ID Nos: 1 to 12 DNA (synthetic construct), synthetic polynucleotide
Landscapes
- Chemical & Material Sciences (AREA)
- Organic Chemistry (AREA)
- Life Sciences & Earth Sciences (AREA)
- Zoology (AREA)
- Wood Science & Technology (AREA)
- Proteomics, Peptides & Aminoacids (AREA)
- Health & Medical Sciences (AREA)
- Engineering & Computer Science (AREA)
- Microbiology (AREA)
- Biochemistry (AREA)
- Physics & Mathematics (AREA)
- Molecular Biology (AREA)
- Biotechnology (AREA)
- Biophysics (AREA)
- Analytical Chemistry (AREA)
- Immunology (AREA)
- Bioinformatics & Cheminformatics (AREA)
- General Engineering & Computer Science (AREA)
- General Health & Medical Sciences (AREA)
- Genetics & Genomics (AREA)
- Chemical Kinetics & Catalysis (AREA)
- Measuring Or Testing Involving Enzymes Or Micro-Organisms (AREA)
Applications Claiming Priority (1)
| Application Number | Priority Date | Filing Date | Title |
|---|---|---|---|
| JP2023140686A JP2025034360A (ja) | 2023-08-31 | 2023-08-31 | Dna検出方法およびdna検出キット |
Publications (1)
| Publication Number | Publication Date |
|---|---|
| EP4516925A1 true EP4516925A1 (de) | 2025-03-05 |
Family
ID=91828956
Family Applications (1)
| Application Number | Title | Priority Date | Filing Date |
|---|---|---|---|
| EP24186547.6A Pending EP4516925A1 (de) | 2023-08-31 | 2024-07-04 | Dna-nachweisverfahren und dna-nachweiskit unter besonderer betrachtung der fluoreszenzintensitätsmessung und schmelzkurvenanalyse |
Country Status (3)
| Country | Link |
|---|---|
| US (1) | US20250075266A1 (de) |
| EP (1) | EP4516925A1 (de) |
| JP (1) | JP2025034360A (de) |
Citations (7)
| Publication number | Priority date | Publication date | Assignee | Title |
|---|---|---|---|---|
| US20150125855A1 (en) * | 2013-11-06 | 2015-05-07 | National Taiwan University | Method of snp detection by using gene detection technique in bead-based microfluidics |
| WO2018128013A1 (ja) * | 2017-01-05 | 2018-07-12 | 株式会社日立製作所 | Pcrの測定方法および測定装置 |
| WO2019239805A1 (ja) * | 2018-06-14 | 2019-12-19 | 株式会社日立製作所 | デジタルpcrの測定方法および測定装置 |
| US20220364164A1 (en) * | 2019-06-26 | 2022-11-17 | Hitachi, Ltd. | Digital pcr measurement method and measurement device |
| WO2022259334A1 (ja) * | 2021-06-07 | 2022-12-15 | 株式会社日立ハイテク | Dna検出方法およびdna検出システム |
| US20230053441A1 (en) * | 2020-01-16 | 2023-02-23 | Hitachi High-Tech Corporation | Method and system for dna detection |
| JP2023140686A (ja) | 2022-03-23 | 2023-10-05 | 村田機械株式会社 | 制御システム |
-
2023
- 2023-08-31 JP JP2023140686A patent/JP2025034360A/ja active Pending
-
2024
- 2024-07-04 EP EP24186547.6A patent/EP4516925A1/de active Pending
- 2024-07-08 US US18/765,470 patent/US20250075266A1/en active Pending
Patent Citations (8)
| Publication number | Priority date | Publication date | Assignee | Title |
|---|---|---|---|---|
| US20150125855A1 (en) * | 2013-11-06 | 2015-05-07 | National Taiwan University | Method of snp detection by using gene detection technique in bead-based microfluidics |
| WO2018128013A1 (ja) * | 2017-01-05 | 2018-07-12 | 株式会社日立製作所 | Pcrの測定方法および測定装置 |
| US20190352699A1 (en) | 2017-01-05 | 2019-11-21 | Hitachi, Ltd. | Pcr measuring method and measurement device |
| WO2019239805A1 (ja) * | 2018-06-14 | 2019-12-19 | 株式会社日立製作所 | デジタルpcrの測定方法および測定装置 |
| US20220364164A1 (en) * | 2019-06-26 | 2022-11-17 | Hitachi, Ltd. | Digital pcr measurement method and measurement device |
| US20230053441A1 (en) * | 2020-01-16 | 2023-02-23 | Hitachi High-Tech Corporation | Method and system for dna detection |
| WO2022259334A1 (ja) * | 2021-06-07 | 2022-12-15 | 株式会社日立ハイテク | Dna検出方法およびdna検出システム |
| JP2023140686A (ja) | 2022-03-23 | 2023-10-05 | 村田機械株式会社 | 制御システム |
Non-Patent Citations (4)
| Title |
|---|
| ANAL. CHEM., vol. 92, 2020, pages 11705 - 11713 |
| BMC MICROBIOL., vol. 13, 2013, pages 295 |
| JUNKO TANAKA ET AL: "KRAS genotyping by digital PCR combined with melting curve analysis", SCIENTIFIC REPORTS, vol. 9, no. 1, 22 February 2019 (2019-02-22), XP055664276, DOI: 10.1038/s41598-019-38822-1 * |
| KARUNANATHIE ET AL.: "Biochimie", vol. 197, 2022, A&T CORPORATION, pages: 130 - 143 |
Also Published As
| Publication number | Publication date |
|---|---|
| US20250075266A1 (en) | 2025-03-06 |
| JP2025034360A (ja) | 2025-03-13 |
Similar Documents
| Publication | Publication Date | Title |
|---|---|---|
| SG185543A1 (en) | Assays for the detection of genotype, mutations, and/or aneuploidy | |
| CN114555829B (zh) | 检测稀有序列变体的测定方法和试剂盒 | |
| CN109576350B (zh) | 一种dna与rna同时定量的试剂盒、方法及质控方法 | |
| JP4190562B2 (ja) | 遺伝子配列検査法 | |
| JP7618208B2 (ja) | 単一標的遺伝子の遺伝的変異のリアルタイム検出用の一本鎖核酸及びこれを用いた検出方法 | |
| EP4516925A1 (de) | Dna-nachweisverfahren und dna-nachweiskit unter besonderer betrachtung der fluoreszenzintensitätsmessung und schmelzkurvenanalyse | |
| EP4541906A1 (de) | Primer, dna-nachweisverfahren und dna-nachweiskit | |
| KR102486630B1 (ko) | 중합효소연쇄반응을 기반으로 한 표적 점 돌연변이의 검출 방법 | |
| US20240368688A1 (en) | Methods and compositions for detection of mutant nucleic acid sequences | |
| US20260043076A1 (en) | Detection of molecular analytes based on tailored probe competition | |
| JP3859687B1 (ja) | Dnaが有する標的塩基を判別する方法 | |
| US12116630B2 (en) | Methods and compositions for assaying repetitive sequences | |
| JP3859684B1 (ja) | Dnaが有する標的塩基を判別する方法 | |
| JP3859688B1 (ja) | Dnaが有する標的塩基を判別する方法 | |
| JP3853840B1 (ja) | Dnaが有する標的塩基を判別する方法 | |
| JP3853838B1 (ja) | Dnaが有する標的塩基を判別する方法 | |
| JP3853837B1 (ja) | Dnaが有する標的塩基を判別する方法 | |
| JP3853839B1 (ja) | Dnaが有する標的塩基を判別する方法 | |
| JP3859685B1 (ja) | Dnaが有する標的塩基を判別する方法 | |
| JP3859692B1 (ja) | Dnaが有する標的塩基を判別する方法 | |
| JP3859686B1 (ja) | Dnaが有する標的塩基を判別する方法 | |
| JP3859689B1 (ja) | Dnaが有する標的塩基を判別する方法 | |
| JP3853836B1 (ja) | Dnaが有する標的塩基を判別する方法 | |
| JP3859689B6 (ja) | Dnaが有する標的塩基を判別する方法 | |
| Class et al. | Patent application title: ASSAYS FOR THE DETECTION OF GENOTYPE, MUTATIONS, AND/OR ANEUPLOIDY |
Legal Events
| Date | Code | Title | Description |
|---|---|---|---|
| PUAI | Public reference made under article 153(3) epc to a published international application that has entered the european phase |
Free format text: ORIGINAL CODE: 0009012 |
|
| STAA | Information on the status of an ep patent application or granted ep patent |
Free format text: STATUS: REQUEST FOR EXAMINATION WAS MADE |
|
| 17P | Request for examination filed |
Effective date: 20240816 |
|
| AK | Designated contracting states |
Kind code of ref document: A1 Designated state(s): AL AT BE BG CH CY CZ DE DK EE ES FI FR GB GR HR HU IE IS IT LI LT LU LV MC ME MK MT NL NO PL PT RO RS SE SI SK SM TR |