EP4520260A1 - Procédé de mesure de la pression sanguine - Google Patents
Procédé de mesure de la pression sanguine Download PDFInfo
- Publication number
- EP4520260A1 EP4520260A1 EP23196265.5A EP23196265A EP4520260A1 EP 4520260 A1 EP4520260 A1 EP 4520260A1 EP 23196265 A EP23196265 A EP 23196265A EP 4520260 A1 EP4520260 A1 EP 4520260A1
- Authority
- EP
- European Patent Office
- Prior art keywords
- blood pressure
- values
- corrected
- respiration
- curve
- Prior art date
- Legal status (The legal status is an assumption and is not a legal conclusion. Google has not performed a legal analysis and makes no representation as to the accuracy of the status listed.)
- Pending
Links
Images


Classifications
-
- A—HUMAN NECESSITIES
- A61—MEDICAL OR VETERINARY SCIENCE; HYGIENE
- A61B—DIAGNOSIS; SURGERY; IDENTIFICATION
- A61B5/00—Measuring for diagnostic purposes; Identification of persons
- A61B5/02—Detecting, measuring or recording for evaluating the cardiovascular system, e.g. pulse, heart rate, blood pressure or blood flow
- A61B5/021—Measuring pressure in heart or blood vessels
- A61B5/022—Measuring pressure in heart or blood vessels by applying pressure to close blood vessels, e.g. against the skin; Ophthalmodynamometers
- A61B5/02233—Occluders specially adapted therefor
-
- A—HUMAN NECESSITIES
- A61—MEDICAL OR VETERINARY SCIENCE; HYGIENE
- A61B—DIAGNOSIS; SURGERY; IDENTIFICATION
- A61B5/00—Measuring for diagnostic purposes; Identification of persons
- A61B5/02—Detecting, measuring or recording for evaluating the cardiovascular system, e.g. pulse, heart rate, blood pressure or blood flow
- A61B5/021—Measuring pressure in heart or blood vessels
- A61B5/022—Measuring pressure in heart or blood vessels by applying pressure to close blood vessels, e.g. against the skin; Ophthalmodynamometers
- A61B5/02208—Measuring pressure in heart or blood vessels by applying pressure to close blood vessels, e.g. against the skin; Ophthalmodynamometers using the Korotkoff method
-
- A—HUMAN NECESSITIES
- A61—MEDICAL OR VETERINARY SCIENCE; HYGIENE
- A61B—DIAGNOSIS; SURGERY; IDENTIFICATION
- A61B5/00—Measuring for diagnostic purposes; Identification of persons
- A61B5/08—Measuring devices for evaluating the respiratory organs
- A61B5/0816—Measuring devices for examining respiratory frequency
-
- A—HUMAN NECESSITIES
- A61—MEDICAL OR VETERINARY SCIENCE; HYGIENE
- A61B—DIAGNOSIS; SURGERY; IDENTIFICATION
- A61B5/00—Measuring for diagnostic purposes; Identification of persons
- A61B5/103—Measuring devices for testing the shape, pattern, colour, size or movement of the body or parts thereof, for diagnostic purposes
- A61B5/11—Measuring movement of the entire body or parts thereof, e.g. head or hand tremor or mobility of a limb
- A61B5/113—Measuring movement of the entire body or parts thereof, e.g. head or hand tremor or mobility of a limb occurring during breathing
-
- A—HUMAN NECESSITIES
- A61—MEDICAL OR VETERINARY SCIENCE; HYGIENE
- A61B—DIAGNOSIS; SURGERY; IDENTIFICATION
- A61B5/00—Measuring for diagnostic purposes; Identification of persons
- A61B5/72—Signal processing specially adapted for physiological signals or for diagnostic purposes
- A61B5/7203—Signal processing specially adapted for physiological signals or for diagnostic purposes for noise prevention, reduction or removal
- A61B5/7207—Signal processing specially adapted for physiological signals or for diagnostic purposes for noise prevention, reduction or removal of noise induced by motion artifacts
- A61B5/721—Signal processing specially adapted for physiological signals or for diagnostic purposes for noise prevention, reduction or removal of noise induced by motion artifacts using a separate sensor to detect motion or using motion information derived from signals other than the physiological signal to be measured
-
- A—HUMAN NECESSITIES
- A61—MEDICAL OR VETERINARY SCIENCE; HYGIENE
- A61B—DIAGNOSIS; SURGERY; IDENTIFICATION
- A61B5/00—Measuring for diagnostic purposes; Identification of persons
- A61B5/24—Detecting, measuring or recording bioelectric or biomagnetic signals of the body or parts thereof
- A61B5/316—Modalities, i.e. specific diagnostic methods
- A61B5/318—Heart-related electrical modalities, e.g. electrocardiography [ECG]
- A61B5/33—Heart-related electrical modalities, e.g. electrocardiography [ECG] specially adapted for cooperation with other devices
Definitions
- the invention relates to methods for determining blood pressure values and a device with a control unit for carrying out the methods.
- Blood pressure and its temporal progression is an important parameter, particularly with regard to a person's medical condition. Based on the progression of blood pressure values and the progression of blood pressure values as a function of time, certain parameters can be calculated or derived. The temporal variation of blood pressure during several cardiac cycles is recorded in order to derive certain parameters, such as the systolic blood pressure value and the diastolic blood pressure value. It is important to record the blood pressure value through a blood pressure measurement as accurately and precisely as possible.
- Blood pressure measurement is a fundamental medical examination method and plays a crucial role in the diagnosis and monitoring of high blood pressure, also known as hypertension. Regular blood pressure monitoring is of great importance for maintaining physical health. High blood pressure can indicate serious health problems such as cardiovascular disease, stroke, and kidney failure. Therefore, it is important to monitor blood pressure regularly and to take appropriate measures when necessary. To take action. Blood pressure measurement can also help detect and treat various diseases, including hypertension, diabetes, kidney disease, and thyroid disease.
- Riva Rocci method is a non-invasive method for measuring blood pressure. It was first developed in 1896 by the Italian physician Scipione Riva Rocci. This method uses an inflatable cuff placed around the upper arm to block blood flow in the artery, and a stethoscope to listen to the sounds produced as the cuff slowly deflates. The readings are then read using a manometer.
- Riva Rocci Over time, other methods for measuring blood pressure have been developed from the Riva Rocci method, such as automated measurement with digital devices. Nevertheless, the basic Riva Rocci method remains an important method in medical practice due to its accessibility and simplicity.
- a measurement using the Riva Rocci method described above usually takes more than 60 seconds and can be uncomfortable for the user, particularly due to the high pressure required at the beginning. Therefore, continuous or long-term blood pressure monitoring using state-of-the-art technology is only possible in exceptional cases and with very coarse temporal resolution (usually one value every 10 minutes). Such a series of individual measurements at intervals of several minutes is used today and is sometimes referred to as "continuous" monitoring. However, this term is misleading, as it does not involve continuous monitoring. takes place and the intervals and thus the temporal resolution are so large that the dynamic changes in blood pressure take place far below this temporal resolution. Therefore, an abnormality cannot be reliably detected; it remains a matter of chance whether an abnormality is detected.
- An abnormality can only be found if the time interval of the measurement was randomly chosen so that a measuring point happens to occur at the same time as an abnormal event. In addition, it is precisely during such events that a large number of state-of-the-art cuff measuring devices measure incorrectly and, moreover, even when a measurement is successful, cannot provide meaningful measured values due to the process.
- continuous is used below for the present invention, this does not necessarily imply the prior art meaning of long interval measurement. Rather, at least the individual measurement intervals are shorter, and in addition, other parameters can sometimes be determined in addition to blood pressure during the same period, for example, in order to obtain meaningful values from the measured values during monitoring. Ideally, blood pressure values can be determined for each heartbeat present within a measurement period, thus providing true continuous monitoring.
- the present invention aims to close this gap, allowing the method for non-invasive and, in particular, continuous blood pressure measurement to be calibrated in a user-friendly and more accurate manner, thus enabling medical diagnoses based on the measured values.
- the method itself also represents added value.
- the method not only determines blood pressure according to today's definition, but also takes into account the dynamic influences on blood pressure caused by respiration, allowing a broader picture of blood pressure.
- blood pressure fluctuation due to respiration can be included as an additional parameter in the definition of the blood pressure value tuple, alongside systole and diastole.
- the blood pressure fluctuations, the body's response to these phenomena, are divided into orders.
- the order represents the effect, and the phenomenon represents the cause.
- the order refers to a frequency of change in blood pressure, and the phenomenon to a frequency of the cause.
- second-order blood pressure fluctuations result from respiration.
- the phase and amplitude of the respiration phenomenon are not necessarily correlated with the phase and amplitude of the second-order blood pressure fluctuation.
- a blood pressure value can be determined that is independent of the blood pressure fluctuations caused by respiration. This allows phase shifts and abnormal amplitude ratios to be determined. What can be detected from values that deviate from the normal is outside the scope of this patent specification and will be described in subsequent publications.
- a blood pressure measurement can be examined with Fourier analysis, for example, to determine the influence of the individual phenomena. This makes it possible to determine the influence of each phenomenon on blood pressure.
- This is well known for breathing; it is known that breathing can change the blood pressure of a resting body by up to 15 mmHg in systole and up to 5 mmHg in diastole.
- this differentiation has its limits today. However, it is only possible today to differentiate between two simultaneously occurring phenomena.
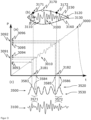
- FIG. 7 A diagram of the pressure curve 7000 of the blood in a person's artery is shown as a function of time, with the person's stress level changing over time. The example shows a recovery phase, which is why the pressure in a globally, it decreases (indicated by line 7300).
- the present invention can be used by a user in such a way that only the two phenomena of heartbeat and respiration cause a change in blood pressure. While other phenomena may influence the measured values, their influence should only be present over a longer period of time, so that the influence can be considered constant over the measurement period.
- the method uses the change in blood pressure due to respiration to detect the change in blood pressure due to heartbeat and then track it at later times to detect changes due to any other phenomena.
- a cuff measurement depicts the peripheral blood pressure in the affected extremity.
- peripheral blood pressure can be impaired by diseases such as arteriosclerosis or impaired airway function.
- central blood pressure rises during physical activity, but at the same time blood pressure in the arm does not rise as much when the arm is not under stress (e.g. when cycling).
- the blood pressure measurement is also a blood pressure measurement for the peripheral pressure. Examples of this are cuff measurements, light wave measurements, acoustic measurements and temperature measurements. If measurement methods also record direct actions of the heart, e.g. when using an ECG, the central blood pressure is also at least partially recorded.
- blood pressure determination based on the pulse wave transit time.
- the pressure in the cuff is increased at a constant rate.
- the air pressure in the cuff is influenced by the pulse in the arteries below the cuff.
- the blood can flow unhindered, which means that the tension in the muscles and tissue is higher than the pressure in the cuff. Therefore the pulse or a change in pressure cannot be detected in the pressure curve.
- the air pressure in the cuff increases, this tension cannot be maintained in the heart rate, initially during diastole.
- the heart rate is subject to artifacts, i.e. deviations, leading to lower measured values of the air pressure with the heart rate.
- the blood flow can no longer be maintained smoothly in the heart rate, even in the phases between diastole and systole.
- the blood flow is disrupted in every phase, including systole.
- the cuff is deformed with the pulse, and the heart rate is therefore reflected in the air pressure.
- the air pressure is now exactly between the diastole and systole values. If the air pressure increases further, the artery is increasingly squeezed until no more blood flow is possible because the artery has collapsed.
- the intensity of the artifacts due to the heart rate initially increases with the air pressure and then decreases again.
- the curve of the intensity of the artifacts due to the heart rate thus shows exactly one arc.
- the blood pressure behavior of a real person does not usually correspond to the idealized curve that the state-of-the-art methods assume and use.
- a non-idealized curve is Figure 2 shown.
- the blood pressure and thus the air pressure curve 2000 in the cuff changes due to respiration and the curve of the intensity 2100 of the artifacts 2010, 2110 due to the heart pulse shows several arcs 2111, 2112, 2113.
- the state-of-the-art methods for example, only one arc e.g. 2112 from this curve is used. This leads to an overestimation of the diastole and/or underestimation of the systole.
- all arcs are averaged and interpreted as one arc, which leads to an underestimation of diastole and an overestimation of systole.
- the problem with the prior art methods is that certain assumptions are made for the measurements and, in particular, additional effects that influence the blood pressure value are ignored or, due to the large intervals between the measurement periods, are arbitrarily averaged due to the nature of the method.
- the problem with the previously known measurement methods is that individual blood pressure values are assigned to certain values or averages of certain values from the individual value measurements. No further information is taken into account in the individual value measurements and therefore only a single value of the uncorrected blood pressure value, which in particular does not take further effects such as respiration into account, is output.
- the present invention provides a solution to the aforementioned problem by providing a better evaluation of single-value measurements, in particular single-value air pressure measurements.
- the single-value measurements are, for example, those that represent a pressure value on the skin above arteries.
- these pressure values are generated with a cuff and quantified using the air pressure within the cuff.
- other possibilities exist and can be implemented with the present invention to generate and quantify such a pressurization.
- One possibility is the use of ceramic-based pressure sensors, utilizing the piezoelectric effect, or polymer-based pressure sensors, by measuring a variable electrical resistance, which are pressed against the skin with a mechanical device. Regardless of how the pressurization is generated and how this is quantified, the values of the individual value measurements of such devices can be used for the method and system according to the invention.
- the method according to the invention makes it possible to determine a respiration-corrected blood pressure value of a person, in particular a person who is breathing.
- a respiration-corrected blood pressure value indicates a blood pressure value depending on a specific breathing state of the person and is thus a respiration-corrected blood pressure value within the meaning of this disclosure.
- Such a breathing state can, for example, represent maximum inhalation or maximum exhalation.
- at least two respiration-corrected blood pressure values be determined, which, if possible, represent two opposing extreme states in the breathing state of a breathing phase of the person.
- the invention relates to a method for determining at least two respiration-corrected first blood pressure values of a person.
- a first blood pressure value can, in particular, be a systolic blood pressure value.
- the first blood pressure value it is also possible for the first blood pressure value to be a diastolic blood pressure value.
- at least two respiration-corrected first blood pressure values namely systolic blood pressure values
- at least two respiration-corrected second blood pressure values namely diastolic blood pressure values
- the plurality of respiration-corrected first blood pressure values is referred to as the first plurality.
- the first blood pressure value of the first plurality can be a systolic blood pressure value or a diastolic blood pressure value. It is also possible to determine both the first plurality of first blood pressure values, namely the systolic blood pressure values, and a further plurality of respiration-corrected second blood pressure values, namely diastolic blood pressure values. For clarity, this further plurality of respiration-corrected second blood pressure values, namely diastolic blood pressure values, is referred to as the second plurality.
- respiration-corrected is to be understood in particular as the determination of at least two blood pressure values, for which blood pressure values are used that can be determined within one and the same phase segment of a respiration. Two values are therefore intentionally used that are within the same respiration phase, which fundamentally distinguishes the present invention from the approaches of the prior art methods, in which such values are not considered and used individually, but rather are disregarded by, for example, an algorithm based on the moving average.
- the problem with this prior art approach is that the information regarding the influence of respiration on blood pressure is lost and - depending on the selection of the algorithm's reference frame - an incorrect absolute value is output.
- the starting point of the method according to the invention is the time-resolved acquisition of individual values of a value that can be assigned to the blood pressure value. For this purpose, several individual value measurements are performed within a measurement period. These can be performed at short intervals using a first device based on a first sensor of the first device. Using further method steps, respiration-corrected blood pressure values, and in particular continuous blood pressure values, can then be determined from these individual value measurements.
- the individual value measurements can generally be performed on some existing devices. Therefore, new devices are not necessarily required; the existing devices simply need to be expanded and configured to perform the inventive methods. Ideally, this can be achieved through a software update.
- the device in particular the first device, can apply pressure within the measuring period.
- pressure is generally applied to a part of the person used as the measuring area, usually to a part of the person's skin.
- the device is generally configured to vary the pressure.
- pressure is generally applied based on a pressure change rate predetermined over the time of the measuring period.
- the pressure applied to the skin can increase within the measuring period according to a predetermined pressure change rate. As the measurement progresses and according to the predetermined pressure change rate, this increase can become greater or smaller, or the pressure can even be reduced again.
- the values of the individual measurements show this varying pressure at least in part.
- a pressure exerted on a part of the person used as a measurement area varies, in particular it increases or decreases, in particular from a minimum pressure value to a maximum pressure value or from a maximum pressure value to a minimum pressure value.
- the individual value measurements are recorded during the variation of the pressure.
- the pressure exerted on the measurement area and its variation are generated by the first device, to which the first sensor is also assigned.
- the values of the individual value measurement are pressure values.
- the pressure values can be air pressure values, whereby a cuff, in particular an air pressure cuff, is preferably used for the individual value measurement.
- the pressure value can be a pressure value determined based on a measurement of an electrical voltage or electrical resistance, in particular caused by the piezoelectric effect.
- the first sensor has a pressure sensor, in particular an air pressure sensor, or a sensor for measuring the electrical voltage or electrical resistance.
- the first device is a pressure cuff, in particular an automated one.
- Time-resolved is understood in particular to mean a measurement in which both the measured value, in this case the value assigned to the blood pressure value, and the time at which the measured value is recorded are recorded.
- At least one non-respiration-corrected first blood pressure value of the person is/are determined from the individual value measurements.
- the first blood pressure value is to be understood, for example, as a systolic blood pressure value or a diastolic blood pressure value.
- respiration-corrected first, namely systolic, blood pressure values and respiration-corrected second, namely diastolic, blood pressure values are determined, then it is provided that, in addition to determining the at least one non-respiration-corrected first, systolic, blood pressure value from the individual value measurements, at least one non-respiration-corrected second, diastolic, blood pressure value of the person is determined.
- This determination of the non-respiration-corrected blood pressure value(s) is carried out in particular according to methods known from the prior art, in particular according to the method according to Riva-Rocci and Korotkoff.
- the time point corresponding to the time of the value of the time-resolved individual value measurements and the time point corresponding to the time of the determined non-respiration-corrected blood pressure value are each determined as a reference time point.
- this time point is therefore determined as a first reference time point.
- the time of the non-respiration-corrected second blood pressure value can therefore be determined as a second reference time.
- At least a first phase segment of a person's respiration is recorded in a time-resolved manner within the measurement period.
- This recording takes place in particular in the form of a recording of a breathing curve of the person, which has phase segments of the respiration, in particular of the individual breathing phases.
- the phase segments, and thus also the first phase segment have a maximum value, in particular a local one, in the breathing curve.
- This can, for example, be a maximum value compared to previous and subsequent values of the breathing curve.
- Such a maximum value can, for example, be a maximum inspiration of the person occurring within the breathing phase.
- the assignment of a maximum value to a maximum inspiration depends significantly on the method used to determine the breathing curve and the phase segments. For the sake of simplicity, this assignment is used, even if the maximum value may not be a maximum value from a mathematical point of view.
- Time-resolved recording also allows the times of these maximum values to be recorded.
- the maximum value of the first phase segment is recorded as the first time point, namely the first time point of the first phase segment. If a second phase segment is recorded in a similar manner, its maximum value is also recorded as the first time point, namely the first time point of the second phase segment.
- the phase segments also exhibit minimum values in the respiratory curve.
- This can, for example, be a minimum value compared to previous and subsequent values in the respiratory curve.
- Such a minimum value can, for example, be the subject's maximum exhalation within the respiratory phase.
- the assignment of a the relationship between a minimum value and a maximum exhalation depends significantly on the method used to determine the respiratory curve and the phase segments. For the sake of simplicity, this assignment is used, even though, from a mathematical perspective, the minimum value may not be a minimum value. What is particularly relevant is that the maximum value represents the opposite of the minimum value.
- Time-resolved recording also allows the times of these minimum values to be recorded.
- the minimum value of the first phase segment is recorded as the second time point, namely the second time point of the first phase segment. If a second phase segment is recorded in a similar manner, its minimum value is also recorded as the second time point, namely the second time point of the second phase segment.
- the first phase segment is selected from the recorded phase segments such that the first reference time falls within the period comprising the first phase segment.
- the period of the first phase segment can be defined in particular by the first and second times of the first phase segment.
- the end or the beginning of the period of the first phase segment does not necessarily have to coincide, in particular exactly, with the first or second time of the first phase segment. Such proximity, in particular agreement, depends in particular on the method chosen to record and determine the phase segments or the maximum and minimum values.
- a second reference time has also been recorded or determined, it is intended that a second phase segment is recorded in a similar manner to the first phase segment and its times are determined, with the second phase segment being selected from the phase segments such that the second reference time falls within the period encompassing the second phase segment.
- the period of the second phase segment reference is made to the above with regard to the period of the first phase segment.
- the same time resolution in particular with the same time intervals and the same times, is used for the recording of the individual values and for the recording of a respiration, in particular a respiration curve, in particular the respiration curve described below.
- each phase segment contains exactly one maximum value, in particular exactly one maximum inhalation, and exactly one minimum value, in particular exactly one maximum exhalation.
- the first point in time, for example, of the first phase segment does not necessarily have to be before the second point in time of the first phase segment. Rather, the numbering of the points in time is based on the values in the respiratory curve, i.e. the first point in time has a maximum value and the second point in time has a minimum value.
- the phase segment can first have a maximum value and then a minimum value.
- the phase segment can also first have a minimum value and then a maximum value.
- a respiratory phase usually has either two maximum values and one minimum value (a respiratory phase is defined as first having an inhalation, then moving on to the next inhalation via an exhalation) or two minimum values and one maximum value (a respiratory phase is defined as first having an exhalation, then moving on to the next exhalation via an inhalation). It is also conceivable that the first phase segment has a maximum value first and the second phase segment has a minimum value first, or vice versa. According to the invention, it is only relevant that the respective reference time lies or falls within the respective time periods of the phase sections defined by the respective first and second times of the respective phase sections.
- the period of the first phase section is based on the times of the first time point, in particular the maximum inspiration, and the second time point, in particular the maximum exhalation.
- the beginning of the first phase segment is determined based on one of the times consisting of the first time point and the second time point, and the end of the first phase segment is determined based on the other time point, i.e., the second time point or the first time point.
- the first point in time of a phase segment also corresponds to one of the start and end of the phase segment
- the second point in time of the phase segment corresponds to the other of the start and end of the phase segment.
- a correspondence is not necessarily given. Rather, a divergence can often be detected between the actual start of the phase segment and, for example, the first point in time or the second point in time. The reason for this lies in the measurement method used to record breathing and thus the breathing curve from which the phase segments are determined.
- the effects of an effect that actually underlies the maximum value, namely maximum inspiration are only present or measurable with a time offset.
- phase segment it may be necessary to determine both the start and the end of the phase segment based on both the first point in time and the second point in time, or on the basis of a first or second point in time of a previous or subsequent phase segment, in order to determine the period of the phase segment in which the reference point in time should lie.
- a predetermined weighting it may be necessary to apply a predetermined weighting to the values used, namely the first and second time points of the phase segments involved. This weighting depends, for example, on the method used.
- a time center can be determined for the predetermined weighting.
- the respiratory curve can be determined from an ECG curve or using an acceleration sensor. If the ECG is used, the times of the maximum inhalations and the maximum exhalations can be determined using the RR intervals, for example.
- the RR intervals are sinusoidal and therefore do not indicate different respiratory lengths and, in particular, do not indicate the fact that an inhalation phase can be longer or shorter (usually shorter) than an exhalation phase.
- the problem with a measurement using an acceleration sensor is that, for example, a short pause in breathing occurs after the exhalation phase.
- an acceleration sensor can only detect changes and can therefore only record the maximum time with an offset.
- the weighted time center This can be determined either by estimation or by experimental methods by performing a calibration. For this purpose, the actual recording of the respiratory curve is compared with an absolute measurement method of the respiratory curve, and a corresponding calibration is established.
- a first phase segment is determined from the recorded maximum inhalations and maximum exhalations, which also includes the first reference time.
- a second phase segment is determined from the recorded maximum inhalations and maximum exhalations, which also includes the second reference time.
- At least two first blood pressure values are determined, which in particular each represent blood pressure values within a phase segment of respiration at maximum exhalation and at maximum inhalation.
- the blood pressure value assigned to the first time point of the first phase segment in the individual value measurements or a blood pressure value determined on the basis of the blood pressure value assigned to the first time point of the first phase segment is determined as the first of the at least two respiration-corrected first blood pressure values.
- the first of the at least two respiration-corrected first blood pressure values is a respiration-corrected first blood pressure value at maximum inspiration.
- the respiration-corrected first blood pressure value at maximum inspiration is a respiration-corrected first systolic blood pressure value at maximum inspiration.
- the blood pressure value assigned to the second time point of the first phase segment in the individual value measurements or a blood pressure value determined on the basis of the second time point of the first phase segment is determined as the second of the at least two respiration-corrected first blood pressure values.
- the second of the at least two respiration-corrected first blood pressure values is a respiration-corrected first blood pressure value at maximum exhalation.
- the respiration-corrected first blood pressure value at maximum exhalation is a respiration-corrected first systolic blood pressure value at maximum exhalation.
- respiration and thus the phase segments using a different method, in particular on the basis of time-resolved values of individual value measurements taken by a second sensor, in particular a second device, within the measurement period.
- this can be done using an ECG measurement.
- the individual values used to determine the blood pressure value are measured with a first device, and the phase segments are measured with a second device, namely an ECG.
- Determining respiration and phase segments using an ECG is well known in the art. Respiration is determined from changes in the cardiac interval. The cardiac interval is determined for each heartbeat. The basis for this is data depicting the heart rate. These are typically recorded using an ECG or PPG. However, a variety of other sensors also allow for usable imaging of the heart rate, e.g., temperature measurements, polymer pressure sensors, or even ultrasound sensors. This data is analyzed for a distinctive feature within the image of the heart rate, so that such a feature is found for each heart pulse. The time interval between two consecutive times at which such a feature is found is the cardiac interval. If ECG data is used as the data basis, the distinctive feature is typically the R-wave, and the cardiac interval is called the RR interval.
- the duration of the cardiac intervals is plotted on a graph at the times of the corresponding cardiac pulse, local minima and maxima can be identified.
- the times of the local minima indicate the times of maximum inspiration, while the times of the local maxima indicate the times of maximum expiration.
- the blood pressure value assigned to the first time point of the second phase section in the individual value measurements or a blood pressure value determined on the basis of the blood pressure value assigned to the first time point of the second phase section as the first of the at least two respiration-corrected second Blood pressure values are determined.
- the first of the at least two respiration-corrected second blood pressure values is a respiration-corrected second blood pressure value at maximum inspiration.
- the respiration-corrected second blood pressure value at maximum inspiration is a respiration-corrected second, diastolic blood pressure value at maximum inspiration, and is the blood pressure value assigned to the second time point of the second phase segment in the individual value measurements or a blood pressure value determined on the basis of the second time point of the second phase segment is determined as the second of the at least two respiration-corrected second blood pressure values.
- the second of the at least two respiration-corrected second blood pressure values is a respiration-corrected second blood pressure value at maximum exhalation.
- the respiration-corrected second blood pressure value at maximum exhalation is a respiration-corrected second, diastolic blood pressure value at maximum exhalation.
- the blood pressure value determined based on the respective time point of the respective phase segment is determined based on a pressure correction.
- the pressure correction the values of the individual measurement values that have changed due to the varying pressure are corrected by the pressure factor, for example, using a linear regression based on the predetermined pressure change rate or a bandpass filter.
- the method according to the invention therefore makes it possible, in particular, to determine and output a blood pressure value as a function of respiration.
- a value during maximum exhalation or maximum inhalation is generally particularly meaningful, since these two states produce the maximum effects, leading to higher or lower blood pressure values, respectively.
- at least the first and second respiration-corrected first blood pressure values are output.
- the first and second respiration-corrected first blood pressure values could represent the basis for a, in particular factored, mean value.
- the methods according to the invention when used alone, are primarily intended to improve the quality of a measurement compared to the methods based on Riva Rocci used today and to provide new measured values that the previously known measuring methods cannot provide.
- the methods according to the invention can therefore either be carried out with a device that is optimized for the method or can be integrated into existing systems.
- Existing systems must meet requirements regarding pump performance and valve control and have a suitable calculation unit.
- Conventional upper arm and forearm cuff systems according to the state of the art are generally not suitable for carrying out the method due to limited hardware, but can usually be enabled with comparatively little effort through the use of modern pumps and calculation units.
- Today's smartwatches that have cuff measurement are generally already capable of the method.
- a true change in blood pressure is defined as a change in blood pressure due to a change in the blood pressure within the cardiovascular system.
- the other points (2 to 4), on the other hand, are changes due to influences that should not result in a change in blood pressure originating from the heart, but which, according to the current state of technology, lead to a change in the detectable result, for example, because an averaging process takes place that includes different situations according to reasons 2 to 4 (e.g., different respiratory cycles or an irregular heartbeat involved in the averaging).
- each heartbeat in the measurement period which corresponds to the period of the individual value measurement of conventional cuff measurement methods and also includes the pressure change phase, is included and the influence of breathing is recorded.
- the special feature of the invention is, among other things, that in addition to the values that are assigned to the blood pressure values, further information is included that can have an effect on the values that can be assigned to the blood pressure value in the same measurement period, namely, for example, respiration.
- Arrhythmias are not necessarily considered a disease; our own studies have shown that arrhythmias occur more frequently in athletic young people. Other studies indicate that up to 11% of the population have arrhythmias.
- the classification of an arrhythmia depends on the frequency and whether a pattern and regularity can be identified. Depending on the classification of an arrhythmia, the procedure can now formulate the blood pressure of the individual heartbeats into a meaningful result and/or issue a corresponding warning about the arrhythmia.
- the method presented here can capture additional measurements in addition to the actual blood pressure values.
- This data includes values related to respiration, heart rate, blood pressure curves, and diseases. The exact breakdown of the measured values will be explained in more detail in a subsequent section.
- the invention presented here can also be used in conjunction with other measuring devices. These include, on the one hand, devices for detecting the heart rate, such as an ECG or a device based on light waves, and, on the other hand, devices that enable continuous blood pressure measurement. Devices for detecting the heart rate can be used to perform other medical diagnostics. Outside of extreme situations, such as atrial fibrillation, it is assumed in medical practice that each QRS complex in the ECG is followed by a cardiac activity. However, studies by the inventors have shown that this is not the case. In arrhythmias, for example, shortened RR intervals can occur. In some subjects, it can be seen that the second QRS complex of such a shortened RR interval does not lead to a detectable pulse, or only to a small extent; however, in other subjects with initially apparently similar symptoms, a pulse can be measured.
- the method presented here will primarily be used in conjunction with other devices for continuous blood pressure measurement. These devices are based on the recording of other vital signs and their conversion into a blood pressure value with the help of a calibration. Even today, systems that can measure blood pressure continuously already exist. However, these systems are very inaccurate and/or require complicated interaction with the user for calibration. For example, the determination of continuous blood pressure values from the pulse wave transit time has been known for many years. For calibration, two blood pressure measurements are necessary, one at normal blood pressure and one at elevated blood pressure, which must be recorded separately in time due to the changing blood pressure of the person being measured. In some current systems, the elevated Blood pressure is generated, for example, by physical activity.
- the method according to the invention preferably determines the blood pressure for each heartbeat within the measuring phase, which corresponds to the period of individual value measurements using conventional cuff measuring methods and also includes the pressure change phase. In the following, this period is also referred to as the measuring period.
- the inventors have recognized that such a measuring phase comprises one or more breaths. The inventors have therefore recognized that a change in blood pressure is caused by breathing alone and that the prerequisite for calibration with a high and a low blood pressure value could therefore already be met by a measurement under normal stress.
- the method according to the invention determines, for example, the highest and lowest blood pressure values within the breathing cycle, together with the times of the heartbeats from which these values are derived. This represents the first part of the invention.
- the other part is provided by the device for continuous blood pressure measurement.
- this is the pulse wave transit time at the same times.
- the result of the calibration in this case is an inverse linear relationship between pulse transit time and blood pressure, so that for each additional value of the pulse transit time a value of the blood pressure can be determined.
- Continuous blood pressure monitoring systems such as Dräger's CNAP, can currently only perform trend measurements. Using this method, these systems could also determine absolute values. The method thus represents added value in the clinical setting.
- more than one device operating with the method can be used on different extremities.
- other parameters such as arterial stiffness, blood vessel elasticity, heart rate variability, and other important cardiovascular parameters can be measured.
- Additional parameters, such as pulse wave transit time or the location of a vascular disease can be recorded if more than one device is attached to an extremity or the position of a device is varied. Similar products in this regard, which can be surpassed by their ease of use and the recording of other parameters (e.g., related to respiration), include CardioScreen from medis or PhysioFlow from Manatec Biomedica.
- the method according to the invention is intended to detect the influence of breathing so that the influence of breathing can be displayed when the measured values are output.
- the prior art allows a cuff to be used to determine a tuple of measured values consisting of one value each for systole, diastole and pulse for a measurement.
- other measured variables such as pulse pressure and RR interval can be derived, although these can also only be determined once per measurement.
- a measurement with a state-of-the-art cuff takes 30-90 seconds depending on the design and the existing blood pressure, cf. Fig.
- the invention By detecting or using respiration, the invention also makes it possible to make the measurement of blood pressure more accurate and to provide more information about the cardiovascular system.
- the values that can be assigned to the blood pressure values and the respirations can be based on two different output data sets that were recorded and/or determined by different sensors or devices, e.g., a first and a second device.
- the measurement of individual values of the values assigned to the blood pressure value can be performed using a cuff, a first device, whereby these individual values are part of a first output data set, and the measurement of the respiratory cycle can be performed using another device, a second device. carried out, whereby the values of the respiratory cycle are part of a second output data set.
- both the values assigned to the blood pressure value and the values for the respiratory cycle are collected using the same device, the first device, thus requiring only one output data set.
- the data sets cover the same measurement period and, if possible, the same time resolution, preferably with the same points in time.
- the value associated with the blood pressure can be recorded using any suitable device.
- respiration and respiratory cycles can be recorded or determined using any suitable device.
- at least the value associated with the blood pressure is recorded using a cuff.
- the first sensor comprises a pressure sensor, in particular an air pressure sensor, or a sensor for measuring electrical voltage or electrical resistance.
- the first device is a pressure cuff, in particular an automated one.
- the value of the individual measurements is a pressure value, in particular an air pressure value, or a pressure value determined based on a measurement of an electrical voltage or electrical resistance, in particular one caused by the piezoelectric effect.
- the phase segments are determined by means of a second sensor, in particular a second device, wherein the second sensor is part of an ECG or an impedance sensor, a lightwave-based sensor, in particular as part of a PPG or SpO2 measuring device, a microphone, an acceleration sensor, an ultrasonic sensor, or a temperature sensor.
- a second sensor in particular a second device, wherein the second sensor is part of an ECG or an impedance sensor, a lightwave-based sensor, in particular as part of a PPG or SpO2 measuring device, a microphone, an acceleration sensor, an ultrasonic sensor, or a temperature sensor.
- two data sets are recorded with different devices.
- the first sensor advantageously comprises a pressure sensor, in particular an air pressure sensor, or a sensor for measuring electrical voltage or electrical resistance.
- the first device is a pressure cuff, in particular an automated one, and advantageously the phase segments, in particular the first phase segment, in particular the first and second times of the phase segments, in particular the first and second times of the first phase segment, in particular the respiration and/or the respiration curve are then determined from the values of the individual value measurements recorded with the first sensor. In this case, in particular, a data set is recorded with the same sensor.
- the following table shows possible combinations of sensors or combinations of data sets and their origins in order to record, on the one hand, the individual values that can be assigned to the blood pressure value and, on the other hand, the respiration or the respiratory cycles.
- the preferred method of measuring individual values that can be assigned to the blood pressure value namely cuff measurement, is used: Variants Determination of pressure values using: Determination of respiration using: 1. cuff ECG 2nd cuff Light wave based sensor 3. cuff cuff 4. cuff acceleration sensor 5. cuff microphone 6. cuff Ultrasonic 7. cuff temperature 8. cuff Impedance measurement
- the pressure values are derived from a cuff measurement.
- the cuff can be used at different positions on the body, e.g., on the wrist or upper arm.
- the pressure in the cuff is measured and simultaneously changed.
- the output values for determining respiration are based on the analysis of the changes in the respective signals.
- the sensors can be combined with the cuff in a device, e.g., in the form of a wristband, or, connected to appropriate data interfaces, can be attached to other locations on the body relative to the cuff.
- the exact logic and procedural steps for determining respiration from the individual output signals, as well as for determining the pressure values and comparing the pressure values with respiration, are described in a later section.
- the method according to the invention is particularly comparable to previously known measurements and methods using an automated cuff.
- the invention can be used when the pressure in the cuff is increasing or decreasing. Use when the pressure is increasing is preferable, as this allows for a shorter measurement time and thus less stress for the user.
- the pressure change is carried out, in particular linearly, typically with a pressure change between 1 and 20 mmHg/s, in particular between 1 and 10 mmHg/s, in particular of approximately 5 mmHg/s. If higher quality measurement results are required, a lower pressure change rate of, for example, 1 mmHg/s is necessary.
- a lower rate can also be used so that values for diastole and systole can be recorded continuously over a longer period of time. This involves an assessment of the relationship between the user's stress and the quality of the measured values.
- the pressure change rate should be dynamically adjusted during the measurement.
- a high pressure change rate can be selected from the unstressed state (e.g. 10 mmHg/s) to find the contact between the cuff and the skin.
- a lower rate e.g. 7 mmHg/s
- this can already be below the diastole pressure.
- the actual measurement phase then follows; here the pressure is changed depending on the measurement objective.
- this phase includes the measurement period.
- a pressure change e.g. 5 mmHg/s can be selected.
- the other end of the requirements for the Pressure change is the representation of the pressure curve within the heart pulse; for this purpose, a pressure change rate of 1 mmHg/s is preferable.
- the measurement is finished when no variations due to the heart pulse or only slight variations in the pressure curve can be seen.
- the pressure is first increased to a high pressure, typically with the maximum power of the pump but no more than 15 mmHg/s, e.g.
- the pressure can be changed at a predetermined pressure change rate.
- this can be achieved using a variable valve, multiple valves for different rates, or one (or more) valves when the pump is used at a lower power.
- a fixed, non-variable valve is used today, which can reduce the pressure almost evenly over the typical measuring range (40-200 mmHg).
- the pressure is initially released quickly (e.g. at -7 mmHg/s) after inflation in order to find the pressure at which changes in the pressure curve due to the heart rate can already be detected. With a suitable sensor selection, this can already be above systole.
- the pressure reduction rate is reduced to a lower value (in absolute terms), depending on the measurement requirements, see above for pressure increase. If no or only slight pulsation is detected (the pressure is now below diastole) the pressure can be released at the maximum rate.
- the baseline values for determining respiration are measured, i.e., within the same measurement period. If other methods for determining respiration are used, these can either be integrated into the cuff itself, so that optimal positioning is achieved when the cuff is applied. With external devices, these are applied according to the respective device specifications. What both device types have in common is that the individual sensors can also be dynamically and automatically regulated.
- ECG ECG
- impedance impedance
- the brightness can be regulated by regulating the electrical current for light generation. If the light wave measurement is integrated into the cuff, the signal becomes weaker with increasing pressure and cannot detect a heart pulse if blood flow has stopped. It is therefore advisable to increase the brightness at higher pressures in order to obtain a good output signal. The brightness should not be changed too sharply or inconsistently. If the detection of respiration is based solely on the change in the RR interval, a larger change is possible (e.g., 0.5 mA/s for typical green LEDs).
- the change in light intensity must not be as great (e.g., 0.1 mA/s).
- the cuff (variant 3) does not allow any further adjustment, as it is already being used for pressure measurement.
- the acceleration sensor (variant 4) does not require any further adjustment.
- the microphone (variant 5) can be adjusted by adjusting the sensitivity. If the microphone If used below the cuff, the regulation is analogous to that for light waves.
- Ultrasound (variant 6) can be regulated in terms of output power and reception sensitivity. Here, too, the regulation is analogous to that for light waves.
- a measured value curve filtered with a low-pass filter can also be used. The filtering is selected so that respiration is determined from local minima and maxima of the measured value curve.
- a pressure-corrected intensity curve is determined from the individual measurement values using a regression line or a bandpass filter to correct for the varying pressure.
- This method is also partly known from the prior art and is used in this way.
- changes in the values of the individual measurements are determined. These changes in the values are changes occurring over time within the measurement period. These changes are determined, for example, from a mathematical derivative of the values of the individual measurements, a derivative over time, i.e., as a function of time. Alternatively, but at least less preferred at present due to inaccuracies, the changes can also be determined using a filter, particularly a bandpass filter, or by subtracting a best-fit line.
- phase sections in particular the first phase section, and the first and second time points of the phase sections can be determined.
- the beginning and end of the phase section and/or the period of the respective phase section are determined.
- a first and a second compensation curve are determined from the local extrema to determine the phase segments.
- the first compensation curve is formed as a compensation curve based on the points of the local maxima, in particular all of the local maxima adjacent over time.
- the second compensation curve is formed as a compensation curve based on the points of the local minima, in particular all of the local minima adjacent over time.
- the first compensation curve and the second compensation curve form an envelope around the local extrema, i.e. the local minima and local maxima.
- several local maximum distances for example all those recorded during the measurement period, and several local minimum distances, for example all those recorded during the measurement period, are determined between the first compensation curve and the second compensation curve.
- a distance is formed at at least one point in time, in particular at each point in time, within the measurement period by the difference value of an envelope of the local maxima and the value of the envelope of the local minima.
- the phase segments are determined by the time of two successive local minimum or maximum distances.
- the local maximum distance within the first phase segment is determined as the maximum inhalation of the first phase segment.
- the time of this local maximum distance is advantageously determined as the first time.
- the local minimum distance within the first phase segment is determined by the maximum exhalation of the first phase segment. The time of this local minimum distance is advantageously determined as the second time point.
- a time interval between the two local extrema that are adjacent in time is determined from the time interval between two local extrema that are adjacent in time, wherein each phase section, in particular its start and end, is determined by two successive local largest time intervals of the time intervals in time, and the local largest time interval within the respective phase section and the time of the local largest time interval within the phase section are determined as the first time point as the maximum inhalation of the respective phase section, and a local smallest time interval of the time intervals within the respective phase section and the time of the local smallest time interval within the phase section are determined as the second time point as the maximum exhalation of the respective phase section.
- a first plurality of the at least two respiration-corrected first blood pressure values of the person are determined as continuous first blood pressure values.
- a third plurality of phase segments can preferably also be determined.
- Each blood pressure value of the first plurality can then preferably be assigned to a cardiac cycle of the person.
- each phase segment of the third plurality of phase segments can comprise at least two of the at least two respiration-corrected first blood pressure values of the first plurality.
- changes, in particular gradients, of the values of the individual measurements are determined. These changes are derived from the values of the individual measurements, in particular those exhibiting the varying pressure loading, and are changes in the values of the individual measurements that are dependent on the varying They are independent of the pressure applied, i.e., they do not include the linear increase in the pressure applied.
- Such change values can be determined, in particular, by means of a mathematical derivative of the values of the individual measurement values over time.
- An intensity curve can be determined from these change values. This intensity curve can be identical to the change curve mentioned above.
- This intensity curve then has a plurality of local extrema.
- the intensity curve has a plurality of, in particular at least two, in particular at least three, in particular at least six, local minima and a plurality of, in particular at least two, in particular at least three, in particular at least six, local maxima.
- a local minimum and a local maximum are to be understood in particular as a mathematical local minimum or maximum.
- a local maximum has an individual value of the changes which is the largest individual value of the changes compared to immediately preceding and subsequent individual values.
- a local minimum has an individual value of the changes which is the smallest individual value of the changes compared to immediately preceding and subsequent individual values.
- the intensity curve differs from the pressurization-corrected intensity curve in that the intensity curve considers the changes in the slope of a curve from the values of the individual value measurements, i.e. in the simplest case the mathematical derivation of the curve is considered, and the pressurization-corrected intensity curve considers the absolute values minus the pressurization.
- changes, in particular gradients, of the individual measurement values that are independent of the varying pressure are determined from the values of the individual measurement values exhibiting the varying pressure.
- This determination can be carried out, for example, by means of a, in particular digital, bandpass filter, or on the basis of a regression line or a derivative of the course of the individual value measurements as a function of time, in particular a first mathematical derivative. From the changes determined in this way, a course of the individual values of the changes is formed according to the invention and determined as a pressure-corrected intensity curve.
- This pressure-corrected intensity curve then has a plurality of local extrema.
- the intensity curve has a plurality of, in particular at least two, in particular at least three, in particular at least six, local minima and a plurality of, in particular at least two, in particular at least three, in particular at least six, local maxima.
- a local minimum and a local maximum are to be understood in particular as a mathematical local minimum or maximum.
- a local maximum has an individual value of the changes that is the largest individual value of the changes compared to immediately preceding and subsequent individual values.
- a local minimum has an individual value of the changes that is the smallest individual value of the changes compared to immediately preceding and subsequent individual values.
- a first device in particular a cuff
- a narrow pressurisation surface in particular a cuff width, in particular a cuff width of less than ten centimetres, in particular less than six centimetres, in particular less than five centimetres, in particular a maximum of four centimetres, in particular three centimetres, and/or of at least 0.1 mm, in particular at least 1 mm, in particular at least 1 cm
- a device width-corrected, in particular cuff width-corrected, intensity curve comprising the plurality of local extrema is determined.
- the local extrema are generally local maxima and local minima, wherein the extrema are then used to form the approximate straight lines.
- the device width corrected intensity curve represents a cuff width corrected intensity curve.
- the determination of the device width-corrected intensity curve is based on the values of the individual value measurements; these represent the starting point. Therefore, on the one hand, the intensity curve based on the values of the individual value measurements can be used to determine the device width-corrected intensity curve, which in particular shows changes independent of the varying pressure application. However, other values based on the values of the individual value measurements can also be used.
- an intensity curve is first determined by this intensity curve representing the first mathematical derivative of the values of the individual value measurements represented as an extrapolated curve.
- the intensity curve is determined using the first mathematical derivative of the values of the individual value measurements as a function of time.
- the intensity curve determined in this way has several local extrema, namely local maxima and local minima.
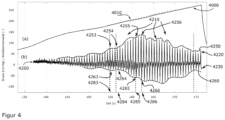
- a first, second and third lower approximation line and a first, second and third upper approximation line are formed to determine the device width-corrected, in particular cuff width-corrected, intensity curve.
- the first upper approximation line is formed to the local maxima of the intensity curve present in a first time period.
- the second upper approximation line is formed to the local maxima of the intensity curve present in a second time period.
- the third upper approximation line is formed to the local maxima of the intensity curve present in a third time period.
- the first lower approximation line is formed to the local minima of the intensity curve present in a fourth time period.
- the second lower approximation line is formed to the local minima of the intensity curve present in a fifth time period.
- the third lower approximation line is formed to the local minima of the intensity curve present in a sixth time period.
- the lower approximation lines are thus assigned to the local minima of the intensity curve present in different time periods, and the upper approximation lines are assigned to the local maxima of the intensity curve present in different time periods.
- the beginning and end of the first, second, third, fourth, fifth, and sixth time periods lie within the measurement period.
- the beginning of the first period of time is before the beginning and end of the second period of time and the third period of time, and furthermore the beginning of the fourth period of time is before the beginning and end of the fifth period of time and the sixth period of time.
- the end of the third period is after the beginning and end of the first period and second period, and furthermore, the end of the sixth period is after the beginning and end of the fourth and fifth period.
- the beginning of the first time period coincides with the beginning of the fourth time period.
- the end of the third time period coincides with the end of the sixth time period.
- the beginning of the second time period preferably corresponds to the end of the first time period and the end of the second time period corresponds to the beginning of the third time period and the beginning of the fifth time period corresponds to the end of the fourth time period and the end of the fifth time period corresponds to the beginning of the sixth time period.
- the end of the first time period and the beginning of the third time period are selected such that the second upper approximation line has the minimum deviation from the local maxima present within the second time period
- the end of the fourth time period and the beginning of the sixth time period are selected such that the second lower approximation line has the minimum deviation from the local minima present within the fifth time period.
- the second upper approximation line is formed to the local maxima of the local extrema of the device width-corrected intensity curve present in the third and/or second time period.
- the first upper approximation line is formed to the local maxima of the local extrema of the device width-corrected intensity curve present in the first time period.
- the second lower approximation line is formed for the local minima of the local extrema of the device width-corrected intensity curve present in the sixth and/or fifth time period.
- the first lower approximation line is formed to the local minima of the local extrema of the device width-corrected intensity curve present in the fourth time period.
- the normalization parameter is based on the difference between the lower and upper approach lines at the beginning of the second time period and the difference between the lower and upper approach lines at the beginning of the fifth time period.
- the intensity curve, in particular one corrected for device width has at least six local maxima, each with a single value of the intensity curve, in particular one corrected for device width, which is the largest in comparison to immediately preceding and subsequent individual values, and at least six local minima, each with a single value of the intensity curve corrected for device width, which is the largest in comparison to immediately preceding and subsequent individual values.
- the subsequent process step can be carried out using the values of the intensity curve; otherwise, the values of the device width corrected intensity curve, and not the non-device width corrected intensity curve, should be used in the subsequent process step.
- At least one, preferably at least two, upper approximation lines and at least one, preferably at least two, lower approximation lines are formed.
- the at least one upper approximation line is formed as an approximation line to the maxima of the local extrema of the intensity curve, in particular device width-corrected, present in the measurement period.
- the formation of the at least one upper approximation line is based on a regression line, in particular a linear one.
- the at least one lower approximation line is formed as an approximation line to the minima of the local extrema of the intensity curve, in particular device width-corrected, present in the measurement period.
- the formation of the at least one lower approximation line is based on a regression line, in particular a linear one.
- a regression line in particular a linear one.
- at least two upper and at least two lower approximation lines are formed.
- the first upper approximation line includes local maxima that occur at an earlier time and/or at lower pressures in the values of the individual measurements assigned to the blood pressure values and/or at lower pressure loading than the local maxima on which the second upper approximation line is based.
- the first lower approximation line local minima that occur at an earlier time and/or at lower pressures in the values of the individual measurements assigned to the blood pressure values and/or at lower pressure loading than the local minima on which the second lower approximation line is based.
- the individual values of the intensity curve, in particular the device-width-corrected one are standardized and scaled according to the invention.
- the standardization is based, in particular, on a difference between the upper approximation line and the lower approximation line present at the respective times of the individual values.
- the standardization is based on a function of time, which is formed from the difference between the upper approximation line and the lower approximation line as a function of time.
- the scaling is based in particular on a scaling constant, wherein the scaling constant is based in particular on the difference between the standardized value of the intensity curve, in particular device width-corrected, present at the first and second time points of the first phase segment and the first and second of the at least two respiration-corrected first blood pressure values.
- the standardized individual values are scaled such that the standardized individual value present at the first time point, scaled in this way, corresponds to the systolic blood pressure value previously determined during the individual value determination at the first time point.
- Scaling makes it possible to determine pressure values from the standardized individual values, which correspond to a trend measurement, which pressure values can in particular be assigned to the person's blood pressure value.
- the scaling constant can be based not only on the difference just mentioned, but also on an average value formed from at least two respiration-corrected first blood pressure values and the at least two respiration-corrected second blood pressure values, where the respiration-corrected first blood pressure value corresponds to a systolic blood pressure value and the respiration-corrected second blood pressure value corresponds to a diastolic blood pressure value.
- the scaling constant thus includes, for example, the difference between the standardized values, the difference between the respiration-corrected first blood pressure values and the mean of the respiration-corrected first and second blood pressure values, in particular in the form: (1 / (first respiration-corrected first blood pressure value minus second respiration-corrected first blood pressure value)) * (standardized individual value at the first time point minus standardized individual value at the second time point) * 0.25 * (first respiration-corrected first blood pressure value + second respiration-corrected first blood pressure value + first respiration-corrected second blood pressure value + second respiration-corrected second blood pressure value).
- a uniform averaging 0.25)
- a different weighting can also be used.
- a blood pressure curve can be determined and is determined according to the invention, in which local maxima and local minima are present.
- the first plurality of respiration-corrected first blood pressure values are determined from the individual values assigned or assignable to the local maxima or minima of the blood pressure curve.
- At least two respiration-corrected second blood pressure values are also determined. It is also possible to determine additional respiration-corrected blood pressure values.
- blood pressure values it has become common practice among experts to specify the characteristic values of the systolic and diastolic blood pressure values for the blood pressure value. Therefore, it is usually sufficient to determine two types of respiration-corrected blood pressure values: respiration-corrected first blood pressure values and respiration-corrected second blood pressure values, with the first blood pressure values being systolic blood pressure values and the second blood pressure values being diastolic blood pressure values.
- the method according to the invention proceeds with regard to the second blood pressure values, the diastolic blood pressure values, in an analogous manner to the first blood pressure values, the systolic blood pressure values.
- a non-respiration-corrected second blood pressure value of the person is determined from the individual value measurements, whereby the time of the non-respiration-corrected second blood pressure value within the measurement period is determined as a second reference time point.
- a second phase segment of the respiration having a minimum value, in particular a maximum inhalation, in the respiration curve at a first time point of the second phase segment and a maximum value, in particular a maximum exhalation, in the respiration curve at a second time point of the second phase segment is recorded in a time-resolved manner within the measurement period, wherein the second phase segment is selected such that the second reference time point falls within the period comprising the second phase segment.
- the blood pressure value assigned to the first time point of the second phase section in the individual value measurements or a blood pressure value determined at the first time point of the second phase section is determined as the first of the at least two respiration-corrected second blood pressure values, in particular the maximum inspiration
- the blood pressure value assigned to the second time point of the second phase section in the individual value measurements or a blood pressure value determined at the second time point of the second phase section is determined as the second of the at least two respiration-corrected second blood pressure values, in particular the maximum expiration.
- a further, third mechanism of action is the collapse of the arteries, whereby blood flow is restricted as the pressure continues to rise and, at even higher pressures, completely collapses above a certain pressure.
- the size of the cuff influences the extent to which the aforementioned causes occur and/or appear.
- a wide cuff as in the state of the art (approximately 1/3 of the length between the shoulder joint and the elbow joint), suppresses cause 2.
- Blood flow is affected even at lower pressures, so that cause 1 already comes into play at lower pressures; in such a case, the blood pressure determined is too low.
- a cuff that is too narrow i.e. narrower than the cuff mentioned above, which has a width of approximately 1/3 of the length between the shoulder joint and the elbow joint), however, allows cause 2 to become more apparent; with such a narrow cuff, pulsation can still be detected at higher pressures, but due to the not irrelevant emergence of cause 2, an elevated blood pressure value is determined, provided that the blood pressure determination is carried out according to the procedures for determining blood pressure in accordance with the state-of-the-art methods.
- a narrow cuff e.g. with a width of approximately 2-5 cm, in particular 3-4 cm, is particularly advantageous, even if normal, wide cuffs are also suitable for the method according to the invention, but with such wide cuffs the device width correction does not have to be carried out, or such a correction usually hardly leads to a correction.
- the advantage of using a narrow cuff which then allows the device width correction according to the invention to be carried out, is that it allows for particularly good resolution of other smaller variations in addition to the heart pulse.
- a narrow cuff does not dampen the variations as much, so that even small blood pressure fluctuations, such as those caused by breathing, can be detected in the intensity of the variations. Since the influence of breathing is not to be considered and taken into account in the methods according to the state of the art, a wide wristband is used for this very reason in the state of the art in order to The effect of cause 2 should be avoided if possible.
- the width is determined based on the arm diameter and length; for an upper arm cuff, the width should be approximately one-third of the length from shoulder to elbow.
- FIG. 4 A pressure curve 4000 is shown, which was recorded with a 3 cm wide cuff. It can be seen that the variations 4010 are visible up to the termination at 270 mmHg; a determination of the blood pressure according to the state of the art would indicate a systole of over 200 mmHg (a reference measurement with a state-of-the-art device resulted in a blood pressure of 140/100 mmHg).
- Graph 4200 shows the first derivative of the air pressure curve (scaled representation). The two areas of the causes can be identified by the local minima.
- Graph 4200 is the calculation basis for all further steps in order to determine times for pressure determinations (the pressures are then read off the air pressure curve 4000 at the respective times) and times for respiration. In addition, this curve 4200 can be used to determine the areas of importance of the two causes, which allows a calculation of blood pressure comparable to the state-of-the-art calculation even with narrow cuffs.
- Point 1 above is required if a cuff that is too narrow (relative to the state of the art) is to be used, which is advantageous for determining respiration and is generally necessary for displaying continuous blood pressure values. However, if only the influence of respiration on blood pressure is to be assessed, in particular, if no continuous blood pressure value is to be determined, this point is not necessary.
- pressure variations in the air pressure curve due to the heart rate can be assigned to a blood pressure.
- the phase of breathing in which the variation occurs linearly determines which value between the previously determined blood pressure values for inhalation and exhalation should be output.
- this approach does not provide any additional information and is also dangerous, as cases that do not conform to the assumption of regular breathing and a healthy heart rate cannot be detected.
- this approach can be used to verify the subsequent logic. If a data set is recorded and the above assumptions are met, the results of this approach must agree with those of the subsequent logic.
- the measurement period comprises at least ten seconds and advantageously the recording of the individual value measurements, which result in the continuous blood pressure measurement, takes place at each heartbeat.
- the above-mentioned determination of a plurality of blood pressure values can also be a determination of a plurality of non-respiration-corrected blood pressure values or even a determination of a plurality of non-respiration-corrected or respiration-corrected relative blood pressure values.
- a determination could be referred to as a trend measurement.
- the scaling of the standardized individual values, in particular the device-width-corrected intensity curve is omitted or is scaled solely on the basis of non-respiration-corrected blood pressure values.
- the advantage of such a determination is that, for example, a determination of respiration is not necessary. Nevertheless, it is possible to determine the course of blood pressure, either solely as a change over time or as a non-respiration-corrected value. Under certain circumstances, such statements are equally sufficient and represent an improvement over previously known methods of continuous blood pressure recording.
- a determination of a plurality of relative blood pressure values is also proposed.
- This method is carried out in a manner analogous to the method according to the invention described above.
- the plurality of individual measurements of the value assigned to the person's blood pressure value are first recorded in a time-resolved manner within the measurement period using the first sensor of the first device.
- no non-respiration-corrected blood pressure value needs to be determined.
- the changes, in particular gradients, of the values of the Individual value measurements are determined from the values of the individual value measurements, in particular those exhibiting the varying pressure loading, and from this, the intensity curve, comprising the multiple local extrema, can then be directly determined.
- a device-width-corrected intensity curve can be determined, as described above.
- the at least one, in particular at least two, upper approximation lines are then formed for the local maxima of the intensity curve, in particular the device width-corrected one, present in the measurement period, in particular the third and/or the second time period or the first time period, and the at least one, in particular at least two, lower approximation lines are then formed for the local minima of the intensity curve, in particular the device width-corrected one, present in the measurement period, in particular the sixth and/or the fifth time period or the fourth time period.
- the individual values of the intensity curve are normalized based on the difference between the upper approximation line and the lower approximation line at the respective time points. However, no scaling with the scaling constant is performed.
- a relative blood pressure curve is then determined from the standardized individual values, which includes local maxima and local minima.
- the multiple relative blood pressure values are determined from the blood pressure values assigned to the local maxima or minima of the relative blood pressure curve.
- the scaling constant is not a respiration-corrected blood pressure value, but a non-respiration-corrected blood pressure value, and the respective reference time point is used as the time point.
- a device in particular a cuff, in particular an air pressure cuff, with a wristband, wherein the device provides an inflatable volume and has a control unit.
- the control unit is configured and set up to inflate the volume, in particular based on a predetermined pressure change rate, and is further configured and set up to carry out the method according to the invention.
- the device also has at least one non-volatile storage medium, which is connected in particular to the control unit and/or on which the pressure change rate and/or the method according to the invention is stored.
- the device is also configured to record and determine the respiration curve of the method according to the invention.
- the device is a cuff, in particular an air pressure cuff, with a wristband, wherein the wristband has a longitudinal extension, wherein the wristband is designed to enclose a part of the body along its longitudinal extension, wherein the wristband has a width extension with a width of less than 5 cm, in particular 4 cm or less.
- the device is a cuff with a wristband, wherein the cuff is in particular a part of a wristwatch, in particular a smart watch.
- the figures illustrate exemplary embodiments of the method in a simplified manner, so that individual features of the invention are particularly simple and clear.
- the size ratios e.g., of the peaks, Therefore, the values of the Y-axis and Y-axis (e.g., amplitude or spacing between peaks) are not necessarily represented realistically.
- the values of the Y-axis and Y-axis do not necessarily represent realistic values. In particular, no Y-axis values are given for the intensity curves.
- identical elements are provided with the same reference symbols.
- the following examples refer to an air pressure cuff, also referred to as "cuff," which performs the blood pressure measurement.
- cuff air pressure cuff
- This can be, for example, a standard wrist or upper arm cuff.
- devices other than a cuff to perform the blood pressure measurement.
- the cuff it is possible that devices other than a standard wrist cuff are used for this purpose. For example, some smartwatches already have cuffs that measure blood pressure via the cuff.
- the figures show diagrams, including air pressure curves, in which individual measured values of the air pressure present within the cuff are depicted. Individual values of the air pressure curves can be assigned to the blood pressure values of the person on whom the measurement was performed using the cuff. The blood pressure values are calculated based on the values measured during the measurement using the pressure cuff over a measurement period ( Figure 5 ) recorded individual measurements of the air pressure in the pressure cuff.
- the X-axis of the diagram shown in the figures therefore shows the time of the measurement period and the Y-axis usually shows the air pressure values of the individual measurements or the person's blood pressure values determined from the individual measurements of the air pressure values.
- the curve resulting from the individual measurements of the air pressure values over time is referred to as the air pressure curve and describes the air pressure values as a function of time.
- the curve resulting from the blood pressure values determined from the individual measurements of the air pressure values is therefore also referred to as the blood pressure curve or blood pressure trend curve and describes the blood pressure values as a function of time.
- the barometric pressure curve is shown in section (a) of the following figures.
- the absolute blood pressure values associated with the measured barometric pressure are shown on the Y-axis, or at least relative values.
- the absolute values on the Y-axis shown in the figures are not necessarily realistic.
- the air pressure in the cuff continues to rise, blood flow can no longer be maintained smoothly, even in phases between diastole and systole, and variations can be detected in the cardiac pulse.
- blood flow is disrupted at every stage, including systole.
- the cuff deforms with the pulse, or the air pressure in the cuff changes, so that the heart rate is reflected in the air pressure.
- the measurable air pressure is exactly between the diastole and systole values. If the air pressure in the cuff is increased further, the artery is increasingly squeezed until no more blood flow is possible because the artery has collapsed. At this point, no variation is detectable.
- section b) of the Figure 1 is based on the recorded individual air pressure measurements during the measurement period, with the continuous increase removed/filtered out. This can be done purely mathematically, e.g., by determining a regression line as a function of time and subtracting 1000 from the blood pressure values of the pressure curve. However, it is also possible to achieve this with a bandpass filter, particularly a digital one. The technology used for this is known from the prior art and is implemented in particular in existing devices, cuffs, based on the respective sensor used, particularly manufacturer-specific. This filtering of the continuous, general increase in the measured air pressure due to the external pressure increase (pressurization correction) in the device is necessary and is solved sufficiently satisfactorily by the manufacturer's method, but does not represent an independent aspect of the present invention.
- the filtered curve 1100 also called the pressure-corrected intensity curve 1100
- the fluctuations or variations 1110 are now clearly visible. It can be seen that the intensity, i.e., the highs and lows of the variations, increase and decrease.
- the Figure 2 The air pressure values shown were determined from individual measurements taken within the measurement period on a person who was breathing heavily during the measurement period.
- the variations 2110 can be seen again. However, the intensity of the variations 2110 does not steadily increase and then decrease again. Rather, several increases and decreases in the intensity of the variations 2110 can be seen.
- a first increase followed by a decrease in the intensity of the variations 2110 can be seen in a first group 2111 of variations 2110 at approximately 157 s
- a second increase followed by a decrease in the intensity of the variations 2110 can be seen in a second group 2112 in the time period from 163 s to 167 s
- a third increase followed by a decrease in the intensity of the variations 2110 can be seen in a third group 2113 at 172 s.
- the general increase and the general decrease can also be seen - the first 2111 and third group 2113, for example, show lower intensities than the second, middle group 2112. Nevertheless, it can be seen - the individual groups 2111, 2112, 2113 are clearly distinguishable from one another - that circumstances other than the measurement method (increase or decrease in the air pressure in the cuff) change the detectable air pressure values.
- An evaluation according to the state of the art would either evaluate only the middle group 2112 (since this is clearly recognizable as the familiar arc) or the logic underlying the state of the art would interpret two or all three visible groups as one arc, as one group. Which interpretation is chosen depends on the precise implementation of the logic underlying the state of the art and may be different with slightly different data (e.g., in a directly subsequent measurement on the same person without changing the cuff).
- the logic underlying the state-of-the-art technology considers not only the middle group 2112, but also the lower group 2111. In such a case, lower diastolic blood pressure values are output. If only the middle group 2112 is considered, a higher diastolic blood pressure value is output. However, these differences in output with the same data are unsatisfactory.
- the blood pressure determined in this way is referred to as non-respiration-corrected blood pressure.
- the pressure increase is filtered out of the pressure curve 3000. This can be done in different ways. Typically, a digital bandpass filter is used for this purpose, but in the simplest case, a theoretical pressure increase curve, given by a linear adjustment of the pressure curve, can also be subtracted from the pressure curve.
- the terminology used with regard to the non-respiration-corrected first blood pressure value and the respiration-corrected first blood pressure values refers to a systolic blood pressure value, thus to a non-respiration-corrected systolic blood pressure value and the respiration-corrected systolic blood pressure values
- the non-respiration-corrected second blood pressure value and the respiration-corrected second blood pressure values refers to a diastolic blood pressure value, thus to a non-respiration-corrected diastolic blood pressure value and the respiration-corrected diastolic blood pressure values.
- the pressure curve 3100 filtered in this way is shown in section (b) of the Figure 3 This is used to evaluate the blood pressure value according to Riva Rocci and Korotkoff to determine non-respiration-corrected diastolic and systolic blood pressure.
- an upper compensation curve 3150 and a lower compensation curve 3160 are determined, which extend over the entire course of the pressure curve 3100, in which variations 3110 of the air pressure value in the pressure curve 3100 can be detected.
- the upper compensation curve 3150 represents an approximation, determined via the X-axis, to the greatest intensities 3120 of the variations 3110
- the lower compensation curve 3160 represents an approximation, determined via the X-axis, to the smallest intensities 3130 of the variations 3110.
- envelope is used in this disclosure for the combination of an upper compensation curve and a lower compensation curve, even if mathematically this actually refers to families of straight lines, but otherwise for the same principle.
- a greatest distance 3170 on the Y-axis (i.e., at the same X-value in each case, i.e., at the same time in each case) between the upper 3150 and lower 3160 compensation curve is then determined.
- a further distance 3171 is determined between the compensation curves 3150, 3160 on the Y-axis towards lower air pressures, here to values earlier in time, which is relatively smaller than the greatest distance 3170 by a predetermined value, e.g., specified by the cuff manufacturer.
- This distance and point is identified in the figure with the reference symbol 3171.
- a time point 3181 in the pressure curve 3000 is assigned to this distance 3171.
- the non-respiration-corrected diastolic blood pressure is then based on the air pressure value 3091 recorded at this time.
- the blood pressure 3091 corresponding to the time of the distance 3171 is read from the pressure curve 3000 and used as the non-respiration-corrected diastolic blood pressure.
- this time and the blood pressure are the second reference time 3181 and the non-respiration-corrected second (diastolic) blood pressure based on the air pressure 3091.
- a further distance 3172 is determined between the compensation curves 3150, 3160 on the Y-axis towards higher air pressures, here at later values, which is relatively smaller than the largest distance 3170 by a predetermined value, e.g., specified by the cuff manufacturer.
- This distance is shown on the upper approach curve 3150 in the Figure 3 marked with the reference symbol 3172 as a point.
- the non-respiration-corrected systolic blood pressure is then based on this distance 3172 and the times 3182 assigned to this value and the recorded air pressure value 3092.
- the air pressure 3092 associated with the time 3182 of the distance 3172 is read from the air pressure curve 3000 and used as the non-respiration-corrected systolic blood pressure.
- this time is the first reference time 3182 and is the non-respiration-corrected first (systolic) blood pressure, which is determined from the air pressure 3092.
- the blood pressure values that can be recorded are higher or lower due to breathing
- the blood pressure values that can be recorded from the air pressure values 3091, 3092 at the first 3181 or second time 3182 can be higher or lower due to breathing than the person's actual diastolic or systolic blood pressure, which is not influenced by breathing.
- respiration is used in the form of several phase segments, in particular a first phase segment 3572 and a second phase segment 3571 of respiration, and a corresponding blood pressure value is determined taking this respiration or the respective phase segment into account.
- several maximum inhalations and several maximum exhalations are advantageously recorded in the same measurement period in which the individual value measurements of the cuff air pressure 3000 were taken.
- the breathing curve can be described using the recorded values and describes inhalation and exhalation.
- the breathing curve thus has a maximum value, which represents, for example, the maximum inhalation, and a minimum value, which represents, for example, the maximum exhalation.
- Several such cycles of maximum inhalations and exhalations are now shown in section c) of Figure 3 together with the filtered pressure curve 3100, namely for the section of the time period in which the compensation curves 3150 and 3160 were determined and in which the non-respiration-corrected blood pressure values were determined based on the air pressure values 3092, 3091 at the first and second reference times 3182, 3181.
- the phase segments 3571, 3572 are defined by the maximum exhalations and inhalations.
- a second phase segment 3571 for example, initially has a maximum inhalation and later a maximum exhalation.
- the following maximum inhalation is already assigned to the next phase segment.
- the second phase segment begins at or shortly before the time of maximum inhalation and ends at or shortly after the time of maximum exhalation.
- a phase segment namely a first phase segment 3572, is used for systole, which first has a maximum exhalation.
- the first phase segment 3572 for example, initially has a maximum exhalation and later a maximum inhalation.
- the following maximum exhalation is already assigned to the next phase segment.
- the first phase segment begins at or shortly before the time of maximum exhalation and ends at or shortly after the time of maximum inhalation.
- a first phase segment 3572 is determined which has exactly one maximum exhalation at the second time 3585 and exactly one maximum inhalation at the first time 3586, and between the beginning of the first phase segment and the end of the first phase segment lies the first reference time 3182.
- the phase segment present when the non-respiration-corrected systolic blood pressure value is recorded at the air pressure 3092 is selected.
- a diastolic and a systolic blood pressure value can then be determined and output as a corresponding blood pressure value at maximum exhalation and maximum inhalation, respectively.
- the air pressure 3093 of the pressure curve 3000 present at the first time point 3583 of the second phase section 3571 is read from the pressure curve 3000, which is based on the individual value measurements, and the diastolic blood pressure value at maximum inspiration is thus determined.
- the pressure curve 3000 which is based on the individual value measurements, is the At the second time 3584 of the second phase section 3571, the air pressure 3094 of the pressure curve 3000 is read out and the diastolic blood pressure value at maximum exhalation is thus determined.
- the air pressure value 3095 of the pressure curve 3000 present at the second time point 3585 of the first phase section 3572 is read from the blood pressure values of the pressure curve 3000 based on the individual value measurements, and the systolic blood pressure value at maximum exhalation is thus determined.
- the air pressure value 3096 of the pressure curve 3000 present at the first time point 3585 of the first phase section 3572 and based on the individual value measurements is read out from air pressure values of the pressure curve 3000, which are based on the individual value measurements, and thus the systolic blood pressure value at maximum inspiration is determined.
- a correction is required for maximum accuracy and is preferable for purposes such as calibrating third-party devices. This is not necessary for a pure blood pressure reading.
- This pressure change rate is specified externally by a pump and/or a valve, as described above.
- the blood pressure values at air pressures 3091 and 3092 are equal to these air pressures and therefore do not need to be corrected.
- the blood pressures determined from air pressures 3093, 3094, 3095, and 3096 are now subject to the error to be corrected, since the externally specified pressure has changed within the phase segments.
- This error pressure for the blood pressure results from the time difference between the times 3583, 3584 to 3181 or 3585, 3586 to 3182 multiplied by the pressure change rate m. It should be noted that the time differences are a negative number if the time difference refers to a later point in time to an earlier point in time.
- an averaged, respiration-corrected diastolic blood pressure value can then be determined, for example, by averaging the values of the pair.
- the same procedure can be used for the pair of systolic blood pressure values.
- a pressure curve 4000 is shown from several individual air pressure measurements, which were obtained by measuring the air pressure in the air pressure cuff, over time.
- this pressure curve 4000 variations 4010 in the pressure curve can be seen at least in one time interval - analogous to the pressure curves shown in the previous figures. If the information regarding the person's breathing, i.e., the breathing cycles, is not provided by other devices or sensors during the measurement period, the information regarding the breathing, the breathing cycles, can be determined from the pressure curve 4000 during the measurement within the measurement period.
- the general gradient over time due to the increase in air pressure can be filtered from the pressure curve 4000, analogous to the previous descriptions for obtaining the curves 1100, 2100, and 3100.
- the first mathematical derivative of the pressure curve 4000 is formed over time in order to depict the changes in the pressure curve.
- Such a derivation of the pressure curve 4000 over time is described in section b) of the Figure 4 shown, whereby the values of the derivative are scaled for better recognition.
- the gradients of the pressure curve 4000 are shown scaled.
- the variations 4010 given in the pressure curve 4000 are also recognizable there, namely through local maximum and minimum values 4210 in the intensity curve 4200.
- the maximum values 4210 in the intensity curve 4200 represent local maxima 4220 and the minimum values 4210 in the intensity curve 4200 represent local minima 4230. It can be seen that the absolute values of the local maxima 4220 and local minima 4230 over the course of Time fluctuates, namely, in a first, rough approximation, they first increase and then decrease again. Furthermore, upon a somewhat more detailed examination, it can be seen that the absolute values of the local maxima 4220 and local minima 4230 cyclically increase and decrease. From this cyclical pattern, the person's breathing cycles during the measurement period can now be determined using the method according to the invention.
- the maximum values 4220 and the minimum values 4230 are considered, and a fitting curve is created for each of them.
- the first fitting curve 4250 is therefore a fitting curve for the local maxima 4220
- the second fitting curve 4260 is a fitting curve for the local minima 4230.
- a best fit is preferably used, e.g., via a least-squares fitting (between the fit and the data point), particularly iteratively, so that the respective extreme values in the intensity curve 4200 are optimally approximated. It is also possible to create the fitting curves only in sections so that they better correspond to the detected cycles.
- the first, upper compensation curve 4250 has a locally maximum intensity value of 4253 at approximately 155 seconds.
- the second, lower compensation curve 4260 also has a locally lowest value of 4263 at the same point, the distance between the two compensation curves 4250, 4260 is at its maximum at this point in time compared to the surroundings.
- Such a local maximum distance results from the change in blood pressure during respiration. Conversely, this means that the distance is a measure of respiration itself.
- these maximum intervals for example, 4253 to 4263 and 4256 to 4266, are assigned to a maximum state of breathing, i.e.
- phase segment of respiration By determining these two points in time, 4283 and 4284, the period of a phase segment of respiration can be derived. Such a phase segment must be taken into account when assigning diastolic or systolic blood pressure values.
- the period of the phase segment first contains a maximum value, in particular, where it begins, and then a minimum value, in particular, where it ends. It is also possible for the phase segment and its period to be found from an opposite combination of the minimum and maximum distances between the compensation curves 4260 and 4250. For this purpose, a minimum distance between the compensation curves, e.g., at time 4285 and points 4265 on the lower compensation curve 4260 and 4255 on the upper compensation curve 4250, can be found as the beginning. The end of this phase segment is formed by a subsequent local maximum of the distance between the two compensation curves 4250 and 4260 at time 4286 between points 4266 and 4256.
- a local maximum (e.g., 4253 to 4263 or 4256 to 4266) or minimum (e.g., 4254 to 4264 or 4255 to 4265) distance of the compensation curves 4250 and 4260 to a maximum position within the respiration, i.e., maximum inspiration or maximum expiration depends on the choice of determining the intensity curve. If, for example, the intensity curve is determined using a bandpass filter, the intensity curve reflects the blood pressure. Consequently, a locally maximum distance between the compensation curves 4250 and 4260 correspond to maximum exhalation, and conversely, a locally minimal distance corresponds to maximum inhalation. The exact opposite applies if the intensity curve results from a mathematical derivation.
- the temporal interval between the local maxima and the local minima can also be considered.
- the temporal interval between consecutive local maxima or consecutive minima, or the temporal interval between consecutive local minima and maxima or maxima and minima is considered.
- the data underlying this analysis were acquired at a data rate of at least 200 Hz.
- a shortest time interval, also called interval, between local maxima or local minima of a maximum inhalation and a longest time interval between the local maxima or minima of a maximum exhalation are assigned.
- Two data sets are required for data processing: the intensity of the variations in the cuff pressure curve and the respiration information. If respiration is to be determined directly from the air pressure curve, a narrow cuff is advantageous. However, this requires further calculation in order to be able to distinguish the transition of the causes of the variations.
- the intensity curve of the variations is determined directly from the pressure curve using a suitable bandpass filter. This is also a possible approach for the method presented here. Since the absolute value of the variations is not important, the first mathematical derivative of the pressure curve can also be used. This has the advantage that information is not lost through filtering.
- the derivative shows a local maximum and a local minimum for each variation; the derivative itself (averaged over a longer period of time) shows the rate of pressure change specified by the pump (when measuring with increasing pressure) or by the valve (when measuring with decreasing pressure) and should assume a value that is as constant as possible due to the pump or valve.
- the intensity curve of the variations is examined with regard to local minima and maxima; the result is a list consisting of tuples of the form time to value of the intensity.
- the respiration information is a list of tuples in the form of time of maximum inspiration and time of maximum expiration. From these values, the values for the time of inspiration and expiration, as well as the respiratory rate, can be determined.
- the respiration information can be determined using another method, e.g., methods for determining from ECG, light waves, and acceleration sensor data are known to those skilled in the art. Methods based on microphones, ultrasound, or temperature are not common, but their evaluation is very similar to the evaluation of methods using light waves. However, it is advantageous to determine respiration directly from the air pressure curve.
- Figure 4 The envelope (consisting of the upper compensation curve 4250 and the lower compensation curve 4260) of the intensity profile of the variations in the air pressure curve, which was determined by mathematical derivation, shows changes with respiration.
- Reference symbol 4284 marks an exemplary time at which the envelope has a local minimum height diameter.
- Such a time is a time of maximum exhalation; the times of the local maximum height diameter of the envelope
- the time point marked with the reference symbol 4283 is the time of maximum inspiration.
- Another method is to detect the interval between two consecutive variations. This interval decreases with inspiration and increases again with expiration.
- the suitability of both methods of determining respiration varies from person to person, as these phenomena are not always visible.
- the time of maximum inspiration or the time of maximum expiration can be determined with a temporal error of half the cardiac pulse interval that exists at the time of the respective measuring points, due to methodological reasons.
- both phenomena are recognizable in a data set and can be evaluated together to increase accuracy.
- the coefficient of variation is given by the standard deviation divided by the mean of the interval times and is expressed as a percentage.
- the amplitude is given by the difference between the distance during inspiration and the distance during expiration.
- the amplitude is given by the difference between the interval times during inspiration and expiration.
- the figure shows a simple case of pressurization, namely with a constant and positive pressurization rate of change. However, a non-constant or partly positive and partly negative pressurization rate of change over the measurement period is also possible.
- the pressure curve 5000 that can then be measured shows this varying (constant or non-constant, positive, negative or both) pressure loading.
- a first plurality of respiration-corrected systolic blood pressure values can be determined by means of the previously described inventive method. It is also possible to determine a second plurality of respiration-corrected diastolic blood pressure values.
- Figure 5 illustrated example of an inventive evaluation of schematic air pressure values, These last two aspects of the further advantageous evaluation option will now be presented.
- This evaluation option has two aspects. Firstly, it shows how continuous blood pressure values are determined and secondly, although this is not always necessary, it should be shown how a narrow cuff can be used.
- continuous refers to the recording of blood pressure values over a longer period of time, preferably at short intervals, preferably for each heartbeat.
- narrower means that the data is recorded using a cuff that is narrower than the cuff used in the state of the art.
- a cuff for use on the upper arm has an optimal width if this width is one third of the length between the shoulder joint and the elbow joint.
- a narrow cuff can in particular be as little as 3 cm wide.
- a narrow cuff leads to measurement errors when using state-of-the-art methods.
- an overestimation of the blood pressure, especially the systole is typically output.
- the pressure variations, shown here by 5010 are not only caused by the tissue and arteries below the cuff, but can also originate from directly adjacent tissue and arteries.
- this effect is small compared to the pressure variations caused by the arteries below the cuff and is further mechanically suppressed by the large volume of the cuff.
- this effect is no longer negligible and leads to pressure variations being detectable even at high cuff pressures.
- the intensity curve is mechanically filtered due to the large volume, and secondly, it is blurred because the measurement area is large and therefore affects many arteries.
- a narrow cuff is advantageous because it allows for less strain on the user and thus a lower rate of pressure change, allowing for a longer measurement and thus a longer, continuous blood pressure determination.
- the change curve 5200 or intensity curve 5200 is created, for example, using the mathematical derivative function.
- This intensity curve 5200 represents the recorded air pressure values regardless of the varying pressurization.
- the variations 5010 of the pressure curve 5000 are present and recognizable as maximum values 5220 and as minimum values 5230 of the intensity curve 5200 along the measurement period.
- the minimum values 5230 are those individual values of the intensity curve 5200 that have the lowest individual values compared to the immediately preceding individual value and the immediately following individual value.
- the maximum values 5220 are those individual values of the intensity curve 5200 which have the highest individual values compared to the immediately preceding individual value and the immediately following individual value.
- these local extrema 5220, 5230 are not evenly distributed. Rather, it can be observed that from a certain point in time or a certain higher pressure of pressurization, the local maxima and from a certain point in time or a certain higher pressure of pressurization, the local minima increase significantly, i.e., the maxima become larger and the minima have smaller values. This is, on the one hand, the fundamental effect of the pressurization, as further described above, and, on the other hand, an effect of the narrow cuff, since from these pressures of pressurization, the effect of the cuff being too narrow begins to occur, i.e., excessive pressures and reverse fluctuations are recorded.
- a first method step several, in particular three, lower approximation lines 5261, 5262, 5263 and three upper approximation lines 5251, 5252, 5253 are formed. This is implemented, for example, by a linear approximation of a line to the local extrema.
- the first point in time within the pressure curve and thus within the measurement period at which the variations 5010 lie outside the noise level is preferably selected as the starting point of the first upper approximation line 5251 and the first lower approximation line 5261
- the last point in time within the pressure curve at which the variations 5010 lie outside the noise level is preferably selected as the end point of the third upper approximation line 5253 and the third lower approximation line 5263.
- the first upper approximation line 5251 is formed and determined in such a way that an approximation line to the local maxima 5220 present in a first time period is formed for the first upper approximation line 5251, whereby the beginning 5280 of the first time period is defined by the beginning of the first upper approximation line 5251.
- the time from which the approximation of the first upper approximation line 5251 to the local maxima 5220 falls below a predetermined degree of determination is taken as a temporary end of the first upper approximation line 5251 and the first time period.
- the third upper approach line 5253 is formed, which is formed as an approach line to the local maxima 5220 present within a third time period, whereby the end 5283 of the third time period is defined by the end of the third upper approach line 5253.
- the time is taken from which the approach of the third upper approximation line 5253 to the local maxima 5220 falls below the predetermined coefficient of determination.
- the resulting end of the first upper approach line 5251 is determined as the final end 5281 of the first time period, the resulting end of the second upper approach line 5252 as the final end 5282 of the second time period, the resulting beginning of the second upper approach line 5252 as the final beginning 5281 of the second time period and the resulting beginning of the third upper approach line 5253 as the final beginning 5282 of the third time period.
- the first lower approximation line 5261 is determined and formed in such a way that for the first lower approximation line 5261 an approximation line to the local minima 5230 present within a fourth time period, whereby the beginning 5285 of the fourth time period is defined by the beginning of the first lower approximation line 5261.
- the time from which the approach of the first lower approximation line 5261 to the local minima 5230 falls below the predetermined coefficient of determination is taken as a temporary end of the first lower approximation line 5261 and the first time period.
- the third lower approximation line 5263 is formed, which is formed as an approximation line to the local minima 5230 present within a sixth time period, whereby the end 5288 of the sixth time period is defined by the end of the third lower approximation line 5263.
- the time from which the approximation of the third lower approximation line 5263 to the local minima 5230 falls below the predetermined coefficient of determination is taken as a temporary start of the third lower approximation line 5263 and the third time period.
- a second lower approach line 5262 is determined within a fifth time period, so that the temporary start of the second lower approach line 5263 and the fifth time period coincides with the temporary end of the first lower approach line 5261 and the temporary end of the second lower approach line 5263 and the fifth time period coincides with the temporary start of the third lower approach line 5263.
- the temporary end of the second lower approximation line 5262, and thus the temporary beginning of the third lower approximation line 5263, and the temporary beginning of the second lower approximation line 5262, and thus the temporary end of the first lower approximation line 5261, are then iteratively changed until the second lower approximation line 5262 is an approximation line that has the smallest deviation from the local minima 5230 present in the second time period, in particular exceeds a predetermined coefficient of determination.
- the resulting end of the first lower approach line 5261 is determined as the final end 5286 of the fourth time period
- the resulting end of the second lower approach line 5262 is determined as the final end 5287 of the fifth time period
- the resulting beginning of the second lower approach line 5262 is determined as the final beginning 5286 of the fifth time period
- the resulting beginning of the third lower approach line 5263 is determined as the final beginning 5287 of the sixth time period.
- the first time at which the exaggerated effect of the narrow cuff significantly influences the air pressure values is the beginning of 5281 of the second time period and the beginning of 5286 of the fourth time period.
- the reason why the beginning of 5281 of the second time period and the beginning of 5286 of the fourth time period are not identical is probably because the effect depends on the specific blood pressure within the cardiac cycle.
- the individual values of the change curve 5200 present at the respective time are multiplied by a width correction factor, in particular multiplied by a cuff width correction factor.
- the cuff width correction factor is based on a standardized difference between the upper and lower approach lines. The difference is based on the distance, the difference in height, between the upper and lower approach lines at the respective time, and the standardization of the difference is based on the standardization parameter, the cuff width correction constant.
- This standardized difference also called the cuff width correction factor
- the width correction factor also consists of a cuff target factor, which describes the target shape of the intensity fluctuation 5300.
- the target shape is 0 at times 5285 and 5283 and 1 at time 5289. Between these three time points, the target shape is partially linear.
- a value of curve 5300 at a time is the value at that time of curve 5200 multiplied by the cuff width correction factor at that time multiplied by the cuff target factor at that time.
- the device width corrected intensity curve 5300 is formed, which has several local maxima 5320 and several local minima 5330, i.e. individual values which have smaller or larger individual values compared to the neighboring individual values.
- the device-width-corrected intensity curve 5300 From this device-width-corrected intensity curve 5300, at least relative continuous blood pressure values could be determined. This would allow changes over time to be determined, and these relative changes could be used, for example, to track changes in state. It is also possible to obtain non-respiration-corrected absolute blood pressure values from this device-width-corrected intensity curve 5300. For this purpose, the device-width-corrected intensity curve 5300 would have to be scaled. However, since the object of the invention is, in particular, to obtain respiration-corrected blood pressure values From this device width corrected intensity curve, 5300 respiration corrected blood pressure values can be determined. This can be done in a similar way to Figure 3 and if necessary Figure 4 described.
- continuous blood pressure values are now determined from this device-width-corrected intensity curve 5300, as described below. For this purpose, a second upper approximation line 5352 and a second lower approximation line 5362 are determined.
- the second upper approximation line 5352 represents a, in particular linear, approximation to the local maxima 5320 of the device-width-corrected intensity curve 5300, namely starting from the end of the device-width-corrected intensity curve 5300, which corresponds to the air pressure values at high pressure loads.
- the second upper approximation line 5352 preferably represents an approximation up to the time of the mean value 5289.
- the second lower approximation line 5362 represents a, in particular linear, approximation to the local minima 5330 of the device-width-corrected intensity curve 5300, namely starting from the end of the device-width-corrected intensity curve 5300, which corresponds to the air pressure values at high pressure loads.
- the second lower approximation line 5362 preferably represents an approximation up to the time of the mean value 5289.
- This procedure (considering only the range 5472 at high pressures) usually provides a usable result for 90% of this time range of the second approximation line (envelope in this time range at high pressures), especially with good sensors.
- the first upper approximation line 5351 represents a, in particular linear, approximation to the local maxima 5320 of the device-width-corrected intensity curve 5300, namely starting from the beginning of the device-width-corrected intensity curve, which corresponds to the air pressure values at low pressures.
- the first upper approximation line 5351 preferably represents an approximation up to the time of the mean value 5289.
- the first lower approximation line 5361 represents a, in particular linear, approximation to the local minima 5330 of the device-width-corrected intensity curve 5300, namely starting from the beginning of the device-width-corrected intensity curve, which corresponds to the air pressure values at low pressure loadings.
- the first lower approximation line 5361 preferably represents an approximation up to the time of the mean value 5289.
- the individual values of the device width-corrected intensity curve 5300 available at the respective time are standardized. Normalization is based on the height differences between the upper and lower approximation lines 5351, 5352, 5361, 5362 present at the respective time. In the simplest case, the individual value of the device width-corrected intensity curve 5300 present at the respective time is divided by the height difference present at that time.
- the local maxima in the device width-corrected intensity curve normalized in this way fluctuate around an upper approximation line 5450 based on the first and/or second upper approximation line, which is now flat due to the normalization.
- the local minima in the device width-corrected intensity curve normalized in this way also fluctuate around a lower approximation line 5460 based on the first and/or second lower approximation line, which is now flat due to the normalization.
- the scaling is based on the differences between the standardized individual values in the relative blood pressure curve and the absolute respiration-corrected blood pressure values. Therefore, if the respiration-corrected first, i.e. systolic blood pressure values are to be used as a basis, as in the Figure 5 As shown, the values for systole 5077 and 5078, which were determined according to the previously described procedure, are used. These systole values describe the highest and lowest values within respiration, and the values were determined at a single point in time, specifically at a single heartbeat.
- the standardized individual values for these two points in time are used, i.e., the standardized individual values 5477 and 5478, which can be determined at the first point in time 5087 and the second point in time 5088 from the relative blood pressure curve 5400.
- a correction is also required in the absolute value range, since the use of mathematical derivation has lost any connection to an absolute value.
- this "offset" error is accepted and recalculated as follows: For this purpose, it is proposed and Figure 5 It is carried out by using an average of the respiration-corrected systolic and diastolic blood pressure values, i.e., an average of the four values is taken.
- the basis is the blood pressure values during inspiration and expiration on which the respiration-corrected blood pressure value is based, here 5077 and 5078, and the blood pressure mean of the four respiration-corrected first and second blood pressures 5073, 5074, 5077, 5078.
- the blood pressure values 5077, 5078 refer to the systolic blood pressure at the times 5087 and 5088 respectively. However, it would also be possible to use the respiration-corrected diastolic blood pressure values instead.
- the standardized individual values 5477 and 5478 can be determined at these times.
- each individual value in the relative blood pressure curve 5400 is shifted linearly to obtain the values for the blood pressure curve 5500, where EW stands for individual value, BPVK for Blood pressure curve, BPW for blood pressure value, atmk. for respiration corrected, syst. for systole or systolic and diast.
- This blood pressure curve 5500 has local maxima and local minima, whereby continuous systolic blood pressure values 5495, 5496 can be formed and determined by the local maxima of the normalized and scaled device width corrected intensity curve, i.e. the blood pressure curve 5500.
- continuous diastolic blood pressure values 5493 and 5494 can also be derived. These are formed by the local minima of the normalized and scaled device-width-corrected intensity curve, i.e., the blood pressure curve 5500.
- Sub-area (a) shows an ideal case. In this case, there is no time offset between the recorded times of maximum inspiration 3583 and maximum expiration 3584 within the second phase segment 3571, e.g., because the respiration curve was determined from the individual value measurements, which also form the basis for calculating the blood pressure values.
- a second scenario is shown in section (b).
- the second reference time point 3181 at which the diastolic non-respiratory corrected blood pressure value was determined, is a later time point than in the ideal case.
- the determination of the non-respiratory corrected blood pressure respiration-corrected blood pressure value according to the state of the art contains such inaccuracies.
- the respiration curve 3500 used and the associated times of maximum inspiration 3583 and maximum expiration 3584 have a time offset from the times on which the blood pressure values are determined.
- the time 3181 would be outside a phase segment that is determined solely on the basis of the times of maximum inspiration 3583 and maximum expiration 3584.
- the end of the phase segment 3571 to be used is based on the time of the recorded maximum expiration 3584, but a weighted time center 3589 between the time of the recorded maximum expiration 3584 and the time of the subsequently recorded maximum inspiration is used. If time 3181 does not coincide with a suitable phase segment, a weighted time center 3589 between maximum inspiration and expiration (at the non-matching phase segment found) is determined. Depending on the position of time 3181 relative to time center 3589, the appropriate phase segment before or after is used for further processing.
- time 3181 is still before the averaged time center 3589. In the scenario on which sub-area (c) was based, time 3181 is after the averaged time center 3589, so that the subsequent phase segment is used.
- FIG. 7 is a schematic representation of a pressure curve 7000 of the blood in an artery under changing stress conditions, here the recovery is shown as an example.
- the individual influences on the pressure can be recognized. If the curve is analyzed with a high temporal resolution, the blood pressure change 7100 due to the heart rate can be recognized and variations 7010, namely maxima 7020 and minima 7030, can be recognized. At a medium temporal resolution (indicated by the dashed line 7200), the influence of respiration on the Pressure can be seen and at low temporal resolution (indicated by the dashed line 7300) the influence of exertion can be seen.
- An influencing factor affects blood pressure in two ways.
- an influencing factor changes blood pressure directly.
- the influence of pulse leads to a change in the heart rate
- the influence of breathing leads to a change in the respiratory cycle
- the influence of exertion leads to a change in the state of exertion.
- An influencing factor also affects the other influencing factors and thus has an indirect effect on blood pressure.
- the heart and breathing rate increase (increasing to the left).
- the influence of breathing on blood pressure also decreases. There can be several reasons for this.
- a typical reason is that breathing becomes shallower under exertion.
Landscapes
- Health & Medical Sciences (AREA)
- Life Sciences & Earth Sciences (AREA)
- Engineering & Computer Science (AREA)
- Public Health (AREA)
- Molecular Biology (AREA)
- Physiology (AREA)
- Veterinary Medicine (AREA)
- Physics & Mathematics (AREA)
- General Health & Medical Sciences (AREA)
- Biophysics (AREA)
- Pathology (AREA)
- Biomedical Technology (AREA)
- Heart & Thoracic Surgery (AREA)
- Medical Informatics (AREA)
- Animal Behavior & Ethology (AREA)
- Surgery (AREA)
- Vascular Medicine (AREA)
- Cardiology (AREA)
- Signal Processing (AREA)
- Dentistry (AREA)
- Pulmonology (AREA)
- Ophthalmology & Optometry (AREA)
- Computer Vision & Pattern Recognition (AREA)
- Artificial Intelligence (AREA)
- Psychiatry (AREA)
- Oral & Maxillofacial Surgery (AREA)
- Measuring Pulse, Heart Rate, Blood Pressure Or Blood Flow (AREA)
Priority Applications (2)
| Application Number | Priority Date | Filing Date | Title |
|---|---|---|---|
| EP23196265.5A EP4520260A1 (fr) | 2023-09-08 | 2023-09-08 | Procédé de mesure de la pression sanguine |
| PCT/EP2024/074955 WO2025051932A1 (fr) | 2023-09-08 | 2024-09-06 | Procédé de mesure de la pression artérielle et dispositif correspondant |
Applications Claiming Priority (1)
| Application Number | Priority Date | Filing Date | Title |
|---|---|---|---|
| EP23196265.5A EP4520260A1 (fr) | 2023-09-08 | 2023-09-08 | Procédé de mesure de la pression sanguine |
Publications (1)
| Publication Number | Publication Date |
|---|---|
| EP4520260A1 true EP4520260A1 (fr) | 2025-03-12 |
Family
ID=88016337
Family Applications (1)
| Application Number | Title | Priority Date | Filing Date |
|---|---|---|---|
| EP23196265.5A Pending EP4520260A1 (fr) | 2023-09-08 | 2023-09-08 | Procédé de mesure de la pression sanguine |
Country Status (2)
| Country | Link |
|---|---|
| EP (1) | EP4520260A1 (fr) |
| WO (1) | WO2025051932A1 (fr) |
Citations (3)
| Publication number | Priority date | Publication date | Assignee | Title |
|---|---|---|---|---|
| WO2016148956A1 (fr) * | 2015-03-18 | 2016-09-22 | Lifecuff Technologies Inc. | Procédés et dispositifs pour conditionnement ischémique à distance par l'intermédiaire d'occlusion de membre partielle |
| EP3456254A1 (fr) * | 2017-09-18 | 2019-03-20 | Koninklijke Philips N.V. | Dispositif pour déterminer la pression sanguine diastolique d'un sujet |
| US20220031176A1 (en) * | 2018-12-05 | 2022-02-03 | Holger Redtel | Improved calibration for measuring the direct continuous blood pressure from the pulse transit time, pulse wave velocity or intensity of the electrocardiogram |
-
2023
- 2023-09-08 EP EP23196265.5A patent/EP4520260A1/fr active Pending
-
2024
- 2024-09-06 WO PCT/EP2024/074955 patent/WO2025051932A1/fr active Pending
Patent Citations (3)
| Publication number | Priority date | Publication date | Assignee | Title |
|---|---|---|---|---|
| WO2016148956A1 (fr) * | 2015-03-18 | 2016-09-22 | Lifecuff Technologies Inc. | Procédés et dispositifs pour conditionnement ischémique à distance par l'intermédiaire d'occlusion de membre partielle |
| EP3456254A1 (fr) * | 2017-09-18 | 2019-03-20 | Koninklijke Philips N.V. | Dispositif pour déterminer la pression sanguine diastolique d'un sujet |
| US20220031176A1 (en) * | 2018-12-05 | 2022-02-03 | Holger Redtel | Improved calibration for measuring the direct continuous blood pressure from the pulse transit time, pulse wave velocity or intensity of the electrocardiogram |
Also Published As
| Publication number | Publication date |
|---|---|
| WO2025051932A1 (fr) | 2025-03-13 |
Similar Documents
| Publication | Publication Date | Title |
|---|---|---|
| EP2059166B1 (fr) | Procédé et dispositif de détermination de la fréquence respiratoire | |
| EP2240072B1 (fr) | Manomètre, en particulier sphygmomanomètre, procédé de détermination de valeurs de pression, procédé d'étalonnage d'un manomètre et programme informatique pour la mise en oeuvre de ces procédés | |
| EP1860999B1 (fr) | Dispositif de diagnostic mobile | |
| EP3890600B1 (fr) | Procédé de calibration et dispositif de calibration pour de mesures continues de la pression artérielle | |
| US20120065480A1 (en) | Stress monitor system and method | |
| JP2009540953A (ja) | うっ血性心不全患者の携帯型自動モニタリング | |
| DE102010014761B4 (de) | Verfahren zur Bestimmung von Vital-Parametern | |
| EP3145394B1 (fr) | Procédé et dispositif de détermination de la pression sanguine systolique centrale | |
| DE102010061580A1 (de) | Verwendung des Frequenzspektrums eines Artefaktes in der Oszillometrie | |
| EP3518757A1 (fr) | Surveillance de signaux biologiques, en particulier d'électrocardiogrammes | |
| AT508114B1 (de) | Vorrichtung zur nicht-invasiven bestimmung des arteriellen blutdrucks | |
| EP1673009B1 (fr) | Procede et appareil de mesure de la pression arterielle | |
| EP3316768B1 (fr) | Dispositif et procédé pour la surveillance et la mesure du mécanisme d'autorégulation de la pression sanguine chez un être vivant | |
| EP3803896B1 (fr) | Dispositif d'analyse médicale permettant d'évaluer l'aptitude à narcose d'un patient | |
| EP4520260A1 (fr) | Procédé de mesure de la pression sanguine | |
| DE102023124287A1 (de) | Blutdruckmessverfahren | |
| AT524040B1 (de) | Verfahren und messvorrichtung zur kontinuierlichen, nicht-invasiven bestimmung zumindest eines herz-kreislaufparameters | |
| DE10319361A1 (de) | Vorrichtung und Verfahren zum Messen der vegetativen Balance | |
| EP4085825B1 (fr) | Procédé de mesure de la pression artérielle pourvu de brassard | |
| WO2018215482A1 (fr) | Procédé de détermination d'au moins une valeur de pression artérielle d'un sujet d'expérience | |
| EP1313398A1 (fr) | Procede et dispositif pour determiner la pression arterielle de facon continue et non invasive | |
| EP4736752A1 (fr) | Procédé mis en uvre par ordinateur, produit programme informatique, support lisible par ordinateur, système et procédé de détermination d'une performance cardiovasculaire | |
| DE112019002064T5 (de) | Elektronisches blutdruckmessgerät und herzfehler-detektor |
Legal Events
| Date | Code | Title | Description |
|---|---|---|---|
| PUAI | Public reference made under article 153(3) epc to a published international application that has entered the european phase |
Free format text: ORIGINAL CODE: 0009012 |
|
| STAA | Information on the status of an ep patent application or granted ep patent |
Free format text: STATUS: THE APPLICATION HAS BEEN PUBLISHED |
|
| AK | Designated contracting states |
Kind code of ref document: A1 Designated state(s): AL AT BE BG CH CY CZ DE DK EE ES FI FR GB GR HR HU IE IS IT LI LT LU LV MC ME MK MT NL NO PL PT RO RS SE SI SK SM TR |
|
| STAA | Information on the status of an ep patent application or granted ep patent |
Free format text: STATUS: REQUEST FOR EXAMINATION WAS MADE |
|
| 17P | Request for examination filed |
Effective date: 20250911 |