EP4570800A1 - Forme cristalline d'un composé pyridinopyrimidinone, sel acide de celle-ci, forme cristalline d'un sel acide de celle-ci et utilisation - Google Patents
Forme cristalline d'un composé pyridinopyrimidinone, sel acide de celle-ci, forme cristalline d'un sel acide de celle-ci et utilisation Download PDFInfo
- Publication number
- EP4570800A1 EP4570800A1 EP23851836.9A EP23851836A EP4570800A1 EP 4570800 A1 EP4570800 A1 EP 4570800A1 EP 23851836 A EP23851836 A EP 23851836A EP 4570800 A1 EP4570800 A1 EP 4570800A1
- Authority
- EP
- European Patent Office
- Prior art keywords
- crystal form
- salt
- compound
- formula
- pattern
- Prior art date
- Legal status (The legal status is an assumption and is not a legal conclusion. Google has not performed a legal analysis and makes no representation as to the accuracy of the status listed.)
- Pending
Links
Images


Classifications
-
- A—HUMAN NECESSITIES
- A61—MEDICAL OR VETERINARY SCIENCE; HYGIENE
- A61P—SPECIFIC THERAPEUTIC ACTIVITY OF CHEMICAL COMPOUNDS OR MEDICINAL PREPARATIONS
- A61P9/00—Drugs for disorders of the cardiovascular system
-
- A—HUMAN NECESSITIES
- A61—MEDICAL OR VETERINARY SCIENCE; HYGIENE
- A61K—PREPARATIONS FOR MEDICAL, DENTAL OR TOILETRY PURPOSES
- A61K31/00—Medicinal preparations containing organic active ingredients
- A61K31/33—Heterocyclic compounds
- A61K31/395—Heterocyclic compounds having nitrogen as a ring hetero atom, e.g. guanethidine or rifamycins
- A61K31/495—Heterocyclic compounds having nitrogen as a ring hetero atom, e.g. guanethidine or rifamycins having six-membered rings with two or more nitrogen atoms as the only ring heteroatoms, e.g. piperazine or tetrazines
- A61K31/505—Pyrimidines; Hydrogenated pyrimidines, e.g. trimethoprim
- A61K31/506—Pyrimidines; Hydrogenated pyrimidines, e.g. trimethoprim not condensed and containing further heterocyclic rings
-
- A—HUMAN NECESSITIES
- A61—MEDICAL OR VETERINARY SCIENCE; HYGIENE
- A61K—PREPARATIONS FOR MEDICAL, DENTAL OR TOILETRY PURPOSES
- A61K31/00—Medicinal preparations containing organic active ingredients
- A61K31/33—Heterocyclic compounds
- A61K31/395—Heterocyclic compounds having nitrogen as a ring hetero atom, e.g. guanethidine or rifamycins
- A61K31/495—Heterocyclic compounds having nitrogen as a ring hetero atom, e.g. guanethidine or rifamycins having six-membered rings with two or more nitrogen atoms as the only ring heteroatoms, e.g. piperazine or tetrazines
- A61K31/505—Pyrimidines; Hydrogenated pyrimidines, e.g. trimethoprim
- A61K31/519—Pyrimidines; Hydrogenated pyrimidines, e.g. trimethoprim ortho- or peri-condensed with heterocyclic rings
-
- A—HUMAN NECESSITIES
- A61—MEDICAL OR VETERINARY SCIENCE; HYGIENE
- A61K—PREPARATIONS FOR MEDICAL, DENTAL OR TOILETRY PURPOSES
- A61K45/00—Medicinal preparations containing active ingredients not provided for in groups A61K31/00 - A61K41/00
- A61K45/06—Mixtures of active ingredients without chemical characterisation, e.g. antiphlogistics and cardiaca
-
- A—HUMAN NECESSITIES
- A61—MEDICAL OR VETERINARY SCIENCE; HYGIENE
- A61P—SPECIFIC THERAPEUTIC ACTIVITY OF CHEMICAL COMPOUNDS OR MEDICINAL PREPARATIONS
- A61P17/00—Drugs for dermatological disorders
-
- A—HUMAN NECESSITIES
- A61—MEDICAL OR VETERINARY SCIENCE; HYGIENE
- A61P—SPECIFIC THERAPEUTIC ACTIVITY OF CHEMICAL COMPOUNDS OR MEDICINAL PREPARATIONS
- A61P35/00—Antineoplastic agents
-
- A—HUMAN NECESSITIES
- A61—MEDICAL OR VETERINARY SCIENCE; HYGIENE
- A61P—SPECIFIC THERAPEUTIC ACTIVITY OF CHEMICAL COMPOUNDS OR MEDICINAL PREPARATIONS
- A61P35/00—Antineoplastic agents
- A61P35/02—Antineoplastic agents specific for leukemia
-
- A—HUMAN NECESSITIES
- A61—MEDICAL OR VETERINARY SCIENCE; HYGIENE
- A61P—SPECIFIC THERAPEUTIC ACTIVITY OF CHEMICAL COMPOUNDS OR MEDICINAL PREPARATIONS
- A61P43/00—Drugs for specific purposes, not provided for in groups A61P1/00-A61P41/00
-
- C—CHEMISTRY; METALLURGY
- C07—ORGANIC CHEMISTRY
- C07C—ACYCLIC OR CARBOCYCLIC COMPOUNDS
- C07C309/00—Sulfonic acids; Halides, esters, or anhydrides thereof
- C07C309/01—Sulfonic acids
- C07C309/02—Sulfonic acids having sulfo groups bound to acyclic carbon atoms
- C07C309/03—Sulfonic acids having sulfo groups bound to acyclic carbon atoms of an acyclic saturated carbon skeleton
- C07C309/04—Sulfonic acids having sulfo groups bound to acyclic carbon atoms of an acyclic saturated carbon skeleton containing only one sulfo group
-
- C—CHEMISTRY; METALLURGY
- C07—ORGANIC CHEMISTRY
- C07C—ACYCLIC OR CARBOCYCLIC COMPOUNDS
- C07C55/00—Saturated compounds having more than one carboxyl group bound to acyclic carbon atoms
- C07C55/02—Dicarboxylic acids
- C07C55/06—Oxalic acid
-
- C—CHEMISTRY; METALLURGY
- C07—ORGANIC CHEMISTRY
- C07C—ACYCLIC OR CARBOCYCLIC COMPOUNDS
- C07C55/00—Saturated compounds having more than one carboxyl group bound to acyclic carbon atoms
- C07C55/02—Dicarboxylic acids
- C07C55/14—Adipic acid
-
- C—CHEMISTRY; METALLURGY
- C07—ORGANIC CHEMISTRY
- C07C—ACYCLIC OR CARBOCYCLIC COMPOUNDS
- C07C57/00—Unsaturated compounds having carboxyl groups bound to acyclic carbon atoms
- C07C57/02—Unsaturated compounds having carboxyl groups bound to acyclic carbon atoms with only carbon-to-carbon double bonds as unsaturation
- C07C57/13—Dicarboxylic acids
- C07C57/15—Fumaric acid
-
- C—CHEMISTRY; METALLURGY
- C07—ORGANIC CHEMISTRY
- C07C—ACYCLIC OR CARBOCYCLIC COMPOUNDS
- C07C59/00—Compounds having carboxyl groups bound to acyclic carbon atoms and containing any of the groups OH, O—metal, —CHO, keto, ether, groups, groups, or groups
- C07C59/01—Saturated compounds having only one carboxyl group and containing hydroxy or O-metal groups
- C07C59/06—Glycolic acid
-
- C—CHEMISTRY; METALLURGY
- C07—ORGANIC CHEMISTRY
- C07C—ACYCLIC OR CARBOCYCLIC COMPOUNDS
- C07C59/00—Compounds having carboxyl groups bound to acyclic carbon atoms and containing any of the groups OH, O—metal, —CHO, keto, ether, groups, groups, or groups
- C07C59/235—Saturated compounds containing more than one carboxyl group
- C07C59/245—Saturated compounds containing more than one carboxyl group containing hydroxy or O-metal groups
- C07C59/255—Tartaric acid
-
- C—CHEMISTRY; METALLURGY
- C07—ORGANIC CHEMISTRY
- C07C—ACYCLIC OR CARBOCYCLIC COMPOUNDS
- C07C59/00—Compounds having carboxyl groups bound to acyclic carbon atoms and containing any of the groups OH, O—metal, —CHO, keto, ether, groups, groups, or groups
- C07C59/235—Saturated compounds containing more than one carboxyl group
- C07C59/245—Saturated compounds containing more than one carboxyl group containing hydroxy or O-metal groups
- C07C59/265—Citric acid
-
- C—CHEMISTRY; METALLURGY
- C07—ORGANIC CHEMISTRY
- C07D—HETEROCYCLIC COMPOUNDS
- C07D471/00—Heterocyclic compounds containing nitrogen atoms as the only ring hetero atoms in the condensed system, at least one ring being a six-membered ring with one nitrogen atom, not provided for by groups C07D451/00 - C07D463/00
- C07D471/02—Heterocyclic compounds containing nitrogen atoms as the only ring hetero atoms in the condensed system, at least one ring being a six-membered ring with one nitrogen atom, not provided for by groups C07D451/00 - C07D463/00 in which the condensed system contains two hetero rings
- C07D471/04—Ortho-condensed systems
-
- G—PHYSICS
- G01—MEASURING; TESTING
- G01N—INVESTIGATING OR ANALYSING MATERIALS BY DETERMINING THEIR CHEMICAL OR PHYSICAL PROPERTIES
- G01N23/00—Investigating or analysing materials by the use of wave or particle radiation, e.g. X-rays or neutrons, not covered by groups G01N3/00 – G01N17/00, G01N21/00 or G01N22/00
- G01N23/20—Investigating or analysing materials by the use of wave or particle radiation, e.g. X-rays or neutrons, not covered by groups G01N3/00 – G01N17/00, G01N21/00 or G01N22/00 by using diffraction of the radiation by the materials, e.g. for investigating crystal structure; by using scattering of the radiation by the materials, e.g. for investigating non-crystalline materials; by using reflection of the radiation by the materials
- G01N23/2055—Analysing diffraction patterns
-
- G—PHYSICS
- G01—MEASURING; TESTING
- G01N—INVESTIGATING OR ANALYSING MATERIALS BY DETERMINING THEIR CHEMICAL OR PHYSICAL PROPERTIES
- G01N25/00—Investigating or analyzing materials by the use of thermal means
- G01N25/20—Investigating or analyzing materials by the use of thermal means by investigating the development of heat, i.e. calorimetry, e.g. by measuring specific heat, by measuring thermal conductivity
-
- G—PHYSICS
- G01—MEASURING; TESTING
- G01N—INVESTIGATING OR ANALYSING MATERIALS BY DETERMINING THEIR CHEMICAL OR PHYSICAL PROPERTIES
- G01N30/00—Investigating or analysing materials by separation into components using adsorption, absorption or similar phenomena or using ion-exchange, e.g. chromatography or field flow fractionation
- G01N30/02—Column chromatography
- G01N30/04—Preparation or injection of sample to be analysed
- G01N30/06—Preparation
-
- G—PHYSICS
- G01—MEASURING; TESTING
- G01N—INVESTIGATING OR ANALYSING MATERIALS BY DETERMINING THEIR CHEMICAL OR PHYSICAL PROPERTIES
- G01N30/00—Investigating or analysing materials by separation into components using adsorption, absorption or similar phenomena or using ion-exchange, e.g. chromatography or field flow fractionation
- G01N30/02—Column chromatography
- G01N30/26—Conditioning of the fluid carrier; Flow patterns
- G01N30/28—Control of physical parameters of the fluid carrier
- G01N30/34—Control of physical parameters of the fluid carrier of fluid composition, e.g. gradient
-
- G—PHYSICS
- G01—MEASURING; TESTING
- G01N—INVESTIGATING OR ANALYSING MATERIALS BY DETERMINING THEIR CHEMICAL OR PHYSICAL PROPERTIES
- G01N30/00—Investigating or analysing materials by separation into components using adsorption, absorption or similar phenomena or using ion-exchange, e.g. chromatography or field flow fractionation
- G01N30/02—Column chromatography
- G01N30/62—Detectors specially adapted therefor
- G01N30/74—Optical detectors
-
- G—PHYSICS
- G01—MEASURING; TESTING
- G01N—INVESTIGATING OR ANALYSING MATERIALS BY DETERMINING THEIR CHEMICAL OR PHYSICAL PROPERTIES
- G01N30/00—Investigating or analysing materials by separation into components using adsorption, absorption or similar phenomena or using ion-exchange, e.g. chromatography or field flow fractionation
- G01N30/02—Column chromatography
- G01N30/86—Signal analysis
- G01N30/8675—Evaluation, i.e. decoding of the signal into analytical information
- G01N30/8679—Target compound analysis, i.e. whereby a limited number of peaks is analysed
-
- G—PHYSICS
- G01—MEASURING; TESTING
- G01N—INVESTIGATING OR ANALYSING MATERIALS BY DETERMINING THEIR CHEMICAL OR PHYSICAL PROPERTIES
- G01N30/00—Investigating or analysing materials by separation into components using adsorption, absorption or similar phenomena or using ion-exchange, e.g. chromatography or field flow fractionation
- G01N30/02—Column chromatography
- G01N30/88—Integrated analysis systems specially adapted therefor, not covered by a single one of the groups G01N30/04 - G01N30/86
-
- G—PHYSICS
- G01—MEASURING; TESTING
- G01N—INVESTIGATING OR ANALYSING MATERIALS BY DETERMINING THEIR CHEMICAL OR PHYSICAL PROPERTIES
- G01N5/00—Analysing materials by weighing, e.g. weighing small particles separated from a gas or liquid
- G01N5/04—Analysing materials by weighing, e.g. weighing small particles separated from a gas or liquid by removing a component, e.g. by evaporation, and weighing the remainder
-
- A—HUMAN NECESSITIES
- A61—MEDICAL OR VETERINARY SCIENCE; HYGIENE
- A61K—PREPARATIONS FOR MEDICAL, DENTAL OR TOILETRY PURPOSES
- A61K2300/00—Mixtures or combinations of active ingredients, wherein at least one active ingredient is fully defined in groups A61K31/00 - A61K41/00
-
- C—CHEMISTRY; METALLURGY
- C07—ORGANIC CHEMISTRY
- C07B—GENERAL METHODS OF ORGANIC CHEMISTRY; APPARATUS THEREFOR
- C07B2200/00—Indexing scheme relating to specific properties of organic compounds
- C07B2200/13—Crystalline forms, e.g. polymorphs
-
- G—PHYSICS
- G01—MEASURING; TESTING
- G01N—INVESTIGATING OR ANALYSING MATERIALS BY DETERMINING THEIR CHEMICAL OR PHYSICAL PROPERTIES
- G01N30/00—Investigating or analysing materials by separation into components using adsorption, absorption or similar phenomena or using ion-exchange, e.g. chromatography or field flow fractionation
- G01N30/02—Column chromatography
- G01N2030/022—Column chromatography characterised by the kind of separation mechanism
- G01N2030/027—Liquid chromatography
-
- G—PHYSICS
- G01—MEASURING; TESTING
- G01N—INVESTIGATING OR ANALYSING MATERIALS BY DETERMINING THEIR CHEMICAL OR PHYSICAL PROPERTIES
- G01N30/00—Investigating or analysing materials by separation into components using adsorption, absorption or similar phenomena or using ion-exchange, e.g. chromatography or field flow fractionation
- G01N30/02—Column chromatography
- G01N30/04—Preparation or injection of sample to be analysed
- G01N30/06—Preparation
- G01N2030/062—Preparation extracting sample from raw material
-
- G—PHYSICS
- G01—MEASURING; TESTING
- G01N—INVESTIGATING OR ANALYSING MATERIALS BY DETERMINING THEIR CHEMICAL OR PHYSICAL PROPERTIES
- G01N30/00—Investigating or analysing materials by separation into components using adsorption, absorption or similar phenomena or using ion-exchange, e.g. chromatography or field flow fractionation
- G01N30/02—Column chromatography
- G01N30/88—Integrated analysis systems specially adapted therefor, not covered by a single one of the groups G01N30/04 - G01N30/86
- G01N2030/8809—Integrated analysis systems specially adapted therefor, not covered by a single one of the groups G01N30/04 - G01N30/86 analysis specially adapted for the sample
- G01N2030/884—Integrated analysis systems specially adapted therefor, not covered by a single one of the groups G01N30/04 - G01N30/86 analysis specially adapted for the sample organic compounds
Definitions
- the present disclosure relates to a crystal form of a pyridinopyrimidinone compound, an acid salt thereof, a crystal form of the acid salt thereof, and a use thereof.
- RAS protein is a membrane-bound protein with intrinsic GTPase activity that can be activated by many extracellular stimuli, and cycles between a GDP-bound (off) state and a GTP-bound (on) state. When the RAS protein is in the GTP-bound (on) state, it can activate downstream pathways and promote a series of processes such as cell proliferation, differentiation, migration, and immunity.
- the RAS protein family comprises three highly homologous isoforms: KRAS (Kirsten rat sarcoma virus oncogene), HRAS (Harvey rat sarcoma virus oncogene), and NRAS (Neuroblastoma ras oncogene), and KRAS comprises two variable splice variants: KRAS4A and KRAS4B.
- RAS family proteins have weak endogenous GTPase activity and slow nucleotide exchange rate.
- KRAS-4B mutation is found in approximately 90% of pancreatic cancers, 30% to 40% of colon cancers, and 15% to 20% of lung cancers. Such mutation is also found in biliary tract malignancies, endometrial cancers, cervical cancers, bladder cancers, liver cancers, myeloid leukemia, and breast cancers.
- Point mutation is the most common KRAS gene mutation, with KRAS-G12D (41%), KRAS-G12V (28%), and KRAS-G12C (14%) mutations being common.
- Mutant KRAS affects its ability to bind to GTPase activating protein (GAP), thereby inhibiting GAP-induced GTP hydrolysis. As the hydrolysis ability of GTPase decreases, GTP gradually accumulates, and KRAS is more likely to bind to GTP, such that KRAS is mostly activated, which induces the occurrence and development of malignancies.
- GAP GTPase activating protein
- SOS Ston of Sevenless protein
- SOS protein first identified in Drosophila in 1992, is the GEF of RAS and Rac proteins, and plays an important role in the RAS and Rac signaling pathways.
- SOS1 and SOS2 are highly similar in structure and sequence with 70% homology, but differ in biological function.
- SOS1 protein consists of 1300 amino acid residues with a proline-rich C-terminal domain, which can interact with growth factor receptor-bound protein 2 (Grb2) in the RAS pathway.
- Grb2 binds to SOS1 to form a complex that can bring SOS1 to the vicinity of the cell membrane RAS protein.
- the interaction between SOS1 and RAS involves two domains of SOS1: CDC25 domain and REM domain.
- the CDC25 domain has an active site for nucleotide exchange
- the REM domain contains a site that can bind RAS-GTP and cause allosteric activation of the CDC25 domain.
- SOS1 can convert GDP to GTP through catalytic exchange. GTP is hydrolyzed by RAS, and then activates downstream signals, causing a series of corresponding biological effects.
- Specific SOS1 inhibitors can inhibit the interaction between SOS1 and KRAS-GDP, thereby reducing the formation of activated KRAS-GTP.
- a reduction in KRAS-GTP levels leads to a reduction in downstream MAPK signaling, which plays a role in both wild-type and multiple KRAS mutant types.
- the SOS1 small molecule inhibitor BAY-293 can effectively reduce the activity of mutated KRAS and wild-type KRAS in tumor cells.
- the SOS1 inhibitors BI-3406 and BI-1701963 developed by Boehringer Ingelheim can bind to the catalytic domain of SOS1, prevent its interaction with KRAS, reduce the formation of KRAS-GTP, and inhibit KRAS-driven proliferation of various cancer cells.
- BI-3406 inhibits cytochrome P450 3A4 (CYP3A4) in a time-dependent manner with a potential drug-drug interaction (DDI) risk, so the development of cytochrome P450-free inhibition has the advantage that SOS1 inhibitors without CYP3A4 inhibition are more clinically valuable, and BI-1701963 as well as a combination therapy of BI-1701963 and MEK inhibitor Trametinib has entered clinical research.
- Noonan syndrome is an autosomal dominant genetic disease in which about 20% of NS patients have SOS1 mutations distributed in six domains of SOS1. Patients with SOS1 mutations exhibit phenotypic features of curly hair and abnormal ectoderm. Mutations in the CDC25 domain can directly increase the GEF activity of SOS1 and induce hyperactivation of the RAS/ERK pathway.
- Cardio-facio-cutaneous syndrome is one of renin-angiotensin system (RAS) cardiomyopathy group, and it has been reported that there is a SOS1 mutation in the disease.
- Hereditary gingival fibromatosis type 1 is an autosomal dominant genetic disease whose etiology is associated with mutations in the proline-rich domain of SOS1.
- This compound has been recorded in patent CN202210117751.6 as an inhibitor used as an inhibitor of the interaction of the catalytic site of SOS1 with RAS family proteins involved in the regulation of cellular proliferation, and can be used in the treatment of diseases with excessive or abnormal cellular proliferation.
- polymorphism The phenomenon that a substance can exist in two or more different crystal structures is called polymorphism.
- this polymorphism may affect the absorption of the drug, thereby affecting the bioavailability of the drug, thereby showing different clinical efficacy and toxic side effects.
- the present disclosure provides a crystal form of a compound of formula I, an acid salt thereof, and a crystal form of the acid salt thereof.
- the preparation method for the above crystal form is simple and suitable for industrial production.
- the above crystal form is not easily hygroscopic, and has good stability and solubility, which is of great value to the optimization and development of drugs.
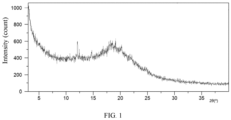
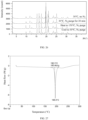
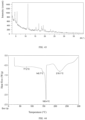
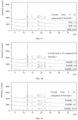
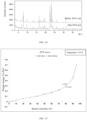
- the present disclosure provides a crystal form A of a compound of formula I, which has an X-ray powder diffraction pattern expressed by 2 ⁇ angles comprising diffraction peaks at: 12.06 ⁇ 0.2°, 14.68 ⁇ 0.2°, 18.13 ⁇ 0.2°, 19.12 ⁇ 0.2°, 20.25 ⁇ 0.2°, 22.09 ⁇ 0.2°, and 24.75 ⁇ 0.2°;
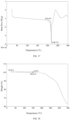
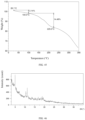
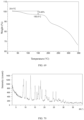
- the crystal form A of the compound of formula I has a thermogravimetric analysis (TGA) pattern with a weight loss when heated from an onset to 120 ⁇ 5°C; preferably, the weight loss is 2% to 4% (such as 3.24%) (the percentage of the weight loss is the percentage of the weight reduction of the sample relative to the weight of the sample prior to this weight loss).
- TGA thermogravimetric analysis
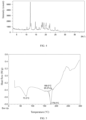
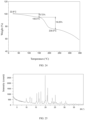
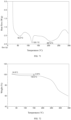
- the crystal form A of the compound of formula I has a differential scanning calorimetry (DSC) pattern, and the differential scanning calorimetry pattern can have major endothermic peaks at 73.3 ⁇ 3°C and/or 178.0 ⁇ 3°C.
- DSC differential scanning calorimetry
- the DSC pattern of the crystal form A of the compound of formula I can further be basically shown in FIG. 5 .
- the TGA pattern of the crystal form A of the compound of formula I can further be basically shown in FIG. 6 .
- the crystal form A of the compound of formula I is a hydrate of the compound of formula I, wherein the compound of formula I and water have a molar ratio of 1:(0.5 to 1.5), preferably 1:(1 to 1.5); such as 1:0.5, 1:0.6, 1:0.7, 1:0.8, 1:0.9, 1:1.0, 1:1, 1:1.1, 1:1.2, 1:1.3, 1:1.4, or 1:1.5; most preferably 1:1 or 1:1.5.
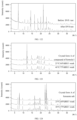
- the present disclosure provides a crystal form B of the compound of formula I, which has an X-ray powder diffraction pattern expressed by 2 ⁇ angles comprising diffraction peaks at: 12.30 ⁇ 0.2°, 12.89 ⁇ 0.2°, 14.49 ⁇ 0.2°, 18.10 ⁇ 0.2°, 18.70 ⁇ 0.2°, 20.33 ⁇ 0.2°, and 21.66 ⁇ 0.2°.
- the crystal form B of the compound of formula I has an X-ray powder diffraction pattern expressed by 2 ⁇ angles comprising diffraction peaks at: 12.30 ⁇ 0.2°, 12.89 ⁇ 0.2°, 14.49 ⁇ 0.2°, 15.32 ⁇ 0.2°, 17.45 ⁇ 0.2°, 18.10 ⁇ 0.2°, 18.70 ⁇ 0.2°, 20.33 ⁇ 0.2°, 21.66 ⁇ 0.2°, 22.01 ⁇ 0.2°, 22.52 ⁇ 0.2°, 23.23 ⁇ 0.2°, 24.35 ⁇ 0.2°, and 24.69 ⁇ 0.2°;
- the present disclosure further provides a pharmaceutically acceptable salt of the compound of formula I;
- the pharmaceutically acceptable salt is a salt formed by the compound of formula I and an acid;
- the acid is hydrochloric acid, sulfuric acid, maleic acid, aspartic acid, phosphoric acid, fumaric acid, tartaric acid, citric acid, glucuronic acid, glycolic acid, malic acid, hippuric acid, gluconic acid, lactic acid, succinic acid, ascorbic acid, adipic acid, p-toluenesulfonic acid, methanesulfonic acid, benzenesulfonic acid, oxalic acid, 2-hydroxyethanesulfonic acid, ethanesulfonic acid, gentisic acid, or benzoic acid.
- the pharmaceutically acceptable salt of the compound of formula I is in crystalline form.
- the acid is fumaric acid, citric acid, methanesulfonic acid, ethanesulfonic acid, maleic acid, L-tartaric acid, glycolic acid, L-malic acid, hippuric acid, succinic acid, ascorbic acid, adipic acid, p-toluenesulfonic acid, benzenesulfonic acid, oxalic acid, or 2-hydroxyethanesulfonic acid.
- the compound of formula I and the acid have a molar ratio of 1:(0.5 to 1.2), such as 1:0.5, 1:0.6, 1:0.7, 1:0.8, 1:0.9, 1:1, 1: 1.1, or 1:1.2.
- the pharmaceutically acceptable salt of the compound of formula I is any one of the following pharmaceutically acceptable salts:
- the present disclosure provides a preparation method for the pharmaceutically acceptable salt of the compound of formula I, comprising: carrying out a salt-forming reaction of the compound of formula I with an acid in a solvent to obtain the pharmaceutically acceptable salt of the compound of formula I; wherein the acid is hydrochloric acid, sulfuric acid, maleic acid, aspartic acid, phosphoric acid, fumaric acid, tartaric acid, citric acid, glucuronic acid, glycolic acid, malic acid, hippuric acid, gluconic acid, lactic acid, succinic acid, ascorbic acid, adipic acid, p -toluenesulfonic acid, methanesulfonic acid, benzenesulfonic acid, oxalic acid, 2-hydroxyethanesulfonic acid, ethanesulfonic acid, gentisic acid, or benzoic acid.
- the acid is hydrochloric acid, sulfuric acid, maleic acid, aspartic acid, phosphoric acid, fumaric acid
- the solvent comprises one or more of water, ethyl acetate, methyl tert -butyl ether, acetone, n -heptane, and isopropanol; preferably one or more of water, ethyl acetate, methyl tert -butyl ether, acetone, and n -heptane.
- the compound of formula I and the acid have a molar ratio of 1:(1 ⁇ 0.5); preferably, 1:(1 ⁇ 0.2) or 1:(1 ⁇ 0.1), for example, 1:1.
- the acid is fumaric acid, citric acid, methanesulfonic acid, ethanesulfonic acid, maleic acid, L-tartaric acid, glycolic acid, L-malic acid, hippuric acid, succinic acid, ascorbic acid, adipic acid, p -toluenesulfonic acid, benzenesulfonic acid, oxalic acid, or 2-hydroxyethanesulfonic acid.
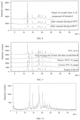
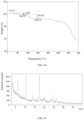
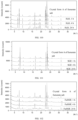
- the present disclosure provides a crystal form A of a fumarate salt of the compound of formula I, which has an X-ray powder diffraction pattern expressed by 2 ⁇ angles comprising diffraction peaks at: 6.86 ⁇ 0.2°, 7.72 ⁇ 0.2°, 16.47 ⁇ 0.2°, 19.20 ⁇ 0.2°, 19.63 ⁇ 0.2°, 22.47 ⁇ 0.2°, and 23.26 ⁇ 0.2°;
- the compound of formula I and fumaric acid have a molar ratio of 1:1.
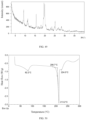
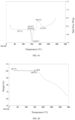
- the crystal form A of the fumarate salt has a thermogravimetric analysis (TGA) pattern with a weight loss of 0% to 5% (such as 3.35%) when heated from an onset to 150 ⁇ 5°C (the percentage of the weight loss is the percentage of the weight reduction of the sample relative to the weight of the sample prior to this weight loss).
- TGA thermogravimetric analysis
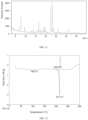
- the crystal form A of the fumarate salt has a differential scanning calorimetry (DSC) pattern, and the differential scanning calorimetry pattern can have a major endothermic peak at 214.7 ⁇ 3°C.
- DSC differential scanning calorimetry
- the DSC pattern of the crystal form A of the fumarate salt can further be basically shown in FIG. 12 .
- the TGA pattern of the crystal form A of the fumarate salt can further be basically shown in FIG. 13 .
- the crystal form A of the fumarate salt is a hydrate of the fumarate salt of the compound of formula I, wherein the compound of formula I and water have a molar ratio of 1:(0.5 to 1.5), preferably 1:(1 to 1.5); such as 1:0.5, 1:0.6, 1:0.7, 1:0.8, 1:0.9, 1:1.0, 1:1, 1:1.1, 1:1.2, 1:1.3, 1:1.4, or 1:1.5; most preferably 1:1 or 1:1.5.
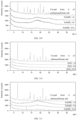
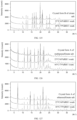
- the present disclosure provides a crystal form B of a fumarate salt of the compound of formula I, which has an X-ray powder diffraction pattern expressed by 2 ⁇ angles comprising diffraction peaks at: 4.78 ⁇ 0.2°, 8.02 ⁇ 0.2°, 9.68 ⁇ 0.2°, 16.57 ⁇ 0.2°, 17.93 ⁇ 0.2°, 18.57 ⁇ 0.2°, and 28.81 ⁇ 0.2°; further, the crystal form B of the fumarate salt has an X-ray powder diffraction pattern expressed by 2 ⁇ angles comprising diffraction peaks at: 4.78 ⁇ 0.2°, 8.02 ⁇ 0.2°, 9.68 ⁇ 0.2°, 11.93 ⁇ 0.2°, 16.57 ⁇ 0.2°, 17.93 ⁇ 0.2°, 18.57 ⁇ 0.2°, 19.41 ⁇ 0.2°, 19.95 ⁇ 0.2°, 21.10 ⁇ 0.2°, and 28.81 ⁇ 0.2°.
- the crystal form B of the fumarate salt has an X-ray powder diffraction pattern expressed by 2 ⁇ angles comprising diffraction peaks at: 4.78 ⁇ 0.2°, 5.98 ⁇ 0.2°, 8.02 ⁇ 0.2°, 9.68 ⁇ 0.2°, 11.93 ⁇ 0.2°, 12.44 ⁇ 0.2°, 12.78 ⁇ 0.2°, 14.01 ⁇ 0.2°, 15.38 ⁇ 0.2°, 15.80 ⁇ 0.2°, 16.57 ⁇ 0.2°, 17.36 ⁇ 0.2°, 17.93 ⁇ 0.2°, 18.57 ⁇ 0.2°, 19.41 ⁇ 0.2°, 19.95 ⁇ 0.2°, 21.10 ⁇ 0.2°, 23.97 ⁇ 0.2°, 24.76 ⁇ 0.2°, 25.74 ⁇ 0.2°, 26.56 ⁇ 0.2°, 28.81 ⁇ 0.2°, and 29.48 ⁇ 0.2°;
- the compound of formula I and fumaric acid have a molar ratio of 1:1.
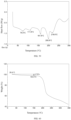
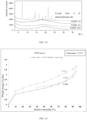
- the crystal form B of the fumarate salt has a thermogravimetric analysis (TGA) pattern with a weight loss of 4% to 6% (such as 5.64%) when heated from an onset to 150 ⁇ 5°C and a weight loss of 5% to 7% (such as 6.76%) when heated from 150 ⁇ 5°C to 250 ⁇ 5°C (the percentage of the weight loss is the percentage of the weight reduction of the sample relative to the weight of the sample prior to this weight loss).
- TGA thermogravimetric analysis
- the crystal form B of the fumarate salt has a differential scanning calorimetry (DSC) pattern, and the differential scanning calorimetry pattern can have a major endothermic peak at 154.4 ⁇ 3°C and an exothermic peak at 191.9 ⁇ 3°C.
- DSC differential scanning calorimetry
- the DSC pattern of the crystal form B of the fumarate salt can further be basically shown in FIG. 17 .
- the TGA pattern of the crystal form B of the fumarate salt can further be basically shown in FIG. 18 .
- the present disclosure provides a crystal form C of a fumarate salt of the compound of formula I, which has an X-ray powder diffraction pattern expressed by 2 ⁇ angles comprising diffraction peaks at: 6.85 ⁇ 0.2°, 8.72 ⁇ 0.2°, 13.13 ⁇ 0.2°, 14.09 ⁇ 0.2°, and 17.27 ⁇ 0.2°; further, the crystal form C of the fumarate salt has an X-ray powder diffraction pattern expressed by 2 ⁇ angles comprising diffraction peaks at: 6.85 ⁇ 0.2°, 8.72 ⁇ 0.2°, 13.13 ⁇ 0.2°, 14.09 ⁇ 0.2°, 17.27 ⁇ 0.2°, 17.90 ⁇ 0.2°, 20.60 ⁇ 0.2°, 21.42 ⁇ 0.2°, 23.16 ⁇ 0.2°, and 24.04 ⁇ 0.2°.
- the crystal form C of the fumarate salt has an X-ray powder diffraction pattern expressed by 2 ⁇ angles comprising diffraction peaks at: 6.85 ⁇ 0.2°, 8.72 + 0.2°, 9.90 ⁇ 0.2°, 12.17 ⁇ 0.2°, 13.13 ⁇ 0.2°, 14.09 ⁇ 0.2°, 14.29 ⁇ 0.2°, 16.33 ⁇ 0.2°, 17.27 ⁇ 0.2°, 17.90 ⁇ 0.2°, 20.60 ⁇ 0.2°, 21.42 ⁇ 0.2°, 23.16 ⁇ 0.2°, and 24.04 ⁇ 0.2°;
- the compound of formula I and fumaric acid have a molar ratio of 1:1.
- the crystal form C of the fumarate salt has a thermogravimetric analysis (TGA) pattern with a weight loss of 1% to 3% (such as 1.69%) when heated from an onset to 150 ⁇ 5°C and a weight loss of 5% to 7% (such as 6.21%) when heated from 150 ⁇ 5°C to 250 ⁇ 5°C (the percentage of the weight loss is the percentage of the weight reduction of the sample relative to the weight of the sample prior to this weight loss).
- TGA thermogravimetric analysis
- the crystal form C of the fumarate salt has a differential scanning calorimetry (DSC) pattern, and the differential scanning calorimetry pattern can have major endothermic peaks at 94.4 ⁇ 3°C, 145.0 ⁇ 3°C, and 161.2 ⁇ 3°C and an exothermic peak at 190.4 ⁇ 3°C.
- DSC differential scanning calorimetry
- the DSC pattern of the crystal form C of the fumarate salt can further be basically shown in FIG. 20 .
- the TGA pattern of the crystal form C of the fumarate salt can further be basically shown in FIG. 21 .
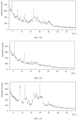
- the present disclosure provides a crystal form A of a citrate salt of the compound of formula I, which has an X-ray powder diffraction pattern expressed by 2 ⁇ angles comprising diffraction peaks at: 6.27 ⁇ 0.2°, 10.79 ⁇ 0.2°, 12.21 ⁇ 0.2°, 12.58 ⁇ 0.2°, 16.38 ⁇ 0.2°, and 25.33 ⁇ 0.2°.
- the crystal form A of the citrate salt has an X-ray powder diffraction pattern expressed by 2 ⁇ angles comprising diffraction peaks at: 6.27 ⁇ 0.2°, 10.79 ⁇ 0.2°, 12.21 ⁇ 0.2°, 12.58 ⁇ 0.2°, 16.38 ⁇ 0.2°, 18.33 ⁇ 0.2°, and 25.33 ⁇ 0.2°;
- the compound of formula I and citric acid have a molar ratio of 1:1.
- the crystal form A of the citrate salt has a thermogravimetric analysis (TGA) pattern with a weight loss of 5% to 7% (such as 5.72%) when heated from an onset to 150 ⁇ 5°C and a weight loss of 18% to 20% (such as 19.25%) when heated from 150 ⁇ 5°C to 230 ⁇ 5°C (the percentage of the weight loss is the percentage of the weight reduction of the sample relative to the weight of the sample prior to this weight loss).
- TGA thermogravimetric analysis
- the crystal form A of the citrate salt has a differential scanning calorimetry (DSC) pattern, and the differential scanning calorimetry pattern can have major endothermic peaks at 99.1 ⁇ 3°C and 137.9 ⁇ 3°C.
- DSC differential scanning calorimetry
- the DSC pattern of the crystal form A of the citrate salt can further be basically shown in FIG. 23 .
- the TGA pattern of the crystal form A of the citrate salt can further be basically shown in FIG. 24 .
- the present disclosure provides a crystal form B of a citrate salt of the compound of formula I, which has an X-ray powder diffraction pattern expressed by 2 ⁇ angles comprising diffraction peaks at: 11.93 ⁇ 0.2°, 15.45 ⁇ 0.2°, 16.45 ⁇ 0.2°, 17.60 ⁇ 0.2°, 19.86 ⁇ 0.2°, and 21.18 ⁇ 0.2°, or comprising diffraction peaks at: 9.91 ⁇ 0.2°, 12.79 ⁇ 0.2°, 16.45 ⁇ 0.2°, 17.60 ⁇ 0.2°, and 20.88 ⁇ 0.2°; further, the crystal form B of the citrate salt has an X-ray powder diffraction pattern expressed by 2 ⁇ angles comprising diffraction peaks at: 11.93 ⁇ 0.2°, 12.79 ⁇ 0.2°, 15.45 ⁇ 0.2°, 16.45 ⁇ 0.2°, 17.60 ⁇ 0.2°, 19.86 ⁇ 0.2°, 20.88 ⁇ 0.2°, 21.18 ⁇
- the crystal form B of the citrate salt has an X-ray powder diffraction pattern expressed by 2 ⁇ angles, which can comprise diffraction peaks at one or more of the following 2 ⁇ angles: 9.90 ⁇ 0.2°, 11.93 ⁇ 0.2°, 12.79 ⁇ 0.2°, 15.45 ⁇ 0.2°, 16.45 ⁇ 0.2°, 17.60 ⁇ 0.2°, 18.25 ⁇ 0.2°, 19.34 ⁇ 0.2°, 19.86 ⁇ 0.2°, 20.88 ⁇ 0.2°, 21.18 ⁇ 0.2°, 23.55 ⁇ 0.2°, 25.19 ⁇ 0.2°, 27.72 ⁇ 0.2°, 28.47 ⁇ 0.2°, 29.97 ⁇ 0.2°, 30.65 ⁇ 0.2°, and 31.19 ⁇ 0.2°;
- the compound of formula I and citric acid have a molar ratio of 1:1.
- the crystal form B of the citrate salt has a thermogravimetric analysis (TGA) pattern with a weight loss of 0% to 2% (such as 1.26%) when heated from an onset to 150 ⁇ 5°C (the percentage of the weight loss is the percentage of the weight reduction of the sample relative to the weight of the sample prior to this weight loss).
- TGA thermogravimetric analysis
- the crystal form B of the citrate salt has a differential scanning calorimetry (DSC) pattern, and the differential scanning calorimetry pattern can have a major endothermic peak at 195.0 ⁇ 3°C.
- DSC differential scanning calorimetry
- the DSC pattern of the crystal form B of the citrate salt can further be basically shown in FIG. 27 .
- the TGA pattern of the crystal form B of the citrate salt can further be basically shown in FIG. 28 .
- the present disclosure provides a crystal form A of a methanesulfonate salt of the compound of formula I, which has an X-ray powder diffraction pattern expressed by 2 ⁇ angles comprising diffraction peaks at: 7.28 ⁇ 0.2°, 10.86 ⁇ 0.2°, 12.71 ⁇ 0.2°, 14.20 ⁇ 0.2°, 14.58 ⁇ 0.2°, 16.67 ⁇ 0.2°, 18.70 ⁇ 0.2°, and 19.96 ⁇ 0.2°;
- the compound of formula I and methanesulfonic acid have a molar ratio of 1:1.
- the crystal form A of the methanesulfonate salt has a thermogravimetric analysis (TGA) pattern with a weight loss of 0% to 5% (such as 2.14%) when heated from an onset to 150 ⁇ 5°C (the percentage of the weight loss is the percentage of the weight reduction of the sample relative to the weight of the sample prior to this weight loss).
- TGA thermogravimetric analysis
- the crystal form A of the methanesulfonate salt has a differential scanning calorimetry (DSC) pattern with a major endothermic peak at 206.0 ⁇ 3°C.
- the DSC pattern of the crystal form A of the methanesulfonate salt can further be basically shown in FIG. 31 .
- the TGA pattern of the crystal form A of the methanesulfonate salt can further be basically shown in FIG. 32 .
- the present disclosure provides a crystal form A of an ethanesulfonate salt of the compound of formula I, which has an X-ray powder diffraction pattern expressed by 2 ⁇ angles comprising diffraction peaks at: 7.13 ⁇ 0.2°, 10.80 ⁇ 0.2°, 12.60 ⁇ 0.2°, 14.26 ⁇ 0.2°, 16.43 ⁇ 0.2°, 18.28 ⁇ 0.2°, 19.95 ⁇ 0.2°, 21.45 ⁇ 0.2°, and 23.26 ⁇ 0.2°;
- the compound of formula I and ethanesulfonic acid have a molar ratio of 1:1.
- the crystal form A of the ethanesulfonate salt of the compound of formula I has a thermogravimetric analysis (TGA) pattern with a weight loss of 0% to 5% (such as 0.87%) when heated from an onset to 150 ⁇ 5°C (the percentage of the weight loss is the percentage of the weight reduction of the sample relative to the weight of the sample prior to this weight loss).
- TGA thermogravimetric analysis
- the crystal form A of the ethanesulfonate salt of the compound of formula I has a differential scanning calorimetry (DSC) pattern, and the differential scanning calorimetry pattern can have a major endothermic peak at 218.7 ⁇ 3°C.
- the DSC pattern of the crystal form A of the ethanesulfonate salt of the compound of formula I can further be basically shown in FIG. 37 .
- the TGA pattern of the crystal form A of the ethanesulfonate salt of the compound of formula I can further be basically shown in FIG. 38 .
- the present disclosure provides a crystal form B of an ethanesulfonate salt of the compound of formula I, which has an X-ray powder diffraction pattern expressed by 2 ⁇ angles comprising diffraction peaks at: 6.92 ⁇ 0.2°, 9.86 ⁇ 0.2°, 19.20 ⁇ 0.2°, 20.10 ⁇ 0.2°, 21.38 ⁇ 0.2°, 25.27 ⁇ 0.2°, and 29.85 ⁇ 0.2°;
- the compound of formula I and ethanesulfonic acid have a molar ratio of 1:1.
- the crystal form B of the ethanesulfonate salt has a thermogravimetric analysis (TGA) pattern with a weight loss of 1% to 3% (such as 2.17%) when heated from an onset to 150 ⁇ 5°C (the percentage of the weight loss is the percentage of the weight reduction of the sample relative to the weight of the sample prior to this weight loss).
- TGA thermogravimetric analysis
- the crystal form B of the ethanesulfonate salt has a differential scanning calorimetry (DSC) pattern, and the differential scanning calorimetry pattern can have major endothermic peaks at 156.8 ⁇ 3°C and 211.9 ⁇ 3°C.
- DSC differential scanning calorimetry
- the DSC pattern of the crystal form B of the ethanesulfonate salt can further be basically shown in FIG. 41 .
- the TGA pattern of the crystal form B of the ethanesulfonate salt can further be basically shown in FIG. 42 .
- the present disclosure provides a crystal form A of a maleate salt of the compound of formula I, which has an X-ray powder diffraction pattern expressed by 2 ⁇ angles comprising diffraction peaks at: 4.46 ⁇ 0.2°, 5.61 ⁇ 0.2°, 11.23 ⁇ 0.2°, 16.86 ⁇ 0.2°, 18.30 ⁇ 0.2°, 19.20 ⁇ 0.2°, and 19.91 ⁇ 0.2°; further, the crystal form A of the maleate salt has an X-ray powder diffraction pattern expressed by 2 ⁇ angles comprising diffraction peaks at: 4.46 ⁇ 0.2°, 5.61 ⁇ 0.2°, 11.23 ⁇ 0.2°, 15.38 ⁇ 0.2°, 16.86 ⁇ 0.2°, 18.30 ⁇ 0.2°, 19.20 ⁇ 0.2°, 19.91 ⁇ 0.2°, 20.42 ⁇ 0.2°, and 23.00 ⁇ 0.2°.
- the crystal form A of the maleate salt has an X-ray powder diffraction pattern expressed by 2 ⁇ angles comprising diffraction peaks at: 4.46 ⁇ 0.2°, 5.61 ⁇ 0.2°, 11.23 ⁇ 0.2°, 11.86 ⁇ 0.2°, 15.38 ⁇ 0.2°, 16.86 ⁇ 0.2°, 18.30 ⁇ 0.2°, 19.20 ⁇ 0.2°, 19.91 ⁇ 0.2°, 20.42 ⁇ 0.2°, 23.00 ⁇ 0.2°, and 24.26 ⁇ 0.2°;
- the compound of formula I and maleic acid have a molar ratio of 1:1.
- the crystal form A of the maleate salt has a thermogravimetric analysis (TGA) pattern with a weight loss of 2% to 4% (such as 3.14%) when heated from an onset to 100 ⁇ 5°C and a weight loss of 14% to 16% (such as 14.49%) when heated from 100 ⁇ 5°C to 225 ⁇ 5°C (the percentage of the weight loss is the percentage of the weight reduction of the sample relative to the weight of the sample prior to this weight loss).
- TGA thermogravimetric analysis
- the crystal form A of the maleate salt has a differential scanning calorimetry (DSC) pattern, and the differential scanning calorimetry pattern can have major endothermic peaks at 160.4 ⁇ 3°C and 219.1 ⁇ 3°C.
- DSC differential scanning calorimetry
- the DSC pattern of the crystal form A of the maleate salt can further be basically shown in FIG. 44 .
- the TGA pattern of the crystal form A of the maleate salt can further be basically shown in FIG. 45 .
- the present disclosure provides a crystal form B of a maleate salt of the compound of formula I, which has an X-ray powder diffraction pattern expressed by 2 ⁇ angles comprising diffraction peaks at: 4.99 ⁇ 0.2°, 10.46 ⁇ 0.2°, 11.21 ⁇ 0.2°, 16.82 ⁇ 0.2°, 18.30 ⁇ 0.2°, 18.92 ⁇ 0.2°, and 19.50 ⁇ 0.2°; further, the crystal form B of the maleate salt has an X-ray powder diffraction pattern expressed by 2 ⁇ angles comprising diffraction peaks at: 4.99 ⁇ 0.2°, 6.99 ⁇ 0.2°, 10.46 ⁇ 0.2°, 11.21 ⁇ 0.2°, 15.02 ⁇ 0.2°, 15.60 ⁇ 0.2°, 16.82 ⁇ 0.2°, 18.30 ⁇ 0.2°, 18.92 ⁇ 0.2°, and 19.50 ⁇ 0.2°.
- the crystal form B of the maleate salt has an X-ray powder diffraction pattern expressed by 2 ⁇ angles, and diffraction peaks and relative intensities of the X-ray powder diffraction pattern can further be shown in Table 20; the X-ray powder diffraction pattern of the crystal form B of the maleate salt expressed by 2 ⁇ angles can further be basically shown in FIG. 46 .
- the compound of formula I and maleic acid have a molar ratio of 1:1.
- the crystal form B of the maleate salt has a thermogravimetric analysis (TGA) pattern with a weight loss of 2% to 4% (such as 2.84%) when heated from an onset to 100 ⁇ 5°C and a weight loss of 11% to 13% (such as 12.43%) when heated from 100 ⁇ 5°C to 225 ⁇ 5°C (the percentage of the weight loss is the percentage of the weight reduction of the sample relative to the weight of the sample prior to this weight loss).
- TGA thermogravimetric analysis
- the crystal form B of the maleate salt has a differential scanning calorimetry (DSC) pattern, and the differential scanning calorimetry pattern can have major endothermic peaks at 152.9 ⁇ 3°C and 220.7 ⁇ 3°C.
- DSC differential scanning calorimetry
- the DSC pattern of the crystal form B of the maleate salt can further be basically shown in FIG. 47 .
- the TGA pattern of the crystal form B of the maleate salt can further be basically shown in FIG. 48 .
- the present disclosure provides a crystal form A of an L-tartrate salt of the compound of formula I, which has an X-ray powder diffraction pattern expressed by 2 ⁇ angles comprising diffraction peaks at: 9.28 ⁇ 0.2°, 11.38 ⁇ 0.2°, 15.62 ⁇ 0.2°, 19.54 ⁇ 0.2°, 19.89 ⁇ 0.2°, and 25.21 ⁇ 0.2°.
- the crystal form A of the L-tartrate salt has an X-ray powder diffraction pattern expressed by 2 ⁇ angles comprising diffraction peaks at: 9.28 ⁇ 0.2°, 11.38 ⁇ 0.2°, 12.97 ⁇ 0.2°, 15.62 ⁇ 0.2°, 16.95 ⁇ 0.2°, 18.07 ⁇ 0.2°, 19.54 ⁇ 0.2°, 19.89 ⁇ 0.2°, 22.94 ⁇ 0.2°, 23.51 ⁇ 0.2°, 25.21 ⁇ 0.2°, 26.92 ⁇ 0.2°, and 28.46 ⁇ 0.2°;
- the compound of formula I and L-tartaric acid have a molar ratio of 1:1.
- the crystal form A of the L-tartrate salt has a thermogravimetric analysis (TGA) pattern with a weight loss of 2% to 4% (such as 3.18%) when heated from an onset to 150 ⁇ 5°C (the percentage of the weight loss is the percentage of the weight reduction of the sample relative to the weight of the sample prior to this weight loss).
- TGA thermogravimetric analysis
- the crystal form A of the L-tartrate salt has a differential scanning calorimetry (DSC) pattern, and the differential scanning calorimetry pattern can have major endothermic peaks at 82.2 ⁇ 3°C and 213.2 ⁇ 3°C.
- DSC differential scanning calorimetry
- the DSC pattern of the crystal form A of the L-tartrate salt can further be basically shown in FIG. 50 .
- the TGA pattern of the crystal form A of the L-tartrate salt can further be basically shown in FIG. 51 .
- the present disclosure provides a crystal form B of an L-tartrate salt of the compound of formula I, which has an X-ray powder diffraction pattern expressed by 2 ⁇ angles comprising diffraction peaks at: 4.22 ⁇ 0.2°, 5.17 ⁇ 0.2°, 5.77 ⁇ 0.2°, 8.65 ⁇ 0.2°, 11.51 ⁇ 0.2°, 14.08 ⁇ 0.2°, 16.59 ⁇ 0.2°, 17.29 ⁇ 0.2°, and 23.11 ⁇ 0.2°;
- the compound of formula I and L-tartaric acid have a molar ratio of 1:1.
- the crystal form B of the L-tartrate salt has a thermogravimetric analysis (TGA) pattern with a weight loss of 5% to 7% (such as 5.57%) when heated from an onset to 180 ⁇ 5°C (the percentage of the weight loss is the percentage of the weight reduction of the sample relative to the weight of the sample prior to this weight loss).
- TGA thermogravimetric analysis
- the crystal form B of the L-tartrate salt has a differential scanning calorimetry (DSC) pattern, and the differential scanning calorimetry pattern can have major endothermic peaks at 114.5 ⁇ 3°C, 160.5 ⁇ 3°C, 193.2 ⁇ 3°C, and 219.5 ⁇ 3°C.
- DSC differential scanning calorimetry
- the DSC pattern of the crystal form B of the L-tartrate salt can further be basically shown in FIG. 53 .
- the TGA pattern of the crystal form B of the L-tartrate salt can further be basically shown in FIG. 54 .
- the present disclosure provides a crystal form C of an L-tartrate salt of the compound of formula I, which has an X-ray powder diffraction pattern expressed by 2 ⁇ angles comprising diffraction peaks at: 5.77 ⁇ 0.2°, 11.54 ⁇ 0.2°, 16.50 ⁇ 0.2°, 17.33 ⁇ 0.2°, 18.46 ⁇ 0.2°, 19.80 ⁇ 0.2°, and 24.85 ⁇ 0.2°; further, the crystal form C of the L-tartrate salt has an X-ray powder diffraction pattern expressed by 2 ⁇ angles comprising diffraction peaks at: 4.60 ⁇ 0.2°, 5.77 ⁇ 0.2°, 11.54 ⁇ 0.2°, 14.06 ⁇ 0.2°, 16.50 ⁇ 0.2°, 17.33 ⁇ 0.2°, 18.46 ⁇ 0.2°, 19.80 ⁇ 0.2°, 21.91 ⁇ 0.2°, 23.16 ⁇ 0.2°, 24.85 ⁇ 0.2°, and 25.27 ⁇ 0.2°.
- the crystal form C of the L-tartrate salt has an X-ray powder diffraction pattern expressed by 2 ⁇ angles comprising diffraction peaks at: 4.60 ⁇ 0.2°, 5.77 ⁇ 0.2°, 9.20 ⁇ 0.2°, 11.54 ⁇ 0.2°, 12.07 ⁇ 0.2°, 12.56 ⁇ 0.2°, 14.06 ⁇ 0.2°, 14.68 ⁇ 0.2°, 16.50 ⁇ 0.2°, 17.33 ⁇ 0.2°, 18.46 ⁇ 0.2°, 19.10 ⁇ 0.2°, 19.80 ⁇ 0.2°, 20.56 ⁇ 0.2°, 21.91 ⁇ 0.2°, 23.16 ⁇ 0.2°, 24.16 ⁇ 0.2°, 24.85 ⁇ 0.2°, and 25.27 ⁇ 0.2°;
- the compound of formula I and L-tartaric acid have a molar ratio of 1:0.5.
- the crystal form C of the L-tartrate salt has a thermogravimetric analysis (TGA) pattern with a weight loss of 2% to 4% (such as 3.16%) when heated from an onset to 150 ⁇ 5°C (the percentage of the weight loss is the percentage of the weight reduction of the sample relative to the weight of the sample prior to this weight loss).
- TGA thermogravimetric analysis
- the crystal form C of the L-tartrate salt has a differential scanning calorimetry (DSC) pattern, and the differential scanning calorimetry pattern can have major endothermic peaks at 128.5 ⁇ 3°C, 157.1 ⁇ 3°C, and 220.5 ⁇ 3°C.
- DSC differential scanning calorimetry
- the DSC pattern of the crystal form C of the L-tartrate salt can further be basically shown in FIG. 56 .
- the TGA pattern of the crystal form C of the L-tartrate salt can further be basically shown in FIG. 57 .
- the present disclosure provides a crystal form D of an L-tartrate salt of the compound of formula I, which has an X-ray powder diffraction pattern expressed by 2 ⁇ angles comprising diffraction peaks at: 5.80 ⁇ 0.2°, 11.56 ⁇ 0.2°, 15.74 ⁇ 0.2°, 16.50 ⁇ 0.2°, 17.38 ⁇ 0.2°, 19.63 ⁇ 0.2°, 23.23 ⁇ 0.2°, 23.64 ⁇ 0.2°, 24.86 ⁇ 0.2°, and 25.28 ⁇ 0.2°;
- the compound of formula I and L-tartaric acid have a molar ratio of 1:1.
- the crystal form D of the L-tartrate salt has a thermogravimetric analysis (TGA) pattern with a weight loss of 2% to 4% (such as 2.72%) when heated from an onset to 150 ⁇ 5°C (the percentage of the weight loss is the percentage of the weight reduction of the sample relative to the weight of the sample prior to this weight loss).
- TGA thermogravimetric analysis
- the crystal form D of the L-tartrate salt has a differential scanning calorimetry (DSC) pattern, and the differential scanning calorimetry pattern can have major endothermic peaks at 75.0 ⁇ 3°C, 111.6 ⁇ 3°C, 161.9 ⁇ 3°C, 200.9 ⁇ 3°C, and 218.8 ⁇ 3°C.
- DSC differential scanning calorimetry
- the DSC pattern of the crystal form D of the L-tartrate salt can further be basically shown in FIG. 59 .
- the TGA pattern of the crystal form D of the L-tartrate salt can further be basically shown in FIG. 60 .
- the present disclosure provides a crystal form A of a glycolate salt of the compound of formula I, which has an X-ray powder diffraction pattern expressed by 2 ⁇ angles comprising diffraction peaks at: 5.90 ⁇ 0.2°, 7.21 ⁇ 0.2°, 7.80 ⁇ 0.2°, 11.42 ⁇ 0.2°, 11.79 ⁇ 0.2°, 17.72 ⁇ 0.2°, 19.80 ⁇ 0.2°, 23.10 ⁇ 0.2°, and 23.71 ⁇ 0.2°; further, the crystal form A of the glycolate salt has an X-ray powder diffraction pattern expressed by 2 ⁇ angles comprising diffraction peaks at: 5.90 ⁇ 0.2°, 7.21 ⁇ 0.2°, 7.80 ⁇ 0.2°, 11.42 ⁇ 0.2°, 11.79 ⁇ 0.2°, 13.24 ⁇ 0.2°, 14.74 ⁇ 0.2°, 16.45 ⁇ 0.2°, 17.72 ⁇ 0.2°, 18.65 ⁇ 0.2°, 19.80 ⁇ 0.2°, 20.54
- the crystal form A of the glycolate salt has an X-ray powder diffraction pattern expressed by 2 ⁇ angles comprising diffraction peaks at: 5.90 ⁇ 0.2°, 7.21 ⁇ 0.2°, 7.80 ⁇ 0.2°, 8.83 ⁇ 0.2°, 9.34 ⁇ 0.2°, 11.03 ⁇ 0.2°, 11.42 ⁇ 0.2°, 11.79 ⁇ 0.2°, 12.18 ⁇ 0.2°, 13.24 ⁇ 0.2°, 13.49 ⁇ 0.2°, 14.43 ⁇ 0.2°, 14.74 ⁇ 0.2°, 15.60 ⁇ 0.2°, 15.86 ⁇ 0.2°, 16.16 ⁇ 0.2°, 16.45 ⁇ 0.2°, 16.98 ⁇ 0.2°, 17.72 ⁇ 0.2°, 18.65 ⁇ 0.2°, 19.80 ⁇ 0.2°, 20.54 ⁇ 0.2°, 21.96 ⁇ 0.2°, 23.10 ⁇ 0.2°, and 23.71 ⁇ 0.2°;
- the compound of formula I and glycolic acid have a molar ratio of 1:1.
- the crystal form A of the glycolate salt has a thermogravimetric analysis (TGA) pattern with a weight loss of 2% to 4% (such as 3.40%) when heated from an onset to 150 ⁇ 5°C (the percentage of the weight loss is the percentage of the weight reduction of the sample relative to the weight of the sample prior to this weight loss).
- TGA thermogravimetric analysis
- the crystal form A of the glycolate salt has a differential scanning calorimetry (DSC) pattern, and the differential scanning calorimetry pattern can have a major endothermic peak at 110.1 ⁇ 3°C.
- DSC differential scanning calorimetry
- the DSC pattern of the crystal form A of the glycolate salt can further be basically shown in FIG. 62 .
- the TGA pattern of the crystal form A of the glycolate salt can further be basically shown in FIG. 63 .
- the present disclosure provides a crystal form A of an L-malate salt of the compound of formula I, which has an X-ray powder diffraction pattern expressed by 2 ⁇ angles comprising diffraction peaks at: 5.92 ⁇ 0.2°, 11.82 ⁇ 0.2°, 16.56 ⁇ 0.2°, 17.68 ⁇ 0.2°, 21.97 ⁇ 0.2°, and 23.75 ⁇ 0.2°; further, the crystal form A of the L-malate salt has an X-ray powder diffraction pattern expressed by 2 ⁇ angles comprising diffraction peaks at: 5.92 ⁇ 0.2°, 7.54 ⁇ 0.2°, 8.32 ⁇ 0.2°, 8.76 ⁇ 0.2°, 11.82 ⁇ 0.2°, 16.56 ⁇ 0.2°, 17.68 ⁇ 0.2°, 18.71 ⁇ 0.2°, 19.69 ⁇ 0.2°, 21.97 ⁇ 0.2°, and 23.75 ⁇ 0.2°.
- the crystal form A of the L-malate salt has an X-ray powder diffraction pattern expressed by 2 ⁇ angles comprising diffraction peaks at: 5.92 ⁇ 0.2°, 7.54 ⁇ 0.2°, 8.32 ⁇ 0.2°, 8.76 ⁇ 0.2°, 10.35 ⁇ 0.2°, 11.82 ⁇ 0.2°, 12.40 ⁇ 0.2°, 14.10 ⁇ 0.2°, 16.56 ⁇ 0.2°, 17.68 ⁇ 0.2°, 18.71 ⁇ 0.2°, 19.69 ⁇ 0.2°, 20.81 ⁇ 0.2°, 21.97 ⁇ 0.2°, and 23.75 ⁇ 0.2°;
- the compound of formula I and L-malic acid have a molar ratio of 1:1.
- the crystal form A of the L-malate salt has a thermogravimetric analysis (TGA) pattern with a weight loss of 2% to 4% (such as 2.88%) when heated from an onset to 50 ⁇ 5°C, a weight loss of 1% to 3% (such as 2.46%) when heated from 50 ⁇ 5°C to 100 ⁇ 5°C, and a weight loss of 0% to 2% (such as 1.31%) when heated from 100 ⁇ 5°C to 150 ⁇ 5°C (the percentage of the weight loss is the percentage of the weight reduction of the sample relative to the weight of the sample prior to this weight loss).
- TGA thermogravimetric analysis
- the crystal form A of the L-malate salt has a differential scanning calorimetry (DSC) pattern, and the differential scanning calorimetry pattern can have major endothermic peaks at 72.9 ⁇ 3°C, 122.2 ⁇ 3°C, 142.1 ⁇ 3°C, and 222.4 ⁇ 3°C and an exothermic peak at 195.9 ⁇ 3°C.
- DSC differential scanning calorimetry
- the DSC pattern of the crystal form A of the L-malate salt can further be basically shown in FIG. 65 .
- the TGA pattern of the crystal form A of the L-malate salt can further be basically shown in FIG. 66 .
- the present disclosure provides a crystal form B of an L-malate salt of the compound of formula I, which has an X-ray powder diffraction pattern expressed by 2 ⁇ angles comprising diffraction peaks at: 6.69 ⁇ 0.2°, 8.99 ⁇ 0.2°, 9.30 ⁇ 0.2°, 13.38 ⁇ 0.2°, 17.00 ⁇ 0.2°, 18.71 ⁇ 0.2°, 21.18 ⁇ 0.2°, and 26.89 ⁇ 0.2°.
- the crystal form B of the L-malate salt has an X-ray powder diffraction pattern expressed by 2 ⁇ angles comprising diffraction peaks at: 6.69 ⁇ 0.2°, 8.99 ⁇ 0.2°, 9.30 ⁇ 0.2°, 10.69 ⁇ 0.2°, 10.97 ⁇ 0.2°, 11.29 ⁇ 0.2°, 12.77 ⁇ 0.2°, 13.02 ⁇ 0.2°, 13.38 ⁇ 0.2°, 14.64 ⁇ 0.2°, 14.89 ⁇ 0.2°, 15.89 ⁇ 0.2°, 17.00 ⁇ 0.2°, 17.55 ⁇ 0.2°, 18.27 ⁇ 0.2°, 18.71 ⁇ 0.2°, 20.70 ⁇ 0.2°, 21.18 ⁇ 0.2°, 21.71 ⁇ 0.2°, and 26.89 ⁇ 0.2°;
- the compound of formula I and L-malic acid have a molar ratio of 1:1.
- the crystal form B of the L-malate salt has a thermogravimetric analysis (TGA) pattern with a weight loss of 2% to 4% (such as 3.40%) when heated from an onset to 150 ⁇ 5°C (the percentage of the weight loss is the percentage of the weight reduction of the sample relative to the weight of the sample prior to this weight loss).
- TGA thermogravimetric analysis
- the crystal form B of the L-malate salt has a differential scanning calorimetry (DSC) pattern, and the differential scanning calorimetry pattern can have a major endothermic peak at 134.8 ⁇ 3°C.
- DSC differential scanning calorimetry
- the DSC pattern of the crystal form B of the L-malate salt can further be basically shown in FIG. 68 .
- the TGA pattern of the crystal form B of the L-malate salt can further be basically shown in FIG. 69 .
- the present disclosure provides a crystal form A of a hippurate salt of the compound of formula I, which has an X-ray powder diffraction pattern expressed by 2 ⁇ angles comprising diffraction peaks at: 9.10 ⁇ 0.2°, 10.41 ⁇ 0.2°, 12.69 ⁇ 0.2°, 15.00 ⁇ 0.2°, 15.22 ⁇ 0.2°, 16.93 ⁇ 0.2°, 18.00 ⁇ 0.2°, 18.71 ⁇ 0.2°, 24.53 ⁇ 0.2°, and 26.00 ⁇ 0.2°; further, the crystal form A of the hippurate salt has an X-ray powder diffraction pattern expressed by 2 ⁇ angles comprising diffraction peaks at: 9.10 ⁇ 0.2°, 10.41 ⁇ 0.2°, 12.69 ⁇ 0.2°, 12.91 ⁇ 0.2°, 15.00 ⁇ 0.2°, 15.22 ⁇ 0.2°, 16.02 ⁇ 0.2°, 16.57 ⁇ 0.2°, 16.93 ⁇ 0.2°, 17.69 ⁇ 0.2°, 18.00
- the crystal form A of the hippurate salt has an X-ray powder diffraction pattern expressed by 2 ⁇ angles comprising diffraction peaks at: 8.78 ⁇ 0.2°, 9.10 ⁇ 0.2°, 10.41 ⁇ 0.2°, 12.69 ⁇ 0.2°, 12.91 ⁇ 0.2°, 15.00 ⁇ 0.2°, 15.22 ⁇ 0.2°, 16.02 ⁇ 0.2°, 16.57 ⁇ 0.2°, 16.93 ⁇ 0.2°, 17.69 ⁇ 0.2°, 18.00 ⁇ 0.2°, 18.71 ⁇ 0.2°, 20.40 ⁇ 0.2°, 20.65 ⁇ 0.2°, 20.89 ⁇ 0.2°, 21.27 ⁇ 0.2°, 22.33 ⁇ 0.2°, 24.53 ⁇ 0.2°, 24.87 ⁇ 0.2°, 25.50 ⁇ 0.2°, 26.00 ⁇ 0.2°, 26.14 ⁇ 0.2°, 27.64 ⁇ 0.2°, 28.43 ⁇ 0.2°, 29.31 ⁇
- the crystal form A of the hippurate salt has an X-ray powder diffraction pattern expressed by 2 ⁇ angles, and diffraction peaks and relative intensities of the X-ray powder diffraction pattern can further be shown in Table 28; the X-ray powder diffraction pattern of the crystal form A of the hippurate salt expressed by 2 ⁇ angles can further be basically shown in FIG. 70 .
- the compound of formula I and hippuric acid have a molar ratio of 1:1.
- the crystal form A of the hippurate salt has a thermogravimetric analysis (TGA) pattern with a weight loss of 2% to 4% (such as 3.04%) when heated from an onset to 150 ⁇ 5°C (the percentage of the weight loss is the percentage of the weight reduction of the sample relative to the weight of the sample prior to this weight loss).
- TGA thermogravimetric analysis
- the crystal form A of the hippurate salt has a differential scanning calorimetry (DSC) pattern, and the differential scanning calorimetry pattern can have major endothermic peaks at 62.4 ⁇ 3°C, 120.1 ⁇ 3°C, and 207.0 ⁇ 3°C.
- DSC differential scanning calorimetry
- the DSC pattern of the crystal form A of the hippurate salt can further be basically shown in FIG. 71 .
- the TGA pattern of the crystal form A of the hippurate salt can further be basically shown in FIG. 72 .
- the present disclosure provides a crystal form A of a succinate salt of the compound of formula I, which has an X-ray powder diffraction pattern expressed by 2 ⁇ angles comprising diffraction peaks at: 4.72 ⁇ 0.2°, 5.83 ⁇ 0.2°, 7.87 ⁇ 0.2°, 9.34 ⁇ 0.2°, 11.71 ⁇ 0.2°, 12.39 ⁇ 0.2°, 16.67 ⁇ 0.2°, 17.58 ⁇ 0.2°, 19.99 ⁇ 0.2°, 21.89 ⁇ 0.2°, 23.57 ⁇ 0.2°, and 25.40 ⁇ 0.2°.
- the crystal form A of the succinate salt has an X-ray powder diffraction pattern expressed by 2 ⁇ angles, and diffraction peaks and relative intensities of the X-ray powder diffraction pattern can further be shown in Table 29.
- the X-ray powder diffraction pattern of the crystal form A of the succinate salt expressed by 2 ⁇ angles can further be basically shown in FIG. 128 .
- the compound of formula I and succinic acid have a molar ratio of 1:1.
- the crystal form A of the succinate salt has a thermogravimetric analysis (TGA) pattern with a weight loss of 3% to 5% (such as 3.94%) when heated from an onset to 150 ⁇ 5°C (the percentage of the weight loss is the percentage of the weight reduction of the sample relative to the weight of the sample prior to this weight loss).
- TGA thermogravimetric analysis
- the crystal form A of the succinate salt has a differential scanning calorimetry (DSC) pattern, and the differential scanning calorimetry pattern can have major endothermic peaks at 70.0 ⁇ 3°C, 124.1 ⁇ 3°C, and 221.0 ⁇ 3°C.
- DSC differential scanning calorimetry
- the DSC pattern of the crystal form A of the succinate salt can further be basically shown in FIG. 73 .
- the TGA pattern of the crystal form A of the succinate salt can further be basically shown in FIG. 74 .
- the present disclosure provides a crystal form B of a succinate salt of the compound of formula I, which has an X-ray powder diffraction pattern expressed by 2 ⁇ angles comprising diffraction peaks at: 5.70 ⁇ 0.2°, 9.24 ⁇ 0.2°, 11.42 ⁇ 0.2°, 13.55 ⁇ 0.2°, 17.17 ⁇ 0.2°, and 22.95 ⁇ 0.2°;
- the compound of formula I and succinic acid have a molar ratio of 1:1.
- the crystal form B of the succinate salt has a thermogravimetric analysis (TGA) pattern with a weight loss of 3% to 5% (such as 4.44%) when heated from an onset to 150 ⁇ 5°C (the percentage of the weight loss is the percentage of the weight reduction of the sample relative to the weight of the sample prior to this weight loss).
- TGA thermogravimetric analysis
- the crystal form B of the succinate salt has a differential scanning calorimetry (DSC) pattern, and the differential scanning calorimetry pattern can have major endothermic peaks at 105.1 ⁇ 3°C and 223.3 ⁇ 3°C.
- DSC differential scanning calorimetry
- the DSC pattern of the crystal form B of the succinate salt can further be basically shown in FIG. 76 .
- the TGA pattern of the crystal form B of the succinate salt can further be basically shown in FIG. 77 .
- the present disclosure provides a crystal form A of an ascorbate salt of the compound of formula I, which has an X-ray powder diffraction pattern expressed by 2 ⁇ angles comprising diffraction peaks at: 5.72 ⁇ 0.2°, 9.20 ⁇ 0.2°, 11.30 ⁇ 0.2°, 15.55 ⁇ 0.2°, 16.71 ⁇ 0.2°, 17.58 ⁇ 0.2°, 18.83 ⁇ 0.2°, and 25.94 ⁇ 0.2°; further, the crystal form A of the ascorbate salt has an X-ray powder diffraction pattern expressed by 2 ⁇ angles comprising diffraction peaks at: 5.72 ⁇ 0.2°, 9.20 ⁇ 0.2°, 11.30 ⁇ 0.2°, 14.38 ⁇ 0.2°, 15.55 ⁇ 0.2°, 16.71 ⁇ 0.2°, 17.58 ⁇ 0.2°, 18.83 ⁇ 0.2°, 20.30 ⁇ 0.2°, 22.33 ⁇ 0.2°, and 25.94 ⁇ 0.2°.
- the crystal form A of the ascorbate salt has an X-ray powder diffraction pattern expressed by 2 ⁇ angles, and diffraction peaks and relative intensities of the X-ray powder diffraction pattern can further be shown in Table 31.
- the X-ray powder diffraction pattern of the crystal form A of the ascorbate salt expressed by 2 ⁇ angles can further be shown in FIG. 129 .
- the compound of formula I and ascorbic acid have a molar ratio of 1:0.5.
- the crystal form A of the ascorbate salt has a thermogravimetric analysis (TGA) pattern with a weight loss of 3% to 5% (such as 4.36%) when heated from an onset to 150 ⁇ 5°C (the percentage of the weight loss is the percentage of the weight reduction of the sample relative to the weight of the sample prior to this weight loss).
- TGA thermogravimetric analysis
- the crystal form A of the ascorbate salt has a differential scanning calorimetry (DSC) pattern, and the differential scanning calorimetry pattern can have a major endothermic peak at 185.7 ⁇ 3°C and one exothermic peak at 195.8 ⁇ 3°C.
- DSC differential scanning calorimetry
- the DSC pattern of the crystal form A of the ascorbate salt can further be basically shown in FIG. 78 .
- the TGA pattern of the crystal form A of the ascorbate salt can further be basically shown in FIG. 79 .
- the present disclosure provides a crystal form B of an ascorbate salt of the compound of formula I, which has an X-ray powder diffraction pattern expressed by 2 ⁇ angles comprising diffraction peaks at: 5.50 ⁇ 0.2°, 11.00 ⁇ 0.2°, 16.63 ⁇ 0.2°, 17.47 ⁇ 0.2°, 19.82 ⁇ 0.2°, 28.08 ⁇ 0.2°, and 30.05 ⁇ 0.2°; further, the crystal form B of the ascorbate salt has an X-ray powder diffraction pattern expressed by 2 ⁇ angles comprising diffraction peaks at: 4.47 ⁇ 0.2°, 5.50 ⁇ 0.2°, 9.11 ⁇ 0.2°, 11.00 ⁇ 0.2°, 15.27 ⁇ 0.2°, 16.09 ⁇ 0.2°, 16.63 ⁇ 0.2°, 17.47 ⁇ 0.2°, 19.82 ⁇ 0.2°, 25.30 ⁇ 0.2°, 28.08 ⁇ 0.2°, and 30.05 ⁇ 0.2°.
- the crystal form B of the ascorbate salt has an X-ray powder diffraction pattern expressed by 2 ⁇ angles comprising diffraction peaks at: 4.47 ⁇ 0.2°, 5.50 ⁇ 0.2°, 9.11 ⁇ 0.2°, 11.00 ⁇ 0.2°, 13.23 ⁇ 0.2°, 15.27 ⁇ 0.2°, 16.09 ⁇ 0.2°, 16.63 ⁇ 0.2°, 17.47 ⁇ 0.2°, 19.82 ⁇ 0.2°, 21.09 ⁇ 0.2°, 21.53 ⁇ 0.2°, 25.30 ⁇ 0.2°, 25.92 ⁇ 0.2°, 26.81 ⁇ 0.2°, 28.08 ⁇ 0.2°, and 30.05 ⁇ 0.2°;
- the compound of formula I and ascorbic acid have a molar ratio of 1:1.
- the crystal form B of the ascorbate salt has a thermogravimetric analysis (TGA) pattern with a weight loss of 0% to 2% (such as 1.33%) when heated from an onset to 150 ⁇ 5°C (the percentage of the weight loss is the percentage of the weight reduction of the sample relative to the weight of the sample prior to this weight loss).
- TGA thermogravimetric analysis
- the crystal form B of the ascorbate salt has a differential scanning calorimetry (DSC) pattern, and the differential scanning calorimetry pattern can have a major endothermic peak at 153.6 ⁇ 3°C and one exothermic peak at 190.3 ⁇ 3°C.
- DSC differential scanning calorimetry
- the DSC pattern of the crystal form B of the ascorbate salt can further be basically shown in FIG. 81 .
- the TGA pattern of the crystal form B of the ascorbate salt can further be basically shown in FIG. 82 .
- the present disclosure provides a crystal form A of an adipate salt of a compound of formula I, which has an X-ray powder diffraction pattern expressed by 2 ⁇ angles comprising diffraction peaks at: 8.47 ⁇ 0.2°, 11.41 ⁇ 0.2°, 15.57 ⁇ 0.2°, 16.29 ⁇ 0.2°, 17.52 ⁇ 0.2°, 18.23 ⁇ 0.2°, and 19.84 ⁇ 0.2°; further, the crystal form A of the adipate salt has an X-ray powder diffraction pattern expressed by 2 ⁇ angles comprising diffraction peaks at: 8.47 ⁇ 0.2°, 8.99 ⁇ 0.2°, 11.41 ⁇ 0.2°, 12.40 ⁇ 0.2°, 13.60 ⁇ 0.2°, 15.57 ⁇ 0.2°, 16.29 ⁇ 0.2°, 17.52 ⁇ 0.2°, 18.23 ⁇ 0.2°, 19.84 ⁇ 0.2°, 21.29 ⁇ 0.2°, 23.81 ⁇ 0.2°, 24.62 ⁇ 0.2
- the crystal form A of the adipate salt has an X-ray powder diffraction pattern expressed by 2 ⁇ angles, and diffraction peaks and relative intensities of the X-ray powder diffraction pattern can further be shown in Table 33.
- the X-ray powder diffraction pattern of the crystal form A of the adipate salt expressed by 2 ⁇ angles can further be shown in FIG. 130 .
- the compound of formula I and adipic acid have a molar ratio of 1:1.
- the crystal form A of the adipate salt has a thermogravimetric analysis (TGA) pattern with a weight loss of 6% to 8% (such as 6.60%) when heated from an onset to 150 ⁇ 5°C (the percentage of the weight loss is the percentage of the weight reduction of the sample relative to the weight of the sample prior to this weight loss).
- TGA thermogravimetric analysis
- the crystal form A of the adipate salt has a differential scanning calorimetry (DSC) pattern, and the differential scanning calorimetry pattern can have a major endothermic peak at 88.3 ⁇ 3°C.
- DSC differential scanning calorimetry
- the DSC pattern of the crystal form A of the adipate salt can further be basically shown in FIG. 83 .
- the TGA pattern of the crystal form A of the adipate salt can further be basically shown in FIG. 84 .
- the present disclosure provides a crystal form A of a p-toluenesulfonate salt of the compound of formula I, which has an X-ray powder diffraction pattern expressed by 2 ⁇ angles comprising diffraction peaks at: 8.91 ⁇ 0.2°, 9.43 ⁇ 0.2°, 12.31 ⁇ 0.2°, 15.93 ⁇ 0.2°, 16.43 ⁇ 0.2°, 20.69 ⁇ 0.2°, 20.95 ⁇ 0.2°, 24.76 ⁇ 0.2°, and 26.36 ⁇ 0.2°; further, the crystal form A of the p-toluenesulfonate salt has an X-ray powder diffraction pattern expressed by 2 ⁇ angles comprising diffraction peaks at: 8.91 ⁇ 0.2°, 9.43 ⁇ 0.2°, 12.31 ⁇ 0.2°, 15.93 ⁇ 0.2°, 16.43 ⁇ 0.2°, 17.26 ⁇ 0.2°, 17.91 ⁇ 0.2°, 18.31 ⁇ 0.2°, 20.69
- the crystal form A of the p-toluenesulfonate salt has an X-ray powder diffraction pattern expressed by 2 ⁇ angles comprising diffraction peaks at: 8.91 ⁇ 0.2°, 9.43 ⁇ 0.2°, 11.51 ⁇ 0.2°, 12.31 ⁇ 0.2°, 13.70 ⁇ 0.2°, 15.93 ⁇ 0.2°, 16.43 ⁇ 0.2°, 17.26 ⁇ 0.2°, 17.91 ⁇ 0.2°, 18.31 ⁇ 0.2°, 19.49 ⁇ 0.2°, 20.69 ⁇ 0.2°, 20.95 ⁇ 0.2°, 21.19 ⁇ 0.2°, 22.77 ⁇ 0.2°, 23.11 ⁇ 0.2°, 23.29 ⁇ 0.2°, 24.34 ⁇ 0.2°, 24.76 ⁇ 0.2°, 25.55 ⁇ 0.2°, 26.36 ⁇ 0.2°, 26.83 ⁇ 0.2°, 27.69 ⁇ 0.2°, and 29.25 ⁇ 0.2°;
- the compound of formula I and p-toluenesulfonic acid have a molar ratio of 1:1.
- the crystal form A of the p-toluenesulfonate salt has a thermogravimetric analysis (TGA) pattern with a weight loss of 0% to 2% (such as 0.76%) when heated from an onset to 100 ⁇ 5°C and a weight loss of 2% to 4% (such as 3.07%) when heated from 100°C to 170°C (the percentage of the weight loss is the percentage of the weight reduction of the sample relative to the weight of the sample prior to this weight loss).
- TGA thermogravimetric analysis
- the crystal form A of the p-toluenesulfonate salt has a differential scanning calorimetry (DSC) pattern, and the differential scanning calorimetry pattern can have a major endothermic peak at 150.9 ⁇ 3°C.
- DSC differential scanning calorimetry
- the DSC pattern of the crystal form A of the p- toluenesulfonate salt can further be basically shown in FIG. 86 .
- the TGA pattern of the crystal form A of the p- toluenesulfonate salt can further be basically shown in FIG. 87 .
- the present disclosure provides a crystal form A of a benzenesulfonate salt of the compound of formula I, which has an X-ray powder diffraction pattern expressed by 2 ⁇ angles comprising diffraction peaks at: 10.81 ⁇ 0.2°, 11.38 ⁇ 0.2°, 16.25 ⁇ 0.2°, 17.41 ⁇ 0.2°, 18.35 ⁇ 0.2°, 19.90 ⁇ 0.2°, and 21.31 ⁇ 0.2°;
- the X-ray powder diffraction pattern of the crystal form A of the benzenesulfonate salt expressed by 2 ⁇ angles can further be basically shown in FIG. 131 .
- the compound of formula I and benzenesulfonic acid have a molar ratio of 1:1.
- the crystal form A of the benzenesulfonate salt has a thermogravimetric analysis (TGA) pattern with a weight loss of 2% to 4% (such as 2.55%) when heated from an onset to 80 ⁇ 5°C and a weight loss of 5% to 7% (such as 6.23%) when heated from 80°C to 150°C (the percentage of the weight loss is the percentage of the weight reduction of the sample relative to the weight of the sample prior to this weight loss).
- TGA thermogravimetric analysis
- the crystal form A of the benzenesulfonate salt has a differential scanning calorimetry (DSC) pattern, and the differential scanning calorimetry pattern can have a major endothermic peak at 111.7 ⁇ 3°C.
- DSC differential scanning calorimetry
- the DSC pattern of the crystal form A of the benzenesulfonate salt can further be basically shown in FIG. 88 .
- the TGA pattern of the crystal form A of the benzenesulfonate salt can further be basically shown in FIG. 89 .
- the present disclosure provides a crystal form A of an oxalate salt of the compound of formula I, which has an X-ray powder diffraction pattern expressed by 2 ⁇ angles comprising diffraction peaks at: 6.15 ⁇ 0.2°, 10.44 ⁇ 0.2°, 13.94 ⁇ 0.2°, 16.74 ⁇ 0.2°, 17.49 ⁇ 0.2°, and 24.50 ⁇ 0.2°;
- the crystal form A of the oxalate salt has an X-ray powder diffraction pattern expressed by 2 ⁇ angles, and diffraction peaks and relative intensities of the X-ray powder diffraction pattern can further be shown in Table 36; the X-ray powder diffraction pattern of the crystal form A of the oxalate salt of the compound of formula I expressed by 2 ⁇ angles can further be basically shown in FIG. 90 .
- the compound of formula I and oxalic acid have a molar ratio of 1:1.
- the crystal form A of the oxalate salt has a thermogravimetric analysis (TGA) pattern with a weight loss of 2% to 7% (such as 5.88%) when heated from an onset to 100 ⁇ 5°C (the percentage of the weight loss is the percentage of the weight reduction of the sample relative to the weight of the sample prior to this weight loss).
- TGA thermogravimetric analysis
- the crystal form A of the oxalate salt has a differential scanning calorimetry (DSC) pattern, and the differential scanning calorimetry pattern can have major endothermic peaks at 103.4 ⁇ 3°C and 141.6 ⁇ 3°C.
- DSC differential scanning calorimetry
- the DSC pattern of the crystal form A of the oxalate salt can further be basically shown in FIG. 91 .
- the TGA pattern of the crystal form A of the oxalate salt can further be basically shown in FIG. 92 .
- the present disclosure provides a crystal form A of a 2-hydroxyethanesulfonate salt of the compound of formula I, which has an X-ray powder diffraction pattern expressed by 2 ⁇ angles comprising diffraction peaks at: 6.46 ⁇ 0.2°, 9.89 ⁇ 0.2°, 10.95 ⁇ 0.2°, 13.14 ⁇ 0.2°, 18.38 ⁇ 0.2°, 18.81 ⁇ 0.2°, and 21.70 ⁇ 0.2°.
- the crystal form A of the 2-hydroxyethanesulfonate salt of the compound of formula I has an X-ray powder diffraction pattern expressed by 2 ⁇ angles comprising diffraction peaks at: 6.46 ⁇ 0.2°, 9.89 ⁇ 0.2°, 10.95 ⁇ 0.2°, 13.14 ⁇ 0.2°, 13.60 ⁇ 0.2°, 15.69 ⁇ 0.2°, 18.38 ⁇ 0.2°, 18.81 ⁇ 0.2°, 20.44 ⁇ 0.2°, and 21.70 ⁇ 0.2°;
- the compound of formula I and 2-hydroxyethanesulfonic acid have a molar ratio of 1:1.
- the crystal form A of the 2-hydroxyethanesulfonate salt has a thermogravimetric analysis (TGA) pattern with a weight loss of 0% to 3% (such as 1.61%) when heated from an onset to 150 ⁇ 5°C (the percentage of the weight loss is the percentage of the weight reduction of the sample relative to the weight of the sample prior to this weight loss).
- TGA thermogravimetric analysis
- the crystal form A of the 2-hydroxyethanesulfonate salt has a differential scanning calorimetry (DSC) pattern, and the differential scanning calorimetry pattern can have a major endothermic peak at 203.5 ⁇ 3°C.
- DSC differential scanning calorimetry
- the DSC pattern of the crystal form A of the 2-hydroxyethanesulfonate salt can further be basically shown in FIG. 94 .
- the TGA pattern of the crystal form A of the 2-hydroxyethanesulfonate salt can further be basically shown in FIG. 95 .
- the present disclosure further provides a preparation method for the crystal form A of the compound of formula I, comprising the following steps: crystallizing the compound of formula I in a solvent M, and separating solids; the solvent M is an alkane solvent.
- the alkane solvent is preferably n-hexane.
- the crystallization is carried out at room temperature, preferably 40 to 60°C, such as 50°C.
- the solvent M and the compound of formula I preferably have a mass-to-volume ratio of 30 to 50 mg/mL, such as 40 mg/mL.
- the present disclosure further provides a crystal form A of a compound of formula I prepared by the above preparation method for the crystal form A of the compound of formula I.
- the present disclosure further provides a preparation method for the crystal form of the pharmaceutically acceptable salt of the compound of formula I, comprising the following steps: reacting the compound of formula I with an acid in a solvent N, and separating solids;
- the solvent N is preferably a mixture of isopropanol and water, n-hexane, or ethyl acetate; more preferably, the isopropanol and water have a volume ratio of 19: 1 ⁇ 5.
- the solvent N and the compound of formula I preferably have a mass-to-volume ratio of 30 to 50 mg/mL, such as 40 mg/mL.
- the compound of formula I and the acid have a molar ratio of 1:(1 ⁇ 0.5), such as 1:1.
- the reaction can be carried out by crystallization with stirring.
- the crystallization is carried out at room temperature, preferably 10 to 30°C.
- the present disclosure further provides a preparation method for the crystal form A of the fumarate salt of the compound of formula I, comprising the following steps: reacting the pyridopyrimidinone compound of formula I in a solvent A with fumaric acid and separating solids; the solvent A is a mixture of an alcohol solvent and water.
- the solvent A is preferably a mixture of isopropanol and water, more preferably a mixture of isopropanol and water in a volume ratio of 19:1 ⁇ 5.
- the reaction is preferably carried out at a temperature of 10 to 30°C.
- the solvent A and the pyridopyrimidinone compound of formula I preferably have a mass-to-volume ratio of 30 to 50 mg/mL, such as 40 mg/mL.
- the reaction can be carried out by crystallization with stirring.
- the present disclosure further provides a crystal form A of a fumarate salt of a compound of formula I prepared by the above preparation method for the crystal form A of the fumarate salt of the compound of formula I.
- the present disclosure further provides a pharmaceutical composition I, comprising a substance A and a pharmaceutically acceptable carrier, wherein the substance A is one or more of the crystal form A of the compound of formula I, the crystal form B of the compound of formula I, the crystal form A of the fumarate salt of the compound of formula I, the crystal form B of the fumarate salt of the compound of formula I, the crystal form C of the fumarate salt the compound of formula I, the crystal form A of the citrate salt of the compound of formula I, the crystal form B of the citrate salt of the compound of formula I, the crystal form A of the methanesulfonate salt of the compound of formula I, the crystal form A of the ethanesulfonate salt of the compound of formula I, the crystal form B of the ethanesulfonate salt of the compound of formula I, the crystal form A of the maleate salt of the compound of formula I, the crystal form B of the maleate salt of the compound of formula I, the crystal form A of the L-tartrate salt of the compound
- the present disclosure further provides a pharmaceutical composition II, comprising the substance A and at least one other pharmacologically active inhibitor, and the substance A is defined as above.
- the other pharmacologically activity inhibitor is an inhibitor of MEK, an inhibitor of EGFR, or an inhibitor of KRAS;
- the MRTX849 has a chemical structure of
- the AMG-510 has a chemical structure of
- the JDQ443 has a chemical structure of
- the other pharmacologically active inhibitor is an inhibitor of MEK and/or a mutant thereof. More preferably, the other pharmacologically active inhibitor is trametinib.
- the other pharmacologically active inhibitor is an inhibitor of EGFR and/or a mutant thereof. More preferably, the other pharmacologically active inhibitor is osimertinib or gefitinib, preferably osimertinib.
- the present disclosure further provides a use of the substance A, the pharmaceutical composition I, or the pharmaceutical composition II, wherein the use is selected from:
- the disease related to (or mediated by) SOS1 and RAS family proteins includes, but is not limited to: cancer and RASopathies.
- the RASopathies are preferably Noonan syndrome, cardiofaciocutaneous syndrome, hereditary gingival fibromatosis type 1, neurofibromatosis type 1 (NF1), capillary malformation-arteriovenous malformation syndrome, Costello syndrome, or Legius syndrome, more preferably neurofibromatosis type 1;
- the cancer is preferably selected from melanoma, skin cancer, liver cancer, kidney cancer, lung cancer, nasopharyngeal cancer, gastric cancer, esophageal cancer, colorectal cancer, gallbladder carcinoma, cholangiocarcinoma, choriocarcinoma, pancreatic cancer, polycythemia vera, pediatric tumor, cervical cancer, ovarian cancer, breast cancer, bladder cancer, urothelial carcinoma, ureteral tumor, prostate cancer, seminoma, testicular cancer, leukemia, head
- the lung cancer is preferably non-small cell lung cancer, further preferably metastatic non-small cell lung cancer;
- the leukemia is preferably chronic lymphocytic leukemia or acute myeloid leukemia;
- the lymphoma is preferably diffuse large B-cell lymphoma;
- the myeloma is preferably multiple myeloma;
- the osteoma is preferably osteochondroma;
- the liver cancer is preferably hepatocellular carcinoma;
- the head and neck tumor is preferably head and neck squamous cell carcinoma;
- the sarcoma is preferably osteosarcoma;
- the colorectal cancer is preferably colon cancer or rectal cancer.
- the use comprises a use of the substance A in combination with an inhibitor of MEK (such as trametinib).
- MEK such as trametinib
- the drug comprises the substance A and an inhibitor of MEK (such as trametinib).
- MEK such as trametinib
- the use comprises a use of the substance A in combination with an inhibitor of EGFR (such as osimertinib and gefitinib).
- an inhibitor of EGFR such as osimertinib and gefitinib.
- the drug comprises the substance A and an inhibitor of EGFR (such as osimertinib and gefitinib).
- an inhibitor of EGFR such as osimertinib and gefitinib.
- the use comprises a use of the substance A in combination with an inhibitor of KRAS (such as MRTX-849, AMG-510, and JDQ443).
- KRAS such as MRTX-849, AMG-510, and JDQ443
- the drug comprises the substance A and an inhibitor of KRAS (such as MRTX-849, AMG-510, and JDQ443).
- KRAS such as MRTX-849, AMG-510, and JDQ443
- the use comprises a use of the substance A in combination with trametinib or osimertinib.
- the drug comprises the substance A and trametinib or osimertinib.
- the RAS family protein can be KRAS, such as KRAS G12C, KRAS G12D, and KRAS G12V.
- the present disclosure provides a method for inhibiting SOS1 and RAS family proteins, or preventing and/or treating a disease related to (or mediated by) SOS1 and RAS family proteins, comprising the steps of: administering to a subject in need thereof a therapeutically effective amount of the substance A.
- the method comprises using the substance A in combination with an inhibitor of MEK, an inhibitor of EGFR, or an inhibitor of KRAS; more preferably, the method comprises using the substance A in combination with trametinib or osimertinib.
- the present disclosure further provides a quality detection method for a substance B, comprising the following steps: eluting a test substance in a silica gel chromatographic column using high-performance liquid chromatography; the test substance comprises the substance B; wherein the substance B is one or more of the compound of formula I, the crystal form A of the compound of formula I, the crystal form B of the compound of formula I, the crystal form A of the fumarate salt of the compound of formula I, the crystal form B of the fumarate salt of the compound of formula I, the crystal form C of the fumarate salt the compound of formula I, the crystal form A of the citrate salt of the compound of formula I, the crystal form B of the citrate salt of the compound of formula I, the crystal form A of the methanesulfonate salt of the compound of formula I, the crystal form A of the ethanesulfonate salt of the compound of formula I, the crystal form B of the ethanesulfonate salt of the compound of formula I, the crystal form A of the maleate
- the reagents and raw materials used in the present disclosure are all commercially available.
- the X-ray powder diffraction patterns are all measured by using the Cu K ⁇ spectral line.
- the 2 ⁇ angles can optionally be retained with or without rounding to 2 or 4 significant digits after the decimal point.
- the 2 ⁇ angle can be 4.84 or 4.85 after retaining 2 significant digits after the decimal point, and it should be understood that the preservation of such a significant digit has the same meaning.
- the positive progressive effect of the present disclosure lies in that: after extensive and in-depth research, the present inventor surprisingly develops a crystal form, a salt, and a crystal form of the salt of a compound of formula I (such as substance A) as described herein, a preparation method therefor, and a use thereof.
- the compound of formula I shows a significant inhibitory effect on KRAS G12C::SOS1 binding, a significant inhibitory effect on KRAS G12C-SOS1, a significant inhibitory effect on the ERK phosphorylation level in DLD-1 cells, and a strong inhibitory effect on the 3D proliferation of H358 cells;
- the compound of the present disclosure exhibits good hepatic metabolic stability, slow metabolism in the human body, and high exposure; no inhibitory effect on CYP3A4 enzymes, low risk of potential drug-drug interactions, excellent pharmacokinetic properties, high safety and druggability, and is more suitable for combination medication.
- the compound of the present disclosure alone or in combination with trametinib, has a significant inhibitory effect on Mia Paca-2 tumor growth, and the combined use is more effective than the single use.
- the crystal form, the salt, and the crystal form of the salt of the compound of formula I (such as substance A) described herein have desirable physicochemical properties, such as high stability, solubility and bioavailability, and low hygroscopicity, and are suitable for preparing a desirable pharmaceutical preparation.
- the present disclosure further provides a method for preparing the crystal form, the salt, and the crystal form of the salt of the compound of formula I (such as substance A).
- the method is simple to operate, high in yield and high in purity, and can be used in industrial production of medicines.
- Table 1 Instrument Model Manufacturer X-ray powder diffractometer Empyrean/X' Pert3 PANalytacal Differential scanning calorimeter TA 2500 TA Thermogravimetric analyzer TA 5500 TA Dynamic vapor sorption analyzer Intrinsic SMS Polarized light microscopy Axio Scope.A1 Zeiss Nuclear magnetic resonance spectrometer Bruker 400M Bruker High-performance liquid chromatograph 1260 Agilent Ion chromatograph ICS-1100 ThermoFisher
- the XRPD pattern was collected on an X-ray powder diffraction analyzer produced by PANalytacal, and the scanning parameters are shown in Table 2.
- TGA Thermogravimetric analysis
- DSC differential scanning calorimetry
- TGA and DSC patterns were collected on a TA 5500 thermogravimetric analyzer and a TA 2500 differential scanning calorimeter, respectively, and the test parameters are listed in Table 3.
- Table 3 Parameter TGA DSC Method Linear heating Linear heating Sample tray Aluminum pan, open Aluminum pan, with lid/without lid Temperature range Room temperature-set endpoint temperature 25°C-set endpoint temperature Purge rate (°C/min) 10 10 Protective gas Nitrogen Nitrogen
- the dynamic vapor sorption (DVS) curve was collected on DVS IntrInsic from SMS (surface measurement systems). The relative humidity at 25°C was corrected using the deliquescence points of LiCl, Mg(NO 3 ) 2 , and KCl. DVS test parameters are listed in Table 4.
- Liquid NMR spectra were collected on a Bruker 400M NMR instrument, using DMSO- d 6 , CDCl 3 , or CD 3 OD as solvents.
- Step 2 Synthesis of (S,E)-2-methyl-N-(1-(3-(pentafluorosulfanyl)phenyl)ethylidene)propane-2-sulfinamide (B3-3)
- Step 3 Synthesis of (S)-2-methyl-N-((R)-1-(3-(pentafluorosulfanyl)phenyl)ethyl)propane-2-sulfinamide (B3-4)
- Step 4 Synthesis of ( R )-1-(3-(pentafluorosulfanyl)phenyl)ethan-1-amine hydrochloride (B3-5)
- Step 5 Synthesis of ( R )-6-(1-(fluoromethyl)cyclopropyl)-2-methyl-4-((1-(3-(pentafluorosulfanyl)phenyl)ethyl)amino)pyrido[4,3- d ]pyrimidin-7(6 H )-one
- the XRPD as shown in FIG. 1 , indicates that the resulting sample of the compound of formula I is substantially amorphous.
- the DSC pattern shows that the compound of formula I has major endothermic signals at 75.7°C, 95.2°C, 142.2°C, and 180.4°C.
- the TGA pattern shows a weight loss of the compound of formula I by 6.26% when heated from an onset to 180°C.
- the 1 H NMR spectrum data of the compound of formula I is: 1 H NMR (400 MHz, DMSO- d 6 ) ⁇ 9.18 (s,1H), 8.87 (d, 1H),7.96 (s, 1H),7.78 (d, 1H), 7.71 (d, 1H),7.60 (t, 1H),6.08 (s, 1H), 5.60 (q, 1H), 4.68-4.56 (m, 2H), 2.21 (s, 3H), 1.61 (d, 3H), 1.32-1.28 (m, 4H).
- the preparation steps are as follows: 300.3 mg of the compound of formula I was weighed into a 20 mL glass vial, and 7.5 mL of n-heptane was added to form a suspension. The suspension was then placed at 50°C for 5 days under magnetic stirring. The solid was separated and vacuum dried at room temperature overnight to obtain a solid sample.
- the resulting sample was identified by X-ray powder diffraction pattern as a crystal form A of the compound of formula I.
- the crystal form A of the compound of formula I has an X-ray powder diffraction pattern expressed by 2 ⁇ angles, and diffraction peaks and relative intensities of the X-ray powder diffraction pattern can further be shown in Table 8.
- the XRPD pattern of a sample of the crystal form A of the compound of formula I is shown in FIG. 4 .
- the DSC pattern shows that the crystal form A of the compound of formula I has major endothermic signals at 73.3°C and 178.0°C.
- the TGA pattern shows a weight loss of the crystal form A of the compound of formula I by 3.24% when heated from an onset to 120 ⁇ 5°C.
- the 1 H NMR spectrum data of the crystal form A of the compound of formula I is: 1 H NMR (400 MHz, DMSO- d 6 ) ⁇ 9.12 (1H, s), 8.89 (1H, d), 7.91 (1H, t), 7.83-7.76 (1H, m), 7.72 (1H, d), 7.60 (1H, t), 6.09 (1H, s), 5.60 (1H, m), 4.62 (2H, d), 2.21 (3H, s), 1.61 (3H, d), 1.37-1.24 (4H, m).
- the crystal form A of the compound of formula I of Example 2 was identified using variable temperature XRPD (VT-XRPD).
- the VT-XRPD results showed ( FIG. 9 ) that the crystal form A of the compound of formula I transformed into a new crystal form B after being purged with N 2 for 20 minutes. No crystal change was observed after heating to 100°C under the protection of N 2 and cooling to 30°C. When the sample was exposed to air, it was observed that the sample transcrystallized back to the crystal form A of the compound of formula I.
- crystal form A is a hydrate, possibly a hydrate containing 0.5-1.5 water molecules, such as a monohydrate or sesquihydrate.
- the crystal form A is dehydrated under N 2 purging or heating conditions to form an anhydrous crystal form B, and after being exposed to air, the sample absorbs water and then is transcrystallized back to the crystal form A.
- the X-ray powder diffraction pattern shows that the obtained sample is the crystal form B of the compound of formula I.
- the crystal form B of the compound of formula I has an X-ray powder diffraction pattern expressed by 2 ⁇ angles, and its diffraction peaks and relative intensities can be further shown in Table 10.
- the X-ray powder diffraction pattern of the crystal form B of the compound of formula I is shown in FIG. 10 .
- the X-ray powder diffraction pattern shows that the obtained sample is the crystal form A of the fumarate salt of the compound of formula I.
- the crystal form A of the fumarate salt of the compound of formula I has an X-ray powder diffraction pattern expressed by 2 ⁇ angles, and diffraction peaks and relative intensities of the X-ray powder diffraction pattern can be shown in Table 11.
- the X-ray powder diffraction pattern of the crystal form A of the fumarate salt is shown in FIG. 11 .
- the DSC pattern shows that the sample has one endothermic peak at 214.7°C.
- the TGA pattern shows that the sample has a weight loss of 3.35% when heated to 150°C.
- the 1 H NMR spectrum data of the crystal form A of the fumarate salt of the compound of formula I is: 1 H NMR (400 MHz, DMSO- d 6 ) ⁇ 9.12 (1H, s), 8.89 (1H, s), 7.96 (1H, t), 7.79 (1H, dd), 7.71 (1H, d), 7.60 (1H, t), 6.62 (2H, s), 6.09 (1H, s), 5.60 (1H, m), 4.62 (2H, d), 2.21 (3H, s), 1.61 (3H, d), 1.37-1.23 (4H, m).
- the molar ratio of fumaric acid to the compound of formula I is 1.0:1.
- PLM shows that the crystal form A of the fumarate salt is a needle-like small particle and aggregation of the samples is observed.
- VT-XRPD was used to identify the crystal form A of the fumarate salt.
- the results showed that (see FIG. 15 ): after purging the crystal form A of the fumarate salt under N 2 for 20 minutes, a peak shift was observed. No change in the crystal form was observed when the sample was heated to 150°C under the protection of N 2 and then cooled to 30°C. When the sample was exposed to air, it was observed that the sample transcrystallized back to the crystal form A of the fumarate salt.
- the crystal form A of the fumarate salt is a hydrate, possibly a hydrate containing 0.5-1.5 water molecules, such as a monohydrate or sesquihydrate.
- the compound of formula I and an equimolar amount of fumaric acid were suspended and stirred in EtOAc at room temperature for 3 days, and then the solid was separated by centrifugation and vacuum dried at room temperature overnight.
- the X-ray powder diffraction pattern shows that the obtained sample is the crystal form B of the fumarate salt of the compound of formula I.
- the crystal form B of the fumarate salt of the compound of formula I has an X-ray powder diffraction pattern expressed by 2 ⁇ angles, and diffraction peaks and relative intensities of the X-ray powder diffraction pattern can further be shown in Table 12.
- the X-ray powder diffraction pattern of the crystal form B of the fumarate salt is shown in FIG. 16 .
- the DSC pattern shows that the sample has one endothermic peak at 154.4°C and one exothermic peak at 191.9°C.
- the TGA pattern shows that the sample has a weight loss of 5.64% when heated to 150°C, and a weight loss of 6.76% when heated from 150°C to 250°C.
- the 1 H NMR spectrum data of the crystal form B of the fumarate salt of the compound of formula I is: 1 H NMR (400 MHz, DMSO- d 6 ) ⁇ 9.12 (1H, s), 8.90 (1H, d), 7.96 (1H, t), 7.80 (1H, dd), 7.72 (1H, d), 7.60 (1H, t), 6.62 (2H, s), 6.09 (1H, s), 5.60 (1H, m), 4.61 (2H, d), 2.22 (3H, s), 1.61 (3H, d), 1.35-1.26 (4H, m).
- the 1 H NMR results show that the molar ratio of fumaric acid to the compound of formula I is 1:1 in the sample of the crystal form B of the fumarate salt.
- the compound of formula I and an equimolar amount of fumaric acid were suspended and stirred in MTBE at room temperature for 3 days, and then the solid was separated by centrifugation and vacuum dried at room temperature overnight.
- the X-ray powder diffraction pattern shows that the obtained sample is the crystal form C of the fumarate salt of the compound of formula I.
- the crystal form C of the fumarate salt of the compound of formula I has an X-ray powder diffraction pattern expressed by 2 ⁇ angles, and diffraction peaks and relative intensities of the X-ray powder diffraction pattern can further be shown in Table 13.
- the X-ray powder diffraction pattern of the crystal form C of the fumarate salt is shown in FIG. 19 .
- the DSC pattern shows that the sample has three endothermic peaks at 94.4°C, 145.0°C, and 161.2°C, and one exothermic peak at 190.4°C.
- the TGA pattern shows that the sample has a weight loss of 1.69% when heated to 150°C, and a weight loss of 6.21% when heated from 150°C to 250°C.
- the 1 H NMR spectrum data of the crystal form C of the fumarate salt is: 1 H NMR (400 MHz, DMSO- d 6 ) ⁇ 9.12 (1H, s), 8.90 (1H, d), 7.96 (1H, t), 7.79 (1H, dd), 7.72 (1H, d), 7.60 (1H, t), 6.63 (2H, s), 6.09 (1H, s), 5.60 (1H, m), 4.59 (2H, d), 2.22 (3H, s), 1.61 (3H, d), 1.35-1.24 (4H, m).
- the molar ratio of fumaric acid to the compound of formula I is 1:1.
- the compound of formula I and an equimolar amount of anhydrous citric acid were suspended and stirred in acetone/n-heptane (1:3, v/v) at room temperature for 3 days, and then the solid was separated by centrifugation and vacuum dried at room temperature overnight.
- the X-ray powder diffraction pattern shows that the obtained sample is the crystal form A of the citrate salt of the compound of formula I.
- the crystal form A of the citrate salt of the compound of formula I has an X-ray powder diffraction pattern expressed by 2 ⁇ angles, and diffraction peaks and relative intensities of the X-ray powder diffraction pattern can further be shown in Table 14.
- Table 14 Diffraction peak number 2 ⁇ angle (°) Relative intensity (%) 1 6.2756 100.00 2 10.7946 4.33 3 12.2105 7.49 4 12.5828 22.11 5 16.3816 10.38 6 18.3385 2.67 7 25.3323 20.65 8 29.0006 0.90
- the X-ray powder diffraction pattern of the crystal form A of the citrate salt is shown in FIG. 22 .
- the DSC pattern shows that the sample has two endothermic peaks at 99.1°C and 137.9°C.
- the TGA pattern shows that the sample has a weight loss of 5.72% when heated to 150°C, and a weight loss of 19.25% when heated from 150°C to 230°C.
- the 1 H NMR spectrum data of the crystal form A of the citrate salt is: 1 H NMR (400 MHz, DMSO- d 6 ) ⁇ 9.15 (1H, s), 7.97 (1H, t), 7.80 (1H, dd), 7.72 (1H, d), 7.61 (1H, t), 6.09 (1H, s), 5.63 (1H, m), 4.59 (2H, d), 2.74 (2H, d), 2.63 (2H, d), 2.24 (3H, s), 1.62 (3H, d), 1.35-1.26 (4H, m).
- the 1 H NMR results show that the molar ratio of citric acid to the compound of formula I is 1: 1 in the sample of the crystal form A of the citrate salt.
- the X-ray powder diffraction pattern shows that the obtained sample is the crystal form B of the citrate salt of the compound of formula I.
- the crystal form B of the citrate salt of the compound of formula I has an X-ray powder diffraction pattern expressed by 2 ⁇ angles, and diffraction peaks and relative intensities of the X-ray powder diffraction pattern can further be shown in Table 15.
- the X-ray powder diffraction pattern of the crystal form B of the citrate salt is shown in FIG. 25 .
- the crystal form identification of the crystal form B of the citrate salt was carried out through VT-XRPD.
- the results showed that ( FIG. 26 ): no change in the crystal form was observed when the sample was purged under N 2 for 20 minutes, heated to 150°C, and cooled to room temperature.
- the DSC pattern shows that the sample has one endothermic peak at 195.0°C.
- the TGA pattern shows that the sample has a weight loss of 1.26% when heated to 150°C.
- the 1 H NMR spectrum data of the crystal form B of the citrate salt is: 1 H NMR (400 MHz, DMSO- d 6 ) ⁇ 9.15 (1H, s), 7.96 (1H, t), 7.80 (1H, dd), 7.72 (1H, d), 7.60 (1H, t), 6.09 (1H, s), 5.62 (1H, m), 4.61 (2H, d), 2.73 (2H, d), 2.63 (2H, d), 2.24 (3H, s), 1.61 (3H, d), 1.37-1.20 (4H, m).
- the molar ratio of citric acid to the compound of formula I is 1: 1 in the sample of the crystal form B of the citrate salt.
- PLM shows that the crystal form B of the citrate salt is in the form of irregular small particles and aggregation of the samples is observed.
- the X-ray powder diffraction pattern shows that the obtained sample is the crystal form A of the methanesulfonate salt of the compound of formula I.
- the crystal form A of the methanesulfonate salt of the compound of formula I has an X-ray powder diffraction pattern expressed by 2 ⁇ angles, and diffraction peaks and relative intensities of the X-ray powder diffraction pattern can further be shown in Table 16.
- the X-ray powder diffraction pattern of the crystal form A of the methanesulfonate salt is shown in FIG. 30 .
- the DSC pattern shows that the sample has one endothermic peak at 206.0°C.
- the TGA pattern shows that the sample has a weight loss of 2.14% when heated to 150°C.
- the 1 H NMR spectrum data of the crystal form A of the methanesulfonate salt is: 1 H NMR (400 MHz, CDCl 3 ) ⁇ 13.27 (1H, s), 10.69 (1H, d), 9.32 (1H, s), 7.90 (1H, t), 7.79 (1H, d), 7.63 (1H, dd), 7.43 (1H, s), 6.40 (1H, s), 5.64 (1H, m), 4.44 (2H, t), 2.86 (3H, s), 2.49 (3H, s), 1.86 (3H, d), 1.55 (2H, s), 1.27 (2H, s).
- the 1 H NMR results show that the molar ratio of methanesulfonic acid to the compound of formula I is 1: 1 in the sample of the crystal form A of the methanesulfonate salt.
- PLM shows that the crystal form A of the methanesulfonate salt is in the form of irregular small particles and aggregation of the samples is observed.
- the X-ray powder diffraction pattern shows that the obtained sample is the crystal form A of the ethanesulfonate salt of the compound of formula I.
- the crystal form A of the ethanesulfonate salt of the compound of formula I has an X-ray powder diffraction pattern expressed by 2 ⁇ angles, and diffraction peaks and relative intensities of the X-ray powder diffraction pattern can further be shown in Table 17.
- the X-ray powder diffraction pattern of the crystal form A of the ethanesulfonate salt is shown in FIG. 35 .
- the DSC pattern shows that the sample has one endothermic peak at 218.7°C.
- the TGA pattern shows that the sample has a weight loss of 0.87% when heated to 150°C.
- PLM ( FIG. 39 ) shows that the crystal form A of the ethanesulfonate salt is in the form of irregular particles.
- the 1 H NMR spectrum data of the crystal form A of the ethanesulfonate salt is: 1 H NMR (400 MHz, DMSO- d 6 ) ⁇ 9.38 (1H, s), 8.00 (1H, t), 7.86 (1H, dd), 7.77 (1H, d), 7.65 (1H, t), 6.16 (1H, s), 5.81 (1H, m), 4.59 (2H, d), 2.44 (3H, s), 2.36 (2H, dd), 1.68 (3H, d), 1.43-1.27 (4H, m), 1.05 (3H, t).
- the molar ratio of ethanesulfonic acid to the compound of formula I is 1:1 in the sample of the crystal form A of the ethanesulfonate salt.
- the compound of formula I and an equimolar amount of ethanesulfonic acid were suspended and stirred in MTBE at room temperature for 3 days, and then the solid was separated by centrifugation and vacuum dried at room temperature overnight.
- the X-ray powder diffraction pattern shows that the obtained sample is the crystal form B of the ethanesulfonate salt of the compound of formula I.
- the crystal form B of the ethanesulfonate salt of the compound of formula I has an X-ray powder diffraction pattern expressed by 2 ⁇ angles, and diffraction peaks and relative intensities of the X-ray powder diffraction pattern can further be shown in Table 18.
- the X-ray powder diffraction pattern of the crystal form B of the ethanesulfonate salt is shown in FIG. 40 .
- the DSC pattern shows that the sample has two endothermic peaks at 156.8°C and 211.9°C and one exothermic peak at 193.0°C.
- the TGA pattern shows that the sample has a weight loss of 2.17% when heated to 150°C.
- the 1 H NMR spectrum data of the crystal form B of the ethanesulfonate salt is: 1 H NMR (400 MHz, DMSO- d 6 ) ⁇ 9.40 (1H, s), 8.01 (1H, t), 7.87 (1H, dd), 7.77 (1H, d), 7.66 (1H, t), 6.16 (1H, s), 5.82 (1H, m), 4.64 (2H, d), 2.44 (3H, s), 2.36 (3H, dd), 1.68 (3H, d), 1.43-1.27 (4H, m), 1.05 (3H, s).
- the molar ratio of ethanesulfonic acid to the compound of formula I is 1:1 in the sample of the crystal form B of the ethanesulfonate salt.
- the compound of formula I and an equimolar amount of maleic acid were suspended and stirred in IPA/H 2 O (19:1, v/v) at room temperature for 3 days. The resulting clear solution was transferred to 5°C and stirred for 1 day. The solid was separated by centrifugation and vacuum dried at room temperature overnight.
- the X-ray powder diffraction pattern shows that the obtained sample is the crystal form A of the maleate salt of the compound of formula I.
- the crystal form A of the maleate salt of the compound of formula I has an X-ray powder diffraction pattern expressed by 2 ⁇ angles, and diffraction peaks and relative intensities of the X-ray powder diffraction pattern can further be shown in Table 19.
- the X-ray powder diffraction pattern of the crystal form A of the maleate salt is shown in FIG. 43 .
- the DSC pattern shows that the sample has two endothermic peaks at 160.4°C and 219.1°C.
- the TGA pattern shows that the sample has a weight loss of 3.14% when heated to 100°C, and a weight loss of 14.49% when heated from 100°C to 225°C.
- the 1 H NMR spectrum data of the crystal form A of the maleate salt is: 1 H NMR (400 MHz, DMSO- d 6 ) ⁇ 9.31 (1H, s), 7.99 (1H, t), 7.84 (1H, dd), 7.75 (1H, d), 7.66 (1H, t), 6.13 (1H, s), 6.09 (2H, s), 5.75 (1H, m), 4.61 (2H, d), 2.44 (3H, s), 1.68 (3H, d), 1.41-1.27 (4H, m).
- the peak of maleic acid overlapped with the compound of formula I, and the molar ratio of maleic acid to the compound of formula I is 1:1.
- the compound of formula I and an equimolar amount of maleic acid were suspended and stirred in MTBE for 3 days, and then the solid was separated by centrifugation and vacuum dried at room temperature overnight. The sample of the crystal form B of the maleate salt was obtained.
- the X-ray powder diffraction pattern shows that the obtained sample is the crystal form B of the maleate salt of the compound of formula I.
- the crystal form B of the maleate salt of the compound of formula I has an X-ray powder diffraction pattern expressed by 2 ⁇ angles, and diffraction peaks and relative intensities of the X-ray powder diffraction pattern can further be shown in Table 20.
- Table 20 Diffraction peak number 2 ⁇ angle (°) Relative intensity (%) 1 3.1784 74.33 2 4.9956 100.00 3 6.9966 18.03 4 10.4659 27.05 5 11.2179 47.74 6 15.0246 6.39 7 15.6048 4.21 8 16.8234 14.78 9 18.3075 14.91 10 18.9268 14.55 11 19.5029 12.94
- the X-ray powder diffraction pattern of the crystal form B of the maleate salt is shown in FIG. 46 .
- the DSC pattern shows that the sample has two endothermic peaks at 152.9°C and 220.7°C.
- the TGA pattern shows that the sample has a weight loss of 2.84% when heated to 100°C, and a weight loss of 12.43% when heated from 100°C to 225°C.
- the 1 H NMR spectrum data of the crystal form B of the maleate salt is: 1 H NMR (400 MHz, DMSO- d 6 ) ⁇ 9.33 (1H, s), 7.99 (1H, t), 7.85 (1H, dd), 7.76 (1H, d), 7.66 (1H, t), 6.14 (1H, s), 6.11 (2H, s), 5.75 (1H, m), 4.61 (2H, d), 2.39 (3H, s), 1.66 (3H, d), 1.40-1.27 (4H, m).
- the peak of maleic acid overlapped with the compound of formula I, and the molar ratio of maleic acid to the compound of formula I is 1:1.
- the compound of formula I and an equimolar amount of L-tartaric acid were suspended and stirred in IPA/H 2 O (19:1, v/v) at room temperature for 3 days, and then the solid was separated by centrifugation and vacuum dried at room temperature overnight.
- the X-ray powder diffraction pattern shows that the obtained sample is the crystal form A of the L-tartrate salt of the compound of formula I.
- the crystal form A of the L-tartrate salt of the compound of formula I has an X-ray powder diffraction pattern expressed by 2 ⁇ angles, and diffraction peaks and relative intensities of the X-ray powder diffraction pattern can further be shown in Table 21.
- the X-ray powder diffraction pattern of the crystal form A of the L-tartrate salt is shown in FIG. 49 .
- the DSC pattern shows that the sample has two endothermic peaks at 82.2°C and 213.2°C.
- the TGA pattern shows that the sample has a weight loss of 3.18% when heated to 150°C.
- the 1 H NMR spectrum data of the crystal form A of the L-tartrate salt is: 1 H NMR (400 MHz, DMSO- d 6 ) ⁇ 9.13 (1H, s), 7.96 (1H, t), 7.85 (1H, dd), 7.76 (1H, d), 7.66 (1H, t), 6.09 (1H, s), 5.61 (1H, t), 4.61 (2H, d), 4.28 (2H, s), 2.22 (3H, s), 1.61 (3H, d), 1.34-1.27 (4H, m).
- the 1 H NMR results show that the molar ratio of L-tartaric acid to the compound of formula I is 1: 1 in the sample of the crystal form A of the L-tartrate salt.
- the compound of formula I and an equimolar amount of L-tartaric acid were suspended and stirred in EtOAc at room temperature for 3 days, and then the solid was separated by centrifugation and vacuum dried at room temperature overnight.
- the X-ray powder diffraction pattern shows that the obtained sample is the crystal form B of the L-tartrate salt of the compound of formula I.
- the crystal form B of the L-tartrate salt of the compound of formula I has an X-ray powder diffraction pattern expressed by 2 ⁇ angles, and diffraction peaks and relative intensities of the X-ray powder diffraction pattern can further be shown in Table 22.
- the X-ray powder diffraction pattern of the crystal form B of the L-tartrate salt is shown in FIG. 52 .
- the DSC pattern shows that the sample has four endothermic peaks at 114.5°C, 160.5°C, 193.2°C, and 219.5°C.
- the TGA pattern shows that the sample has a weight loss of 5.57% when heated to 180°C.
- the 1 H NMR spectrum data of the crystal form B of the L-tartrate salt is: 1 H NMR (400 MHz, DMSO- d 6 ) ⁇ 9.13 (1H, s), 8.92 (1H, s), 7.96 (1H,t), 7.80 (1H, dd), 7.72 (1H, d), 7.66 (1H, t), 6.09 (1H, s), 5.61 (1H, t), 4.63 (2H, d), 4.28 (2H, s), 2.22 (3H, s), 1.61 (3H, d), 1.37-1.25 (4H, m).
- the 1 H NMR results show that the molar ratio of L-tartaric acid to the compound of formula I is 1:1 in the sample of the crystal form B of the L-tartrate salt.
- the compound of formula I and an equimolar amount of L-tartaric acid were suspended and stirred in MTBE at room temperature for 3 days, and then the solid was separated by centrifugation and vacuum dried at room temperature overnight.
- the X-ray powder diffraction pattern shows that the obtained sample is the crystal form C of the L-tartrate salt of the compound of formula I.
- the crystal form C of the L-tartrate salt of the compound of formula I has an X-ray powder diffraction pattern expressed by 2 ⁇ angles, and diffraction peaks and relative intensities of the X-ray powder diffraction pattern can further be shown in Table 23.
- the X-ray powder diffraction pattern of the crystal form C of the L-tartrate salt is shown in FIG. 55 .
- the DSC pattern shows that the sample has three endothermic peaks at 128.5°C, 157.1°C, and 220.5°C.
- the TGA pattern shows that the sample has a weight loss of 3.16% when heated to 150°C.
- the 1 H NMR data of the crystal form C of the L-tartrate salt is: 1 H NMR (400 MHz, DMSO- d 6 ) ⁇ 9.13 (1H, s), 8.93 (1H, d), 7.96 (1H, t), 7.80 (1H, dd), 7.72 (1H, d), 7.60 (1H, t), 6.09 (1H, s), 5.61 (1H, t), 4.63 (2H, d), 4.28 (1H, s), 2.22 (3H, s), 1.61 (3H, d), 1.39-1.20 (4H, m).
- the molar ratio of L-tartaric acid to the compound of formula I is 0.5:1 in the sample of the crystal form C of the L-tartrate salt.
- the compound of formula I and an equimolar amount of L-tartaric acid were suspended and stirred in acetone/n-heptane (1:3, v/v) at room temperature for 3 days, and then the solid was separated by centrifugation and vacuum dried at room temperature overnight.
- the X-ray powder diffraction pattern shows that the obtained sample is the crystal form D of the L-tartrate salt of the compound of formula I.
- the crystal form D of the L-tartrate salt of the compound of formula I has an X-ray powder diffraction pattern expressed by 2 ⁇ angles, and diffraction peaks and relative intensities of the X-ray powder diffraction pattern can further be shown in Table 24.
- the X-ray powder diffraction pattern of the crystal form D of the L-tartrate salt is shown in FIG. 58 .
- the DSC pattern shows that the sample has five endothermic peaks at 75.0°C, 111.6°C, 161.9°C, 200.9°C, and 218.8°C.
- the TGA pattern shows that the sample has a weight loss of 2.72% when heated to 150°C.
- the 1 H NMR spectrum data of the crystal form D of the L-tartrate salt is: 1 H NMR (400 MHz, DMSO- d 6 ) ⁇ 9.13 (1H, s), 8.93 (1H, s), 7.96 (1H, t), 7.80 (1H, d), 7.72 (1H, d), 7.60 (1H, t), 6.09 (1H, s), 5.61 (1H, t), 4.58 (2H, d), 4.29 (2H, s), 2.22 (3H, s), 1.61 (3H, d), 1.35-1.24 (4H, m).
- the 1 H NMR results show that the molar ratio of L-tartaric acid to the compound of formula I is 1: 1 in the sample of the crystal form D of the L-tartrate salt.
- the compound of formula I and an equimolar amount of glycolic acid were suspended and stirred in acetone/n-heptane (1:3, v/v) at room temperature for 3 days, and then the solid was separated by centrifugation and vacuum dried at room temperature overnight.
- the X-ray powder diffraction pattern shows that the obtained sample is the crystal form A of the glycolate salt of the compound of formula I.
- the crystal form A of the glycolate salt of the compound of formula I has an X-ray powder diffraction pattern expressed by 2 ⁇ angles, and diffraction peaks and relative intensities of the X-ray powder diffraction pattern can further be shown in Table 25.
- the X-ray powder diffraction pattern of the crystal form A of the glycolate salt is shown in FIG. 61 .
- the DSC pattern shows that the sample has one endothermic peak at 110.1°C.
- the TGA pattern shows that the sample has a weight loss of 3.40% when heated to 150°C.
- the 1 H NMR spectrum data of the crystal form A of the glycolate salt is: 1 H NMR (400 MHz, DMSO- d 6 ) ⁇ 9.12 (1H, s), 8.90 (1H, d), 7.96 (1H, t), 7.79 (1H, dd), 7.72 (1H, d), 7.60 (1H, t), 6.09 (1H, s), 5.60 (1H, t), 4.59 (2H, d), 3.91 (2H, s), 2.21 (3H, s), 1.61 (3H, d), 1.35-1.23 (4H, m).
- the compound of formula I and an equimolar amount of L-malic acid were suspended and stirred in IPA/H 2 O (19:1, v/v) at room temperature for 3 days, and then the solid was separated by centrifugation and vacuum dried at room temperature overnight.
- the X-ray powder diffraction pattern shows that the obtained sample is the crystal form A of the L-malate salt of the compound of formula I.
- the crystal form A of the L-malate salt of the compound of formula I has an X-ray powder diffraction pattern expressed by 2 ⁇ angles, and diffraction peaks and relative intensities of the X-ray powder diffraction pattern can further be shown in Table 26.
- the X-ray powder diffraction pattern of the crystal form A of the L-malate salt is shown in FIG. 64 .
- the DSC pattern shows that the sample has four endothermic peaks at 72.9°C, 122.2°C, 142.1°C, and 222.4°C, and one exothermic peak at 195.9°C.
- the TGA pattern shows that the sample has a weight loss of 2.88% when heated to 50°C, a weight loss of 2.46% when heated from 50°C to 100°C, and a weight loss of 1.31% when heated from 100°C to 150°C.
- the 1 H NMR spectrum data of the crystal form A of the L-malate salt is: 1 H NMR (400 MHz, DMSO- d 6 ) ⁇ 9.13 (1H, s), 8.94 (1H, s), 7.96 (1H, t), 7.79 (1H, dd), 7.72 (1H, d), 7.60 (1H, t), 6.09 (1H, s), 5.61 (1H, t), 4.58 (2H, d), 4.22 (1H, m), 2.63-2.57 (2H, m), 2.22 (3H, s), 1.61 (3H, d), 1.35-1.25 (4H, m).
- the molar ratio of L-malic acid to the compound of formula I is 1:1 in the sample of the crystal form A of the L-malate salt.
- the compound of formula I and an equimolar amount of L-malic acid were suspended and stirred in acetone/n-heptane (1:3, v/v) at room temperature for 3 days, and then the solid was separated by centrifugation and vacuum dried at room temperature overnight.
- the X-ray powder diffraction pattern shows that the obtained sample is the crystal form B of the L-malate salt of the compound of formula I.
- the crystal form B of the L-malate salt of the compound of formula I has an X-ray powder diffraction pattern expressed by 2 ⁇ angles, and diffraction peaks and relative intensities of the X-ray powder diffraction pattern can further be shown in Table 27.
- the X-ray powder diffraction pattern of the crystal form B of the L-malate salt is shown in FIG. 67 .
- the DSC pattern shows that the sample has one endothermic peak at 134.8°C.
- the TGA pattern shows that the sample has a weight loss of 3.40% when heated to 150°C.
- the 1 H NMR spectrum data of the crystal form B of the L-malate salt is: 1 H NMR (400 MHz, DMSO- d 6 ) ⁇ 9.14 (1H, s), 8.96 (1H, s), 7.96 (1H, t), 7.79 (1H, dd), 7.72 (1H, d), 7.60 (1H, t), 6.09 (1H, s), 5.61 (1H, t), 4.63 (2H, d), 4.23 (1H, m), 2.64-2.57 (2H, m), 2.23 (3H, s), 1.61 (3H, d), 1.35-1.26 (4H, m).
- the 1 H NMR results show that the molar ratio of L-malic acid to the compound of formula I is 1: 1 in the sample of the crystal form B of the L-malate salt.
- the compound of formula I and an equimolar amount of hippuric acid were suspended and stirred in acetone/n-heptane (1:3, v/v) at room temperature for 3 days, and then the solid was separated by centrifugation and vacuum dried at room temperature overnight.
- the X-ray powder diffraction pattern shows that the obtained sample is the crystal form A of the hippurate salt of the compound of formula I.
- the crystal form A of the hippurate salt of the compound of formula I has an X-ray powder diffraction pattern expressed by 2 ⁇ angles, and diffraction peaks and relative intensities of the X-ray powder diffraction pattern can further be shown in Table 28.
- the X-ray powder diffraction pattern of the crystal form A of the hippurate salt is shown in FIG. 70 .
- the DSC pattern shows that the sample has three endothermic peaks at 62.4°C, 120.1°C, and 207.0°C.
- the TGA pattern shows that the sample has a weight loss of 3.04% when heated to 150°C.
- the 1 H NMR spectrum data of the crystal form A of the hippurate salt is: 1 H NMR (400 MHz, DMSO- d 6 ) ⁇ 9.12 (1H, s), 8.93-8.80 (2H, m), 7.96 (1H, t), 7.90-7.85 (2H, m), 7.79 (1H, dd), 7.72 (1H, d), 7.60 (1H, t), 7.57-7.53 (1H, m), 7.52-7.46 (2H, m), 6.09 (1H, s), 5.61 (1H, t), 4.63 (2H, d). 3.92 (2H, d), 2.21 (3H, s), 1.61 (3H, d), 1.37-1.22 (4H, m).
- the molar ratio of hippuric acid to the compound of formula I is 1:1.
- the compound of formula I and an equimolar amount of succinic acid were suspended and stirred in MTBE at room temperature for 3 days, and then the solid was separated by centrifugation and vacuum dried at room temperature overnight.
- the X-ray powder diffraction pattern shows that the obtained sample is the crystal form A of the succinate salt of the compound of formula I.
- the crystal form A of the succinate salt of the compound of formula I has an X-ray powder diffraction pattern expressed by 2 ⁇ angles, and diffraction peaks and relative intensities of the X-ray powder diffraction pattern can further be shown in Table 29.
- the DSC pattern shows that the sample has three endothermic peaks at 70.0°C, 124.1°C, and 221.0°C, and one exothermic peak at 189.8°C.
- the TGA pattern shows that the sample has a weight loss of 3.94% when heated to 150°C.
- FIG. 128 is an XRPD pattern of the crystal form A of the succinate salt of the compound of formula I.
- the 1 H NMR spectrum data of the crystal form A of the succinate salt is: 1 H NMR (400 MHz, DMSO- d 6 ) ⁇ 9.12 (1H, s), 8.90 (1H, d), 7.96 (1H, t), 7.80 (1H, dd), 7.72 (1H, d), 7.60 (1H, t), 6.09 (1H, s), 5.60 (1H, m), 4.62 (2H, d), 2.42 (3H, s), 2.21 (3H, s), 1.61 (3H, d), 1.39-1.21 (4H, m).
- the 1 H NMR results show that the molar ratio of succinic acid to the compound of formula I is 1: 1 in the sample of the crystal form A of the succinate salt.
- the compound of formula I and an equimolar amount of succinic acid were suspended and stirred in acetone/n-heptane (1:3, v/v) at room temperature for 3 days, and then the solid was separated by centrifugation and vacuum dried at room temperature overnight.
- the X-ray powder diffraction pattern shows that the obtained sample is the crystal form B of the succinate salt of the compound of formula I.
- the crystal form B of the succinate salt of the compound of formula I has an X-ray powder diffraction pattern expressed by 2 ⁇ angles, and diffraction peaks and relative intensities of the X-ray powder diffraction pattern can further be shown in Table 30.
- the X-ray powder diffraction pattern of the crystal form B of the succinate salt is shown in FIG. 75 .
- the DSC pattern shows that the sample has two endothermic peaks at 105.1°C and 223.3°C.
- the TGA pattern shows that the sample has a weight loss of 4.44% when heated to 150°C.
- the 1 H NMR spectrum data of the crystal form B of the succinate salt is: 1 H NMR (400 MHz, DMSO- d 6 ) ⁇ 9.12 (1H, s), 8.90 (1H, d), 7.96 (1H, t), 7.80 (1H, dd), 7.72 (1H, d), 7.60 (1H, t), 6.09 (1H, s), 5.60 (1H, m), 4.61 (2H, d), 2.42 (5H, s), 2.22 (3H, s), 1.61 (3H, d), 1.35-1.24 (4H, m).
- the 1 H NMR results show that the molar ratio of succinic acid to the compound of formula I is 1:1 in the sample of the crystal form B of the succinate salt.
- the compound of formula I and an equimolar amount of L-ascorbic acid were suspended and stirred in IPA/H 2 O (19:1, v/v) at room temperature for 3 days, and then the solid was separated by centrifugation and vacuum dried at room temperature overnight.
- the X-ray powder diffraction pattern shows that the obtained sample is the crystal form A of the ascorbate salt of the compound of formula I.
- the crystal form A of the ascorbate salt of the compound of formula I has an X-ray powder diffraction pattern expressed by 2 ⁇ angles, and diffraction peaks and relative intensities of the X-ray powder diffraction pattern can further be shown in Table 31.
- Table 31 Diffraction peak number 2 ⁇ angle (°) Relative intensity (%) 1 5.7237 100.00 2 9.2032 18.95 3 11.3077 72.87 4 14.3899 12.14 5 15.5509 22.27 6 16.7168 15.25 7 17.5897 17.58 8 18.8322 18.71 9 20.3077 4.66 10 22.3311 5.36 11 25.9469 17.25
- the DSC pattern shows that the sample has one endothermic peak at 185.7°C and one exothermic peak at 195.8°C.
- the TGA pattern shows that the sample has a weight loss of 4.36% when heated to 150°C.
- FIG. 129 is an XRPD pattern of the crystal form A of the ascorbate salt of the compound of formula I.
- the 1 H NMR spectrum data of the crystal form A of the ascorbate salt is: 1 H NMR (400 MHz, CD 3 OD) ⁇ 9.18 (1H, s), 7.92 (1H, t), 7.74-7.65 (2H, m), 7.54 (1H, t), 6.35 (1H, s), 5.67 (1H, m), 4.72 (0.5H, d), 3.89 (0.5H, d), 3.67 (1H, d), 2.34 (3H, s), 1.68 (3H, d), 1.41-1.35 (4H, m).
- the 1 H NMR results show that the molar ratio of ascorbic acid to the compound of formula I is 0.5:1 in the sample of the crystal form A of the ascorbate salt.
- the compound of formula I and an equimolar amount of L-ascorbic acid were suspended and stirred in EtOAc at room temperature for 3 days, and then the solid was separated by centrifugation and vacuum dried at room temperature overnight.
- the X-ray powder diffraction pattern shows that the obtained sample is the crystal form B of the ascorbate salt of the compound of formula I.
- the crystal form B of the ascorbate salt of the compound of formula I has an X-ray powder diffraction pattern expressed by 2 ⁇ angles, and diffraction peaks and relative intensities of the X-ray powder diffraction pattern can further be shown in Table 32.
- the X-ray powder diffraction pattern of the crystal form B of the ascorbate salt is shown in FIG. 80 .
- the DSC pattern shows that the sample has one endothermic peak at 153.6°C and one exothermic peak at 190.3°C.
- the TGA pattern shows that the sample has a weight loss of 1.33% when heated to 150°C.
- the 1 H NMR spectrum data of the crystal form B of the ascorbate salt is: 1 H NMR (400 MHz, CD 3 OD) ⁇ 9.19 (1H, s), 7.92 (1H, t), 7.73-7.65 (2H, m), 7.53 (1H, t), 6.35 (1H, s), 5.67 (1H, m), 4.74 (1H, d), 3.89 (1H, m), 3.67 (2H, d), 2.34 (3H, s), 1.69 (3H, d), 1.42-1.35 (4H, m).
- the 1 H NMR results show that the molar ratio of L-ascorbic acid to the compound of formula I is 1: 1 in the sample of the crystal form B of the ascorbate salt.
- the compound of formula I and an equimolar amount of adipic acid were suspended and stirred in MTBE at room temperature for 3 days, and then the solid was separated by centrifugation and vacuum dried at room temperature overnight.
- the X-ray powder diffraction pattern shows that the obtained sample is the crystal form A of the adipate salt of the compound of formula I.
- the crystal form A of the adipate salt of the compound of formula I has an X-ray powder diffraction pattern expressed by 2 ⁇ angles, and diffraction peaks and relative intensities of the X-ray powder diffraction pattern can further be shown in Table 33.
- the DSC pattern shows that the sample has one endothermic peak at 88.3°C.
- the TGA pattern shows that the sample has a weight loss of 6.60% when heated to 150°C.
- FIG. 130 is an XRPD pattern of the crystal form A of the adipate salt of the compound of formula I.
- the 1 H NMR spectrum data of the crystal form A of the adipate salt is: 1 H NMR (400 MHz, DMSO- d 6 ) ⁇ 9.12 (1H, s), 8.89 (1H, d), 7.96 (1H, t), 7.80 (1H, m), 7.72 (1H, d), 7.60 (1H, t), 6.09 (1H, s), 5.60 (1H, m), 4.61 (2H, d), 2.21 (7H, m), 1.61 (3H, d), 1.50 (4H, m), 1.35-1.25 (4H, m).
- the molar ratio of adipic acid to the compound of formula I is 1: 1 in the sample of the crystal form A of the adipate salt.
- the compound of formula I and an equimolar amount of p -toluenesulfonic acid monohydrate were suspended and stirred in IPA/H 2 O (19:1, v/v) at room temperature for 3 days, and then the solid was separated by centrifugation and vacuum dried at room temperature overnight.
- the X-ray powder diffraction pattern shows that the obtained sample is the crystal form A of the p -toluenesulfonate salt of the compound of formula I.
- the crystal form A of the p-toluenesulfonate salt of the compound of formula I has an X-ray powder diffraction pattern expressed by 2 ⁇ angles, and diffraction peaks and relative intensities of the X-ray powder diffraction pattern can further be shown in Table 34.
- the X-ray powder diffraction pattern of the crystal form A of the p -toluenesulfonate salt is shown in FIG. 85 .
- the DSC pattern shows that the sample has one endothermic peak at 150.9°C.
- the TGA pattern shows that the sample has a weight loss of 0.76% when heated to 100°C, and a weight loss of 3.07% when heated from 100°C to 170°C.
- the 1 H NMR spectrum data of the crystal form A of the p -toluenesulfonate salt is: 1 H NMR (400 MHz, DMSO- d 6 ) ⁇ 9.38 (1H, s), 8.00 (1H, t), 7.87 (1H, dd), 7.77 (1H, d), 7.67 (1H, t), 7.47 (2H, dd), 7.11 (2H, d), 6.15 (1H, s), 5.81 (1H, t), 4.63 (2H, d), 2.44 (3H, s), 2.29 (3H, s), 1.68 (3H, d), 1.41-1.27 (4H, m).
- the molar ratio ofp-toluenesulfonic acid to the compound of formula I is 1:1 in the sample of the crystal form A of the p-toluenesulfonate salt.
- the compound of formula I and an equimolar amount of benzenesulfonic acid were suspended and stirred in MTBE at room temperature for 3 days, and then the solid was separated by centrifugation and vacuum dried at room temperature overnight.
- the X-ray powder diffraction pattern shows that the obtained sample is the crystal form A of the benzenesulfonate salt of the compound of formula I.
- the crystal form A of the benzenesulfonate salt of the compound of formula I has an X-ray powder diffraction pattern expressed by 2 ⁇ angles, and diffraction peaks and relative intensities of the X-ray powder diffraction pattern can further be shown in Table 35.
- the DSC pattern shows that the sample has one endothermic peak at 111.7°C.
- the TGA pattern shows that the sample has a weight loss of 2.55% when heated to 80°C, and a weight loss of 6.23% when heated from 80°C to 150°C.
- FIG. 131 is an XRPD pattern of the crystal form A of the benzenesulfonate salt of the compound of formula I in Example 28.
- the 1 H NMR spectrum data of the crystal form A of the benzenesulfonate salt is: 1 H NMR (400 MHz, DMSO- d 6 ) ⁇ 9.40 (1H, s), 8.01 (1H, t), 7.87 (1H, dd), 7.77 (1H, d), 7.67 (1H, t), 7.62-7.56 (2H, m), 7.35-7.28 (3H, m), 6.16 (1H, s), 5.82 (1H, m), 4.64 (2H, d), 2.45 (3H, s), 1.68 (3H, d), 1.42-1.28 (4H, m).
- the molar ratio of benzenesulfonic acid to the compound of formula I is 1:1 in the sample of the crystal form A of the benzenesulfonate salt.
- the compound of formula I and an equimolar amount of oxalic acid were suspended and stirred in Acetone/n-heptane (1:3, v/v) at room temperature for 3 days, and then the solid was separated by centrifugation and vacuum dried at room temperature overnight.
- the X-ray powder diffraction pattern shows that the obtained sample is the crystal form A of the oxalate salt of the compound of formula I.
- the crystal form A of the oxalate salt of the compound of formula I has an X-ray powder diffraction pattern expressed by 2 ⁇ angles, and diffraction peaks and relative intensities of the X-ray powder diffraction pattern can further be shown in Table 36.
- the X-ray powder diffraction pattern of the crystal form A of the oxalate salt is shown in FIG. 90 .
- the DSC pattern shows that the sample has two endothermic peaks at 103.4°C and 141.6°C.
- the TGA pattern shows that the sample has a weight loss of 5.88% when heated to 100°C.
- the 1 H NMR spectrum data of the crystal form A of the oxalate salt is: 1 H NMR (400 MHz, DMSO- d 6 ) ⁇ 9.21 (1H, s), 7.98 (1H, t), 7.82 (1H, dd), 7.73 (1H, d), 7.62 (1H, t), 6.11 (1H, s), 5.67 (1H, m), 4.60 (2H, d), 2.28 (3H, s), 1.68 (3H, d), 1.37-1.22 (4H, m).
- the molar ratio of solvent EtOAc to the compound of formula I is 0.15:1 (approximately 2.3wt%) in the sample of the crystal form A of the oxalate salt.
- HPLC/IC results show that in the sample of the crystal form A of the oxalate salt, the molar ratio of oxalic acid to the compound of formula I is 1:1.
- the compound of formula I and an equimolar amount of 2-hydroxyethanesulfonic acid were suspended and stirred in EtOAc at room temperature for 3 days, and then the solid was separated by centrifugation and vacuum dried at room temperature overnight.
- the X-ray powder diffraction pattern shows that the obtained sample is the crystal form A of the 2-hydroxyethanesulfonate salt of the compound of formula I.
- the crystal form A of the 2-hydroxyethanesulfonate salt of the compound of formula I has an X-ray powder diffraction pattern expressed by 2 ⁇ angles, and diffraction peaks and relative intensities of the X-ray powder diffraction pattern can further be shown in Table 37.
- the X-ray powder diffraction pattern of the crystal form A of the 2-hydroxyethanesulfonate salt is shown in FIG. 93 .
- the DSC pattern shows that the sample has an endothermic peak at 203.5°C.
- the TGA pattern shows that the sample has a weight loss of 1.61% when heated to 150°C.
- the 1 H NMR spectrum data of the crystal form A of the 2-hydroxyethanesulfonate salt is: 1 H NMR (400 MHz, DMSO- d 6 ) ⁇ 9.39 (1H, s), 8.00 (1H, t), 7.86 (1H, dd), 7.77 (1H, d), 7.66 (1H, t), 6.15 (1H, s), 5.81 (1H, m), 4.65 (2H, d), 2.44 (3H, s), 2.36 (3H, dd), 1.68 (3H, d), 1.42-1.27 (4H, m), 1.05 (3H, s).
- the molar ratio of 2-hydroxyethanesulfonic acid to the compound of formula I is 1:1 in the sample of the crystal form A of the 2-hydroxyethanesulfonate salt.
- the gas-solid permeation test was carried out with different solvents. About 20 mg of each sample of the compound of formula I was weighed into a 3 mL vial, and about 3 mL of solvent was added to a 20 mL vial. The 3 mL vial was then placed open in the 20 mL vial, and the 20 mL vial was sealed. The solid was collected after 10 days of standing at room temperature and subjected to XRPD testing. The test results are shown in Table 38. The crystal form A of the compound of formula I was obtained through the gas-solid permeation test.
- the gas-liquid permeation test was carried out with different solvents. About 20 mg of each sample of the compound of formula I was weighed into a 3 mL vial, and 0.1 to 0.2 mL of a solvent was added for dissolution to obtain a clear solution. About 3 mL of anti-solvent was added to a 20 mL vial, and the 3 mL vial containing the clear solution was then placed open in the 20 mL vial, and the 20 mL vial was sealed and allowed to stand at room temperature. The resulting solid was collected and subjected to XRPD testing. The test results are shown in Table 39. The crystal form A of the compound of formula I was obtained through the gas-liquid permeation test.
- the room temperature suspended stirring test was carried out with different solvents. About 20 mg of each sample of the compound of formula I was weighed into an HPLC glass vial, and 0.5 mL of the solvent listed in Table 40 was respectively added thereto. After the resulting turbid solution was magnetically stirred at room temperature for about 7 days, the solid sample was separated by centrifugation and subjected to XRPD testing. The test results are shown in Table 40. The crystal form A of the compound of formula I was obtained through the room temperature suspended stirring test.
- the 50°C suspended stirring test was carried out with different solvents. About 20 mg of each sample of the compound of formula I was weighed into an HPLC glass vial, and 0.5 mL of the solvent listed in Table 41 was respectively added thereto. After the resulting suspension was magnetically stirred at 50°C for about 3 days, the solid sample was separated by centrifugation and subjected to XRPD testing. The test results are shown in Table 41. The crystal form A of the compound of formula I was obtained through the 50°C suspended stirring test.
- the slow cooling test was carried out with different solvent systems. About 20 mg of each sample of the compound of formula I was weighed into an HPLC vial, and 0.5 mL of the solvent listed in Table 43 was respectively added thereto. The mixture was stirred and equilibrated at 50°C for about 2 hours, and then filtered (using a 0.45 ⁇ m PTFE filter head to filter) to obtain the supernatant. The resulting supernatant was placed in a bioincubator, and cooled from 50°C to 5°C at a rate of 0.05°C/min and maintained at a constant temperature of 5°C. The clear solution was transferred to a constant temperature of -20°C.
- the anti-solvent addition test was carried out with different solvents. About 20 mg of each sample of the compound of formula I was respectively weighed into a 20 mL vial, and the solid was completely dissolved with 0.1 to 0.5 mL of solvent (see Table 44). To this clear solution, the anti-solvent in Table 44 was added dropwise with stirring until solids precipitated out, or when the total volume of anti-solvent was added to 5 mL, the sample without solid precipitate was allowed to volatilize at room temperature. The precipitated solid was separated and subjected to XRPD testing. The test results are shown in Table 44. The crystal form A of the compound of formula I was obtained through the anti-solvent addition test.
- control compounds 1 and 2 refers to patent WO2019122129A1 . Their structures are as follows:
- the compound to be tested was prepared into a 10 mM stock solution with DMSO, and the compound was serially diluted using 1X test buffer. 0.1 ⁇ L of the compound solution with different concentrations was transferred to a 384-well plate. 5 ⁇ L of GST-KRAS G12C was added to the 384-well plate, and centrifuged at 1000 rpm for 1 min. 5 ⁇ L of His-SOS1 was added to the 384-well plate, centrifuged at 1000 rpm for 1 min, and incubated at room temperature for 15 min.
- Intracellular western blot quantitative analysis was used to detect the inhibitory level of compounds on ERK phosphorylation in DLD-1 cells.
- DLD-1 cells (ATCC, CCL-221) were seeded in a T75 culture flask at 2.5 ⁇ 10 6 cells/flask, and cultured in a RPMI 1640 medium containing 10% FBS for 2 days. On day 3, the cells were seeded on a 384-well plate, and cultured overnight at 37°C, 5% CO 2 . After overnight culture, the plate was added with serially diluted compounds (the final content of DMSO was 0.5%), the negative group was added with DMSO, and incubated in a 37°C, 5% CO 2 incubator.
- the cells were fixed, washed once with PBS, treated to disrupt membranes, and blocked at room temperature for 1 h. The blocking solution was removed.
- the plate was added with primary antibody (CST, Cat. No. #4370S), and incubated overnight at 4°C.
- the plate was washed 3 times with PBST (PBS solution added with 0.05% Tween-20), and soaked for 2 min each time.
- the plate was added with secondary antibody (LI-COR, Cat. No. 926-32211), and incubated at room temperature in the dark.
- the plate was washed 3 times with PBST, and soaked for 2 min each time.
- Relative signal 800 - channel signal values / 700 - channel signal values .
- Relative expression level of ERK phosphorylation (test compound - control compound I)/(DMSO group - control compound I)
- IC 50 values were calculated using Graphpad 5 software.
- H358 cells were seeded in a T75 culture flask, and cultured in a RPMI 1640 medium containing 10% FBS for 2 days for subsequent experiments in which the cells would be cultured or seeded on a 384-well plate.
- IC 50 values were calculated using Graphpad 5 software.
- the human liver microsome stability test was performed by incubating the compound and human liver microsomes in vitro.
- the compound to be tested was prepared into a 10 mM stock solution in DMSO solvent, and then the compound was diluted to 0.5 mM with acetonitrile.
- Human liver microsomes (Corning) were diluted with PBS into a microsome/buffer solution, and the solution was used to dilute 0.5 mM compound into a working solution, in which the concentration of the compound was 1.5 ⁇ M, and the concentration of human liver microsomes was 0.75 mg/mL.
- a deep-well plate was taken, 30 ⁇ L of the working solution was added per well, and then 15 ⁇ L of pre-heated 6 mM NADPH solution was added thereto to initiate a reaction, and the reaction was incubated at 37°C. At 0, 5, 15, 30, and 45 min of the incubation, 135 ⁇ L of acetonitrile was added to the corresponding wells to terminate the reaction. After the reaction was terminated with acetonitrile at the last time point of 45 min, the deep-well plate was vortexed for 10 min (600 rpm/min), and then centrifuged for 15 min. After centrifugation, the supernatant was collected, and added with purified water in a ratio of 1:1 to perform LC-MS/MS detection.
- a ratio of a peak area of compound to a peak area of internal standard at each time point was obtained, and the peak area ratios of the compound at 5, 15, 30, and 45 min were compared with the peak area ratio at 0 min to calculate the remaining percentage of the compound at each time point.
- T 1/2 was calculated by using GraphPad 5 software.
- cytochrome P450 subtype CYP3A4 two substrates of midazolam and testosterone
- CYP450 cytochrome P450 subtype CYP3A4
- the compound to be tested was prepared into a 10 mM stock solution in DMSO solvent
- the CYP3A4 inhibitor ketoconazole was prepared as 10 mM, 2.5 mM, and 2.5 mM stock solutions in DMSO solvent.
- the test compound and ketoconazole were diluted to 400-fold final concentration (compound: 10 ⁇ M, ketoconazole: 2.5 ⁇ M) with acetonitrile.
- a human liver microsome solution at a concentration of 0.2 mg/mL was prepared with potassium phosphate buffer on ice.
- a solution of the compound to be tested and a control inhibitor (control compound) solution at 2-fold final concentration were prepared with the human liver microsome solution on ice.
- the test wells were added with 30 mL of the test compound solution and the control inhibitor solution respectively, and then added with 15 mL of the substrate for duplication.
- a 96-well assay plate and a NADPH solution were incubated at 37 °C for 5 min, and 15 ⁇ L of pre-heated 8 mM NADPH solution was added to the assay plate to initiate the reaction.
- a CYP3A4 assay plate was pre-incubated at 37°C for 5 min.
- the plate was added with 120 ⁇ L of acetonitrile to terminate the reaction, and after quenching, the plate was shaken on a shaker (IKA, MTS 2/4) for 10 min (600 rpm/min), and then centrifuged for 15 min. After centrifugation, the supernatant was collected, and added with purified water in a ratio of 1:1 to perform LC-MS/MS detection. A ratio of a peak area of compound to a peak area of internal standard was obtained, and the peak area ratio of the compound was compared with the peak area ratio of the control inhibitor to calculate the inhibition rate.
- Plasma protein binding rate of compounds was detected by equilibrium dialysis (HTDialysis, HTD 96b).
- the compound was prepared into a 0.5 nM stock solution with DMSO, and then 25-fold diluted with 0.05 M sodium phosphate buffer as a working solution.
- a blank 96-well plate was taken and preloaded with 380 ⁇ L of plasma per well.
- the plasma was then added with the working solution at 20 ⁇ L/well and mixed well, with the compound at a final concentration of 1 ⁇ M, containing 0.2% DMSO per well.
- each dialysis chamber 100 ⁇ L of 0.05 M sodium phosphate buffer was added to the receiver-side of each dialysis chamber (HTD 96b), and then 100 ⁇ L of plasma containing the compound was added to the supply-side.
- the dialysis chamber was covered with a plastic lid, shaken, and incubated at 37°C for 5 h.
- mice Male ICR mice (20 to 25 g) were used, and fasted overnight. Three mice were taken and orally administered by gavage (10 mg/kg). Blood was collected before the administration, and at 15 min, 30 min, 1 h, 2 h, 4 h, 8 h, and 24 h after the administration. 6,800 g of the blood samples were centrifuged at 2 to 8°C for 6 min, and plasma was collected and stored at -80°C. The plasma at each time point was taken and added with an acetonitrile solution containing internal standard in 3 to 5 times the amount, vortexed and mixed for 1 min, and centrifuged at 13,000 rpm/min at 4°C for 10 min. The supernatant was collected, added with water in 3 times the amount, and mixed. An appropriate amount of the mixture was taken for LC-MS/MS analysis. The main pharmacokinetic parameters were analyzed using WinNonlin 7.0 software with non-compartmental model.
- mice oral administration by gavage
- Cmax ng/mL
- Tmax ng/mL
- AUC 0-t h * ng/mL
- T 1/2 hr
- Control compound 1 176 0.25 365 1.35
- Control compound 2 669 0.50 1002 0.96
- Compound of formula I 1442 1.00 3080 0.97
- Mia Paca-2 cells in a logarithmic phase were resuspended in serum-free DMEM, and then mixed with Matrigel in a ratio of 1: 1.
- 1 ⁇ 10 7 Mia Paca-2 cells were inoculated subcutaneously at the right flank at 100 ⁇ L per mouse, and tumor growth was observed regularly.
- the mice were randomly divided into a model group and an administration group (single drug, in combination with trametinib) based on the tumor size and body weight. The tumor size and body weight were measured and recorded before and during the administration. After the treatment, the tumor size in the model group was compared with that in the administration group to determine the efficacy.
- the tumor inhibitory ability of the compound of formula I at the tumor weight level is shown in Table 52.
- Drug Dose (mg/kg) Average tumor weight at the end of the treatment (g) Tumor weight inhibition rate (relative to the vehicle group) Vehicle -- 1.14 -- Control compound 2 50, BID 0.46 59% Compound of formula I 25, BID 0.35 70% Compound of formula I 50, BID 0.27 76% Compound of formula I + Trametinib Compound of formula I: 25, BID Trametinib: 0.125, BID 0.13 89% Trametinib 0.125, BID 0.22 80% "--" in the table means no testing.
- NCI-H1975 tumor cells were cultured in an incubator at 37°C and 5% CO 2 using medium containing inactivated RPMI 1640 + 10% FBS. After reaching a confluency rate of 80 to 90%, the cells were passaged by subculturing. After one week of adaptive feeding in mice, NCI-H1975 cells in logarithmic phase were inoculated subcutaneously into the right flank of mice at a concentration of 5 ⁇ 10 6 /100 ⁇ L. Tumor growth was regularly monitored until the tumors reached an average volume of 100 to 150 mm 3 . The mice were then randomly divided into model group and administration group (combined with osimertinib) based on tumor size and weight of mice.
- Tumor size and animal weight were measured and recorded before and during the administration process. The differences in tumor size between the model group and administration group were compared to determine the efficacy.
- the Mann Whitney test method was used in Graph Pad 8.0 to compare the significance difference between the combined administration group and the single-drug group of osimertinib, as shown in Table 53.
- the results show that compared with the single-drug group of osimertinib, when the compound I-1 (7.5 mg/kg, BID or 25 mg/kg, BID) is administered in combination with osimertinib (1 mg/kg, QD) at the end of the treatment, the average tumor volume of the animal is significantly reduced, and the difference is statistically significant.
- the anti-tumor efficacy of the combination of the compound I-1 and osimertinib is significantly better than that of single-drug administration, and the combined administration of the compound I-1 (25 mg/kg, BID) and osimertinib (1 mg/kg, QD) has a synergistic effect.
- mice After one week of adaptive feeding of mice, LOVO cells in a logarithmic phase were resuspended in serum-free F12K, 5 ⁇ 10 6 LOVO cells were inoculated subcutaneously at the right flank at 100 ⁇ L per mouse, and tumor growth was observed regularly. When the tumor grew to an average volume of 150 to 200 mm 3 , the mice were randomly divided into a model group and an administration group based on the tumor size and body weight. The tumor size and body weight were measured and recorded before and during the administration. After the treatment, the tumor size in the model group was compared with that in the administration group to determine the efficacy.
- the tumor inhibitory ability of the compound of formula I at the tumor weight level is shown in Table 54.
- Table 54 Drug Dose (mg/kg) At the end of treatment Average tumor weight (g) Tumor weight inhibition rate (relative to the vehicle group) Vehicle -- 1.39 -- Control compound 2 50, BID 1.08 23% Compound of formula I 50, BID 0.75 46% "--" in the table means no testing.
- the experimental results indicate that the compound of the present disclosure has a significant inhibitory effect on LOVO tumor tissue growth, which is better than that of the control compound II.
- Rotating mixing was carried out at 37°C at a solid feed concentration of 10 mg/mL (calculated as the compound of formula I).
- the solubility of the crystal form A, the crystal form A of the fumarate salt, the crystal form B of the citrate salt, the crystal form A of the methanesulfonate salt, and the crystal form A of the ethanesulfonate salt of the compound of formula I in four systems water, SGF, FaSSIF, and FeSSIF was measured at different time points (1, 4, and 24 hours). After sampling at each time point, the samples were centrifuged (10000 rpm) and filtered (0.45 ⁇ m PTFE filter head), and the HPLC concentration and pH value of the filtrate were measured.
- the solid samples after centrifugation were tested for XRPD.
- the results of the solubility test are summarized in Table 55.
- the solubility curves are shown in FIG. @.
- the XRPD results for the samples after the solubility test are shown in FIG. 96 to FIG. 112 .
- the results show that the crystal form A, the crystal form A of the fumarate salt, the crystal form B of the citrate salt, the crystal form A of the methanesulfonate salt, and the crystal form A of the ethanesulfonate salt of the compound of formula I all have high solubility in the four solvents.
- the hygroscopicity of the crystal form A of the fumarate salt, the crystal form B of the citrate salt, the crystal form A of the methanesulfonate salt, the crystal form A of the ethanesulfonate salt, and the crystal form A of the compound of formula I was evaluated by a dynamic vapor sorption analyzer (DVS). Starting from 0%RH or room humidity, the test collected the mass change percentage of the sample as the humidity changed (0%RH to 95%RH) under constant temperature conditions of 25°C. The results of the DVS test and the XRPD results of the samples before and after the DVS test are shown in FIG. 113 to FIG. 122 .
- the crystal form A of the compound of formula I and the crystal form A of the fumarate salt rapidly dehydrate, and when higher than 10% RH, the samples absorb more moisture and gain more weight with the increase of humidity.
- the crystal form B of the citrate salt, the crystal form A of the methanesulfonate salt, and the crystal form A of the ethanesulfonate salt are slightly hygroscopic. No change in crystal form is observed for all samples after the DVS test.
- the XRPD results are listed in FIG. 123 to FIG. 127 .
- the results in Table 56 show that no significant decrease is observed in all samples after the solid state stability test, and the crystal forms of the samples are consistent before and after the test.
- crystal form A of the fumarate salt, the crystal form B of the citrate salt, the crystal form A of the methanesulfonate salt, the crystal form A of the ethanesulfonate salt, and the crystal form A of the compound of formula I have good stability.
Landscapes
- Chemical & Material Sciences (AREA)
- Health & Medical Sciences (AREA)
- Organic Chemistry (AREA)
- Life Sciences & Earth Sciences (AREA)
- General Health & Medical Sciences (AREA)
- Medicinal Chemistry (AREA)
- Pharmacology & Pharmacy (AREA)
- Animal Behavior & Ethology (AREA)
- Public Health (AREA)
- Veterinary Medicine (AREA)
- Physics & Mathematics (AREA)
- Immunology (AREA)
- Pathology (AREA)
- Analytical Chemistry (AREA)
- Biochemistry (AREA)
- General Physics & Mathematics (AREA)
- Nuclear Medicine, Radiotherapy & Molecular Imaging (AREA)
- Chemical Kinetics & Catalysis (AREA)
- General Chemical & Material Sciences (AREA)
- Epidemiology (AREA)
- Engineering & Computer Science (AREA)
- Bioinformatics & Cheminformatics (AREA)
- Spectroscopy & Molecular Physics (AREA)
- Oncology (AREA)
- Hematology (AREA)
- Library & Information Science (AREA)
- Dermatology (AREA)
- Cardiology (AREA)
- Heart & Thoracic Surgery (AREA)
- Crystallography & Structural Chemistry (AREA)
- Pharmaceuticals Containing Other Organic And Inorganic Compounds (AREA)
- Organic Low-Molecular-Weight Compounds And Preparation Thereof (AREA)
- Medicines That Contain Protein Lipid Enzymes And Other Medicines (AREA)
Applications Claiming Priority (2)
| Application Number | Priority Date | Filing Date | Title |
|---|---|---|---|
| CN202210946052 | 2022-08-08 | ||
| PCT/CN2023/111760 WO2024032615A1 (fr) | 2022-08-08 | 2023-08-08 | Forme cristalline d'un composé pyridinopyrimidinone, sel acide de celle-ci, forme cristalline d'un sel acide de celle-ci et utilisation |
Publications (1)
| Publication Number | Publication Date |
|---|---|
| EP4570800A1 true EP4570800A1 (fr) | 2025-06-18 |
Family
ID=89782952
Family Applications (1)
| Application Number | Title | Priority Date | Filing Date |
|---|---|---|---|
| EP23851836.9A Pending EP4570800A1 (fr) | 2022-08-08 | 2023-08-08 | Forme cristalline d'un composé pyridinopyrimidinone, sel acide de celle-ci, forme cristalline d'un sel acide de celle-ci et utilisation |
Country Status (6)
| Country | Link |
|---|---|
| EP (1) | EP4570800A1 (fr) |
| JP (1) | JP2025526715A (fr) |
| KR (1) | KR20250046312A (fr) |
| CN (1) | CN117534667A (fr) |
| AU (1) | AU2023320677A1 (fr) |
| WO (1) | WO2024032615A1 (fr) |
Family Cites Families (4)
| Publication number | Priority date | Publication date | Assignee | Title |
|---|---|---|---|---|
| RS64167B1 (sr) * | 2017-12-21 | 2023-05-31 | Boehringer Ingelheim Int | Benzilamino supstituisani piridopirimidinoni i derivati kao sos1 inhibitori |
| KR20230144065A (ko) * | 2021-02-08 | 2023-10-13 | 우한 휴먼웰 이노베이티브 드러그 리서치 앤드 디벨롭먼트 센터 리미티드 컴퍼니 | 피리도피리미디논계 유도체 및 이의 제조 방법과 용도 |
| CN113200981A (zh) * | 2021-02-10 | 2021-08-03 | 杭州英创医药科技有限公司 | 作为sos1抑制剂的杂环化合物 |
| WO2023041049A1 (fr) * | 2021-09-17 | 2023-03-23 | 江苏先声药业有限公司 | Composé hétérocyclique utilisé en tant qu'inhibiteur de sos1 et ses utilisations |
-
2023
- 2023-08-08 AU AU2023320677A patent/AU2023320677A1/en active Pending
- 2023-08-08 JP JP2025507426A patent/JP2025526715A/ja active Pending
- 2023-08-08 CN CN202310995677.2A patent/CN117534667A/zh active Pending
- 2023-08-08 EP EP23851836.9A patent/EP4570800A1/fr active Pending
- 2023-08-08 WO PCT/CN2023/111760 patent/WO2024032615A1/fr not_active Ceased
- 2023-08-08 KR KR1020257007416A patent/KR20250046312A/ko active Pending
Also Published As
| Publication number | Publication date |
|---|---|
| JP2025526715A (ja) | 2025-08-15 |
| WO2024032615A1 (fr) | 2024-02-15 |
| KR20250046312A (ko) | 2025-04-02 |
| AU2023320677A1 (en) | 2025-02-20 |
| CN117534667A (zh) | 2024-02-09 |
Similar Documents
| Publication | Publication Date | Title |
|---|---|---|
| EP4640689A1 (fr) | Forme cristalline d'un inhibiteur de kras g12d et son procédé de préparation | |
| EP3615522B1 (fr) | Composés de c5-quinazoleine et leur utilisation pour la traitenet de la cancer. | |
| EP3179858B1 (fr) | Formes et compositions d'un inhibiteur d'erk | |
| JP2019518776A (ja) | Egfr阻害剤としてのアニリンピリミジン化合物の結晶 | |
| KR20210029165A (ko) | 비아릴에테르형 퀴나졸린 유도체 | |
| EP2870154A1 (fr) | Forme solide du sel de choline de vemurafénib | |
| EP3430004B1 (fr) | Formes solides de sels de nilotinib | |
| TW202545956A (zh) | 吡啶並嘧啶類衍生物的晶型、製備方法及其應用 | |
| WO2022033563A1 (fr) | Composé inhibiteur de jak et son utilisation | |
| EP3988546A1 (fr) | Sels de composés, leurs formes cristallines, procédé de préparation correspondant et utilisation associée | |
| EP4570800A1 (fr) | Forme cristalline d'un composé pyridinopyrimidinone, sel acide de celle-ci, forme cristalline d'un sel acide de celle-ci et utilisation | |
| WO2015083059A1 (fr) | Formes de l'inhibiteur du récepteur du facteur de croissance épidermique (egfr) | |
| EP4725947A1 (fr) | Forme saline et forme cristalline d'un inhibiteur de kinase plk1, son procédé de préparation et son utilisation | |
| CA3263285A1 (fr) | Forme cristalline du composé pyridinopyrimidinone, de son sel acide, de sa forme cristalline et de son utilisation | |
| WO2013181251A1 (fr) | Sel de chlorhydrate de crizotinib sous forme cristalline | |
| EP4467536A1 (fr) | Forme cristalline d'un dérivé d'isoindoline contenant du soufre | |
| WO2015081463A1 (fr) | Formes d'inhibiteurs du recepteur du facteur de croissance epidermique (egfr) | |
| TW202517624A (zh) | Mek免疫腫瘤抑制劑醫藥組合物 | |
| CN119384423A (zh) | 4-[(5-氯吡啶-2-基)甲氧基]-1-[3-(丙烷-2-基)-1H,2H,3H,4H,5H-[1,4]二氮杂环庚三烯并[1,7-a]吲哚-9-基]-1,2-二氢吡啶-2-酮及其盐的晶型、制备方法及其用途 | |
| EP3845534A1 (fr) | Forme de sel et forme cristalline d'un nouveau composé azatricyclique et utilisation associée | |
| WO2024214044A1 (fr) | Complexes multicomposants comprenant des sels, des hydrates et des solvates d'inupadenant | |
| WO2025124488A1 (fr) | Formes cristallines d'un composé ayant des cycles à cinq et six chaînons fusionnés, leur procédé de préparation et leur utilisation | |
| JP2025509818A (ja) | Shp2阻害剤の結晶性塩形態 | |
| EP4714947A1 (fr) | Forme cristalline d'un composé pyrimido azacyclo, son procédé de préparation et son utilisation | |
| EP4653445A1 (fr) | Inhibiteur de cdk et forme cristalline de sel pharmaceutiquement acceptable de celui-ci et utilisation associée |
Legal Events
| Date | Code | Title | Description |
|---|---|---|---|
| STAA | Information on the status of an ep patent application or granted ep patent |
Free format text: STATUS: THE INTERNATIONAL PUBLICATION HAS BEEN MADE |
|
| PUAI | Public reference made under article 153(3) epc to a published international application that has entered the european phase |
Free format text: ORIGINAL CODE: 0009012 |
|
| STAA | Information on the status of an ep patent application or granted ep patent |
Free format text: STATUS: REQUEST FOR EXAMINATION WAS MADE |
|
| 17P | Request for examination filed |
Effective date: 20250127 |
|
| AK | Designated contracting states |
Kind code of ref document: A1 Designated state(s): AL AT BE BG CH CY CZ DE DK EE ES FI FR GB GR HR HU IE IS IT LI LT LU LV MC ME MK MT NL NO PL PT RO RS SE SI SK SM TR |
|
| DAV | Request for validation of the european patent (deleted) | ||
| DAX | Request for extension of the european patent (deleted) |