EP4571285A2 - Mesure in situ de nitrate dans le sol - Google Patents
Mesure in situ de nitrate dans le sol Download PDFInfo
- Publication number
- EP4571285A2 EP4571285A2 EP25156386.2A EP25156386A EP4571285A2 EP 4571285 A2 EP4571285 A2 EP 4571285A2 EP 25156386 A EP25156386 A EP 25156386A EP 4571285 A2 EP4571285 A2 EP 4571285A2
- Authority
- EP
- European Patent Office
- Prior art keywords
- porewater
- optical flow
- flow cell
- wavelength
- soil
- Prior art date
- Legal status (The legal status is an assumption and is not a legal conclusion. Google has not performed a legal analysis and makes no representation as to the accuracy of the status listed.)
- Pending
Links
Images


Classifications
-
- G—PHYSICS
- G01—MEASURING; TESTING
- G01N—INVESTIGATING OR ANALYSING MATERIALS BY DETERMINING THEIR CHEMICAL OR PHYSICAL PROPERTIES
- G01N1/00—Sampling; Preparing specimens for investigation
- G01N1/02—Devices for withdrawing samples
-
- E—FIXED CONSTRUCTIONS
- E02—HYDRAULIC ENGINEERING; FOUNDATIONS; SOIL SHIFTING
- E02D—FOUNDATIONS; EXCAVATIONS; EMBANKMENTS; UNDERGROUND OR UNDERWATER STRUCTURES
- E02D1/00—Investigation of foundation soil in situ
- E02D1/02—Investigation of foundation soil in situ before construction work
- E02D1/06—Sampling of ground water
-
- G—PHYSICS
- G01—MEASURING; TESTING
- G01N—INVESTIGATING OR ANALYSING MATERIALS BY DETERMINING THEIR CHEMICAL OR PHYSICAL PROPERTIES
- G01N1/00—Sampling; Preparing specimens for investigation
- G01N1/02—Devices for withdrawing samples
- G01N1/10—Devices for withdrawing samples in the liquid or fluent state
- G01N1/14—Suction devices, e.g. pumps; Ejector devices
-
- G—PHYSICS
- G01—MEASURING; TESTING
- G01N—INVESTIGATING OR ANALYSING MATERIALS BY DETERMINING THEIR CHEMICAL OR PHYSICAL PROPERTIES
- G01N15/00—Investigating characteristics of particles; Investigating permeability, pore-volume or surface-area of porous materials
- G01N15/10—Investigating individual particles
- G01N15/14—Optical investigation techniques, e.g. flow cytometry
- G01N15/1434—Optical arrangements
- G01N15/1436—Optical arrangements the optical arrangement forming an integrated apparatus with the sample container, e.g. a flow cell
-
- G—PHYSICS
- G01—MEASURING; TESTING
- G01N—INVESTIGATING OR ANALYSING MATERIALS BY DETERMINING THEIR CHEMICAL OR PHYSICAL PROPERTIES
- G01N15/00—Investigating characteristics of particles; Investigating permeability, pore-volume or surface-area of porous materials
- G01N15/10—Investigating individual particles
- G01N15/14—Optical investigation techniques, e.g. flow cytometry
- G01N15/1468—Optical investigation techniques, e.g. flow cytometry with spatial resolution of the texture or inner structure of the particle
- G01N15/147—Optical investigation techniques, e.g. flow cytometry with spatial resolution of the texture or inner structure of the particle the analysis being performed on a sample stream
-
- G—PHYSICS
- G01—MEASURING; TESTING
- G01N—INVESTIGATING OR ANALYSING MATERIALS BY DETERMINING THEIR CHEMICAL OR PHYSICAL PROPERTIES
- G01N21/00—Investigating or analysing materials by the use of optical means, i.e. using sub-millimetre waves, infrared, visible or ultraviolet light
- G01N21/17—Systems in which incident light is modified in accordance with the properties of the material investigated
- G01N21/25—Colour; Spectral properties, i.e. comparison of effect of material on the light at two or more different wavelengths or wavelength bands
- G01N21/27—Colour; Spectral properties, i.e. comparison of effect of material on the light at two or more different wavelengths or wavelength bands using photo-electric detection ; circuits for computing concentration
- G01N21/274—Calibration, base line adjustment, drift correction
-
- G—PHYSICS
- G01—MEASURING; TESTING
- G01N—INVESTIGATING OR ANALYSING MATERIALS BY DETERMINING THEIR CHEMICAL OR PHYSICAL PROPERTIES
- G01N21/00—Investigating or analysing materials by the use of optical means, i.e. using sub-millimetre waves, infrared, visible or ultraviolet light
- G01N21/17—Systems in which incident light is modified in accordance with the properties of the material investigated
- G01N21/25—Colour; Spectral properties, i.e. comparison of effect of material on the light at two or more different wavelengths or wavelength bands
- G01N21/31—Investigating relative effect of material at wavelengths characteristic of specific elements or molecules, e.g. atomic absorption spectrometry
- G01N21/33—Investigating relative effect of material at wavelengths characteristic of specific elements or molecules, e.g. atomic absorption spectrometry using ultraviolet light
-
- G—PHYSICS
- G01—MEASURING; TESTING
- G01N—INVESTIGATING OR ANALYSING MATERIALS BY DETERMINING THEIR CHEMICAL OR PHYSICAL PROPERTIES
- G01N33/00—Investigating or analysing materials by specific methods not covered by groups G01N1/00 - G01N31/00
- G01N33/24—Earth materials
- G01N33/245—Earth materials for agricultural purposes
-
- G—PHYSICS
- G01—MEASURING; TESTING
- G01N—INVESTIGATING OR ANALYSING MATERIALS BY DETERMINING THEIR CHEMICAL OR PHYSICAL PROPERTIES
- G01N33/00—Investigating or analysing materials by specific methods not covered by groups G01N1/00 - G01N31/00
- G01N33/24—Earth materials
- G01N33/246—Earth materials for water content
-
- G—PHYSICS
- G01—MEASURING; TESTING
- G01N—INVESTIGATING OR ANALYSING MATERIALS BY DETERMINING THEIR CHEMICAL OR PHYSICAL PROPERTIES
- G01N1/00—Sampling; Preparing specimens for investigation
- G01N1/02—Devices for withdrawing samples
- G01N1/10—Devices for withdrawing samples in the liquid or fluent state
- G01N2001/1031—Sampling from special places
-
- G—PHYSICS
- G01—MEASURING; TESTING
- G01N—INVESTIGATING OR ANALYSING MATERIALS BY DETERMINING THEIR CHEMICAL OR PHYSICAL PROPERTIES
- G01N2201/00—Features of devices classified in G01N21/00
- G01N2201/08—Optical fibres; light guides
-
- G—PHYSICS
- G01—MEASURING; TESTING
- G01N—INVESTIGATING OR ANALYSING MATERIALS BY DETERMINING THEIR CHEMICAL OR PHYSICAL PROPERTIES
- G01N2201/00—Features of devices classified in G01N21/00
- G01N2201/08—Optical fibres; light guides
- G01N2201/084—Fibres for remote transmission
-
- G—PHYSICS
- G01—MEASURING; TESTING
- G01N—INVESTIGATING OR ANALYSING MATERIALS BY DETERMINING THEIR CHEMICAL OR PHYSICAL PROPERTIES
- G01N2201/00—Features of devices classified in G01N21/00
- G01N2201/12—Circuits of general importance; Signal processing
- G01N2201/124—Sensitivity
- G01N2201/1241—Multirange
Definitions
- VMS vadose zone monitoring system
- UV absorption spectroscopy technique has been used to evaluate aqueous nitrate concentration for several decades.
- UV light passes through a sample, the transmitted light interacts with the atoms and the molecules by scattering and absorption. Absorption will occur at different wavelengths, corresponding to the transition between energy levels.
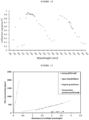
- UV light is being absorbed at wavelengths between 190 and 350nm. Two distinct absorbance peaks can be observed: at 200nm and 300nm.
- UV spectroscopy can be used for nitrate detection in soils, with the aid of fiber optics technology combined with suction cups ( US 7,927,883 and Tuli, A., Wei, J.B., Shaw, B.D., Hopmans, J.W., 2009. In Situ Monitoring of Soil Solution Nitrate: Proof of Concept. Soil Sci Soc Am J 73, pp. 501-509 ). UV absorption was measured in the aqueous phase of a porous cup installed in the soil, assuming chemical equilibrium with the soil solution. Hence, the accuracy of this method depends strongly on the time required to reach chemical equilibrium by diffusion processes between the inner part of the porous cup and the soil porewater.
- nitrate concentration based on UV spectroscopy was also reported in US 9,714,901 , taking advantage of the wavelength range in the vicinity of the 200 nm absorption peak for nitrate detection.
- Concentration of nitrate is interpreted from soil water extract, where a soil sample is mixed with water. That is, the porewater is released to the soil extract solution creating a diluted solution of low nitrate concentration.
- the present invention provides an elegant method of in-situ and real time measurement of nitrate in pore-water, eliminating the major drawbacks mentioned above, namely, the need to wait until chemical equilibrium is reached before a reliable absorbance reading can be obtained via direct measurement in a suction cup installed in the soil (see US 7,927,883 ), and inaccuracies caused when analysis is done at a fixed, predetermined wavelength (see US 9,714,901 ) that cannot encounter with changes occurring in concentration of nitrate in soil due to e.g., irrigation and fertilization.
- One aspect of the invention is a method of quantitative in-situ and real time monitoring of one or more chemical species in pore-water of unsaturated zone (e.g., top soil, root zone and deep unsaturated zone, collectively simply named hereinafter "soil”), with the aid of light absorption spectrometry, the method comprising:
- Another aspect of the invention is a system for measuring with the aid of light absorption spectrometry the concentration of one or more analytes in porewater, the system comprising:
- a battery consisting of a pore water sampler (1), an optical flow cell (2) and a vacuum arrangement (3), enabling generation of low pressure (tension) within the porewater sampler and achieving porewater stream from the soil through the porous interface to the optical flow cell, is referred to herein as 'monitoring unit'.
- 'monitoring unit' A battery consisting of a pore water sampler (1), an optical flow cell (2) and a vacuum arrangement (3), enabling generation of low pressure (tension) within the porewater sampler and achieving porewater stream from the soil through the porous interface to the optical flow cell.
- the vacuum arrangements may include a sampling cell charged with vacuum, peristaltic pump, vacuum pump, gravitational water column (syphon), and hanging cups.
- vacuum arrangement based on a sampling cell charged with vacuum.
- the method of the invention preferably includes a step of discharging the stream from the optical flow cell (2) to a sampling cell (3); the sampling cell thus serves two useful purposes simultaneously: generation of low pressure (tension) within the porewater sampler and collection of samples.
- the preferred monitoring unit consisting of a porewater sampler (1), an optical flow cell (2) and a sampling cell (3).
- an especially preferred embodiment of the invention is a system for measuring, with the aid of light absorption spectrometry, the concentration of one or more analytes in porewater, the system comprising:
- an array of monitoring units is installed in a field, as illustrated below, to enables real-time, continuous, in-situ data on absorption spectrum of soil porewater from multiple sampling points across a 3D measured domain (e.g. agricultural field or contaminated site during remediation operation) to be analyzed to create real-time 3D distribution map of selected chemical components, for example, continuous measurement variations of nitrate concentration in soil subjected to irrigation and fertilization.
- a 3D measured domain e.g. agricultural field or contaminated site during remediation operation
- the term "field” refers to any porous domain of variable water saturation degree. These may include the soil root zone, unsaturated zone, saturated parts of the subsurface, namely groundwater, or an array of individual or multiple growing pots.
- One feature of the invention resides in operating the flow of the porewater, to ensure a continuous fresh stream of porewater from the porewater sampler to the optical flow cell.
- the extraction of porewater is accomplished using a small porewater sampler [e.g., inner volume ⁇ 4 ml] connected using small diameter tubing [e.g., inner diameter ⁇ 2.0 mm] to a small volume optical flow cell [e.g., inner volume ⁇ 2 ml], to minimize the dead volume between the soil porewater and the analytical zone [e.g., less than 10 ml].
- the concentration of the analyte is measured continuously in a fresh stream of porewater.
- the method of the invention is preferably devoid of a step of diluting the porewater.
- Another feature of the present invention resides in a smart selection of a suitable wavelength to achieve an efficient spectral analysis, and the ability to switch from one calibration curve to another in response to indications received from the spectral analysis.
- Experimental work conducted in support of this invention shows that quite often each particular field has its own typical "chemical signature', namely, a composition of chemicals as dictated by the soil type, climate conditions, and agricultural regime, and therefore a unique typical absorption interference which obstructs the measurement of the analyte of interest.
- each field under consideration is associated with its own calibration equation measured at an optimal wavelength.
- every monitoring unit is located in a different point in the soil across the field, and since the soil is also known to be a heterogeneous domain it is also possible that each and every monitoring unit will have its own chemical composition and therefore its own calibration equation.
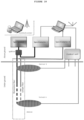
- Figure 3 illustrates a preferred embodiment of the system of the invention, showing an array of monitoring units installed at different locations across a field to create a network of sampling points in said field, wherein the system comprises a single light source and a single detector, adapted to carry out the method of the invention.
- a porewater sampler (1) is connected to an optical flow cell (2), which in turn is connected to a sampling cell (3), using small diameter tubing, e.g., capillary tubes (6), to provide an individual monitoring unit. It is seen that in the specific array illustrated in Figure 3 , three monitoring units are placed in the monitored medium - soil (4). Nevertheless, the number of monitoring units can be readily adjusted to meet different requirements.
- Light travels from a light source (5) through optic fibers (7) to each optical flow cell (2), from which the exiting beam propagates to the spectrometer (8).
- an automated multiplexing robot can be used to shift the optical flow cell (2) from the light beam.
- the analytical center i.e., a computer (9) serves three main functions: (i) to control the operation of the light source, spectrometer, and multiplexing device while synchronizing measurements with the absorption data, (ii) determine concentration of specific chemical components on the basis of absorption spectrum, and (iii) create concentration distribution map of target chemical constituents in the monitored medium.
- porewater stream is generated under a very low flow-rate (from 1-5 ml per hour, depending on the soil hydraulic conditions).
- a suitable porous interface (1) e.g., made of ceramic, clay, borosilicate, porous plastic films, porous metals.
- pore water sampler (1) can be a solid porous interface with no internal void.
- pore water sampler (1) preferably comprises an elongated body bounded by a porous lateral surface with a spacer disposed within the interior defined by said lateral surface, said spacer occupying at least 70% of the volume of said interior space, e.g., at least 90%. More specifically, the pore water sampler (1) comprises a porous interface in the form of a lateral surface of a cylinder; the internal space of the cylindrical surface is designed specifically to have a minimal inner dead volume, e.g., by co-axially placing therein a suitable spacer element occupying about 90 - 98 % of said internal space, such that the porewater flows in the annular space between the inner walls of said cylindrical interface and the co-axially positioned spacer.
- soil water is extracted according to the present invention using a porewater sampler having an elongated cylindrical body as illustrated in Figure 4 (or alternatively, rectangular body). Its operation mechanism is similar to standard tensiometers or suction lysimeters.
- the porewater sampler of the invention comprises a porous ceramic pipe (11) (e.g., allowing air entry pressure of 1.5-2.0 bar).
- the dimensions of the porous interface namely, length and outer diameter, are preferably in the ranges from 5 to 10 cm and 1 to 3 cm, respectively.
- the porous interface is capped from both sides to create a sealed cylindrical porous volume.
- a spacer (12), e.g., a plastic (polypropylene) spacer is mounted in the interior of the porous pipe, to fill most of internal volume of the porous pipe.
- the porewater sampler may be connected through the caps closing the open bases of the porous tube using additional small diameter tubing (13) to enable connection to pressure transduced or enable access for cleanup and maintenance of the porous interface through injection of liquid or gas which can flow through the entire setup, from the inner part of the porous interface through the optical flow cell to the sampling cell.
- the porewater stream is created under application of vacuum in the sampling cell (3) (generated by a regulated vacuum pump as explained in more detail below; in general the vacuum is set between 10 and 30 kPa).
- the porewater stream flows from porewater sampler (1) through small diameter tubing (6in), with inner diameter from 1.0 to 2.0 mm, e.g., around 1.5-1.8 mm, for example, capillary tube made of chemically resistant plastic, preferably low density polyethylene (commercially available from Freeling Wade) to a small volume optical flow cell (2), which discharges the stream to sampling cell (3).
- the optical flow cell (2) comprises a housing (21) with a small cavity (22) - the volume of the cavity is about 1-2 ml - formed by the intersection of two perpendicular aligned bores, one (23) for the flow of the porewater stream arriving from the porewater sampler (1) and the other (24) for transmittance of the beam generated by the light source (5) travelling through optical fiber (7)
- Suitable fibers are commercially available, for example, StellarNet 'F600-UVVis-SR Armored Fiber Optics' optical fiber).
- Two transparent windows are oppositely positioned (25) to prevent the flow of the aqueous stream from cavity (22) into light transmitting bore (24), e.g., the windows are mounted in the optical flow cell but other arrangements where the windows are located at the end of optical probes inserted into the cell are also possible.
- inner cavity is provided with two solar resistance quartz windows (25in, 25out) which allow the transmission of UV and deep UV ( ⁇ 300nm) through collimating lenses (26in, 26out) such that the lenses are protected from a direct contact with the solution.
- Suitable collimating lens are commercially available, e.g., Stellarnet 'LENS-QCOL (UV grade)', and the connection to the optical fiber can be achieved with the aid of SMA-905 adapter.
- light generated by light source (5) travels to optical flow cell (2) through optical fiber (7in) and is guided via collimator (26in) and transparent window (25in) into cavity (22). After passing through the solution located in cavity (22), the attenuated light exiting across transparent window (25out) is transmitted via the second collimator (26out) through an optical fiber (7out) to a spectrometer (8). More sophisticated optical designs are described below.
- the light source and spectrometer may be external, where the light from the light source to the optical flow cell and from the optical flow cell to the spectrometer may be transmitted using optic fibers.
- the applied light source and the spectrometer are selected for the absorption range desired chemical constituent.
- dedicated light sources and spectrometer of a narrow wave length ranges may be used simultaneously or separately.
- OFM optical Fiber Multiplexer
- the OFM uses a highly accurate step motor and a leading screw to move the optical fibers, UV lamp and spectrometer in order to place it in front of the chosen (stationary) optical flow cell.
- the OFM can be divided to a 'lower deck' consisting the UV lamp, spectrometer, step motor and instrument unit, and an 'upper deck' consisting an array of (stationary) optical flow cells.
- FIG. 16A A top view of the 'upper deck' is presented in Figure 16A , showing a set of spaced apart optical flow cells (2a), (2b), (2c), (2d), (2e) and (2f) mounted in a row with UV light source (5) and spectrometer (8) placed at the lower deck, on the opposite lateral sides of said row, such that when UV light source (5) and the spectrometer (8) are incrementally advanced along the lower desk, optical fiber (7in) terminated with a collimating lens (26in) and likewise optical fiber (7out) terminated with a collimating lens (26out) can be used to connect UV light source (5) and spectrometer (8) to the opposite sides of the light transmitting bore of each of the (2a), (2b), (2c), (2d), (2e) and (2f) optical flow cells sequentially.
- Figure 16B provides a top view of the 'lower deck'.
- Leading screw (161) used to advance the UV light source (5) and spectrometer (8) couple, is driven by a step motor (162) controlled by instrument unit (163).
- Figure 16C is the AA' cross section view of Figure 16A , showing UV light source (5) moving along the 'lower deck' with optical flow cell (2f) being currently in operation, connected with optical fiber (7in) to UV light source (5).
- liquid flow paths indicated by numerals (6in) and (6out) - the thin, preferably LDPE made, tubes directing incoming porewater stream from the porewater samplers to the respective optical flow cells (namely, tubes 6in), and outgoing porewater streams exiting the optical flow cells to their respective sampling cells (namely, tubes 6out).
- Frame (164) schematically indicates the structural support of the OMF.
- the OMF shown in Figure 16A-16C illustrates just one possible approach towards enabling the system of the invention to utilize a single light source (5) and spectrometer (8) while making multi-point serial measurements.
- Other approaches are based on movable optical flow cells relative to stationary single light source (5) and spectrometer (8) and/or movable mirrors for diverting the beam generated by the UV light source to and from each of the optical flow cells in turn.
- the porewater stream which exits the optical flow cell (2) flows through a small diameter tubing (6out, identical to the previously described 6in tube) to a sampling cell (3), which is capable of accommodating volume in the range from about 1 to 2 liter, for example.
- a suitable design of a sampling cell (3) is shown in Figure 6 .
- Numerals (31) and (33) indicate the sample solution inlet connector and the sample outlet point, respectively.
- Numeral (32) indicates a vacuum charge point.
- the sampling cell (3) is charged with low pressure (vacuum) to enable the creation of tension that propagates from the sampling cell (3) through optical flow cell (2) down to the porewater sampler (1), causing soil porewater to flow from the porewater sampler (1) through the optical flow cell (2) to the sampling cell (3) where it is stored.
- the water sample accumulated in the sampling cell may either be analyzed occasionally upon request for the purpose of system calibration or quality assurance, as explained in more detail below, or drained back to the field.
- sampling cell body is made of polypropylene and can differ in volume and shapes, to suit for specific system designs and operational considerations.
- the chamber has inlet points to allow connection to the optical flow cell, sampling or drainage, and vacuum source, as indicated above. It may also contain a water level gauge for system control and sampling management.
- the determination of a suitable wavelength for detecting the analyte of interest (e.g., nitrate) and creation of a calibration curve poses a significant challenge to the accuracy of the measurement.
- Dissolved organic matter in water sources and particularly in soils contains a very wide range of complex organic molecules. Accordingly, the UV absorbance by the natural organic matter and interference with the nitrate absorption spectrum is controlled by the appearance of a large number of different organic molecules which vary from site to site and controlled by the bio-geo-climatic conditions.
- the present invention is based on a novel approach towards overcoming dissolved organic matter interference with nitrate absorption.
- a library i.e., a collection
- the calibration curves are generated by obtaining raw samples from one or more sampling points in the field, following which the raw samples are preferably spiked and diluted, to create a low and high concentration range solutions which are used to form calibration equations adoptable for the chemical composition of the porewater in each individual sampling point.
- a first calibration curve constructed at a first selected wavelength suitable for the current chemical composition of the soil and concentration range of said analyte is used; but when the concentration measured after some time is not within the original concentration range associated with the first calibration curve, then a second calibration curve pertaining to a different wavelength is chosen from the library and the system then switches to conduct further measurements with the aid of said second calibration curve, and so forth.
- the library is fairly stable; such that measurements in each sampling point could lean on the 'local library' associated therewith for a long period of time, switching from one calibration curve to another within the library. However, it may happen that the library would have to be reconstructed, for example, following a significant agricultural or climatic event (e.g., addition of very large amounts of fertilizer to the field). In this case again the field would be sampled at the various sampling points, using porewater samples that accumulated in the sampling cells (3), to create a new collection of calibration curves.
- another aspect of the invention is an adaptive wavelength hopping algorithm for choosing a wavelength for the spectral analysis and creation of a calibration curve, comprising the steps of:
- experimental work conducted in support of this invention indicates that satisfactory results can be obtained upon using a screening procedure placing two requirements on ⁇ o : First, searching for all wavelengths ⁇ k such that the strength of correlation between the known nitrate concentrations C i (1 ⁇ i ⁇ n) and absorbance intensities measured at said wavelength A(i) ⁇ k (1 ⁇ -i ⁇ -n) is above a predetermined threshold, for example, using the R-squared test with R-squared value above a predetermined threshold, e.g. >0.9. Wavelengths showing R-squared below said threshold are rejected, with remaining wavelengths creating a set of candidate wavelengths.
- the set of candidate wavelengths is screened to locate ⁇ o , wherein ⁇ o is characterized in that the slope of the straight line C i (1 ⁇ i ⁇ n) versus A(i) ⁇ o (1 ⁇ i ⁇ n) is minimal. That is, exhibiting the highest variance ⁇ 2 .
- VMS vadose zone monitoring technology
- Such vertical deployment enables automated execution of nitrate (or other chemical species) concentration measurements across the entire unsaturated zone, as shown pictorially in Figure 17 ; Pore-water solution driven continuously from the unsaturated sediment by the pore sampler analyzed continuously in the optical flow cell.
- This monitoring setup ensures automated continuous measurements, which saves the labor required in obtaining water samples from the field for lab analysis and enable remote real-time data acquiring.
- the proposed vertically deployed system includes control centre and a plurality of nodes distributed in the area under monitoring.
- the control centre receives information from the nodes in the fields by wireless communication (such as cellular, satellite, Wi-Fi or dedicate technology).
- Each node include deep well.
- a VMS sleeve with array of sensors is inserted into the well.
- the VMS sleeve is filled to achieve tight contact to the wall of the well.
- water samples can be analyzed in several locations along the well.
- the extract porewater is transferred through an optical flow cell through which the sample flows to a sampling cell.
- the sample holder e.g., the optical flow cell is illuminated by optical light (e.g. UV to far IR).
- the light is created by light source that is attached to an optical fiber.
- the output of the fiber is focused on the sample holder by plano convex lens. Some of the light is absorbed by the water in the sample holder, the rest is propagate and reflect back by a mirror. The reflected light propagates again through the cup, partially absorbed whereas the rest is focused to the input of the sampling fiber.
- the output of the sampling fiber is connected to spectrometer, which measures the spectra of the received light. At the same time another spectrometer samples the light source in order to scale and calibrate the received sample. The output from the two spectrometers is transfered to the computer to local processing. At the end of the process the information is transmitted to the control center.
- modulation of the signal from each sensor should be done at different frequency.
- the modulation could be achieved using one or more of the following options: modulator at the output of the illumination fiber, at the input of the sampling fiber, or by placing spatial light modulation before the mirror.
- the control of the modulator is done by the control unit connected to a computer.
- the computer dictates different modulation frequency to each of the sensor at one or more modulation options.
- the output from the spectrometer is analysed by signal processing methods so the signal from each sensor could be identified.
- the contamination in the water is then calculated according to known algorithms.
- optical flow cell has a front face through which a light beam travelling from the light source via an illumination optical fiber enters said optical flow cell, and a rear face through which a light beam exiting the optical flow cell is guided via a sample optical fiber to the detector, wherein the optical flow cell is provided with an optical arrangement comprising at least one of the following:
- a device for detecting an analyte in a plurality of liquid samples with the aid of light spectrometry comprises at least one light source, a plurality of sample holders (e.g., an optical flow cell or a cuvette), and at least one detector, wherein each sample holder has a front face through which a light beam travelling from the light source via a wave guide (e.g., illumination optical fiber) enters said optical flow cell, and a rear face through which a light beam exiting the optical flow cell is guided (e.g., via a sample optical fiber) to the detector, wherein the sample holder is provided with an optical arrangement comprising at least one of the following:
- a column indicated by numeral 11 was filled with 25 kg of sandy soil 12.
- the column used is a 5 gallon flowerpot.
- a porewater sampler 1A consisting of a cylindrically shaped vessel with a porous interface as described above in reference to Figure 4 is installed in the sand, such that its lowermost end is about 20 cm below the level of the soil in the column.
- Porewater sampler 1A is connected with a 300 cm long capillary tube 6in having an inner diameter of 1.6 mm to the fluid inlet port of an optical flow cell 2 (with the design described above in reference to Figure 5 ).
- a sampling cell 3A is placed downstream to the optical flow cell 2, such that outgoing liquid stream exiting optical flow cell 2 is discharged to, and collected in, vessel 3A.
- Porewater sampler 1B identical in shape, size and structure to 1A is also installed in the sand. Porewater sampler 1B discharges directly to a sample accumulation vessel 3B through a thin tube 6. That is, there is no optical flow cell placed along the path connecting the outlet port of porewater sampler 1B and the inlet of sample accumulation vessel 3B such that the pair 1B-3B serves for control measurement as explained below. A dripper was used for application of water.
- the optical arrangement consists of a UV light source 5, e.g., a deuterium lamp (SL3 Deuterium Light Source for UV, equipped with 'DCX' Lens for higher intensity performers, manufactured by StellarNet Inc; the lamp emits UV light over the 190-450nm range).
- a deuterium lamp SL3 Deuterium Light Source for UV, equipped with 'DCX' Lens for higher intensity performers, manufactured by StellarNet Inc; the lamp emits UV light over the 190-450nm range.
- the light travels from the lamp via an optical fiber 7in ('F400-UVVis-SR' Armored, 2 meters, solarization resistant fiber optic cable available from StellarNet Inc), through the optical flow cell 2 and to spectrometer 8 ('BLACK-COMET UV-VIS' Spectrometer from StellarNet Inc, designed to measure transmissivity and absorbance between 190-850nm; the spectrometer is connected to a computer 9 via USB cable 10 and controlled by 'SpectroWiz', StellarNet provided software).
- sets of collimating lenses 26in and 26out (5mm diameter, UV-Vis, purchased from StellarNet Inc) are placed on opposite sides of the transparent surface of the optical flow cell body 5.
- the lenses were terminated by a SMA-905 optical fiber connector, which enabled connection between the optical flow cell, the spectrometer and the UV light source.
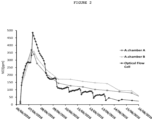
- the experiment started by injecting a single nitrate pulse of 1000 mg L -1 at the top of the column (1) and the propagating plum of nitrate has been monitored throughout the experiment as the column had been irrigated on daily cycles (1 L of tap water, hence nitrate concentration added was well below 50 mg L -1 ).
- the experiment lasted ten days, and during this time period three sets of data were recorded:
- Online monitoring in the optical flow cell 2 (that is, method 1) enables the measuring of nitrate concentration in the solution just as it being extracted from the soil pores, whereas the plots generated on the basis of samples taken from the accumulation chambers 3A and 3B (methods 2 and 3) indicate the average of the soil solution nitrate concentration between sampling events, thus physical sampling of soil solution would underestimate the nitrate concentration in the soil pores and hence the slightly lower concentrations shown by the curves assigned to the measurements by methods 2 and 3. Additionally, the high-resolution monitoring in time had revealed the rapid changes in nitrate concentration which occur in soil during water percolation events.
- Example 2 The experiments reported in this study are based on the soil-packed column set-up described in Example 1. But this time three large-scale columns were used, to test three different types of soils, with two monitoring units coupled to each column.
- An individual monitoring unit consists of a porewater sampler (1), an optical flow cell (2) and a sampling cell (3) as described in the previous example.
- a single optical arrangement as previously outlined is also implemented for continuous and simultaneous measurement in six units placed in the three soil columns.
- FIGS 7A-7B The results are shown in Figures 7A-7B as nitrate concentration plots versus time (7A and 7B for column 1, 7C and 7D for column 2 and 7E and 7F for column 3). Absorbance intensities were taken at intervals of two hours over a period of about two weeks to determine variation in nitrate concentration with the passage of time with the aid of UV spectroscopy in the optical flow cell (curves marked by black squares in each of the 7A-7F graphs). Physical sampling directly from sampling cell located downstream to the optical cell in each monitoring unit was carried out once or twice a day, and nitrate concentrations in the periodically collected samples was measured using Deionix Ions analyzer. The time at which nitrate solution (1000 mg L -1 ) was injected at the beginning of the each experiment is also indicated in the graph. The columns were occasionally irrigated during the experiment, three times a day with 1L irrigation at each irrigation event.
- Nitrate concentration plots versus time obtained with the aid of UV spectroscopy in an optical flow cell, in which the extracted water was allowed to flow continuously, are fairly consistent with the curves generated on the basis of data obtained from the samples by different methods (either DIONEX ICS 5000 ion chromatograph or TOC, DOC, TN, DN multi N/C 2100s 'AnalytikJena' analyzer, which gives equivalent of nitrate concentration by multiplying the total nitrogen value by 4.43).
- Part A creating a general calibration curve
- Nitrate concentration was determined using 'DIONEX ICS 5000', Ion chromatograph.
- Table 1 tabulates the nitrate concentrations measured for several samples collected at different ports of the VMS, for each of the four sites under study: Table 1 NO 3 - [mg/L] VMS port Organic greenhouse Conservative greenhouse Orchard Open field 1 182 412.4 N/A N/A 2 251 337.6 45.2 N/A 3 366.75 579.75 54 1636.5 4 598 506.8 58.5 1014.5 5 431.25 N/A 74.6 505.5 6 357.75 83.8 59 310 7 298.44 158.2 75.5 226.2
- the total concentration of nitrogen and organic carbon in the samples was determined using TOC, DOC, TN, DN multi N/C 2100s 'AnalytikJena' analyzer.
- nitrate concentration in the solution typically ranges between few hundreds and few thousands mg L -1 . Accordingly, the 301nm wavelength was chosen for UV measurements in order to establish a correlation between the results tabulated in Table 1, which are based on ion chromatography, and UV absorbance intensity values, to create a calibration curve.
- UV spectra recorded for the seven samples collected in the organic greenhouse are presented in Figure 9 (the samples are designated M1-M7 in line with the data in the corresponding column in Table 1 above). It was noted that samples “M1” and “M2" had the highest absorbance intensity, yet the lowest nitrate concentration determined by ion chromatography, suggesting the possibility of a masking effect caused by the presence of DOC. However, at the same batch of results, sample "M7" has the highest concentration of DOC yet the lowest absorbance intensity. Thus, the possibility of masking by DOC seems to be unlikely.
- Part B creating an individual calibration curve
- FIG. 10 demonstrates the calibrating scheme for the orchard field station. It can be perceived from the graph that the best correlation would be achieved at 225nm wavelength, between absorbance intensities and solution nitrate concentrations (the ordinate in Figure 10 is the calculated R-squared parameter at each wavelength - see next example illustrating a procedure for choosing a suitable wavelength for UV spectroscopy analysis of nitrate in porewater).
- Figure 11 shows nitrate concentration obtained by DIONEX ICS 5000 ion chromatograph against absorbance intensity at multiple wavelengths. It is seen that each of the field stations has been successfully assigned with an individual own calibration curve, generated by the most suitable wavelength for each field.
- This example demonstrates a procedure for screening a wavelength range to determine which wavelength is most suitable for spectral analysis of nitrate.
- nitrate concentration of each sample was determined using 'DIONEX ICS 5000' ion chromatograph.
- absorbance intensity of each sample was measured versus wavelength, across a range of 190 to 360nm. Then the wavelengths are screened to satisfy two requirements.
- R-squared test the strength of the correlation between the two variables, that is, how strong there is a linear relationship between the two sets of data (the known nitrate concentrations and corresponding absorbance intensities measured at each wavelength) is estimated using the R-squared parameter. That is, the R-squared is calculated and plotted versus wavelength. Wavelengths showing R-squared below a certain threshold are rejected, while the remaining wavelengths displaying R-squared above the threshold are used to form a set of candidate wavelength.
- Figure 13 illustrates the first step of the screening procedure outlined above, with R-squared value of 0.9 being applied as a threshold value.
- Figure 14 demonstrates the two calibration curves made at 245nm and 300nm (marked by rhombuses and crosses, respectively). It is seen that the calibration curve at 300nm has lower variance than 245nm, and as such is more sensitive to measurement error. Thus, slights variations in the absorbance intensity values will result in much higher changes in measured value.
Landscapes
- Life Sciences & Earth Sciences (AREA)
- Chemical & Material Sciences (AREA)
- Physics & Mathematics (AREA)
- Health & Medical Sciences (AREA)
- Analytical Chemistry (AREA)
- Biochemistry (AREA)
- General Health & Medical Sciences (AREA)
- General Physics & Mathematics (AREA)
- Immunology (AREA)
- Pathology (AREA)
- Engineering & Computer Science (AREA)
- Spectroscopy & Molecular Physics (AREA)
- Dispersion Chemistry (AREA)
- General Life Sciences & Earth Sciences (AREA)
- Environmental & Geological Engineering (AREA)
- Geology (AREA)
- Remote Sensing (AREA)
- Food Science & Technology (AREA)
- Medicinal Chemistry (AREA)
- Hydrology & Water Resources (AREA)
- Mathematical Physics (AREA)
- Theoretical Computer Science (AREA)
- Soil Sciences (AREA)
- Mining & Mineral Resources (AREA)
- Paleontology (AREA)
- Civil Engineering (AREA)
- General Engineering & Computer Science (AREA)
- Structural Engineering (AREA)
- Investigating Or Analysing Materials By Optical Means (AREA)
Applications Claiming Priority (3)
| Application Number | Priority Date | Filing Date | Title |
|---|---|---|---|
| US201662429884P | 2016-12-05 | 2016-12-05 | |
| PCT/IL2017/051318 WO2018104939A1 (fr) | 2016-12-05 | 2017-12-05 | Mesure in situ de nitrate dans le sol |
| EP17878499.7A EP3548861A4 (fr) | 2016-12-05 | 2017-12-05 | Mesure in situ de nitrate dans le sol |
Related Parent Applications (1)
| Application Number | Title | Priority Date | Filing Date |
|---|---|---|---|
| EP17878499.7A Division EP3548861A4 (fr) | 2016-12-05 | 2017-12-05 | Mesure in situ de nitrate dans le sol |
Publications (2)
| Publication Number | Publication Date |
|---|---|
| EP4571285A2 true EP4571285A2 (fr) | 2025-06-18 |
| EP4571285A3 EP4571285A3 (fr) | 2025-07-16 |
Family
ID=62490866
Family Applications (2)
| Application Number | Title | Priority Date | Filing Date |
|---|---|---|---|
| EP25156386.2A Pending EP4571285A3 (fr) | 2016-12-05 | 2017-12-05 | Mesure in situ de nitrate dans le sol |
| EP17878499.7A Withdrawn EP3548861A4 (fr) | 2016-12-05 | 2017-12-05 | Mesure in situ de nitrate dans le sol |
Family Applications After (1)
| Application Number | Title | Priority Date | Filing Date |
|---|---|---|---|
| EP17878499.7A Withdrawn EP3548861A4 (fr) | 2016-12-05 | 2017-12-05 | Mesure in situ de nitrate dans le sol |
Country Status (5)
| Country | Link |
|---|---|
| US (1) | US11175223B2 (fr) |
| EP (2) | EP4571285A3 (fr) |
| AU (1) | AU2017372058B2 (fr) |
| IL (1) | IL266877B2 (fr) |
| WO (1) | WO2018104939A1 (fr) |
Families Citing this family (14)
| Publication number | Priority date | Publication date | Assignee | Title |
|---|---|---|---|---|
| AU2020290793B2 (en) * | 2019-06-12 | 2025-11-20 | B.G. Negev Technologies & Applications Ltd., At Ben-Gurion University | System and method for determining aqueous nitrate concentration in solution containing dissolved organic carbon |
| CN111595789B (zh) * | 2020-05-20 | 2024-08-09 | 中国科学院西安光学精密机械研究所 | 一种海洋水下总氮总磷原位在线监测装置及方法 |
| CN112763436A (zh) * | 2020-12-24 | 2021-05-07 | 中国原子能科学研究院 | 一种光谱测量系统 |
| AR126124A1 (es) * | 2021-06-13 | 2023-09-13 | B G Negev Technologies And Applications Ltd At Ben Gurion Univ | Sistema y método para reducir la lixiviación del exceso de fertilización a una zona debajo de las raíces |
| US12510470B2 (en) | 2021-06-13 | 2025-12-30 | B.G. Negev Technologies And Applications Ltd., At Ben-Gurion University | System and method for determining aqueous nitrate concentration in solution containing dissolved organic carbon |
| ES2932723B2 (es) * | 2021-07-14 | 2023-11-28 | Medina Pedro Beltran | Procedimiento de vigilancia de contaminación de acuíferos y dispositivo de captación al efecto |
| KR102665373B1 (ko) * | 2021-11-09 | 2024-05-09 | 한국광해광업공단 | 토양수 채취와 모니터링 장치 및 방법 |
| DE102022001089A1 (de) | 2022-03-30 | 2023-10-05 | Forschungszentrum Jülich GmbH | Messanordnung sowie Verfahren zur qualitativen und quantitativen In-situ Echtzeitermittlung des Ammonium-Gehalts und des Ammonium-Umsatzes zu Nitrit im Boden |
| WO2023212659A1 (fr) * | 2022-04-27 | 2023-11-02 | University Of Utah Research Foundation | Système de mesure de carbone de sol in situ à base uv |
| CN115452745A (zh) * | 2022-09-19 | 2022-12-09 | 西安交通大学 | 用于气液两相流含气率测量的设备及方法 |
| CN116008009B (zh) * | 2023-02-22 | 2023-06-09 | 山东明波海洋设备有限公司 | 水产养殖水质检测用抽样设备 |
| AU2024239830A1 (en) * | 2023-03-17 | 2025-09-11 | Sentek Pty Ltd | Analyte in soil and other medium sensor arrangement |
| CN118706516B (zh) * | 2024-08-28 | 2024-11-29 | 内蒙古蒙兴诚地质勘查有限公司 | 一种煤田地质勘查取样设备 |
| CN119164882A (zh) * | 2024-09-24 | 2024-12-20 | 无锡迅杰光远科技有限公司 | 一种耐腐蚀性液体检测流通池 |
Citations (3)
| Publication number | Priority date | Publication date | Assignee | Title |
|---|---|---|---|---|
| US7927883B2 (en) | 2007-11-09 | 2011-04-19 | The Regents Of The University Of California | In-situ soil nitrate ion concentration sensor |
| US8381582B2 (en) | 2006-01-31 | 2013-02-26 | Ben-Gurion University Of The Negev Research And Development Authority | Method and system for monitoring soil properties |
| US9714901B2 (en) | 2009-05-07 | 2017-07-25 | Monsanto Technology Llc | Measurement of nitrate-nitrogen concentration in soil based on absorption spectroscopy |
Family Cites Families (7)
| Publication number | Priority date | Publication date | Assignee | Title |
|---|---|---|---|---|
| JPH10160668A (ja) * | 1996-11-30 | 1998-06-19 | Mitsubishi Materials Corp | 連続流れ分析法による硝酸濃度の測定方法とその装置 |
| JP4375885B2 (ja) * | 2000-06-12 | 2009-12-02 | 賢一朗 小杉 | 土壌水採取方法及び装置 |
| US20030151744A1 (en) * | 2002-02-14 | 2003-08-14 | Fernando C.J. Anthony | Spectroscopic apparatus with fiber optics and related method |
| US7385694B2 (en) * | 2002-06-04 | 2008-06-10 | Lockheed Martin Corporation | Tribological debris analysis system |
| WO2014127379A1 (fr) * | 2013-02-18 | 2014-08-21 | Theranos, Inc. | Systèmes et procédés d'analyse multiple |
| DE202015000747U1 (de) * | 2015-02-02 | 2015-04-20 | Wolf-Anno Bischoff | N-Düngesteuerung mittels in-situ Nitrat-Messung, Bedarfsberechnung und N-Dosiereinheit |
| DE202015103885U1 (de) * | 2015-07-24 | 2016-10-25 | Martin Horbanski | Spektroskopisches Messgerät |
-
2017
- 2017-12-05 US US16/466,128 patent/US11175223B2/en active Active
- 2017-12-05 EP EP25156386.2A patent/EP4571285A3/fr active Pending
- 2017-12-05 IL IL266877A patent/IL266877B2/en unknown
- 2017-12-05 WO PCT/IL2017/051318 patent/WO2018104939A1/fr not_active Ceased
- 2017-12-05 AU AU2017372058A patent/AU2017372058B2/en active Active
- 2017-12-05 EP EP17878499.7A patent/EP3548861A4/fr not_active Withdrawn
Patent Citations (3)
| Publication number | Priority date | Publication date | Assignee | Title |
|---|---|---|---|---|
| US8381582B2 (en) | 2006-01-31 | 2013-02-26 | Ben-Gurion University Of The Negev Research And Development Authority | Method and system for monitoring soil properties |
| US7927883B2 (en) | 2007-11-09 | 2011-04-19 | The Regents Of The University Of California | In-situ soil nitrate ion concentration sensor |
| US9714901B2 (en) | 2009-05-07 | 2017-07-25 | Monsanto Technology Llc | Measurement of nitrate-nitrogen concentration in soil based on absorption spectroscopy |
Non-Patent Citations (4)
| Title |
|---|
| DAHAN, O., A. BABADN. LAZAROVITCHE.E. RUSSAKD. KURTZMAN: "Nitrate leaching from intensive organic farms to groundwater.", HYDROL. EARTH SYST. SCI., vol. 18, no. 1, 2014, pages 333 - 341 |
| SHAW, B.D.WEI, J.B.TULI, A.CAMPBELL, J.PARIKHD, S.J.D, S.D.BUELOW, M.HOPMANS, J.W.: "Analysis of Ion and Dissolved Organic Carbon Interference on Soil Solution Nitrate Concentration Measurements Using Ultraviolet Absorption Spectroscopy", VADOSE ZO. J., vol. 13, 2014, XP055609478, DOI: 10.2136/vzj2014.06.0071 |
| TULI, A.WEI, J.B.SHAW, B.D.HOPMANS, J.W.: "In Situ Monitoring of Soil Solution Nitrate: Proof of Concept.", SOIL SCI SOC AM J, vol. 73, 2009, pages 501 - 509, XP055609473, DOI: 10.2136/sssaj2008.0160 |
| TURKELTAUB, T.D. KURTZMANO. DAHAN.: "Real-time monitoring of nitrate transport in the deep vadose zone under a crop field - implications for groundwater protection.", HYDROL. EARTH SYST. SCI., vol. 20, no. 8, 2016, pages 3099 - 3108, XP055979763, DOI: 10.5194/hess-20-3099-2016 |
Also Published As
| Publication number | Publication date |
|---|---|
| US11175223B2 (en) | 2021-11-16 |
| IL266877B2 (en) | 2024-10-01 |
| US20200072737A1 (en) | 2020-03-05 |
| AU2017372058A1 (en) | 2019-07-18 |
| EP4571285A3 (fr) | 2025-07-16 |
| IL266877A (en) | 2019-07-31 |
| EP3548861A4 (fr) | 2020-11-04 |
| AU2017372058B2 (en) | 2022-10-06 |
| EP3548861A1 (fr) | 2019-10-09 |
| IL266877B1 (en) | 2024-06-01 |
| WO2018104939A1 (fr) | 2018-06-14 |
Similar Documents
| Publication | Publication Date | Title |
|---|---|---|
| US11175223B2 (en) | In-situ measurement of nitrate in soil | |
| US7728971B2 (en) | Method and apparatus for performing spectroscopy downhole within a wellbore | |
| Yeshno et al. | Real-time monitoring of nitrate in soils as a key for optimization of agricultural productivity and prevention of groundwater pollution | |
| Sieburg et al. | Onsite cavity enhanced Raman spectrometry for the investigation of gas exchange processes in the Earth's critical zone | |
| US20220205923A1 (en) | Device and Method for Determining an Elemental Composition of Ground | |
| AU2020290793B2 (en) | System and method for determining aqueous nitrate concentration in solution containing dissolved organic carbon | |
| EP2469250B1 (fr) | Procédé et appareil pour réaliser de la spectroscopie dans un puits de forage | |
| US7304733B2 (en) | Method and device for conducting the spectral differentiating, imaging measurement of fluorescent light | |
| US12510470B2 (en) | System and method for determining aqueous nitrate concentration in solution containing dissolved organic carbon | |
| CN120177389A (zh) | 基于高光谱技术的地表基质传感器及监测方法 | |
| Chen et al. | A laser-based fluorometry system for investigations of seawater and porewater fluorescence | |
| Yeshnoa et al. | Continuous in-situ monitoring of nitrate concentration in soils–a key for groundwater protection from nitrate pollution | |
| Vibhute et al. | Assessment of soil organic matter through hyperspectral remote sensing data (VNIR spectroscopy) using PLSR method | |
| Volkmann et al. | Continual in-situ monitoring of pore water stable isotopes in the subsurface. | |
| Pepper et al. | Subsurface contaminant monitoring by laser excitation-emission matrix/cone penetrometer | |
| Fagerman | Exploration of Time-Resolved Raman analysis for on-the-go nitrate sensing | |
| de Vries et al. | Mobile multisensor system for environmental monitoring |
Legal Events
| Date | Code | Title | Description |
|---|---|---|---|
| PUAI | Public reference made under article 153(3) epc to a published international application that has entered the european phase |
Free format text: ORIGINAL CODE: 0009012 |
|
| STAA | Information on the status of an ep patent application or granted ep patent |
Free format text: STATUS: THE APPLICATION HAS BEEN PUBLISHED |
|
| REG | Reference to a national code |
Ref country code: DE Ref legal event code: R079 Free format text: PREVIOUS MAIN CLASS: G01N0001100000 Ipc: G01N0001020000 |
|
| PUAL | Search report despatched |
Free format text: ORIGINAL CODE: 0009013 |
|
| AC | Divisional application: reference to earlier application |
Ref document number: 3548861 Country of ref document: EP Kind code of ref document: P |
|
| AK | Designated contracting states |
Kind code of ref document: A2 Designated state(s): AL AT BE BG CH CY CZ DE DK EE ES FI FR GB GR HR HU IE IS IT LI LT LU LV MC MK MT NL NO PL PT RO RS SE SI SK SM TR |
|
| AK | Designated contracting states |
Kind code of ref document: A3 Designated state(s): AL AT BE BG CH CY CZ DE DK EE ES FI FR GB GR HR HU IE IS IT LI LT LU LV MC MK MT NL NO PL PT RO RS SE SI SK SM TR |
|
| RIC1 | Information provided on ipc code assigned before grant |
Ipc: G01N 1/02 20060101AFI20250610BHEP Ipc: G01N 1/14 20060101ALI20250610BHEP Ipc: G01N 21/33 20060101ALI20250610BHEP Ipc: G01J 3/32 20060101ALI20250610BHEP Ipc: G01N 35/10 20060101ALI20250610BHEP Ipc: G01N 15/14 20240101ALI20250610BHEP Ipc: G01N 33/24 20060101ALI20250610BHEP Ipc: E02D 1/06 20060101ALI20250610BHEP Ipc: G01N 1/10 20060101ALI20250610BHEP Ipc: G01N 21/27 20060101ALI20250610BHEP |
|
| STAA | Information on the status of an ep patent application or granted ep patent |
Free format text: STATUS: REQUEST FOR EXAMINATION WAS MADE |
|
| 17P | Request for examination filed |
Effective date: 20260112 |