JP2007102709A - Marker selection program for gene diagnosis, apparatus and system for executing the program, and gene diagnosis system - Google Patents
Marker selection program for gene diagnosis, apparatus and system for executing the program, and gene diagnosis system Download PDFInfo
- Publication number
- JP2007102709A JP2007102709A JP2005295333A JP2005295333A JP2007102709A JP 2007102709 A JP2007102709 A JP 2007102709A JP 2005295333 A JP2005295333 A JP 2005295333A JP 2005295333 A JP2005295333 A JP 2005295333A JP 2007102709 A JP2007102709 A JP 2007102709A
- Authority
- JP
- Japan
- Prior art keywords
- combination
- group
- list
- gene
- diagnostic
- Prior art date
- Legal status (The legal status is an assumption and is not a legal conclusion. Google has not performed a legal analysis and makes no representation as to the accuracy of the status listed.)
- Pending
Links
Images









Classifications
-
- G—PHYSICS
- G16—INFORMATION AND COMMUNICATION TECHNOLOGY [ICT] SPECIALLY ADAPTED FOR SPECIFIC APPLICATION FIELDS
- G16B—BIOINFORMATICS, i.e. INFORMATION AND COMMUNICATION TECHNOLOGY [ICT] SPECIALLY ADAPTED FOR GENETIC OR PROTEIN-RELATED DATA PROCESSING IN COMPUTATIONAL MOLECULAR BIOLOGY
- G16B20/00—ICT specially adapted for functional genomics or proteomics, e.g. genotype-phenotype associations
- G16B20/20—Allele or variant detection, e.g. single nucleotide polymorphism [SNP] detection
-
- G—PHYSICS
- G16—INFORMATION AND COMMUNICATION TECHNOLOGY [ICT] SPECIALLY ADAPTED FOR SPECIFIC APPLICATION FIELDS
- G16B—BIOINFORMATICS, i.e. INFORMATION AND COMMUNICATION TECHNOLOGY [ICT] SPECIALLY ADAPTED FOR GENETIC OR PROTEIN-RELATED DATA PROCESSING IN COMPUTATIONAL MOLECULAR BIOLOGY
- G16B20/00—ICT specially adapted for functional genomics or proteomics, e.g. genotype-phenotype associations
- G16B20/40—Population genetics; Linkage disequilibrium
-
- G—PHYSICS
- G16—INFORMATION AND COMMUNICATION TECHNOLOGY [ICT] SPECIALLY ADAPTED FOR SPECIFIC APPLICATION FIELDS
- G16B—BIOINFORMATICS, i.e. INFORMATION AND COMMUNICATION TECHNOLOGY [ICT] SPECIALLY ADAPTED FOR GENETIC OR PROTEIN-RELATED DATA PROCESSING IN COMPUTATIONAL MOLECULAR BIOLOGY
- G16B50/00—ICT programming tools or database systems specially adapted for bioinformatics
-
- G—PHYSICS
- G16—INFORMATION AND COMMUNICATION TECHNOLOGY [ICT] SPECIALLY ADAPTED FOR SPECIFIC APPLICATION FIELDS
- G16B—BIOINFORMATICS, i.e. INFORMATION AND COMMUNICATION TECHNOLOGY [ICT] SPECIALLY ADAPTED FOR GENETIC OR PROTEIN-RELATED DATA PROCESSING IN COMPUTATIONAL MOLECULAR BIOLOGY
- G16B50/00—ICT programming tools or database systems specially adapted for bioinformatics
- G16B50/30—Data warehousing; Computing architectures
-
- G—PHYSICS
- G16—INFORMATION AND COMMUNICATION TECHNOLOGY [ICT] SPECIALLY ADAPTED FOR SPECIFIC APPLICATION FIELDS
- G16B—BIOINFORMATICS, i.e. INFORMATION AND COMMUNICATION TECHNOLOGY [ICT] SPECIALLY ADAPTED FOR GENETIC OR PROTEIN-RELATED DATA PROCESSING IN COMPUTATIONAL MOLECULAR BIOLOGY
- G16B20/00—ICT specially adapted for functional genomics or proteomics, e.g. genotype-phenotype associations
Landscapes
- Health & Medical Sciences (AREA)
- Life Sciences & Earth Sciences (AREA)
- Engineering & Computer Science (AREA)
- Physics & Mathematics (AREA)
- Bioinformatics & Cheminformatics (AREA)
- Theoretical Computer Science (AREA)
- General Health & Medical Sciences (AREA)
- Medical Informatics (AREA)
- Biophysics (AREA)
- Bioinformatics & Computational Biology (AREA)
- Biotechnology (AREA)
- Evolutionary Biology (AREA)
- Spectroscopy & Molecular Physics (AREA)
- Genetics & Genomics (AREA)
- Molecular Biology (AREA)
- Bioethics (AREA)
- Proteomics, Peptides & Aminoacids (AREA)
- Databases & Information Systems (AREA)
- Chemical & Material Sciences (AREA)
- Analytical Chemistry (AREA)
- Physiology (AREA)
- Ecology (AREA)
- Apparatus Associated With Microorganisms And Enzymes (AREA)
- Medical Treatment And Welfare Office Work (AREA)
- Investigating Or Analysing Biological Materials (AREA)
- Management, Administration, Business Operations System, And Electronic Commerce (AREA)
- Measuring Or Testing Involving Enzymes Or Micro-Organisms (AREA)
Abstract
【課題】条件の異なる検体集団のデータに基づいてマーカーを探索する際に、各条件下に特有の傾向を失うことなく、且つ効率よくマーカーを選定する手段を提供することを目的とする。また、優れた診断精度を有し汎用性が高い実用的な診断システムを提供することを目的とする。
【解決手段】遺伝子診断に用いるためのマーカーを選定するマーカー選定プログラムを提供する。該プログラムでは、複数の検体が属する二以上の集団がそれぞれに保有する検体データベースを用いて解析を行う。全検体データを統合せずに解析することによって、少数集団の情報であっても遺伝子探索に確実に反映させることができる。各集団の特徴を反映させることが可能であるため、精度の高い診断式を得ることができ、実用的な診断システムを提供することが可能である。
【選択図】図1An object of the present invention is to provide a means for efficiently selecting a marker without losing a tendency specific to each condition when searching for a marker based on data of specimen groups having different conditions. It is another object of the present invention to provide a practical diagnostic system having excellent diagnostic accuracy and high versatility.
A marker selection program for selecting a marker for use in gene diagnosis is provided. In the program, analysis is performed using a sample database held by each of two or more groups to which a plurality of samples belong. By analyzing all specimen data without integrating them, even a small group of information can be reliably reflected in gene searches. Since the characteristics of each group can be reflected, a highly accurate diagnostic expression can be obtained, and a practical diagnostic system can be provided.
[Selection] Figure 1
Description
本発明は、遺伝子診断に用いるのに適したマーカーを選定するプログラム、該プログラムを実行するための装置及びシステム、並びに、選定されたマーカーを用いて遺伝子診断を行う遺伝子診断システムに関する。 The present invention relates to a program for selecting a marker suitable for use in genetic diagnosis, an apparatus and system for executing the program, and a genetic diagnosis system for performing genetic diagnosis using the selected marker.
現在、遺伝子診断はテーラーメイド医療をはじめとして様々な分野で広く利用されており、患者の遺伝子データや臨床データを基に、薬剤投与等の治療法の有効性を予測するシステムが考案されている(例えば、特許文献1)。このような遺伝子診断システムの構築における最大の問題点のひとつは、診断事項に関連するマーカーをどのようにして探し出すかである。一般的に行われている方法は、例えば患者と健常人や、治療が有効だった患者と無効だった患者について全遺伝子を比較し、両集団で出現頻度が異なる遺伝子多型を探す方法である。さらに、遺伝子多型を単独ではなく組合せてマーカーとする方法も行われている。 Currently, gene diagnosis is widely used in various fields including tailor-made medicine, and a system for predicting the effectiveness of treatments such as drug administration has been devised based on patient genetic data and clinical data ( For example, Patent Document 1). One of the biggest problems in the construction of such a genetic diagnosis system is how to find a marker related to a diagnosis item. A commonly used method is to compare all genes for patients and healthy people, or patients who have been treated successfully and those who have been ineffective, and look for genetic polymorphisms that differ in frequency in both populations. . Furthermore, there is a method in which genetic polymorphisms are used as markers instead of alone.
マーカーの探索は、患者の遺伝子データや臨床データを統合し一つの母集団として行うのが一般的である。しかしながら、例えば地域による生活習慣、気候、食習慣の差のような把握できない環境要因により、疾病への罹りやすさを支配する遺伝子が相違することも想定される。また、同じ疾病に罹患している患者であっても、治療法の相違や合併症の有無などによって治験条件が異なれば、治療において重要な役割を果たす遺伝子が異なることも容易に想定される。 The search for markers is generally performed as a single population by integrating patient genetic data and clinical data. However, it is also assumed that genes governing the susceptibility to illness are different due to environmental factors that cannot be grasped, such as differences in lifestyle, climate, and dietary habits by region. In addition, even in patients suffering from the same disease, it is easily assumed that genes that play an important role in treatment differ depending on clinical trial conditions depending on differences in treatment methods and the presence or absence of complications.
このような場合、ある条件下では候補となり得る遺伝子であっても、それが少数であると、データが総合された後には殆ど認知されずにその情報が失われてしまい、重要な情報が何も得られない場合がある。 In such a case, even if there are a few genes that can be candidates under certain conditions, if the number of genes is small, the information is almost unrecognized after the data is integrated, and the information is lost. May not be obtained.
また、遺伝子診断に用いる遺伝子探索は、数十から数百人分の治験結果からなる母集団に対して行う場合が多い。この結果に基づいて遺伝子診断が実用化され、多くの医療機関で利用されるようになると、実際の診断精度が当初の予想より低い場合がしばしばある。この様な場合、各医療機関や合併症ごとに、遺伝子診断に利用する遺伝子を改めて探索しなおしたり、診断式を作り直したりする必要が生じ、遺伝子診断の適用範囲が狭まったり、実用化の妨げになったりしていた。しかも、患者の血清が保存されていない場合は、追加で血液採取をする必要があり患者への負担となっていた。また、何らかの理由により、追加採血が不可能な場合には、別の検体で治験をやり直す必要があり、大変な費用と莫大な時間が必要になるという問題点があった。
上記の問題に鑑み、本発明は、条件の異なる検体集団のデータに基づいてマーカーを探索する際に、各条件下に特有の傾向を失うことなく、且つ効率よくマーカーを選定する手段を提供することを目的とする。また、優れた診断精度を有し汎用性が高い実用的な診断システムを提供することを目的とする。 In view of the above problems, the present invention provides a means for efficiently selecting a marker without losing a characteristic tendency under each condition when searching for a marker based on data of specimen groups having different conditions. For the purpose. It is another object of the present invention to provide a practical diagnostic system having excellent diagnostic accuracy and high versatility.
上記目的を達成するため、本発明に従って、遺伝子診断に用いるためのマーカーを選定するためにコンピュータを、
予め既知の遺伝子多型の同定情報を記録しておく遺伝子多型データ記録手段、
予め前記遺伝子多型データ中の任意の二以上の遺伝子多型を組合せた、遺伝子多型組合せリストを記録しておく遺伝子多型組合せリスト記録手段、
予め前記遺伝子多型組合せリストに記載された各遺伝子多型組合せに関する対立遺伝子型組合せリストを記録しておく、対立遺伝子型組合せリスト記録手段、
複数の検体が属する二以上の集団について、前記既知の遺伝子多型における各検体の遺伝子型、並びに診断事項に対する傾向を記録しておく、集団毎の検体データ記録手段、
前記遺伝子多型組合せリストに記載された各遺伝子多型組合せについて、該各組合せに関する対立遺伝子型組合せリストを読み出し、該リストに記載された対立遺伝子型組合せが、前記診断事項との間に相関を有するかどうかを、前記検体データベースに保存されたデータに基づいて判定する関連性演算手段、
前記関連性演算手段によって相関を有すると判定された遺伝子多型組合せ及びその対立遺伝子型組合せを、前記集団毎に関連性一覧表に記録しておく関連性一覧表記録手段、
前記集団毎の関連性一覧表を比較し、全ての関連性一覧表に共通して存在する遺伝子多型組合せ及びその対立遺伝子型組合せを、第2の関連性一覧表に記録する集団比較手段、
前記第2の関連性一覧表の中から、全ての集団において診断事項に対する傾向が同じである遺伝子多型組合せ及びその対立遺伝子型組合せを選択し、マーカー候補として第3の関連性一覧表に記載する傾向判定手段、
前記手段によって得られたマーカー候補を出力する出力手段、
として機能させるためのマーカー選定プログラムが提供される。
In order to achieve the above object, according to the present invention, a computer is selected for selecting a marker for use in genetic diagnosis.
Gene polymorphism data recording means for recording identification information of known gene polymorphisms in advance,
Gene polymorphism combination list recording means for recording a gene polymorphism combination list in which two or more gene polymorphisms in the gene polymorphism data are combined in advance,
An allelic combination list recording means for recording an allelic combination list related to each genetic polymorphism combination described in the genetic polymorphism combination list in advance;
Sample data recording means for each group, for recording two or more groups to which a plurality of samples belong, the trend of genotype of each sample in the known genetic polymorphism, and diagnostic items,
For each gene polymorphism combination described in the gene polymorphism combination list, an allele type combination list for each combination is read, and the allele type combination described in the list correlates with the diagnosis item. Relevance calculation means for determining whether to have the data based on data stored in the specimen database;
Relevance list recording means for recording the genetic polymorphism combination determined to have a correlation by the relevance calculation means and the allelic combination thereof in the relevance list for each population,
A group comparison means for comparing the association list for each group, and recording the genetic polymorphism combinations and allele combinations thereof common to all the association lists in a second association list;
From the second association list, a genetic polymorphism combination and an allelic combination thereof that have the same tendency for diagnosis items in all the populations are selected, and described in the third association list as marker candidates A tendency determination means,
Output means for outputting marker candidates obtained by the means;
A marker selection program for functioning as
前記関連性演算手段は、
前記遺伝子多型組合せリスト中の遺伝子多型組合せ毎に、前記対立遺伝子型組合せリストを読み出し、
該リスト中の各対立遺伝子型組合せについて、前記検体データベースに基づき、該組合せを有する検体をA群に分類し、それ以外の検体をB群に分類し、
該A群及びB群のそれぞれにおいて、診断事項に対する傾向によって、検体を有効群と無効群とに分類し、
該A群及びB群における、有効群と無効群との割合に差があるかどうかを検定し、
該検定において有意の差があった遺伝子多型及び対立遺伝子型を、関連性ありと判定する手段であることが好ましい。
The relevance calculating means includes
For each gene polymorphism combination in the gene polymorphism combination list, read the allele combination list,
For each allelic combination in the list, based on the sample database, classify samples having the combination into Group A, classify the other samples into Group B,
In each of the A group and the B group, the sample is classified into an effective group and an ineffective group according to the tendency to the diagnosis item
Test whether there is a difference in the ratio between the effective group and the ineffective group in the groups A and B,
It is preferable that the genetic polymorphisms and alleles that have a significant difference in the test are means for determining that they are related.
さらに、上記プログラムは、前記傾向判定手段に続いて、前記第3の関連性一覧表に記載されたマーカー候補から、遺伝子診断用に最適なマーカー候補を選択する候補選択手段として機能させることを含むことが好ましい。 Further, the program includes causing the function to function as a candidate selection unit that selects an optimal marker candidate for gene diagnosis from the marker candidates described in the third relevance list following the trend determination unit. It is preferable.
前記第3の関連性一覧表から最適なマーカー候補を選択する手段は、
各集団の相関係数を平均し、該平均値が最大である遺伝子多型組合せ及びその対立遺伝子型組合せを選択する手段であることが好ましい。
Means for selecting an optimal marker candidate from the third relevance list,
It is preferable that the correlation coefficient of each population is averaged to select a gene polymorphism combination having the maximum average value and an allelic combination thereof.
また、本発明の他の側面に従って、
遺伝子診断式を作成するために、コンピュータを、
請求項1又は2における前記第3の関連性一覧表のマーカー候補について、集団毎に、前記A群に属する検体をX=−1とし、前記B群に属する検体をX=+1とするか、A群に属する検体をX=+1、B群に属する検体をX=−1とするか、或いはA群に属する検体をX=α、B群に属する検体をX=βとし(ただし、αとβは互いに異なる任意の数である)、また、前記治療の有効性及び/又は病気のかかり易さによって、各検体をy=1、又はy=0とし、
各集団に対する診断式 Y=aX+t (ここで、a及びtは定数である)を作成する診断式作成手段、
作成された診断式を出力する出力手段、
として機能させるための診断式作成プログラムが提供される。
Also according to another aspect of the present invention,
To create a genetic diagnostic formula,
Regarding the marker candidates of the third relevance list in
A diagnostic formula creation means for creating a diagnostic formula Y = aX + t (where a and t are constants) for each population;
An output means for outputting the created diagnostic expression;
A diagnostic formula creation program is provided to function as a program.
さらに、上記プログラムは、前記診断式作成手段に続いて、前記作成された診断式から、最適な診断式を選択するために、コンピュータを、
前記各マーカー候補の各集団に対する診断式の、それぞれの集団に対する寄与率Kを演算する手段、
該寄与率Kの平均値が最大であるマーカー候補の診断式を選択する選択手段、
選択された診断式を出力する出力手段、
として機能させるための診断式作成プログラムであることが好ましい。
Further, the program, following the diagnostic formula creating means, selects a computer from the created diagnostic formula to select an optimal diagnostic formula,
Means for calculating a contribution rate K for each group of diagnostic formulas for each group of marker candidates,
Selecting means for selecting a diagnostic formula of a marker candidate having the maximum value of the contribution rate K;
Output means for outputting the selected diagnostic expression;
It is preferable that it is a diagnostic formula creation program for functioning as.
また、本発明の他の側面に従って、上記のように選定されたマーカーを用いて、診断対象検体を遺伝子診断するためのシステムが提供される。該システムは、
上記のように選定されたマーカーを読み込む手段、
予め測定された診断対象検体の遺伝子配列を入力する手段、
前記選定されたマーカーと同様の遺伝子多型組合せ及びその対立遺伝子型組合せが、該検体中に存在するか否かを判定する手段、
該判定に基づき、該検体を診断する手段、
該診断結果を出力する手段、
とを具備してなることを特徴とする。
According to another aspect of the present invention, a system for genetic diagnosis of a specimen to be diagnosed using the marker selected as described above is provided. The system
Means for reading the marker selected as above,
Means for inputting a pre-measured gene sequence of a specimen to be diagnosed;
Means for determining whether a genetic polymorphism combination similar to the selected marker and an allelic combination thereof are present in the specimen;
Means for diagnosing the specimen based on the determination;
Means for outputting the diagnostic result;
It is characterized by comprising.
また、本発明の他の側面に従って、上記のように作成された診断式を用いて、診断対象検体を遺伝子診断するためのシステムが提供される。該システムは、
上記のように作成された診断式を読み込む手段、
予め測定された診断対象検体の遺伝子配列を入力する手段、
前記診断式に、該検体のデータを適用し、予想率を得る手段、
得られた予想率を出力する手段、
とを具備してなることを特徴とする。
According to another aspect of the present invention, a system for genetic diagnosis of a specimen to be diagnosed using the diagnostic formula created as described above is provided. The system
Means for reading the diagnostic formula created as described above,
Means for inputting a pre-measured gene sequence of a specimen to be diagnosed;
Means for applying the specimen data to the diagnostic formula to obtain an expected rate;
Means for outputting the obtained prediction rate,
It is characterized by comprising.
上記プログラムに係る発明は、そのプログラムを実行するためのコンピュータにより構成される装置及びシステム、そのプログラムによりコンピュータで実行される手順からなる方法、そのプログラムを記録した記録媒体の発明としても成立する。 The invention relating to the above-mentioned program can also be realized as an invention of an apparatus and a system constituted by a computer for executing the program, a method comprising a procedure executed by the computer by the program, and a recording medium recording the program.
本発明によれば、条件の異なる検体集団においても共通して用いることができるマーカーを効率よく選定することができる。また、優れた診断精度を有し汎用性が高い実用的な診断システムを提供することができる。 According to the present invention, it is possible to efficiently select a marker that can be used in common even in specimen groups having different conditions. In addition, a practical diagnostic system having excellent diagnostic accuracy and high versatility can be provided.
本発明において遺伝子診断とは、ある検体における疾病の治療の有効性を、該検体の遺伝子配列に基づいて診断することをいう。ここで治療には、薬剤などによる化学的治療や、放射線治療などによる物理的治療、及びその他の治療が含まれる。また、遺伝子診断には、ある疾病へのかかりやすさや、罹患した場合の疾病の進行度の予測も含まれる。 In the present invention, genetic diagnosis refers to diagnosing the effectiveness of treatment of a disease in a sample based on the gene sequence of the sample. Here, the treatment includes chemical treatment with drugs, physical treatment such as radiation treatment, and other treatments. In addition, genetic diagnosis includes predicting the likelihood of getting a certain disease and the degree of progression of the disease when affected.
本発明において、遺伝子診断によって診断する上記のような内容を診断事項と称する。診断事項は必要に応じて選択してよい。ここで、診断事項に対する傾向とは、例えば診断事項が治療の有効性である場合、治療が有効であるか無効であるかを表す。診断事項が疾病へのかかりやすさである場合は、疾患にかかりやすいか又はかかり難いかを表す。 In the present invention, the above-described contents diagnosed by genetic diagnosis are referred to as diagnostic items. Diagnostic items may be selected as necessary. Here, the tendency with respect to the diagnostic item represents, for example, whether the treatment is effective or ineffective when the diagnostic item is the effectiveness of the treatment. When the diagnosis item is the susceptibility to a disease, it indicates whether or not the disease is likely to be a disease.
遺伝子診断に用いる遺伝子配列をマーカーと称する。マーカーには、遺伝子多型を有する遺伝子が好適に用いられる。遺伝子多型には、一塩基多型(以下、「SNP」と称す。)、置換、欠失、挿入等が含まれるが、SNPを用いることが好ましい。 A gene sequence used for gene diagnosis is referred to as a marker. As the marker, a gene having a genetic polymorphism is preferably used. The gene polymorphism includes a single nucleotide polymorphism (hereinafter referred to as “SNP”), substitution, deletion, insertion, etc., but SNP is preferably used.
本発明による遺伝子診断では、遺伝子多型を単独ではなく組合せてマーカーとする。これは、単独ではマーカーと成り得ない遺伝子多型であっても、複数の遺伝子多型を組合せることによって、診断事項との間に関連性が発見されることがあるためである。本発明では、二以上の任意の多型の組合せをマーカーとして用いる。本明細書では、簡便のため、二つの多型の組合せを例に説明するが、三つ以上の多型の組合せでも同様に行うことができる。 In the genetic diagnosis according to the present invention, genetic polymorphisms are used as markers in combination rather than individually. This is because even if a gene polymorphism that cannot be a marker alone is associated with a diagnosis item by combining a plurality of gene polymorphisms. In the present invention, a combination of two or more arbitrary polymorphisms is used as a marker. In this specification, for the sake of convenience, a combination of two polymorphisms will be described as an example, but a combination of three or more polymorphisms can be similarly performed.
本発明におけるマーカーの選定は、二以上の集団における検体データベースに基づいて行う。ここで、集団とは、環境要因や治療方法、人種等の条件が異なる検体集団を指し、例えば病院Aと病院Bなどのように、複数の医療機関をそれぞれの集団としてもよい。また例えば、人種や国別、性別等による他の分類も可能である。なお、集団は医療機関に限定されず、また、二以上であれば何れの数であってもよい。検体データベースは、それぞれの集団において作成されて保存される。 The marker selection in the present invention is performed based on the specimen database in two or more groups. Here, the group refers to a sample group having different conditions such as environmental factors, treatment methods, and races. For example, a plurality of medical institutions such as hospital A and hospital B may be used as each group. Also, for example, other classifications based on race, country, sex, etc. are possible. The group is not limited to a medical institution, and may be any number as long as it is two or more. A specimen database is created and stored in each group.
ここで、検体データとは、個々の検体の遺伝子配列や、該検体の疾病に関する履歴、即ち、治療の有効性や疾病へのかかりやすさなどの臨床データを含めたデータを意味する。ここで、データに記録される検体の遺伝子配列は、ゲノム配列であってもよいが、現在ヒトに存在することが知られている遺伝子多型における遺伝子配列のみであってもよい。 Here, the specimen data means data including clinical sequences such as gene sequences of individual specimens, history of diseases of the specimens, that is, effectiveness of treatment and susceptibility to diseases. Here, the gene sequence of the specimen recorded in the data may be a genomic sequence, or may be only a gene sequence in a gene polymorphism that is currently known to exist in humans.
以下、図面を参照しながら本発明を詳細に説明する。
(第1実施形態)
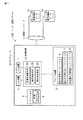
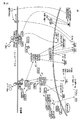
第1の実施形態として、マーカーを選定するためのプログラム、並びに該プログラムを実行するための装置及びシステムが提供される。図1は、本発明のマーカー選定プログラムを実現するための装置及びシステムの全体像を示す図である。
Hereinafter, the present invention will be described in detail with reference to the drawings.
(First embodiment)
As a first embodiment, a program for selecting a marker, and an apparatus and system for executing the program are provided. FIG. 1 is a diagram showing an overall image of an apparatus and a system for realizing a marker selection program of the present invention.
図1に示すように、マーカー選定システム100は、コンピュータ10と、該コンピュータ10と通信ネットワーク11を介して接続された集団1の検体データベース12及び集団2の検体データベース13から構成される。
As shown in FIG. 1, the
コンピュータ10は、処理装置2と、該処理装置2に接続されたメインメモリ5、入力装置1、出力装置4、及び、ファイル装置3から構成される。
The
コンピュータ10は、例えばパーソナルコンピュータにより実現される。コンピュータ10は、通信インタフェース(図示せず)を介して通信ネットワーク11との間でデータを送受信することができる。
The
処理装置2は、CPUのような、一般的なコンピュータの演算処理を実現するハードウェアにより実現される。処理装置2は、関連性演算手段21、集団比較手段22、及び傾向判定手段23を具備する。
The
メインメモリ5には、任意の記憶媒体に記録された、マーカー選定プログラム9が具備される。該プログラム9により、コンピュータ10が制御される。
The
入力装置1は、処理装置2における処理に必要な各種データや指示を入力するための装置である。これは例えばキーボードやマウスなどにより実現される。出力装置4は、処理装置2で処理された結果や診断結果を出力するための装置である。これは例えばディスプレイやプリンタなどにより実現される。
The
ファイル装置3には、遺伝子多型データファイル6、遺伝子多型組合せリストファイル7、対立遺伝子型組合せリストファイル8が具備される。
The
遺伝子多型データファイル6には、ヒトゲノム中に存在することが知られている遺伝子多型の同定情報が保存されている。ここで同定情報とは、その多型が存在する遺伝子配列上の位置、及び、該多型が取り得る塩基の種類などに関する情報である。本明細書では、この同定情報を遺伝子多型データと称する。 The genetic polymorphism data file 6 stores genetic polymorphism identification information known to exist in the human genome. Here, the identification information is information relating to the position on the gene sequence where the polymorphism exists and the types of bases that the polymorphism can take. In the present specification, this identification information is referred to as gene polymorphism data.
この遺伝子多型データに記録された遺伝子多型に基づき、二以上の遺伝子多型から成る全ての組合せを作成する。作成された組合せは全て遺伝子多型組合せリストに記載される。この遺伝子多型組合せリストは、遺伝子多型組合せリストファイル7に保存される。
Based on the gene polymorphism recorded in the gene polymorphism data, all combinations of two or more gene polymorphisms are created. All created combinations are listed in the gene polymorphism combination list. This gene polymorphism combination list is stored in the gene polymorphism
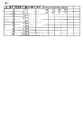
例として、二つのSNPから成る組合せについて説明する。例えば、遺伝子多型データファイルに10個のSNP:a、b、c、・・・、jが記録されているとする。これら10個のSNPから作成した遺伝子多型組合せリストを図2に示す。図2に示したように、10個のSNPからは、(10×9)/2 =45 個のSNP組合せが作成される。遺伝子多型組合せリストファイル7には、図2のような遺伝子多型組合せリストが保存されている。
As an example, a combination of two SNPs will be described. For example, assume that 10 SNPs: a, b, c,..., J are recorded in the gene polymorphism data file. A list of gene polymorphism combinations created from these 10 SNPs is shown in FIG. As shown in FIG. 2, (10 × 9) / 2 = 45 SNP combinations are created from 10 SNPs. The gene polymorphism
なお、上記の例では二つの遺伝子多型から成る組合せについて説明したが、三つ以上の遺伝子多型からなる組合せについても同様に作成することができる。 In the above example, the combination composed of two gene polymorphisms has been described. However, a combination composed of three or more gene polymorphisms can be similarly created.
次に、遺伝子多型の対立遺伝子型を考慮する。例えば、第1のSNPが塩基XまたはYを取り得る場合、X/X、X/Y、Y/Yの3種類の対立遺伝子型が存在する。また、第2のSNPが塩基U又はVを取り得る場合、U/U、U/V、V/Vの3種類の対立遺伝子型が存在する。従って、これらのSNPの組合せは、図3(a)に示すような16種類の対立遺伝子型の組合せを取り得る。 Next, allelic types of genetic polymorphisms are considered. For example, when the first SNP can take the base X or Y, there are three allelic types: X / X, X / Y, Y / Y. In addition, when the second SNP can take the base U or V, there are three types of alleles, U / U, U / V, and V / V. Therefore, the combinations of these SNPs can take combinations of 16 types of alleles as shown in FIG.
図3における1番目の組合せは、第1のSNPがX/Xであって、第2のSNPがU/Uである場合を意味する。5番目の組合せは、第1のSNPがX/X又はX/Yであって、第2のSNPがU/Uである場合を意味する。 The first combination in FIG. 3 means a case where the first SNP is X / X and the second SNP is U / U. The fifth combination means a case where the first SNP is X / X or X / Y and the second SNP is U / U.
また、一方のSNPが、YA又はXBという2種類の対立遺伝子型を有する場合がある。この時、SNPの組合せは、図3(b)に示すような8種類の対立遺伝子型の組合せを取り得る。 Moreover, one SNP may have two types of allelic types, YA or XB. At this time, the combination of SNPs can take a combination of 8 types of alleles as shown in FIG.
図3に示したような対立遺伝子型組合せリストが、各遺伝子多型組合せについて作成される。その具体例を図4に示した。図4(a)は、図2の遺伝子多型組合せリストにおける1番目の組合せについての、対立遺伝子型組合せリストの具体例である。ここで、第1のSNPはAとTをとり、第2のSNPはGとTをとる。図4(b)は、図2における2番目の組合せについての、対立遺伝子型組合せリストの具体例である。ここで、第1のSNPはAとTをとり、第2のSNPはGとCをとる。 An allele combination list as shown in FIG. 3 is created for each gene polymorphism combination. A specific example is shown in FIG. FIG. 4A is a specific example of the allelic combination list for the first combination in the genetic polymorphism combination list of FIG. Here, the first SNP takes A and T, and the second SNP takes G and T. FIG. 4B is a specific example of the allelic combination list for the second combination in FIG. Here, the first SNP takes A and T, and the second SNP takes G and C.
遺伝子多型が全て一塩基置換型のSNPである場合、図2に示した45種類の遺伝子多型組合せのそれぞれに対して、図3で示した16種類の対立遺伝子型組合せが存在する。従って、総計で45×16=720種類の対立遺伝子型組合せが作成されることになる。 When all the gene polymorphisms are single nucleotide substitution type SNPs, there are 16 types of allelic combinations shown in FIG. 3 for each of 45 types of gene polymorphism combinations shown in FIG. Therefore, a total of 45 × 16 = 720 types of allelic combinations are created.
このように作成された対立遺伝子型組合せリストは、対立遺伝子型組合せリストファイル8に記録される。
The allele combination list created in this way is recorded in the allele
図4のリストに示したように、それぞれの対立遺伝子型組合せは、組合せ番号によって識別されることが好ましい。組合せ番号は、遺伝子多型組合せの識別番号と、対立遺伝子型組合せの識別番号から作成され、例えば(1−1)〜(45−16)のように表すことができる。なお、組合せ番号の表記はこれに限定されず、遺伝子多型組合せと対立遺伝子型組合せが確定されるものであれば、どのようなものでもよい。 As shown in the list of FIG. 4, each allelic combination is preferably identified by a combination number. The combination number is created from the identification number of the genetic polymorphism combination and the identification number of the allelic combination, and can be expressed as (1-1) to (45-16), for example. In addition, the description of a combination number is not limited to this, What kind of thing may be sufficient as long as a gene polymorphism combination and an allele combination are decided.
以上説明した対立遺伝子型組合せリストが、全ての遺伝子多型組合せについて作成され、対立遺伝子型組合せリストファイル8に保存される。
The allele combination list described above is created for all gene polymorphism combinations and stored in the allele
なお、これらの遺伝子多型組合せリスト、及び、対立遺伝子型組合せリストは、処理装置2によって作成されてもよく、或いは予め作成されていたデータファイルを外部から入力して保存してもよい。新たな遺伝子多型が発見された場合は、リストを更新することが好ましい。
The gene polymorphism combination list and the allelic combination list may be created by the
次に、検体データベース12及び13について説明する。検体データベース12及び13は、集団1及び集団2のそれぞれにおいて作成されたデータベースである。検体データベース12及び13には、個々の検体の遺伝子配列や、治療の有効性、及び疾病へのかかり易さなどの臨床データが保存されている。データベースは、磁気ディスク、光学式ディスクなどにより実現される。
Next, the
検体データベース12及び13は、コンピュータ10の内部に保存されてもよいが、集団自体が保有するコンピュータなどに保存されることが好ましい。この場合、コンピュータ10は通信ネットワーク11を介して検体データベース12及び13と接続され、必要なデータを取得することができる。
The
なお、個人情報を保護する観点から、コンピュータ10が検体データベースから取得可能なデータは、必要なデータのみに限定されることが好ましい。
Note that, from the viewpoint of protecting personal information, it is preferable that the data that the
以上に記載したコンピュータ及びシステムの構成は、これらに限定されるものではない。本発明のプログラムが実現可能であれば、適宜変更又は改良されることができる。 The configurations of the computer and system described above are not limited to these. If the program of the present invention is realizable, it can be changed or improved as appropriate.
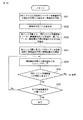
次に、図1のシステムを用いたマーカーの選定方法を、図5のフローチャートを参照して説明する。例として、ある疾病に対する治療の有効性を予測するためのマーカーを選定する方法を説明する。 Next, a marker selection method using the system of FIG. 1 will be described with reference to the flowchart of FIG. As an example, a method for selecting a marker for predicting the effectiveness of treatment for a certain disease will be described.
まず、集団1及び集団2の検体データベースから検体データを取得する(S51)。また、遺伝子多型組合せリストを取得する(S52)。なお、これらの順序は逆でもよい。
First, sample data is acquired from the sample database of
次に、取得したリスト中の任意の遺伝子多型組合せについて、その対立遺伝子型組合せリストを取得する(S53)。次いで、取得したリスト中の全ての対立遺伝子型組合せについて、診断事項との間に有意の関連性があるかどうかを演算する(S54)。有意の関連性があると判定された対立遺伝子型組合せは、それが属する遺伝子多型組合せが識別可能なように、上記した組合せ番号によって関連性一覧表に記載される(S55)。この手順S53〜S55は、全ての遺伝子多型組合せについて実行される(S56)。 Next, the allelic combination list is acquired for any gene polymorphism combination in the acquired list (S53). Next, for all allele combinations in the acquired list, it is calculated whether or not there is a significant association with the diagnosis items (S54). The allele combination determined to have a significant relationship is described in the association list by the combination number described above so that the gene polymorphism combination to which the combination belongs can be identified (S55). This procedure S53-S55 is performed about all the gene polymorphism combinations (S56).
手順S54の演算の具体的な方法を説明する。まず対立遺伝子型組合せリスト中の一つの組合せを読み出す。次いで、検体データベースを検索し、該組合せを有する検体群(A群)と、その他の検体群(B群)とに分類する。さらに、各群の検体を、治療が有効であった著効群(SR)と治療が無効であった無効群(NR)とに分類し、それぞれの群に属する検体数を計数する。 A specific method of the calculation in step S54 will be described. First, one combination in the allele combination list is read out. Next, the specimen database is searched and classified into a specimen group (Group A) having the combination and another specimen group (Group B). Furthermore, the samples of each group are classified into an effective group (SR) in which treatment was effective and an ineffective group (NR) in which treatment was ineffective, and the number of samples belonging to each group is counted.
次に、A群とB群とで、有効率、即ち、無効群に対する著効群の割合に、差があるかどうかを検定する。検定は任意の方法を用いてよい。一般には2群間のカイ二乗検定が用いられる。 Next, it is tested whether there is a difference in the effective rate, that is, the ratio of the effective group to the ineffective group between the A group and the B group. An arbitrary method may be used for the test. In general, a chi-square test between two groups is used.
例えば、集団1の検体数が100例で、SR(A)が45例、NR(A)が15例、SR(B)が20例、NR(B)が20例とする。この場合、A群の有効率は75%、B群の有効率は50%であり、A群の方が、有効性が高いと判定される。このときのカイ二乗検定の結果はP=0.010である。ここで、P<0.05の場合を有意と判定することにすると、その対立遺伝子型組合せは診断事項との間に有意の関連性があると判定される。
For example, the number of specimens in
また或いは、他の検定方法を用いてもよい。例えば、治療の有効性Resを0又は1で表現する。即ち、無効だった検体をRes=0、有効だった検体をRes=1とする。また、遺伝子多型組合せ要因Sを1か0に数値化する。具体的には、A群に分類された検体をS=1とし、B群に分類された検体をS=0に数値化する。このようにして、ResとSの相関係数と信頼性指標P値を計算する。上記の例に適用すると、相関係数は0.257、P値は0.010であった。 Alternatively, other test methods may be used. For example, the effectiveness of treatment Res is expressed as 0 or 1. That is, the invalid sample is Res = 0, and the valid sample is Res = 1. The gene polymorphism combination factor S is quantified to 1 or 0. Specifically, the specimen classified into the A group is set to S = 1, and the specimen classified into the B group is digitized to S = 0. In this way, the correlation coefficient of Res and S and the reliability index P value are calculated. When applied to the above example, the correlation coefficient was 0.257 and the P value was 0.010.
有意の関連性があるかどうかの判定には、P値或いは相関係数の絶対値を用いて行うことができる。例えば、P<0.05の場合に有意の関連性があると判定できる。また、相関係数の絶対値が0.3以上の場合に有意の関連性があると判定できる。但し、判定基準となるこれらの数値は、適宜設定することができる。 The determination of whether there is a significant relationship can be made using the P value or the absolute value of the correlation coefficient. For example, it can be determined that there is a significant relationship when P <0.05. Further, when the absolute value of the correlation coefficient is 0.3 or more, it can be determined that there is a significant relationship. However, these numerical values serving as determination criteria can be set as appropriate.
以上に述べた、手順S51〜S56は、図1の関連性演算手段21によって行なわれる。演算及び関連性一覧表の作成は、各集団について個別に実行される。なお、検定方法は上記に限らず、任意の方法によって行ってよい。また、関連性一覧表を作成するまでの手順は、上記の例に限らず、適切に行われて良い。 The steps S51 to S56 described above are performed by the relevance calculating means 21 in FIG. The calculation and the creation of the relevance list are executed individually for each group. The test method is not limited to the above, and any method may be used. Further, the procedure until the creation of the relevance list is not limited to the above example, and may be appropriately performed.
手順S55によって作成された関連性一覧表には、1行のデータとして、組合せ番号、診断事項との関連の傾向あるいは相関係数等を記載することが好ましい。関連性を判定したP値等の指標や、検体数等の情報も同時に保存しておくことが望ましい。図6に、関連性一覧表の具体例を示した。関連性一覧表には、識別のための通し番号、組合せ番号、関連性における傾向、A群B群のそれぞれにおける著効群と無効群の検体数が記載されている。 In the relevance list created in step S55, it is preferable to describe a combination number, a tendency of association with a diagnosis item, a correlation coefficient, or the like as one line of data. It is desirable to simultaneously store an index such as a P value for determining relevance and information such as the number of samples. FIG. 6 shows a specific example of the relevance list. In the relevance list, serial numbers for identification, combination numbers, trends in relevance, and the number of samples in the effective group and ineffective group in each of the groups A and B are described.
ここで、関連性における傾向とは、もし、図6に示すように2群間の独立性検定(カイ二乗検定)を用いた場合には、A群の有効性がB群より高い場合を+、低い場合を−とする。関連性がないと判定された場合は×を記入してもよい。より詳しく説明すると、図6の病院1における組合せ番号1−2では、SR(A)=45,NR(A)=15である。よって、A群の有効率は75%、B群の有効率は50%となり、A群の有効性の方が高い。これには+の符号を記入する。もし、治療法の有効性Resを0か1で表現して、相関係数を求めて検定を行って、関連性一覧表を作成した場合には、傾向の代わりに相関係数の値を記載する場合が多い。このとき、相関係数の符号のみを抜き出して、傾向の欄に記入してもかまわない。
Here, the tendency in the relevance means that if the independence test (chi-square test) between the two groups is used as shown in FIG. If the value is low, the value is-. If it is determined that there is no relevance, x may be entered. More specifically, in the combination number 1-2 in the
次に、集団比較手段22によって、集団1の関連性一覧表と集団2の関連性一覧表を比較する(S57)。同一の組合せ番号(即ち、遺伝子多型組合せ及びその対立遺伝子型組合せ)が全ての関連性一覧表に存在した場合、その組合せについての1行分のデータを第2の関連性一覧表にコピーする(S58)。その際、集団1から選び出したデータには、集団1由来であることを示す記載を、集団2から選び出したデータには集団2由来であることを示す記載を加える必要がある。
Next, the
第2の関連性一覧表の具体例を図7に示す。ここで、傾向の欄には、A群のほうが薬剤の有効性が高い傾向にある場合は+を、反対にA群の方が薬剤の有効性が低い傾向にある場合は−を記入してある。図7の例では、集団間で共通する組合せを連続して記載しているが、これに限らず任意の順番で保存してよい。ただし、図7のような順番のほうが、以降の工程で利用しやすい。 A specific example of the second relevance list is shown in FIG. Here, in the trend column, enter “+” when the drug effectiveness of group A tends to be higher, and “-” when the drug of group A tends to be less effective. is there. In the example of FIG. 7, combinations common to the groups are described continuously, but the present invention is not limited to this, and the combinations may be stored in any order. However, the order as shown in FIG. 7 is easier to use in the subsequent steps.
次に、傾向判定手段23によって、第2の関連性一覧表に記載された各組合せについて、全ての集団において傾向が同じであるか否かを判定する(S59)。具体的には、第2の関連性一覧表において、全ての集団の傾向欄に同じ記号が記入されている場合に、治療の有効性に対するその組合せの傾向が同じであると判定する。もし、治療の有効性を0か1で定義して相関係数を求めて検定を行った場合には、相関係数の符号が同じ場合に傾向が同じであると判定する。 Next, the tendency determination means 23 determines whether or not the tendency is the same in all groups for each combination described in the second relevance list (S59). Specifically, in the second relevance list, when the same symbol is entered in the trend column of all groups, it is determined that the tendency of the combination with respect to the effectiveness of treatment is the same. If the effectiveness of treatment is defined as 0 or 1 and a correlation coefficient is obtained and tested, it is determined that the tendency is the same when the correlation coefficient has the same sign.
次いで、手順S59によって傾向が同じであると判定された組合せ番号を、第3の関連性一覧表に記載する(S60)。第3の関連性一覧表の例を図8に示した。この第3の関連性一覧表に記載された組合せ番号によって表される遺伝子多型組合せ並びにその対立遺伝子型組合せが、遺伝子診断用マーカーとして使用可能なマーカー候補である。これは、処理装置2に接続された出力装置4によって出力される(S61)。
Next, the combination numbers determined to have the same tendency in step S59 are listed in the third relevance list (S60). An example of the third relevance list is shown in FIG. The gene polymorphism combination represented by the combination number described in the third association list and the allelic combination are candidate markers that can be used as markers for gene diagnosis. This is output by the
以上に記載した関連性一覧表、第2の関連性一覧表、第3の関連性一覧表は、処理装置内のメモリに記録されてもよいが、専用の記憶手段を備えて記憶させてもよい。 The relevance list, the second relevance list, and the third relevance list described above may be recorded in a memory in the processing apparatus, or may be stored with a dedicated storage unit. Good.
上記第3の関連性一覧表に記載されたマーカー候補が複数存在する場合、それら全てに適当な重み付けをして用いることができる。或いは、最適なマーカー候補を一つ又は2つ選択して用いることもできる。このとき、マーカー候補の選択は、目的とする遺伝子診断に適した基準によって行えばよい。例えば、集団1と集団2で得られた相関係数の絶対値の平均が最大の組合せを選ぶことができる。この基準によれば、図8では組合せ番号(35−6)が最適なマーカー候補となる。
When there are a plurality of marker candidates described in the third relevance list, all of them can be weighted appropriately. Alternatively, one or two optimal marker candidates can be selected and used. At this time, the marker candidate may be selected according to a criterion suitable for the target gene diagnosis. For example, it is possible to select a combination having the maximum average absolute value of correlation coefficients obtained in the
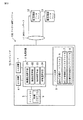
図9は、第3の関連性一覧表から最適なマーカー候補を選択する候補選択手段24を備えたマーカー選定システム100の概要図である。候補選択手段24は、処理装置2内に備えられる。
FIG. 9 is a schematic diagram of a
図9のマーカー選定システム100では、該候補選択手段24によって選択された最適なマーカー候補のみを出力装置4によって出力してもよい。或いは、第3の関連性一覧表に、マーカー候補の適性を付記して出力してもよい。
In the
次に、第2の実施形態として、遺伝子診断式作成プログラム、並びに、該プログラムを実行するための装置及びシステムが提供される。 Next, as a second embodiment, a genetic diagnosis formula creation program, and an apparatus and a system for executing the program are provided.
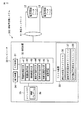
図10は、遺伝子診断式を作成するプログラムを実行するための診断式作成システム200の概要図である。診断式作成システム200は、コンピュータ10と、該コンピュータ10と通信ネットワーク11を介して接続された集団1の検体データベース12及び集団2の検体データベース13から構成される。
FIG. 10 is a schematic diagram of a diagnostic formula creation system 200 for executing a program for creating a genetic diagnostic formula. The diagnostic formula generation system 200 includes a
コンピュータ10は、処理装置2と、該処理装置2に接続されたメインメモリ5、入力装置1、出力装置4、及び、ファイル装置3から構成される。本実施形態において、処理装置2は、関連性演算手段21、集団比較手段22、傾向判定手段23に加え、診断式作成手段25を具備する。本実施形態において、コンピュータ10の構成は、処理装置2を除いて上記第1の実施形態と同様の構成であってよい。
The
第2の実施形態では、上記第1の実施形態と同様に第3の関連性一覧表が作成される。続いて、第3の関連性一覧表に記載されたマーカー候補を用いて、診断式作成手段25によって診断式が作成される。この診断式は、各集団のために個別に作成される。 In the second embodiment, a third relevance list is created as in the first embodiment. Subsequently, a diagnostic formula is created by the diagnostic formula creation means 25 using the marker candidates described in the third association list. This diagnostic formula is created individually for each population.
具体的には、前記第3の関連性一覧表の各マーカー候補について、前記A群に属する検体をX=−1とし、前記B群に属する検体をX=+1とし、また、診断事項に対する傾向によって、各検体をy=1、又はy=0に分類する。例えば、有効群をy=1、無効群をy=0とする。 Specifically, for each marker candidate in the third relevance list, the sample belonging to the group A is set to X = −1, the sample belonging to the group B is set to X = + 1, and the tendency for the diagnosis items To classify each specimen as y = 1 or y = 0. For example, assume that the effective group is y = 1 and the ineffective group is y = 0.
このようにして統計学的に回帰直線を求めることにより、各集団のための診断式 Y=aX+t(ここで、a及びtは定数である)が算出される。この診断式により、診断事項に対する予想率が算出される。例えば、ある検体において治療が有効である確率が算出される。 Thus, by calculating the regression line statistically, the diagnostic formula Y = aX + t (where a and t are constants) for each population is calculated. With this diagnostic formula, an expected rate for the diagnostic item is calculated. For example, the probability that the treatment is effective in a certain sample is calculated.
この診断式は、第3の関連性一覧表に記載された全てのマーカー候補について作成されてよい。ここで、作成された診断式は、すべて出力されてもよいが、さらに最も診断に適した診断式を選択することもできる。 This diagnostic formula may be created for all marker candidates listed in the third association list. Here, all the created diagnostic formulas may be output, but the diagnostic formula most suitable for the diagnosis can also be selected.
この診断式の選択は、図10の処理装置2内にさらに診断式選択手段26を備えることによって実行可能である。以下に、診断式選択手段26によって実行される最適な診断式を選択する方法を説明する。
This selection of the diagnostic formula can be executed by further providing a diagnostic formula selection means 26 in the
まず、上記診断式作成手段25によって作成された診断式の寄与率Kを算出する。寄与率Kとは、診断式の精度を評価するパラメータであり、

上述の通り、診断式は集団毎に作成される。またそれぞれの診断式は、各集団に対する寄与率Kを有する。例えば、前述した組合せ番号(35−6)のマーカー候補を例に説明する。このマーカー候補は、集団1に対する診断式Y1と、集団2に対する診断式Y2を有する。ここで、集団1に対する診断式Y1は、集団1に対する寄与率K11と、集団2に対する寄与率K12を有する。同様に、集団2に対する診断式Y2は、集団1に対する寄与率K21と、集団2に対する寄与率K22を有する。従って、一つのマーカー候補に対して、集団数の2乗個の寄与率Kが算出されることが理解されよう(実施例1及び図17参照)。
As described above, a diagnostic formula is created for each group. Each diagnostic formula has a contribution rate K for each group. For example, the marker candidate with the combination number (35-6) described above will be described as an example. The candidate marker includes a diagnosing Y 1 for
この寄与率Kは、各集団に対する診断式の精度を表すため、4つの寄与率、K11、K12、K21、K22の平均値が最大であるようなマーカー候補が最もよいマーカーであるといえる。 Since this contribution rate K represents the accuracy of the diagnostic formula for each population, the marker candidate having the maximum average value of the four contribution rates, K1 1 , K1 2 , K2 1 , K2 2 is the best marker. It can be said.
従って、診断式選択手段26は、各診断式について4個(集団が3個以上の場合には集団数の2乗)の寄与率Kの平均値を算出し、該平均値が最大であるようなマーカー候補をマーカーとして選択する。 Therefore, the diagnostic formula selection means 26 calculates the average value of the contribution rate K of four (or the square of the number of groups when there are three or more groups) for each diagnostic formula, so that the average value is the maximum. Select a marker candidate as a marker.
次に、2個の診断式、Y1とY2のうちのどちらを用いるかであるが、診断式Y1の集団1に対する寄与率K11と集団2に対する寄与率K12の平均と、診断式Y2の集団1に対する寄与率K21と集団2に対する寄与率K22の平均を比較し、平均寄与率が高い方の診断式を採用することが望ましい。ただし、平均値の差がそれほど大きくない場合は、どちらの診断式を用いてもかまわない。また、集団1と集団2について同一の診断式を用いるのが原則であるが、例えば、K11のほうがK21より著しく大きく、かつK22の方がK12よりも著しく大きいような場合には、集団1に対してはY1式を採用し、集団2に対してはY2式を採用することも可能である。
Next, which of the two diagnostic formulas Y 1 and Y 2 is used, the average of the contribution rate K1 1 to the population 1 and the contribution rate K1 2 to the
なお、本実施形態では、第3の一覧表のマーカー候補の全てについて診断式を作成したが、他のより適した選択基準に従って最適なマーカー候補を選択した後に、該候補についてのみ診断式を作成してもよい。 In the present embodiment, diagnostic formulas are created for all the marker candidates in the third list, but after selecting the optimal marker candidates according to other more suitable selection criteria, diagnostic formulas are created only for the candidates. May be.
第3の実施形態として、マーカー又は遺伝子診断式により、新規の診断対象検体を遺伝子診断するためのプログラム、並びに、該プログラムを実行するための装置及びシステムが提供される。 As a third embodiment, there are provided a program for genetic diagnosis of a new specimen to be diagnosed by a marker or a genetic diagnosis formula, and an apparatus and system for executing the program.
図11は、遺伝子診断プログラムを実行するための遺伝子診断システム300の概要図である。遺伝子診断システム300は、コンピュータ30と、該コンピュータ30と通信ネットワーク11を介して接続された集団1の検体データベース12及び集団2の検体データベース13から構成される。
FIG. 11 is a schematic diagram of a gene diagnosis system 300 for executing a gene diagnosis program. The gene diagnosis system 300 includes a
コンピュータ30は、処理装置32と、該処理装置32に接続されたメインメモリ35、入力装置31、出力装置34、及び、ファイル装置33から構成される。本実施形態において、処理装置32は、関連性演算手段41、集団比較手段42、傾向判定手段43、組合せ選択手段44、診断式作成手段45、診断式選択手段46に加え、さらに診断手段47を具備する。本実施形態において、コンピュータ10の構成は、処理装置2を除いて上記第1及び第2の実施形態と同様の構成であってよい。
The
本実施形態では、上記第2の実施形態と同様に診断式を作成する。作成された診断式のうち、診断に最適なものを診断式選択手段46によって選択する。これにより選択された診断式を用いて、診断対象検体の診断を行う。 In the present embodiment, a diagnostic formula is created as in the second embodiment. Of the created diagnostic formulas, the diagnostic formula selection means 46 selects the most suitable diagnostic formula. The diagnosis target specimen is diagnosed using the selected diagnostic formula.
まず、入力装置によって、診断の対象検体の遺伝子配列を入力する。また、診断事項についての指示を入力する。該対象検体の遺伝子配列は、診断に用いられる遺伝子多型についての配列のみであってもよいが、測定した全ての遺伝子多型に関する情報であることが望ましい。 First, a gene sequence of a specimen to be diagnosed is input by an input device. Also, input instructions for diagnostic items. The gene sequence of the target sample may be only the sequence for the gene polymorphism used for diagnosis, but it is preferably information on all the measured gene polymorphisms.
診断手段47は、診断式選択手段46によって選択された診断式を読み込む。次いで、入力された対象検体の遺伝子配列を該診断式に適用する。これによって、該検体の診断事項に対する予想率が算出される。算出された予想率は、出力装置34によって出力される。この場合、出力装置34から出力された予想率の値を、医師が解釈をして、治療を行うか行わないかを判断することになる。従って、判断を行う医師には、本治療法と有効率を的確に判断できるだけの専門性が必要である。そこで、より簡便な方法として、例えば、算出された有効性予想率が0.7以上の場合は、治療法は「有効」、0.3以下では「無効」、0.3以上0.7以下では「要検討」と出力することも可能である。この場合、医師は、特に専門知識が無くても、「有効」の場合は治療を行い、「無効」の場合は治療を行わない、「要検討」の場合は、患者の希望により判断する等、診断を標準ルーチン化することが可能である。
The
上記例では、回帰直線を求めることにより、診断式を作成したが、判別分析により判別式を導きだし、これを診断式として利用することも可能である。判別式Z=bX+u(ここで、b及びuは定数である)は、検体の遺伝子配列を測定して得られたXを代入した際、Z>0であれば、治療法は有効、Z<0であれば治療法は無効と判別されるような統計学的な式である。診断式として判別式を用い、Z>0の場合は「○」、Z<0の場合は「×」を出力するようにシステムを作成すれば、医師はより簡単に診断を下すことが出来る。 In the above example, a diagnostic formula is created by obtaining a regression line. However, it is also possible to derive a discriminant by discriminant analysis and use it as a diagnostic formula. The discriminant Z = bX + u (where b and u are constants) is effective if Z> 0 when substituting X obtained by measuring the gene sequence of the specimen, Z < If it is 0, it is a statistical formula that determines that the treatment method is invalid. If a discriminant is used as a diagnostic expression and a system is created so that “◯” is output when Z> 0 and “X” is output when Z <0, the doctor can make a diagnosis more easily.
以上のように、対象検体を診断することができる。なお、診断事項は治療の有効性に限らず、病気のかかり易さなどであってもよい。適切なマーカーから導かれた診断式を用いることにより、所望の診断をすることが可能である。 As described above, the target sample can be diagnosed. The diagnosis item is not limited to the effectiveness of treatment, but may be the likelihood of getting a disease. By using a diagnostic formula derived from an appropriate marker, it is possible to make a desired diagnosis.
また、診断式を用いずに、マーカーによりA群に分類されるかB群に分類されるかのみによって簡便に診断することも可能である。この場合、診断手段47は、まず傾向判定手段43によって作成された第3の一覧表から、マーカーを読み出す。また、対象検体の遺伝子配列を検索し、マーカーと同様の遺伝子多型組合せ及びその対立遺伝子型組合せが存在するか否かを判定する。この判定に基づき、用いたマーカーの診断事項に対する傾向に基づいて診断する。診断された結果は、出力装置34によって出力される。
Moreover, it is also possible to make a simple diagnosis only by classifying into a group A or a group B according to a marker without using a diagnostic formula. In this case, the
なお、遺伝子診断した対象検体の治療が終了し、治療結果が判明した後に、新たな治験結果を検体データベースに追加することが可能である。この場合、この新しい検体データを加えた検体データベースに基づいて、関連性一覧表以下の一覧表を更新することにより、さらに診断システムの精度を向上させることができる。 It should be noted that new clinical trial results can be added to the specimen database after the treatment of the target specimen subjected to genetic diagnosis is completed and the treatment results are known. In this case, the accuracy of the diagnostic system can be further improved by updating the list below the relevance list based on the sample database to which the new sample data is added.
以上述べた本願発明によれば、新たな測定を行うことなく、すでに測定済みの遺伝子型のデータを最大限活用して、コンピュータ処理のみで遺伝子診断に利用するマーカーを探索することができる。よって、大幅な時間と経費を節約することができる。 According to the present invention described above, it is possible to search for a marker to be used for gene diagnosis only by computer processing by making maximum use of already measured genotype data without performing a new measurement. Thus, significant time and expense can be saved.
さらに、本発明によれば以下のような利点が得られる。 Further, according to the present invention, the following advantages can be obtained.
例えば、集団1が遺伝子診断のための治験を行った集団であるとする。また集団2が実際に遺伝子診断システムを利用し、その診断結果に基づいて治療を行っている医療機関であるとする。この場合、遺伝子診断開始初期の段階では、集団2の検体数は、集団1の検体数に比べて少ない。よって、集団1と集団2を合わせて1つの母集団として扱い、診断式のアップデートを行うと、集団2の結果は反映され難いことになる。
For example, it is assumed that the
もし、何らかの理由により、集団1と集団2において重要な遺伝子に差がある場合、実際の診断治療を行っている集団2の結果をより強く反映させる必要がある。しかしながら、母集団を1つにした場合は、集団2の結果は反映され難い。
If there is a difference in important genes between the
また、母集団を1つにするためには、それぞれの集団のデータを全て保存しておく必要があり、データ管理の負担が増大する。さらに、母集団の全件数が大きくなるので、演算に時間がかかり、アップデートに手間がかかることになる。 Further, in order to make one population, it is necessary to save all data of each group, which increases the burden of data management. Furthermore, since the total number of populations increases, it takes time to calculate and takes time to update.
しかしながら本発明のように、全検体データを統合せずに解析することによって、集団2のような少数集団の情報であっても確実に反映させることができる。また、集団1に関しては治験データを全て保存する必要が無く、関連性一覧表のみを保存しておけばよいので、個人情報保護の観点からも好都合である。
However, as in the present invention, by analyzing all specimen data without integrating them, even information on a minority group such as
即ち、本発明に拠れば、各集団の特徴を消失することなく、適切なマーカー及び診断式を選定することができ、精度の高い実用的な遺伝子診断システムを提供することができる。また、集団毎に検体データベースが別れているため、新しい検体のデータを追加する場合でも、全集団のデータベースについて演算し直す必要がなく、簡便且つ効率的である。 That is, according to the present invention, appropriate markers and diagnostic formulas can be selected without losing the characteristics of each group, and a highly accurate and practical gene diagnostic system can be provided. In addition, since the specimen database is separated for each group, even when new specimen data is added, it is not necessary to recalculate the database for all the groups, and it is simple and efficient.
なお、本発明に従って作成された遺伝子診断のための診断式は、コンピュータ読み取り可能な記録媒体に記録されて提供されることも可能である。 The diagnostic formula for gene diagnosis prepared according to the present invention can be provided by being recorded on a computer-readable recording medium.
またさらに、第4の実施形態として、上記第2の関連性一覧表を、疾病や治療のメカニズムに関わる遺伝子の探索に用いることができる。 Furthermore, as a fourth embodiment, the second relevance list can be used for searching for genes related to diseases and treatment mechanisms.
具体的には、上記の第2の関連性一覧表に記載された遺伝子多型組合せを構成する遺伝子を、結びつけるシグナル伝達経路を探索する。これにより、従来知られていなかったシグナル経路を明らかにすることも可能である。また、そのシグナル経路上に存在する遺伝子を、文献調査等によって明らかにすることも可能である。 Specifically, a signal transduction pathway that links the genes constituting the gene polymorphism combination described in the second association list is searched. Thereby, it is also possible to clarify a signal pathway that has not been conventionally known. It is also possible to clarify genes existing on the signal pathway by literature surveys or the like.
このような遺伝子に存在する多型を探索することにより、新たな有力候補を発見することも可能である。これにより、従来の研究者の勘に頼る方法よりも、はるかに効率良く新規遺伝子の探索が可能である。 By searching for polymorphisms in such genes, it is also possible to find new potential candidates. This makes it possible to search for new genes much more efficiently than methods that rely on the intuition of conventional researchers.
また、上記第2の関連性一覧表に記載された組合せは、その傾向が同一であるか相違しているかによらずに使用することができる。なぜならば、遺伝子探索においては、たとえ傾向や相関係数の符号が反対であっても、2つの遺伝子を結びつけるようなシグナル伝達経路探索は可能であるからである。 The combinations described in the second relevance list can be used regardless of whether the tendency is the same or different. This is because, in gene search, it is possible to search for a signal transduction pathway that links two genes even if the signs of trends and correlation coefficients are opposite.
以下に、本発明の具体的な実施例を記載するが、本発明はこれらに限定されるものではない。以下の実施例では、C型関連ウイルスに感染した検体に対する、インターフェロンによる治療の有効性を診断するために用いるマーカーを選定した。 Although the specific Example of this invention is described below, this invention is not limited to these. In the following examples, a marker used for diagnosing the effectiveness of treatment with interferon on a specimen infected with a type C-related virus was selected.
[実施例1]
図12は、C型肝炎のインターフェロン治療に関するT病院の検体データベースの内容である。該データベースには、T病院で過去に行った治験結果が記録されている。図12のデータベースの内容を説明する。治験を行った患者に識別番号を振り、検体番号欄に記入する。なお、個人情報保護のため、検体番号とカルテ番号は相違する。カルテ番号と検体番号の対応表は、本発明によるシステムとは別のシステムで管理されている。
[Example 1]
FIG. 12 shows the contents of the specimen database of T hospital regarding interferon treatment for hepatitis C. The database records the results of clinical trials conducted in the past at T Hospital. The contents of the database in FIG. 12 will be described. Assign an identification number to the patient who has conducted the trial and fill in the specimen number column. In order to protect personal information, the specimen number and chart number are different. The correspondence table between the chart number and the specimen number is managed by a system different from the system according to the present invention.
治療結果の欄には、インターフェロン治療が成功したか否かを示している。SRはインターフェロン治療によりC型肝炎ウイルスが完全に排除された(一般には著効例と呼ぶ)ことを示す。NRはそれ以外(非著効)である。 The treatment result column shows whether or not the interferon treatment was successful. SR indicates that hepatitis C virus has been completely eliminated by interferon treatment (generally referred to as an effective case). NR is otherwise (non-effective).
3列目以降には、測定した遺伝子型を記入している。MxA-123はMxAタンパク遺伝子のプロモーター領域の−123位置にあるSNPであり、塩基はCかAをとる。対立遺伝子型としては、C/C、C/A、A/Aの3種類が存在する。データベースの対応する欄には、検体が有する対立遺伝子型が記載されている。 In the third and subsequent columns, the measured genotype is entered. MxA-123 is a SNP at position −123 of the promoter region of the MxA protein gene, and the base is C or A. There are three allele types: C / C, C / A, and A / A. In the corresponding column of the database, the allele type of the specimen is described.
MxA-88は、MxAタンパク遺伝子プロモーター領域の-88位置に存在するSNPであり、塩基はGかTをとる。対立遺伝子型はG/G、G/T、又はT/Tである。 MxA-88 is a SNP present at position −88 of the MxA protein gene promoter region, and the base takes G or T. The allelic type is G / G, G / T, or T / T.
5列目のMBL遺伝子のSNPにおける対立遺伝子型は、YA又はXBの2種類である。この場合、MBLのSNPと他のSNPとの組合せの対立遺伝子型組合せリストは、図13(2)のようになる。 There are two types of allelic types in the SNP of the MBL gene in the fifth row, YA or XB. In this case, the allele combination list of combinations of MBL SNPs and other SNPs is as shown in FIG.
LMP7のSNPの対立遺伝子型は、C/C、C/A、又はA/Aである。IRF−1のSNPの対立遺伝子型は、C/C、C/T、又はT/Tである。8列目と9列目にはOPN遺伝子の遺伝子型が記載されている。OPN遺伝子には、数箇所のSNPが存在することが知られている。プロモーター領域の-443位置にあるSNPは、塩基C又はTをとる。その対立遺伝子型は、C/C、C/T、又はT/Tである。 The allele type of the SNP of LMP7 is C / C, C / A, or A / A. The allelic form of the IRF-1 SNP is C / C, C / T, or T / T. In the 8th and 9th rows, the genotype of the OPN gene is described. It is known that there are several SNPs in the OPN gene. The SNP at position −443 of the promoter region takes base C or T. The allelic type is C / C, C / T, or T / T.
OPN遺伝子のプロモーター領域の-155位置にある多型は、塩基Gが1個ある場合と、塩基Gが2個ある場合がある。それぞれを、GあるいはGGと書くことにする。Gである場合と、GGである場合では、遺伝子の長さが異なる。対立遺伝子型は、G/G、G/GG、GG/GGの3種類である。 The polymorphism at position −155 in the promoter region of the OPN gene may have one base G or two bases G. Each is written as G or GG. The length of the gene differs between G and GG. There are three allele types: G / G, G / GG, and GG / GG.
同様に、10列目以降にも遺伝子型が記入されているが、図12では省略する。図12はT病院における治験結果であるが、S病院についても全く同様のデータベースが作成保存されている。 Similarly, genotypes are entered in the 10th and subsequent columns, but are omitted in FIG. FIG. 12 shows the results of clinical trials at T hospital, and the same database is created and stored for S hospital.
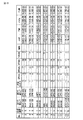
T病院の検体データデータベース、並びに、図8に例示した対立遺伝子型組合せリストに基づいて、関連性演算部で治療の有効性との関連性を演算した。その結果、有意の関連があった組合せから、図14に示す一覧表が作成された。この図14は、T病院の関連性一覧表の一部である。 Based on the specimen data database of T hospital and the allelic combination list illustrated in FIG. 8, the relevance calculation unit calculates relevance with the effectiveness of treatment. As a result, a list shown in FIG. 14 was created from combinations that had a significant relationship. FIG. 14 is a part of a relevance list of T hospital.
第1の遺伝子と第2の遺伝子の欄には組合せた2つのSNPが位置する遺伝子名が記載される。多型組合せ欄には、片方の遺伝子がMBLの場合は図13−(2)、その他は図13−(1)に示したように、対立遺伝子型をどのように組み合わせたかを示す番号が記載してある。対立遺伝子型組合せリストを参照して番号で記載しても良く、或いは対立遺伝子型を表記してもよい。 In the first gene and second gene columns, the names of the genes where the two combined SNPs are located are described. In the polymorphism combination column, as shown in FIG. 13- (2) when one of the genes is MBL, the number indicating how the alleles are combined is shown in FIG. 13- (1) in the other. It is. Reference may be made to a list of allele types to indicate numbers, or allele types may be indicated.
SR(A)はA群に分類され、且つ著効だった検体数である。具体的には、図14のNo.1の例では、第1の遺伝子MxA-88と第2の遺伝子IRF-1が対立遺伝子組合せ4を満足する検体をA群に分類し、それ以外をB群に分類した。今の場合、具体的な塩基は、MxA-88についてはX=G,Y=T、IRF-1では、U=C,V=Tである。NR(A)はA群に分類され且つ非著効だった検体数である。SR(B)はB群に分類され、且つ著効だった検体数である。NR(B)はB群に分類され、且つ非著効だった検体数である。
SR (A) is the number of specimens classified into the A group and effective. Specifically, in the example of No. 1 in FIG. 14, the samples in which the first gene MxA-88 and the second gene IRF-1 satisfy the
傾向欄には、A群の方が著効率が高い場合を+、反対の場合を−で示してある。chi2欄にはカイ2乗値を記載した。P値欄にはカイ2乗検定によるP値を記載した。次列のchi2yは、Yatesの補正を加えたカイ2乗値を記載した。Py値欄には、Yatesの補正を加えたP値を記載した。本実施例では、Py値<0.05であれば有意の関連性があると判定した。第2の母集団であるS病院についても同様にS病院関連性一覧表を作成した。 In the trend column, the case where group A has a higher efficiency is indicated by +, and the opposite case is indicated by-. The chi-square column shows the chi-square value. In the P value column, the P value by chi-square test is described. In the next column, chi2y is a chi-square value with a correction for Yates. In the Py value column, the P value with Yates corrected is described. In this example, it was determined that there was a significant association if the Py value was <0.05. Similarly, the S Hospital Relevance List was created for the second hospital, S Hospital.
図15は、第2の関連性一覧表の具体的内容である。No.1とNo.2は、MxA-123とOPN-443を組合せた場合であり、且つ、図13−(1)における識別番号5の対立遺伝子型組合せである。ここで、本遺伝子組合せにおいては、X=C、U=C、V=Tである。従って、MxA-123がC/Cであり、かつ、OPN-443がC/CあるいはC/Tの組合せを持つ検体をA群とし、その他のSNP組合せを持つ場合をB群に分類すると、A群とB群では治療効果に有意の差があったことを示している。その傾向は、No.1に示すT病院でもNo.2にしめすS病院でも−であった。即ち、A群の方がインターフェロンが効きにくいことが示された。このようにT病院とS病院で傾向が同じ組合わせが、次の図16に示す第3の関連性一覧表に記載される。
FIG. 15 shows specific contents of the second relevance list. No. 1 and No. 2 are combinations of MxA-123 and OPN-443, and are allelic combinations of
ところで、図15のNo.7とNo.8に着目する。これはMBL遺伝子とSTAT-249とよばれるSNPの組合せである。No.7のT病院では傾向は+であるのに対し、No.8のS病院では傾向は反対で−である。即ち、MBLとSTAT-249が識別番号4の対立遺伝子組合せを有する検体と、それ以外の対立遺伝子組合せを有する検体は、T病院でもS病院でもインターフェロン有効性と有意の相関があるが、T病院ではA群のほうがインターフェロンが効きやすい傾向にあり、反対に、S病院ではB群のほうがインターフェロンが効きやすい傾向にあることが示されている。つまり、医療機関によって傾向が全く反対である。このような場合、その組合せを直接遺伝子診断に利用することは出来ない。よって、図16に示す第3の関連性一覧表からは除外される。
By the way, attention is focused on No. 7 and No. 8 in FIG. This is a combination of MBL gene and SNP called STAT-249. The trend at No. 7 Hospital T is +, whereas the trend at No. 8 Hospital S is the opposite-. That is, specimens having an allele combination of MBL and STAT-249 with
ただし、この結果は、医学的にはMBLとSTATを繋ぐようなシグナル伝達経路が存在する可能性を示している。また、その経路の伝達の仕方は、医療機関に敏感に依存するような特徴を持っていることを示唆している。従って、実施例1で測定した27箇所の遺伝子型以外に重要な遺伝子が、MBLとSTATをつなぐシグナル伝達経路上に存在する可能性があることを示唆している。この情報は、新規マーカー探索に重要である。 However, this result indicates the possibility that there exists a signal transduction pathway that connects MBL and STAT in medical terms. In addition, it is suggested that the way of transmission of the route has characteristics that depend sensitively on medical institutions. Therefore, it is suggested that important genes other than the 27 genotypes measured in Example 1 may exist on the signal transduction pathway connecting MBL and STAT. This information is important for searching for new markers.
さて、本発明による遺伝子診断システムでは、図16に示す第3の関連性一覧表に記載された組合せをマーカーとして用いる。図16には、1から5に示す5種類の組合せがあるが、本実施例では以下に述べる方法で、最良の組合せを選択した。
Now, in the genetic diagnosis system according to the present invention, combinations described in the third association list shown in FIG. 16 are used as markers. In FIG. 16, there are five types of
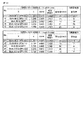
図17に示すt1式は、図16のNo.1の遺伝子多型組合せ(MxA-88とOPN-443)が、図13−(1)の識別番号5の対立遺伝子型組合せかそれ以外かを比較した場合の式である。具体的には、MxA-88がG/Gであり、かつOPN-443がC/CあるいはC/Tの場合とそれ以外を比較した場合である。
The t1 expression shown in FIG. 17 indicates whether the No. 1 gene polymorphism combination (MxA-88 and OPN-443) in FIG. 16 is the allelic combination of
検体が、この対立遺伝子型組合せを有する場合に、X=−1と数値化し、それ以外を+1に数値化する。また、インターフェロン治療結果が著効だった検体をy=1、非著効だった検体をy=0と数値化し、Xをyに関連つけるように決定した回帰直線を示したものである。t1の具体的な回帰直線はY=0.261X+0.511であった。この式Yが、予想著効率を与える診断式である。 When the specimen has this allele combination, it is digitized as X = −1, and the rest is digitized as +1. In addition, a regression line is shown in which a sample with a successful interferon treatment result is expressed as y = 1, a sample with a non-effective response as y = 0, and X is determined to relate to y. The specific regression line for t1 was Y = 0.261X + 0.511. This formula Y is a diagnostic formula that gives the expected work efficiency.
診断式の精度を評価するパラメータとして、寄与率Kを次式で定義した。寄与率とは、導いた診断式が治療法の有効性をどの程度説明するかを示すものである。その選択に当たって計算した判定基準が図17にまとめてある。
ここで、全てのデータyiが診断式Yで完全に説明される場合にK=1であり、寄与率は1になる。診断式Yが回帰直線の場合は、Kは相関係数の二乗に等しい。 Here, when all the data yi are completely explained by the diagnostic equation Y, K = 1 and the contribution rate is 1. When the diagnostic formula Y is a regression line, K is equal to the square of the correlation coefficient.
図17のt1式は、T病院検体にフィッティングした回帰直線であるが、T病院に対する寄与率は25%であった。t1式を用いて、異なる母集団であるS病院検体をどの程度説明するかを調べると、寄与率は32%であった。図17のs1式は、MxA-88とOPN-443の組合せを用いて、S病院検体にフィッティングした回帰直線である。この回帰式を診断式として用いると、S病院検体に対する寄与率は44%であり、T病院検体に対する寄与率は15%であることが分かった。 The expression t1 in FIG. 17 is a regression line fitted to the T hospital specimen, and the contribution rate to the T hospital was 25%. Using the t1 equation, the contribution rate was 32% when it was examined how much the S hospital samples that are different populations were explained. The equation s1 in FIG. 17 is a regression line fitted to the S hospital specimen using a combination of MxA-88 and OPN-443. Using this regression equation as a diagnostic equation, it was found that the contribution rate to the S hospital sample was 44% and the contribution rate to the T hospital sample was 15%.
図16の第3の関連性一覧表に記載されている他の遺伝子組合せに関しても同様の計算を行った結果が、図17のt2〜t5とs2〜s5である。本実施例では、計算した4種類の寄与率の平均値が最大になるような遺伝子組合せを新たなマーカーとして選定した。 Results obtained by performing similar calculations for other gene combinations described in the third association list in FIG. 16 are t2 to t5 and s2 to s5 in FIG. In this example, a gene combination that maximizes the average value of the four calculated contribution rates was selected as a new marker.
具体的には、図16から分かるように、MxA-88とOPN-443の組合せは、4種類の寄与率がそれぞれ、25, 32, 44, 15%である。その平均値は29%であり、5個の候補の中で最大であった。よって、この組合せを遺伝子診断のマーカーとして選定した。 Specifically, as can be seen from FIG. 16, in the combination of MxA-88 and OPN-443, the four types of contribution rates are 25, 32, 44, and 15%, respectively. The average value was 29%, the largest among the five candidates. Therefore, this combination was selected as a marker for gene diagnosis.
本実施例では、最終的に利用するマーカーとして、遺伝子組合せを1個のみ選定した。しかし、第3の関連性一覧表に記載されている全ての組合せに対して、適当な重み付けを行った線形関数を診断式として作成してもよい。また、任意の複数個の組合せを用いて診断式を作成してもよい。 In this example, only one gene combination was selected as the marker to be finally used. However, a linear function obtained by appropriately weighting all combinations described in the third relevance list may be created as a diagnostic expression. Moreover, you may create a diagnostic formula using arbitrary several combinations.
また、遺伝子多型組合せによる診断式に加えて、単独の遺伝子多型をあわせてマーカーとして用いてもよい。この方法は、例えば、T病院とS病院に共通して重要である遺伝子がいくつか存在しているが、それらの寄与率が低い場合に有効である。他のマーカーを加えることによって、診断式の精度を上昇させることができる。 In addition to the diagnostic formula based on the combination of gene polymorphisms, a single gene polymorphism may be combined and used as a marker. This method is effective when, for example, there are some genes that are important in both T hospital and S hospital, but their contribution rate is low. By adding other markers, the accuracy of the diagnostic formula can be increased.
[実施例2]
次に、集団が3つ存在する場合を例に説明する。本実施例でも、C型関連ウイルスに感染した検体に対する、インターフェロンによる治療の有効性を診断するために用いるマーカーを選定した。しかしながら、第一の実施例と異なり、最近開発された新しいタイプのインターフェロンと抗ウイルス剤の併用療法による治験結果を利用した。本新手法は、当初日本では導入されていなかったため、米国での治験結果を用いて解析を行った。
[Example 2]
Next, a case where there are three groups will be described as an example. Also in this example, a marker used for diagnosing the effectiveness of treatment with interferon on a specimen infected with a C-type related virus was selected. However, unlike the first example, the results of a recently developed clinical trial with a new type of interferon / antiviral combination therapy were used. Since this new method was not originally introduced in Japan, analysis was performed using the results of clinical trials in the United States.
米国での治験結果を日本に適用する際の最大の問題点のひとつは、人種の違いである。しかも、米国にはいろいろな人種が混在している。そこで、もし、人種により治療効果に差がある場合には、全てのデータを統合して1つの母集団として解析すると、特定の人種、特にデータ数が少ない人種の情報が埋没して失われる可能性が高い。 One of the biggest problems in applying the US clinical trial results to Japan is the race. Moreover, there are various races in the United States. Therefore, if there is a difference in the treatment effect depending on race, if all the data is integrated and analyzed as one population, information on a specific race, especially a race with a small number of data, is buried. It is likely to be lost.
今回用いた治験結果は、全部で150検体であり、その中には、白人、黒人、ネイティブアメリカンの3種類の人種が含まれていた。内訳は、白人60検体、黒人が70検体、ネイティブアメリカンが20検体であった。日本人は、ネイティブアメリカンに最も近い人種と考えられるので、ネイティブアメリカンに関する情報を重要視するべきであると考えられる。 The total number of clinical trials used in this study was 150, including three races of white, black and native American. The breakdown was 60 white samples, 70 black samples, and 20 native American samples. Japanese people are considered to be the closest race to Native Americans, so information on Native Americans should be emphasized.
しかし、ネイティブアメリカンの検体数は白人や黒人の検体数に比べて少ないため、これら全150検体を1つの母集団として解析した場合、ネイティブアメリカンのみに強く見られる傾向は、隠れてしまう可能性がある。しかしながら、本発明による手法を用いることにより、米国での治験結果を日本人に対する新治療方法有効性予測に効率的に利用することが可能である。 However, since the number of Native American specimens is small compared to the number of white and black specimens, when all 150 specimens are analyzed as a single population, there is a possibility that the tendency seen only in Native Americans may be hidden. is there. However, by using the method according to the present invention, it is possible to efficiently use the results of clinical trials in the United States for predicting the effectiveness of new treatment methods for Japanese.
具体的には、検体データを人種毎に分類し、白人、黒人、ネイティブアメリカンの3つの集団とした。白人検体データベースには、白人60検体について、新治療法と関連がありそうなSNPを8箇所測定した結果と、各検体で新治療法が有効だったか無効だったかの治療結果が保存されている。 Specifically, sample data was classified by race, and three groups of white, black, and native American were used. In the white sample database, the results of measuring 8 SNPs that are likely to be related to the new treatment method for 60 white samples and the treatment results indicating whether the new treatment method was effective or invalid for each sample are stored.
同様に、黒人検体データベースには、黒人70検体について、8箇所のSNPと治療結果が保存されている。ネイティブアメリカン検体データベースには、ネイティブアメリカン20検体分のSNPデータと治療結果が保存されている。 Similarly, in the black sample database, eight SNPs and treatment results are stored for 70 black samples. The Native American specimen database stores SNP data and treatment results for 20 Native American specimens.
なお、今回測定した8箇所のSNPを、a〜hと呼ぶことにする。これら8箇所のSNPのうち、任意の2つを組み合わせ、(8×7)/2=28 種類のSNP組合せを一覧にした遺伝子多型組合せリストを作成した。さらに、該リストの各遺伝子多型組合せに対応する対立遺伝子型の組合せリストを作成した。 The eight SNPs measured this time are referred to as a to h. Any two of these 8 SNPs were combined to create a gene polymorphism combination list that lists (8 × 7) / 2 = 28 types of SNP combinations. Furthermore, a allelic combination list corresponding to each gene polymorphism combination in the list was created.
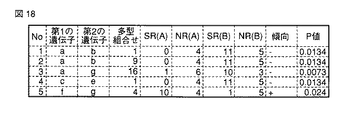
まず、ネイティブアメリカン検体データベース中のデータを用いて、遺伝子型の組合せと治療の有効性の関連性を演算した。本解析では、カイ2乗検定を行い、P値が0.05以下の場合に有意の関連があるとした。その結果を図18に示す。図18の関連性一覧表は、「ネイティブアメリカン関連性一覧表」である。 First, using the data in the Native American specimen database, the relationship between the combination of genotypes and the effectiveness of treatment was calculated. In this analysis, a chi-square test was performed, and it was assumed that there was a significant association when the P value was 0.05 or less. The result is shown in FIG. The relevance list in FIG. 18 is a “native american relevance list”.
No.は通し番号であり、第1の遺伝子と第2の遺伝子の欄には組み合わせた2つの遺伝子多型が位置する遺伝子名が記載されている。多型組合せ欄には、対立遺伝子型の組合せを示す番号が記載されている。その具体的内容は、対立遺伝子型の組合せリストが参照される。本実施例では図13−(1)のリストを用いることができる。第一の実施例と同様に、指定した多型組合せを持つ検体をA群に分類し、それ以外の検体をB群に分類している。SR(A)、NR(A)、SR(B)、NR(B)は、第一の実施例と同様に、A群に分類され著効だった検体数、A群に分類され非著効だった検体数、B群に分類され著効だった検体数、B群に分類され非著効だった検体数をそれぞれ示している。 No. is a serial number, and the name of the gene where the two combined gene polymorphisms are located is described in the column of the first gene and the second gene. In the polymorphism combination column, a number indicating a combination of allelic types is described. The specific contents are referred to the allele combination list. In this embodiment, the list shown in FIG. 13- (1) can be used. Similar to the first embodiment, specimens having the designated polymorphic combination are classified into Group A, and other specimens are classified into Group B. SR (A), NR (A), SR (B), and NR (B) are the number of specimens classified as effective in group A and ineffective as classified in group A, as in the first example. The number of specimens, the number of specimens classified into the B group and effective, and the number of specimens classified into the B group and ineffective were shown.
傾向の欄には、A群の方がB群に比べて著効率が高い場合を+と定義し、B群の方がA群に比べて著効率が高い場合を−と定義している。 In the column of the trend, a case where the group A has a higher efficiency than the group B is defined as +, and a case where the group B has a higher efficiency than the group A is defined as-.
P値は、2群間の独立性検定によるP値を意味している。上で述べたように、本実施例では、P値が0.05以下の場合に有意の関連があるとみなして、関連性一覧表に記載している。しかしこれに限らず、第一の実施例のようにYatesの補正を加えたP値を用いて判定してもよいし、他の基準を用いても良い。 P value means P value by the independence test between two groups. As described above, in this embodiment, when the P value is 0.05 or less, it is considered that there is a significant relationship, and is described in the relationship list. However, the present invention is not limited to this, and determination may be made using a P value with correction of Yates as in the first embodiment, or other criteria may be used.
同様の手順で、白人検体データデータベースを用いて白人関連性一覧表を作成する。同様に、黒人検体データデータベースを用いて黒人関連性一覧表を作成する。次に、集団比較手段によって、異なる集団間に共通して有意の関連が見られたSNP組合せを抜き出して、第2の関連性一覧表を作成する。本実施例によるその具体的内容を図19に示す。 In a similar procedure, a white relevance list is created using the white sample data database. Similarly, a blackness relevance list is created using the black specimen data database. Next, the group comparison means extracts SNP combinations in which significant associations are found in common between different groups, and creates a second association list. The specific contents of this embodiment are shown in FIG.
第一の実施例では集団が2個だったので、2個の集団に共通して有意の関連があると判断されたSNP組合せを第2の関連性一覧表に記載した。しかし、第2の実施例では、集団が3個存在する。そこで、3個の集団全てに共通して有意の関連があると判断されたSNP組合せのみを第2の関連性一覧表に載せることができる。しかしながら、本実施例では、第2の関連性一覧表に記載するSNPの選定に以下のような基準を用いた。 Since there were two groups in the first example, SNP combinations determined to have a significant relationship common to the two groups were listed in the second relationship list. However, in the second embodiment, there are three groups. Therefore, only the SNP combinations determined to have a significant relationship common to all three groups can be included in the second relationship list. However, in this example, the following criteria were used for selection of SNPs described in the second relevance list.
というのは、上で述べたように、本解析の目的は、将来、日本人のC型肝炎患者治療に利用することである。治療効果は人種によりかなり異なると予想される。例えば、本実施例において、白人の著効例と非著効例はそれぞれ38と22で著効率は63%なのに対し、黒人ではそれぞれ20と50で著効率は29%である。白人と黒人では著効率が有意に(P=0.00007)異なった集団であることが分かる。 This is because, as mentioned above, the purpose of this analysis is to be used for the treatment of Japanese patients with hepatitis C in the future. The therapeutic effect is expected to vary considerably by race. For example, in the present example, white and non-effective cases are 38 and 22, respectively, and the efficiency is 63%, while blacks are 20 and 50, respectively, and the efficiency is 29%. It can be seen that whites and blacks are groups with significantly different efficiencies (P = 0.00007).
そして、ネイティブアメリカンでは著効例11、非著効例9で著効率は55%であり、ネイティブアメリカンと黒人の間では著効率に有意(P=0.028)の差が見られる。従って、新治療法の有効性は人種によって異なる可能性が高いと考えるのが自然である。 And in Native American, the remarkable efficiency is 55% in the effective example 11 and the non-effective example 9, and a significant difference (P = 0.028) is seen between the native American and the black. Therefore, it is natural to think that the effectiveness of new treatments is likely to vary by race.
さて、日本人は、人種としてはネイティブアメリカンに最も近いと一般に考えられている。従って、ネイティブアメリカンにおいて有意の関連が見られたSNP組合せを重要視したい。そこで、集団比較手段によって、ネイティブアメリカンと少なくとも他の1集団において、共通して有意の関連が見られたような組合せを選出するようにプログラムを設定した。 The Japanese are generally considered to be the closest to Native Americans as a race. Therefore, I would like to focus on SNP combinations that showed a significant association in Native American. Therefore, a program was set up to select a combination in which significant association was found in common between Native American and at least one other group by means of group comparison means.
従って、ネイティブアメリカンと白人に共通して重要な組合せ、あるいは、ネイティブアメリカンと黒人に共通して重要な組合せ、あるいは、ネイティブアメリカンと黒人と白人の3つの集団に共通して有意の関連があるような組合せが、図19に示す第2の関連性一覧表にリストアップされている。 Therefore, there seems to be a significant combination common to native Americans and whites, or an important combination common to native Americans and blacks, or three groups of native Americans, blacks and whites. These combinations are listed in the second relevance list shown in FIG.
図19において、No.1及びNo.2は遺伝子多型(SNP)aとbの組合せである。この対立遺伝子型の組合せは、図13の識別番号9の組合せである。No.1のネイティブアメリカンの集団とNo.2に示す黒人の集団で、新治療法の有効性とSNP組合せの間に有意の関連が見られた。この関連は、ネイティブアメリカンでも黒人でもB群の方がA群より著効率が高かった。両集団で関連の傾向が一致しているので、No.1とNo.2は第3の関連性一覧表にも記載される。
In FIG. 19, No. 1 and No. 2 are combinations of gene polymorphisms (SNPs) a and b. This allele combination is the combination of
なお、このSNP組合せに関しては、白人の集団では有意の関連が見られなかった。参考のためにNo.8として示した。白人集団ではP値が0.0638であり、0.05よりも大きいため、関連は無しと判断された。 In addition, regarding this SNP combination, no significant association was found in the white population. Shown as No. 8 for reference. In the white population, the P value was 0.0638, which was greater than 0.05, so it was judged that there was no association.
No.3及びNo.4は、ネイティブアメリカンと白人の集団において、遺伝子aと遺伝子gの組合せであり、且つ対立遺伝子型の組合せが識別番号16の組合せである。この組合せは、新治療法の有効性と有意の関連が見られたことを示している。ただし、傾向は、ネイティブアメリカンが−であり、反対に白人は+であった。従って、この組合せは第3の関連性一覧表には記載されない。
No. 3 and No. 4 are a combination of gene a and gene g in the Native American and Caucasian populations, and an allelic combination is a combination of
No.5〜7は、ネイティブアメリカン、白人、黒人の3つの集団すべてにおいて、新治療法有効性と有意の関連が見られた組合せである。また、傾向も3集団全てにおいて+であるので、これらは第3の関連性一覧表にも記載される。 Nos. 5-7 are combinations that were significantly associated with the effectiveness of the new treatment in all three populations: Native American, Caucasian, and Black. In addition, since the trend is + in all three groups, these are also described in the third relevance list.
本発明による遺伝子診断システムでは、第3の関連性一覧表に記載された遺伝子多型組合せをマーカーとして用いる。従って、マーカーとして用いるのは遺伝子aと遺伝子bの組合せで対立遺伝子型組合せが識別番号9の場合、及び、遺伝子fと遺伝子gの組合せで、対立遺伝子型組合せが識別番号4の場合の2種類の組み合わせである。以降、前者を組合せU、後者を組合せVと称する。
In the genetic diagnosis system according to the present invention, the gene polymorphism combinations described in the third association list are used as markers. Therefore, two types are used as markers: a combination of gene a and gene b, when the allelic combination is
次に候補選択手段によって、何れの組合せが最も好適の使用できるかを選択する。しかしながら、本実施例では候補となる組合せが2個しか見つからなかったため、この2個を変数として用い、診断式作成手段によって診断式を作成した。 Next, the candidate selection unit selects which combination can be most preferably used. However, since only two candidate combinations were found in the present example, these two were used as variables, and a diagnostic formula was created by the diagnostic formula creation means.
まず、i番目の検体の遺伝子組合せUがA群に分類される場合、u(i)=1と数値化した。またB群に分類される場合は、u(i)=−1と数値化した。同様に、i番目の検体の遺伝子組合せVが、A群に分類される場合は、v(i)=1と数値化した。また、B群に分類される場合はv(i)=−1と数値化した。さらに、各検体の治療結果をy(i)とし、新治療法が有効だったケースはy(i)=1、無効だったケースはy(i)=0とした。 First, when the gene combination U of the i-th specimen is classified into the A group, it was quantified as u (i) = 1. In addition, in the case of being classified into the group B, it was quantified as u (i) =-1. Similarly, when the gene combination V of the i-th specimen is classified into the A group, it is quantified as v (i) = 1. In addition, when it was classified into the group B, it was quantified as v (i) =-1. Furthermore, the treatment result of each sample was set to y (i), the case where the new treatment method was effective was set to y (i) = 1, and the case where it was ineffective was set to y (i) = 0.
以上のように数値化して、u(i)とv(i)からy(i)を予測するような重回帰直線Y=au+bvを決定し、診断式Yとした。このようにして決定した診断式Yは、あるUとVの場合における予想著効率を与える。 The multiple regression line Y = au + bv that predicts y (i) from u (i) and v (i) is determined as described above, and the diagnosis formula Y is obtained. The diagnosis formula Y determined in this way gives the expected remarkable efficiency in the case of certain U and V.
実際の診断システムでは、未知の検体の遺伝子組合せUとVを測定し、診断式Y=au + bvに代入する。その結果、Yが0.3未満の場合には新治療法は無効、0.3以上且つ0.7未満の場合は不明、0.7以上の場合は有効という遺伝子診断結果を出力するように設定した。 In an actual diagnostic system, the gene combinations U and V of an unknown specimen are measured and substituted into the diagnostic formula Y = au + bv. As a result, it was set to output a genetic diagnosis result that Y was less than 0.3, the new treatment method was invalid, 0.3 or more and less than 0.7 was unknown, and 0.7 or more was valid.
実際にこのシステムを日本国内の医療機関で使用した結果、診断式の寄与率は60%で、非常に良好な結果であった。よって、本発明の方法に拠れば、このように精度の高い診断式が得られることが示された。ここで、本発明の方法に従うことにより、高い精度の診断式が得られる理由を説明する。 As a result of actually using this system in a medical institution in Japan, the contribution rate of the diagnostic formula was 60%, which was a very good result. Therefore, according to the method of the present invention, it was shown that such a highly accurate diagnostic expression can be obtained. Here, the reason why a highly accurate diagnostic expression can be obtained by following the method of the present invention will be described.
一般に、統計処理を行う際は、データ数が多いほど精度の高い統計処理ができる。しかし、遺伝子診断のような新分野では、ヒト遺伝子の全てが解明されているわけではない。また、疾病発病率や治療法の有効性は、遺伝子のみで決まるわけではなく、食生活、運動習慣、既往歴、合併症等のさまざまな環境要因にも依存する。 In general, when statistical processing is performed, statistical processing with higher accuracy can be performed as the number of data increases. However, in new fields such as genetic diagnosis, not all human genes have been elucidated. In addition, disease incidence and the effectiveness of treatment methods are not determined solely by genes, but also depend on various environmental factors such as diet, exercise habits, medical history, and complications.
したがって、検体全てを同一の母集団として考えるのは必ずしも適切ではない。診断したい問題ごとに、影響しそうな環境要因を考慮して、母集団を分けたほうが、有効な情報が得られる場合がある。 Therefore, it is not always appropriate to consider all specimens as the same population. For each problem to be diagnosed, it may be possible to obtain useful information by dividing the population in consideration of environmental factors that are likely to be affected.
本実施例では、米国での治験データにはさまざまな人種が含まれていることに着目して、白人、黒人、ネイティブアメリカンの3個の母集団を分割した。ここで、図19に示した第2の関連性一覧表中のNo.1、No.2、及び、No.8に着目する。No.1とNo.2は、aとbの組み合わせで対立遺伝子型組合せが9の場合である。この場合は、ネイティブアメリカンと黒人の母集団ではそれぞれ治療法有効性と有意の関連が見られた。しかし、No.8の白人では、P=0.0638であり、有意の関連は見られなかった。 In this example, focusing on the fact that clinical trial data in the United States includes various races, three populations of white, black and native American were divided. Here, attention is focused on No. 1, No. 2, and No. 8 in the second relevance list shown in FIG. No.1 and No.2 are combinations of a and b and the allelic combination is 9. In this case, the Native American and Black populations were significantly associated with treatment effectiveness, respectively. However, in No.8 Caucasian, P = 0.0638, and no significant association was found.
本実施例では、母集団を人種別に3個に分けた。さらに、ネイティブアメリカンは日本人に近いと考えられることから、ネイティブアメリカンを重要視して、ネイティブアメリカンと他の1集団に共通する組合せを採用した。 In the present example, the population was divided into three by type. Furthermore, since Native Americans are thought to be close to Japanese, we focused on Native Americans and adopted a combination common to Native Americans and another group.
しかし、もし、検体数が多い方がよいという原則に基づいて解析を行ったとしよう。この場合、150検体のデータは全てが1個の母集団に含まれる。その場合は、No.1とNo.2に示した組合せは、SR(A)=38、NR(A)=53、SR(B)=31、NR(B)=28であった。そして、A群の著効率は42%であり、B群の著効率は53%であり、両者にあまり差が見られない。実際にカイ二乗検定を行うと、P=0.195となり、このSNP組合せと新治療法有効性との間には関連がないという結論になった。即ち、UのSNP組合せは、従来の手法では見出されなかったことを意味している。 However, suppose that the analysis is based on the principle that a larger number of specimens is better. In this case, all the data of 150 samples are included in one population. In that case, the combinations shown in No. 1 and No. 2 were SR (A) = 38, NR (A) = 53, SR (B) = 31, and NR (B) = 28. And the remarkable efficiency of A group is 42%, and the remarkable efficiency of B group is 53%, and there is not much difference in both. When the chi-square test was actually performed, P = 0.195, and it was concluded that there was no relationship between this SNP combination and the effectiveness of the new treatment. That is, the SNP combination of U means that it was not found by the conventional method.
ここで、No.1とNo.2のケースの組合せUが存在しなかったと仮定し、No.5、No.6、No.7の組合せVのみをマーカー候補として診断式を作成した。この診断式を用いて、日本の医療機関での治療結果を解析した。すると、寄与率は30%弱であった。 Here, assuming that the combination U of the cases No. 1 and No. 2 did not exist, a diagnostic formula was created using only the combination V of No. 5, No. 6, and No. 7 as marker candidates. Using this diagnostic formula, we analyzed the treatment results at Japanese medical institutions. Then, the contribution rate was a little less than 30%.
以上のように、本発明を用いることにより、従来方法では認識されないマーカー候補を選定することが可能であり、精度の良い診断式、並びに診断方法及びシステムを提供することが可能になった。 As described above, by using the present invention, it is possible to select marker candidates that are not recognized by the conventional method, and it is possible to provide a highly accurate diagnosis formula, diagnosis method, and system.
[実施例3]
本発明の第3の実施形態に係る実施例を説明する。具体的には、第1の実施例においてインターフェロン有効性に関わるマーカー候補を選定した後(第3の関連性一覧表)、生物学的な知識に基づいて更なる絞込みを行う方法を説明する。
[Example 3]
An example according to the third embodiment of the present invention will be described. Specifically, a method of further narrowing down based on biological knowledge after selecting marker candidates related to interferon effectiveness in the first embodiment (third relevance list) will be described.
ここでは、生物学的知識に基づいてインターフェロン有効性に関わるマーカー候補を絞り込む方法として、文献情報を活用したシステムバイオロジー的手法用いた。 Here, as a method of narrowing down marker candidates related to interferon effectiveness based on biological knowledge, a system biology technique utilizing literature information was used.
インターフェロンが細胞に作用した場合、細胞内ではインターフェロンシグナル伝達経路と呼ばれる一連の反応が惹起されることが知られている。インターフェロンを用いた治療の際にも、このシグナル伝達経路が主に作用していると考えられる。 It is known that when interferon acts on cells, a series of reactions called interferon signaling pathways are induced in the cells. It is considered that this signal transduction pathway is mainly acting in the treatment with interferon.
このことから、インターフェロン治療の有効性に関わる遺伝子、或いはその産物であるタンパク質は、インターフェロンシグナル伝達経路を含む細胞内の制御システム(以下、「インターフェロンシグナル伝達系システム」と称す。)に関わっていることが推測される。 Therefore, a gene involved in the effectiveness of interferon therapy or a protein that is a product of the gene is involved in an intracellular control system including an interferon signaling pathway (hereinafter referred to as “interferon signaling system”). I guess that.
従って、本実施例では、第3の関連性一覧表に記載されたマーカー候補に関して、インターフェロンシグナル伝達系システムとの関連性の有無を指標にし、更なる絞り込みを行った。そのフロー図を図20に示した。 Therefore, in this example, with respect to the marker candidates described in the third relevance list, the presence or absence of relevance with the interferon signal transduction system was used as an index for further narrowing down. The flowchart is shown in FIG.
まず、インターフェロンシグナル伝達系システムに関する生物学的知識を収集する(S01〜S04)。本実施例では、医学・生物学関連の最大の文献データベースであるPubMed(http://www.ncbi.nlm.nih.gov/)のキーワード検索を行った。 First, biological knowledge about the interferon signaling system is collected (S01 to S04). In this example, a keyword search of PubMed (http://www.ncbi.nlm.nih.gov/), which is the largest medical / biological literature database, was performed.
工程S01では、インターフェロンシグナル伝達系に関連する遺伝子名、タンパク質名、更に統計学的手法により絞り込んだマーカー候補の遺伝子名等をキーワードとし、これらを適宜組み合わせて検索式を作成した。 In step S01, gene names and protein names related to the interferon signal transduction system, gene names of marker candidates narrowed down by statistical methods, and the like were used as keywords, and a search formula was created by appropriately combining them.
工程S02において、検索式をPubMedに送信し、該当する文献を収集した。工程S03において、収集した文献からインターフェロンシグナル伝達系システムと、第3の関連性一覧表のマーカー候補との関連性に関する内容を抽出した。 In step S02, the search formula was sent to PubMed, and the corresponding documents were collected. In step S03, contents relating to the relationship between the interferon signaling system and the marker candidates of the third relationship list were extracted from the collected documents.
この抽出方法としては、専門家が抽出する方法と、自然言語処理技術を活用した計算機による抽出方法等がある。前者の方法では、抽出した情報の正確さが期待できる。後者の方法では、多量の文献を短時間で処理することが可能である。抽出した内容は、計算機が処理できる形式で保存する。 As this extraction method, there are a method of extraction by an expert, an extraction method by a computer utilizing a natural language processing technique, and the like. With the former method, the accuracy of the extracted information can be expected. In the latter method, a large amount of documents can be processed in a short time. The extracted contents are stored in a format that can be processed by a computer.
工程04〜07では、工程03で抽出したインターフェロンシグナル伝達系システムとマーカー候補の遺伝子との関連性に関する情報に基づき、全マーカーとインターフェロンシグナル伝達系システムの相関関係を整理する。マーカー候補の各遺伝子が、インターフェロンシグナル伝達系システムと関連性を有しているかを判定する。
In
本実施例により得られたインターフェロンシグナル伝達系システムとマーカーとの相関関係に関する概要図を図21に示す。 FIG. 21 shows a schematic diagram regarding the correlation between the interferon signal transduction system and the markers obtained in this example.
図21から、本実施例を行った時点では、MBLを除く全てのマーカー候補についてインターフェロンシグナル伝達系システムと相関関係を有することが見出された。 From FIG. 21, it was found that all marker candidates except MBL had a correlation with the interferon signaling system at the time when this example was performed.
特に、OPNはインターフェロン有効性が見出されたものの、これまでインターフェロンシグナル伝達系システムとの関連が明確ではないものであった。しかしながら本実施例により、インターフェロンシグナル伝達系システムとの関連を有することが示された。これは、本方法の有効性を示すものである。 In particular, although OPN has been found to be effective for interferon, it has so far not been clearly related to the interferon signaling system. However, it was shown by this example that it has an association with the interferon signaling system. This shows the effectiveness of the method.
一方、MBLについては、今回の解析ではインターフェロンシグナル伝達系システムとの相関が見出されなかったことから、候補から除外した。しかし、本実施例の実行時点ではMBL遺伝子の転写制御機構がまだ解明されていないことが影響している可能性がある。今後、MBLの転写制御機構に関する生物学的知識が蓄積されてくると、本実施例の方法を用いて再度解析を行うことにより、インターフェロンシグナル伝達系システムとの相関が見られる可能性はある。 On the other hand, MBL was excluded from the candidates because no correlation with the interferon signaling system was found in this analysis. However, there is a possibility that the transcriptional control mechanism of the MBL gene has not yet been elucidated at the time of execution of this example. In the future, if biological knowledge regarding the transcriptional control mechanism of MBL is accumulated, there is a possibility that a correlation with the interferon signal transduction system may be observed by performing the analysis again using the method of this example.
このように、本実施例による方法を用いれば、統計学的手法により絞り込まれたマーカー候補から、更に生物学的知識によっても裏付けられたマーカーを絞り込むことが可能である。よって、インターフェロン有効性遺伝子をより精度良くスクリーニングすることが可能である。 As described above, by using the method according to the present embodiment, it is possible to narrow down markers supported by biological knowledge from marker candidates narrowed down by a statistical method. Therefore, it is possible to screen an interferon efficacy gene more accurately.
[実施例4]
さらに、本発明の第4の実施形態に係る実施例を説明する。具体的には、第1の実施例においてインターフェロン有効性に関わるマーカー候補を選定した後(第3の関連性一覧表)、生物学的な知識に基づいて更なる絞込みを行う方法を説明する。
[Example 4]
Further, an example according to the fourth embodiment of the present invention will be described. Specifically, a method of further narrowing down based on biological knowledge after selecting marker candidates related to interferon effectiveness in the first embodiment (third relevance list) will be described.
ここでは、遺伝子の転写制御機構に関する生物学的知識を活用して、インターフェロン有効性に関わる遺伝子多型の絞り込みを行った。 Here, we have narrowed down genetic polymorphisms related to interferon effectiveness by utilizing biological knowledge about gene transcription control mechanisms.
インターフェロン有効性に遺伝子多型が関与している場合、その作用機序としては主に2種類のものが考えられる。1つは、遺伝子の転写制御機構に作用して遺伝子の発現量に変化を起こすものである。もう1つは、遺伝子がコードしているタンパク質のアミノ酸配列に変化を起こし、かつ、アミノ酸配列の変化によりタンパク質の機能に変化を起こすものである。最近では、前者のような遺伝子多型による作用が薬剤の有効性や副作用に対する個体差に関与している場合があることが注目されている。本実施例でも特に前者の場合に特化したシステムを提案する。 When genetic polymorphisms are involved in interferon efficacy, there are two main mechanisms of action. One is a change in gene expression by acting on a gene transcription control mechanism. The other is a change in the amino acid sequence of the protein encoded by the gene, and a change in the function of the protein due to the change in the amino acid sequence. Recently, attention has been paid to the fact that the effects of genetic polymorphism such as the former may be involved in individual differences in drug efficacy and side effects. Also in this embodiment, a system specialized in the former case is proposed.
遺伝子の転写制御機構では、転写因子と呼ばれるタンパク質を介した制御が良く知られている。転写因子は、ゲノム上の特定のDNA配列を認識して結合するタンパク質である。転写因子は、各遺伝子の転写制御に関わる領域に結合することによって、特定の遺伝子の転写を促進したり、抑制したりする。 In gene transcription control mechanisms, control via proteins called transcription factors is well known. A transcription factor is a protein that recognizes and binds to a specific DNA sequence on the genome. A transcription factor promotes or represses transcription of a specific gene by binding to a region involved in the transcriptional control of each gene.
もし、遺伝子多型が転写因子の結合する領域中に存在し、且つ、その多型での取り得る塩基(アリルと呼ぶ)によって、(1)転写因子の結合能が変化する、或いは、(2)結合する転写因子が異なる転写因子に変化する場合、アリルによって転写制御が異なる結果になる可能性がある。このような場合、遺伝子多型が遺伝子の転写制御機構に作用していると捉えることができる。 If the gene polymorphism is present in the region to which the transcription factor binds, and the base that the polymorphism can take (referred to as allyl), (1) the transcription factor binding capacity changes, or (2 ) If the transcription factor to be bound changes to a different transcription factor, the transcription control may differ depending on the allele. In such a case, it can be considered that the gene polymorphism acts on the transcriptional control mechanism of the gene.
統計学的に絞り込んだ遺伝子多型、即ち第3の関連性一覧表のマーカー候補の遺伝子多型中に、このような転写制御機構に作用している可能性のあるものがあれば、その多型がインターフェロン有効性に関わる主要な要因となる可能性が高いと考えられる。 If there is a statistically narrowed gene polymorphism, that is, a gene polymorphism of a marker candidate in the third relevance list, if there is a possibility of acting on such a transcription control mechanism, the polymorphism The type is likely to be a major factor in the effectiveness of interferon.
本実施例ではこの点に着目し、インターフェロン有効性に関わる遺伝子多型としてピックアップする方法を提示している。具体的には、第3の一覧表のマーカー候補について、その遺伝子多型が転写因子の結合候補領域に含まれ、かつ、その多型のアリルによって、その多型を含む領域に結合することが予測される転写因子が変化する場合、その遺伝子多型がインターフェロン有効性に関わる主要な要因である可能性が高いとする。このような本実施例のフロー図を図22に示した。 In this example, focusing on this point, a method of picking up as a gene polymorphism related to interferon effectiveness is presented. Specifically, for the marker candidates in the third list, the gene polymorphism is included in the transcription factor binding candidate region, and the polymorphic allele binds to the region containing the polymorphism. If the predicted transcription factor changes, the genetic polymorphism is likely to be a major factor involved in interferon efficacy. A flowchart of this embodiment is shown in FIG.
本実施例では、まず、統計学的に絞り込まれたマーカー候補の遺伝子多型のゲノム配列を公共データベースから入手した(工程S11)。本実施例では、公共ゲノムデータベースとしてEnsembl(http://www.ensembl.org/)を用いた。 In this example, first, a genome sequence of a gene polymorphism of a marker candidate statistically narrowed down was obtained from a public database (step S11). In this example, Ensembl (http://www.ensembl.org/) was used as a public genome database.
具体的には、Ensemblでマーカー候補の各遺伝子名をキーワードとして検索を行い、各遺伝子に関してEnsemblに保存されているデータを入手した。そのデータから、各遺伝子およびその近傍の多型を含む領域のDNA配列を入手した。 Specifically, a search was performed using Ensembl as a keyword for each gene name of a marker candidate, and data stored in Ensembl for each gene was obtained. From the data, the DNA sequence of the region containing each gene and its nearby polymorphism was obtained.
入手した各遺伝子のDNA配列に基づいて、各遺伝子の各対立遺伝子型に対応するDNA配列も作成した(工程S12)。 Based on the obtained DNA sequence of each gene, a DNA sequence corresponding to each allelic type of each gene was also prepared (step S12).
続く工程S13では、これらのDNA配列中に含まれる転写因子結合候補部位の予測を行った。DNA配列中に含まれる転写因子結合候補部位の予測に関しては既に幾つか方法が開発されている。本実施例では、ConSite(http://mordor.cgb.ki.se/cgi-bin/CONSITE/consite/)を用いた。このサイトは、Web上で転写因子結合候補部位予測を実行するサービスを行っている。ConSiteのサイトに工程S12で作成したDNA配列を送信し、この配列に含まれる転写因子結合候補部位の予測を実行し、その結果をローカルに保存した。 In the subsequent step S13, candidate transcription factor binding sites contained in these DNA sequences were predicted. Several methods have already been developed for predicting candidate transcription factor binding sites contained in DNA sequences. In this example, ConSite (http://mordor.cgb.ki.se/cgi-bin/CONSITE/consite/) was used. This site provides a service that performs transcription factor binding candidate site prediction on the Web. The DNA sequence created in step S12 was transmitted to the ConSite site, the transcription factor binding candidate sites contained in this sequence were predicted, and the results were stored locally.
次に、予測された転写因子結合候補部位のそれぞれについて、各遺伝子の多型が含まれているかどうかを調べた(工程S15)。多型が含まれていた場合には、更に、多型の各アリルによって、結合することが予測される転写因子が変化するかを調べた(工程S16)。予測される転写因子が変化した場合には、その遺伝子の多型をインターフェロン有効性に関わる遺伝子多型としてピックアップした。 Next, for each predicted transcription factor binding candidate site, it was examined whether or not each gene polymorphism was included (step S15). When the polymorphism was included, it was further examined whether the transcription factor expected to bind to each allele of the polymorphism changes (step S16). When the predicted transcription factor changed, the polymorphism of the gene was picked up as a gene polymorphism related to interferon effectiveness.
図23は、本実施例でピックアップされた多型の1つ、OPN-155である。この多型では、グアニンが欠落している対立遺伝子型と、グアニンを含んでいる対立遺伝子型が存在する。この対立遺伝子型の違いによって、結合することが予測される転写因子が異なる場合があった。図23では、一方の対立遺伝子型のみに結合することが予測された4種類の転写因子名およびその認識する配列を示した。この内の1つAML-1については、実際に、ウエットの実験からOPNの転写制御に関与していることが示されており、本実施例の有効性を示している。 FIG. 23 shows OPN-155, one of the polymorphs picked up in this example. In this polymorphism, there are allelic types that lack guanine and allelic types that contain guanine. Depending on the allelic type, transcription factors predicted to bind may differ. FIG. 23 shows the names of four types of transcription factors predicted to bind to only one allelic type and the sequences recognized by them. One of these, AML-1, was actually shown to be involved in OPN transcriptional control from the wet experiment, indicating the effectiveness of this example.
1…入力装置、2…処理装置、3…ファイル装置、4…出力装置、5…メインメモリ、6…遺伝子多型データファイル、7…遺伝子多型組合せリストファイル、8…対立遺伝子型組合せリストファイル、9…制御プログラム、10…コンピュータ、11…通信ネットワーク、12,13…検体データベース、21…関連性演算手段、22…集団比較手段、23…傾向判定手段、24…候補選択手段、25…診断式作成手段、26…診断式選択手段、100…マーカー選定システム、200…診断式作成システム、300…遺伝子診断システム。
DESCRIPTION OF
Claims (15)
予め既知の遺伝子多型の同定情報を記録しておく遺伝子多型データ記録手段、
予め前記遺伝子多型データ中の任意の二以上の遺伝子多型を組合せた、遺伝子多型組合せリストを記録しておく遺伝子多型組合せリスト記録手段、
予め前記遺伝子多型組合せリストに記載された各遺伝子多型組合せに関する対立遺伝子型組合せリストを記録しておく、対立遺伝子型組合せリスト記録手段、
複数の検体が属する二以上の集団について、前記既知の遺伝子多型における各検体の遺伝子型、並びに診断事項に対する傾向を記録しておく、集団毎の検体データ記録手段、
前記遺伝子多型組合せリストに記載された各遺伝子多型組合せについて、該各組合せに関する対立遺伝子型組合せリストを読み出し、該リストに記載された対立遺伝子型組合せが、前記診断事項との間に相関を有するかどうかを、前記検体データベースに保存されたデータに基づいて判定する関連性演算手段、
前記関連性演算手段によって相関を有すると判定された遺伝子多型組合せ及びその対立遺伝子型組合せを、前記集団毎に関連性一覧表に記録しておく関連性一覧表記録手段、
前記集団毎の関連性一覧表を比較し、少なくとも二以上の関連性一覧表に共通して存在する遺伝子多型組合せ及びその対立遺伝子型組合せを、第2の関連性一覧表に記録する集団比較手段、
前記第2の関連性一覧表の中から、少なくとも二以上の集団において診断事項に対する傾向が同じである遺伝子多型組合せ及びその対立遺伝子型組合せを選択し、マーカー候補として第3の関連性一覧表に記載する傾向判定手段、
前記手段によって得られたマーカー候補を出力する出力手段、
として機能させるためのマーカー選定プログラム。 Computers to select markers for use in genetic diagnosis,
Gene polymorphism data recording means for recording identification information of known gene polymorphisms in advance,
Gene polymorphism combination list recording means for recording a gene polymorphism combination list in which two or more gene polymorphisms in the gene polymorphism data are combined in advance,
An allelic combination list recording means for recording an allelic combination list related to each genetic polymorphism combination described in the genetic polymorphism combination list in advance;
Sample data recording means for each group, for recording two or more groups to which a plurality of samples belong, the trend of genotype of each sample in the known genetic polymorphism, and diagnostic items,
For each gene polymorphism combination described in the gene polymorphism combination list, an allele type combination list for each combination is read, and the allele type combination described in the list correlates with the diagnosis item. Relevance calculation means for determining whether to have the data based on data stored in the specimen database;
Relevance list recording means for recording the genetic polymorphism combination determined to have a correlation by the relevance calculation means and the allelic combination thereof in the relevance list for each population,
A group comparison in which the association list for each population is compared, and a combination of genetic polymorphisms common to at least two or more association lists and allelic combinations thereof are recorded in a second association list means,
A gene polymorphism combination and an allelic combination thereof having the same tendency to diagnosis items in at least two or more groups are selected from the second association list, and a third association list is selected as a marker candidate. The tendency determination means described in
Output means for outputting marker candidates obtained by the means;
Marker selection program to function as
前記遺伝子多型組合せリスト中の遺伝子多型組合せ毎に、前記対立遺伝子型組合せリストを読み出し、
該リスト中の各対立遺伝子型組合せについて、前記検体データベースに基づき、該組合せを有する検体をA群に分類し、それ以外の検体をB群に分類し、
該A群及びB群のそれぞれにおいて、診断事項に対する傾向によって、検体を有効群と無効群とに分類し、
該A群及びB群における、有効群と無効群との割合に差があるかどうかを検定し、
該検定において有意の差があった遺伝子多型及び対立遺伝子型を、関連性ありと判定する、請求項1に記載のマーカー選定プログラム。 The relevance calculating means includes
For each gene polymorphism combination in the gene polymorphism combination list, read the allele combination list,
For each allelic combination in the list, based on the sample database, classify samples having the combination into Group A, classify the other samples into Group B,
In each of the A group and the B group, the sample is classified into an effective group and an ineffective group according to the tendency to the diagnosis item
Test whether there is a difference in the ratio between the effective group and the ineffective group in the groups A and B,
The marker selection program according to claim 1, wherein the gene polymorphism and allele type that have a significant difference in the test are determined to be related.
各集団の相関係数を平均し、該平均値が最大である遺伝子多型組合せ及びその対立遺伝子型組合せを選択する手段である、請求項3に記載のマーカー選定プログラム。 Means for selecting an optimal marker candidate from the third relevance list,
4. The marker selection program according to claim 3, which is a means for averaging the correlation coefficient of each population and selecting a genetic polymorphism combination having the maximum average value and an allelic combination thereof.
請求項1又は2における前記第3の関連性一覧表のマーカー候補について、集団毎に、前記A群に属する検体をX=−1とし、前記B群に属する検体をX=+1とするか、A群に属する検体をX=+1、B群に属する検体をX=−1とするか、或いはA群に属する検体をX=α、B群に属する検体をX=βとし(ただし、αとβは互いに異なる任意の数である)、また、前記治療の有効性及び/又は病気のかかり易さによって、各検体をy=1、又はy=0とし、
各集団に対する診断式 Y=aX+t (ここで、a及びtは定数である)を作成する診断式作成手段、
作成された診断式を出力する出力手段、
として機能させるための診断式作成プログラム。 To create a genetic diagnostic formula,
Regarding the marker candidates of the third relevance list in claim 1 or 2, for each group, the specimen belonging to the group A is set to X = -1, and the specimen belonging to the group B is set to X = + 1. A sample belonging to the A group is set to X = + 1, a sample belonging to the B group is set to X = -1, or a sample belonging to the A group is set to X = α, and a sample belonging to the B group is set to X = β (where α and β is an arbitrary number different from each other), and depending on the effectiveness of the treatment and / or the susceptibility to disease, each specimen is set to y = 1, or y = 0,
A diagnostic formula creation means for creating a diagnostic formula Y = aX + t (where a and t are constants) for each population;
An output means for outputting the created diagnostic expression;
Diagnostic formula creation program to function as
前記各マーカー候補の各集団に対する診断式の、それぞれの集団に対する寄与率Kを演算する手段、
該寄与率Kの平均値が最大であるマーカー候補の診断式を選択する選択手段、
選択された診断式を出力する出力手段、
として機能させるための、請求項5に記載の診断式作成プログラム;
ここにおいて、
寄与率Kは診断式の精度を評価するパラメータであり、
ただし、
Means for calculating a contribution rate K for each group of diagnostic formulas for each group of marker candidates,
Selecting means for selecting a diagnostic formula of a marker candidate having the maximum value of the contribution rate K;
Output means for outputting the selected diagnostic expression;
The diagnostic formula creation program according to claim 5 for functioning as:
put it here,
The contribution rate K is a parameter for evaluating the accuracy of the diagnostic formula,
However,
請求項1〜4の何れかにおいて選定されたマーカーを読み込む手段、
予め測定された診断対象検体の遺伝子配列を入力する手段、
前記選定されたマーカーと同様の遺伝子多型組合せ及びその対立遺伝子型組合せが、該検体中に存在するか否かを判定する手段、
該判定に基づき、該検体を診断する手段、
該診断結果を出力する手段、
とを具備してなることを特徴とする遺伝子診断システム。 A system for genetic diagnosis of a specimen to be diagnosed using the marker selected in any one of claims 1 to 4,
Means for reading the marker selected in any one of claims 1 to 4,
Means for inputting a pre-measured gene sequence of a specimen to be diagnosed;
Means for determining whether a genetic polymorphism combination similar to the selected marker and an allelic combination thereof are present in the specimen;
Means for diagnosing the specimen based on the determination;
Means for outputting the diagnostic result;
A genetic diagnosis system comprising:
請求項5又は6の何れかにおいて作成された診断式を読み込む手段、
予め測定された診断対象検体の遺伝子配列を入力する手段、
前記診断式に、該検体のデータを適用し、予想率を得る手段、
得られた予想率を出力する手段、
とを具備してなることを特徴とする遺伝子診断システム。 A system for genetic diagnosis of a specimen to be diagnosed using the diagnostic formula created in claim 5 or 6,
Means for reading the diagnostic formula created in any of claims 5 or 6;
Means for inputting a pre-measured gene sequence of a specimen to be diagnosed;
Means for applying the specimen data to the diagnostic formula to obtain an expected rate;
Means for outputting the obtained prediction rate,
A genetic diagnosis system comprising:
予め既知の遺伝子多型の同定情報を記録しておく遺伝子多型データ記録手段、
予め前記遺伝子多型データ中の任意の二以上の遺伝子多型を組合せた、遺伝子多型組合せリストを記録しておく遺伝子多型組合せリスト記録手段、
予め前記遺伝子多型組合せリストに記載された各遺伝子多型組合せに関する対立遺伝子型組合せリストを記録しておく、対立遺伝子型組合せリスト記録手段、
複数の検体が属する二以上の集団について、前記既知の遺伝子多型における各検体の遺伝子型、並びに診断事項に対する傾向を記録しておく、集団毎の検体データ記録手段、
前記遺伝子多型組合せリストに記載された各遺伝子多型組合せについて、該各組合せに関する対立遺伝子型組合せリストを読み出し、該リストに記載された対立遺伝子型組合せが、前記診断事項との間に相関を有するかどうかを、前記検体データベースに保存されたデータに基づいて判定する関連性演算手段、
前記関連性演算手段によって相関を有すると判定された遺伝子多型組合せ及びその対立遺伝子型組合せを、前記集団毎に関連性一覧表に記録しておく関連性一覧表記録手段、
前記集団毎の関連性一覧表を比較し、全ての関連性一覧表に共通して存在する遺伝子多型組合せ及びその対立遺伝子型組合せを、第2の関連性一覧表に記録する集団比較手段、
前記第2の関連性一覧表の中から、全ての集団において診断事項に対する傾向が同じである遺伝子多型組合せ及びその対立遺伝子型組合せを選択し、マーカー候補として第3の関連性一覧表に記載する傾向判定手段、
前記手段によって得られたマーカー候補を出力する出力手段、
を具備する、遺伝子診断用のマーカー選定装置。 An apparatus for selecting a marker for use in genetic diagnosis,
Gene polymorphism data recording means for recording identification information of known gene polymorphisms in advance,
Gene polymorphism combination list recording means for recording a gene polymorphism combination list in which two or more gene polymorphisms in the gene polymorphism data are combined in advance,
An allelic combination list recording means for recording an allelic combination list relating to each genetic polymorphism combination described in the genetic polymorphism combination list in advance;
Sample data recording means for each group, for recording two or more populations to which a plurality of specimens belong, recording the genotype of each specimen in the known genetic polymorphism, and the tendency for diagnostic items,
For each gene polymorphism combination described in the gene polymorphism combination list, an allele type combination list for each combination is read, and the allele type combination described in the list correlates with the diagnosis item. Relevance calculating means for determining whether to have the data based on the data stored in the specimen database,
Relevance list recording means for recording the genetic polymorphism combination determined to have correlation by the relevance calculation means and the allelic combination thereof in the relevance list for each population,
A group comparison means for comparing the association list for each group, and recording the genetic polymorphism combinations and allele combinations thereof common to all the association lists in a second association list;
From the second association list, a genetic polymorphism combination and an allelic combination thereof that have the same tendency for diagnosis items in all the populations are selected, and described in the third association list as marker candidates A tendency determination means,
Output means for outputting marker candidates obtained by the means;
A marker selection device for genetic diagnosis, comprising:
前記遺伝子多型組合せリスト中の遺伝子多型組合せ毎に、前記対立遺伝子型組合せリストを読み出し、
該リスト中の各対立遺伝子型組合せについて、前記検体データベースに基づき、該組合せを有する検体をA群に分類し、それ以外の検体をB群に分類し、
該A群及びB群のそれぞれにおいて、診断事項に対する傾向によって、検体を有効群と無効群とに分類し、
該A群及びB群における、有効群と無効群との割合に差があるかどうかを検定し、
該検定において有意の差があった遺伝子多型及び対立遺伝子型を、関連性ありと判定する、請求項9に記載のマーカー選定装置。 The relevance calculating means includes
For each gene polymorphism combination in the gene polymorphism combination list, read the allele combination list,
For each allelic combination in the list, based on the sample database, classify samples having the combination into Group A, classify the other samples into Group B,
In each of the A group and the B group, the sample is classified into an effective group and an ineffective group according to the tendency to the diagnosis item
Test whether there is a difference in the ratio between the effective group and the ineffective group in the groups A and B,
The marker selection device according to claim 9, wherein a gene polymorphism and an allelic type having a significant difference in the test are determined to be related.
各集団の相関係数を平均し、該平均値が最大である遺伝子多型組合せ及びその対立遺伝子型組合せを選択する手段である、請求項11に記載のマーカー選定装置。 Means for selecting an optimal marker candidate from the third relevance list,
12. The marker selection device according to claim 11, which is a means for averaging the correlation coefficient of each population and selecting a genetic polymorphism combination having the maximum average value and an allelic combination thereof.
請求項9又は10における前記第3の関連性一覧表のマーカー候補について、集団毎に、前記A群に属する検体をX=−1とし、前記B群に属する検体をX=+1とするか、A群に属する検体をX=+1、B群に属する検体をX=−1とするか、或いはA群に属する検体をX=α、B群に属する検体をX=βとし(ただし、αとβは互いに異なる任意の数である)、また、前記治療の有効性及び/又は病気のかかり易さによって、各検体をy=1、又はy=0とし、
各集団に対する診断式 Y=aX+t (ここで、a及びtは定数である)を作成する診断式作成手段、
作成された診断式を出力する出力手段、
を具備する、遺伝子診断式作成装置。 It is an apparatus for creating a genetic diagnosis formula, and for the marker candidates of the third relevance list in claim 9 or 10, for each group, the specimen belonging to the group A is set to X = -1, and the B A sample belonging to the group X = + 1, a sample belonging to the A group X = + 1, a sample belonging to the B group X = −1, or a sample belonging to the A group X = α Let X = β belong to the specimen (where α and β are arbitrary numbers different from each other), and depending on the effectiveness of the treatment and / or the susceptibility to disease, each specimen may be represented by y = 1, or y = 0
A diagnostic formula creation means for creating a diagnostic formula Y = aX + t (where a and t are constants) for each population;
An output means for outputting the created diagnostic expression;
A genetic diagnostic formula creation device comprising:
該寄与率Kの平均値が最大であるマーカー候補の診断式を選択する選択手段、
選択された診断式を出力する出力手段、
を具備する、請求項13に記載の遺伝子診断式作成装置:
ここにおいて、
寄与率Kは診断式の精度を評価するパラメータであり、
ただし、
Selecting means for selecting a diagnostic formula of a marker candidate having the maximum value of the contribution rate K;
Output means for outputting the selected diagnostic expression;
The genetic diagnostic formula creation device according to claim 13, comprising:
put it here,
The contribution rate K is a parameter for evaluating the accuracy of the diagnostic formula,
However,
Priority Applications (3)
| Application Number | Priority Date | Filing Date | Title |
|---|---|---|---|
| JP2005295333A JP2007102709A (en) | 2005-10-07 | 2005-10-07 | Marker selection program for gene diagnosis, apparatus and system for executing the program, and gene diagnosis system |
| US11/533,134 US20070082353A1 (en) | 2005-10-07 | 2006-09-19 | Genetic marker selection program for genetic diagnosis, apparatus and system for executing the same, and genetic diagnosis system |
| KR1020060097973A KR100806436B1 (en) | 2005-10-07 | 2006-10-09 | Computer readable medium containing a marker selection program for genetic diagnosis, and marker selection apparatus and system, and genetic diagnosing function creation apparatus and system |
Applications Claiming Priority (1)
| Application Number | Priority Date | Filing Date | Title |
|---|---|---|---|
| JP2005295333A JP2007102709A (en) | 2005-10-07 | 2005-10-07 | Marker selection program for gene diagnosis, apparatus and system for executing the program, and gene diagnosis system |
Publications (1)
| Publication Number | Publication Date |
|---|---|
| JP2007102709A true JP2007102709A (en) | 2007-04-19 |
Family
ID=37911422
Family Applications (1)
| Application Number | Title | Priority Date | Filing Date |
|---|---|---|---|
| JP2005295333A Pending JP2007102709A (en) | 2005-10-07 | 2005-10-07 | Marker selection program for gene diagnosis, apparatus and system for executing the program, and gene diagnosis system |
Country Status (3)
| Country | Link |
|---|---|
| US (1) | US20070082353A1 (en) |
| JP (1) | JP2007102709A (en) |
| KR (1) | KR100806436B1 (en) |
Cited By (4)
| Publication number | Priority date | Publication date | Assignee | Title |
|---|---|---|---|---|
| KR100806436B1 (en) | 2005-10-07 | 2008-02-21 | 가부시끼가이샤 도시바 | Computer readable medium containing a marker selection program for genetic diagnosis, and marker selection apparatus and system, and genetic diagnosing function creation apparatus and system |
| WO2010064413A1 (en) * | 2008-12-01 | 2010-06-10 | 国立大学法人山口大学 | System for predicting drug effects and adverse effects and program for the same |
| JP2013220226A (en) * | 2012-04-17 | 2013-10-28 | Kddi Corp | Data analysis device, program and data analysis method |
| JP2016504667A (en) * | 2012-11-26 | 2016-02-12 | コーニンクレッカ フィリップス エヌ ヴェKoninklijke Philips N.V. | Diagnostic genetic analysis using mutation-disease association with patient-specific association assessment |
Families Citing this family (11)
| Publication number | Priority date | Publication date | Assignee | Title |
|---|---|---|---|---|
| US7844609B2 (en) | 2007-03-16 | 2010-11-30 | Expanse Networks, Inc. | Attribute combination discovery |
| US8108406B2 (en) | 2008-12-30 | 2012-01-31 | Expanse Networks, Inc. | Pangenetic web user behavior prediction system |
| US8463554B2 (en) | 2008-12-31 | 2013-06-11 | 23Andme, Inc. | Finding relatives in a database |
| EP2207119A1 (en) * | 2009-01-06 | 2010-07-14 | Koninklijke Philips Electronics N.V. | Evolutionary clustering algorithm |
| KR101670967B1 (en) * | 2009-10-29 | 2016-11-09 | 삼성전자주식회사 | The method and apparatus for selecting genetic markers |
| KR101243063B1 (en) * | 2012-08-03 | 2013-03-13 | 한국과학기술정보연구원 | System and method for pathway construction |
| KR101599922B1 (en) * | 2014-10-20 | 2016-03-04 | 동아대학교 산학협력단 | Cross-Species Genic Marker Designer platform for designing genic marker in cross-species |
| US10395759B2 (en) | 2015-05-18 | 2019-08-27 | Regeneron Pharmaceuticals, Inc. | Methods and systems for copy number variant detection |
| EP3414691A1 (en) | 2016-02-12 | 2018-12-19 | Regeneron Pharmaceuticals, Inc. | Methods and systems for detection of abnormal karyotypes |
| CN107577907B (en) * | 2017-09-08 | 2021-04-02 | 成都奇恩生物科技有限公司 | Rare disease auxiliary diagnosis system based on Internet and use method |
| CN113470776B (en) * | 2021-05-28 | 2024-07-16 | 南方医科大学皮肤病医院(广东省皮肤病医院、广东省皮肤性病防治中心、中国麻风防治研究中心) | Genetic diagnosis system integrating data acquisition, analysis and report generation |
Citations (7)
| Publication number | Priority date | Publication date | Assignee | Title |
|---|---|---|---|---|
| JP2001357130A (en) * | 2000-06-13 | 2001-12-26 | Hitachi Ltd | Medical information management system |
| JP2002312361A (en) * | 2001-10-16 | 2002-10-25 | Mitsui Knowledge Industry Kk | Anonymized clinical research support method and system |
| WO2003048999A2 (en) * | 2001-12-03 | 2003-06-12 | Dnaprint Genomics, Inc. | Methods and apparatus for genetic classification |
| JP2003519829A (en) * | 1999-10-13 | 2003-06-24 | シークエノム・インコーポレーテツド | Methods for creating a database and a database for identifying polymorphic genetic markers |
| JP2004113661A (en) * | 2002-09-27 | 2004-04-15 | Toshiba Corp | Program, database, system and method for predicting the effectiveness of a therapy |
| JP2004173505A (en) * | 2002-11-22 | 2004-06-24 | Mitsuo Itakura | Method for identifying disease susceptibility gene, and program and system used therefor |
| JP2005259132A (en) * | 2004-02-28 | 2005-09-22 | Samsung Electronics Co Ltd | Method for selecting optimal marker set from multiple SNP markers associated with complex diseases |
Family Cites Families (2)
| Publication number | Priority date | Publication date | Assignee | Title |
|---|---|---|---|---|
| JP2005085063A (en) | 2003-09-10 | 2005-03-31 | Nec Corp | Representative SNP selection method, selection system, program |
| JP2007102709A (en) | 2005-10-07 | 2007-04-19 | Toshiba Corp | Marker selection program for gene diagnosis, apparatus and system for executing the program, and gene diagnosis system |
-
2005
- 2005-10-07 JP JP2005295333A patent/JP2007102709A/en active Pending
-
2006
- 2006-09-19 US US11/533,134 patent/US20070082353A1/en not_active Abandoned
- 2006-10-09 KR KR1020060097973A patent/KR100806436B1/en not_active Expired - Fee Related
Patent Citations (8)
| Publication number | Priority date | Publication date | Assignee | Title |
|---|---|---|---|---|
| JP2003519829A (en) * | 1999-10-13 | 2003-06-24 | シークエノム・インコーポレーテツド | Methods for creating a database and a database for identifying polymorphic genetic markers |
| JP2001357130A (en) * | 2000-06-13 | 2001-12-26 | Hitachi Ltd | Medical information management system |
| JP2002312361A (en) * | 2001-10-16 | 2002-10-25 | Mitsui Knowledge Industry Kk | Anonymized clinical research support method and system |
| WO2003048999A2 (en) * | 2001-12-03 | 2003-06-12 | Dnaprint Genomics, Inc. | Methods and apparatus for genetic classification |
| JP2006503346A (en) * | 2001-12-03 | 2006-01-26 | ディーエヌエー・プリント・ジェノミックス・インコーポレイテッド | Method and apparatus for use in genetic classification including classification tree analysis |
| JP2004113661A (en) * | 2002-09-27 | 2004-04-15 | Toshiba Corp | Program, database, system and method for predicting the effectiveness of a therapy |
| JP2004173505A (en) * | 2002-11-22 | 2004-06-24 | Mitsuo Itakura | Method for identifying disease susceptibility gene, and program and system used therefor |
| JP2005259132A (en) * | 2004-02-28 | 2005-09-22 | Samsung Electronics Co Ltd | Method for selecting optimal marker set from multiple SNP markers associated with complex diseases |
Cited By (4)
| Publication number | Priority date | Publication date | Assignee | Title |
|---|---|---|---|---|
| KR100806436B1 (en) | 2005-10-07 | 2008-02-21 | 가부시끼가이샤 도시바 | Computer readable medium containing a marker selection program for genetic diagnosis, and marker selection apparatus and system, and genetic diagnosing function creation apparatus and system |
| WO2010064413A1 (en) * | 2008-12-01 | 2010-06-10 | 国立大学法人山口大学 | System for predicting drug effects and adverse effects and program for the same |
| JP2013220226A (en) * | 2012-04-17 | 2013-10-28 | Kddi Corp | Data analysis device, program and data analysis method |
| JP2016504667A (en) * | 2012-11-26 | 2016-02-12 | コーニンクレッカ フィリップス エヌ ヴェKoninklijke Philips N.V. | Diagnostic genetic analysis using mutation-disease association with patient-specific association assessment |
Also Published As
| Publication number | Publication date |
|---|---|
| KR20070038925A (en) | 2007-04-11 |
| US20070082353A1 (en) | 2007-04-12 |
| KR100806436B1 (en) | 2008-02-21 |
Similar Documents
| Publication | Publication Date | Title |
|---|---|---|
| Mosley et al. | Predictive accuracy of a polygenic risk score compared with a clinical risk score for incident coronary heart disease | |
| Uddin et al. | Artificial intelligence for precision medicine in neurodevelopmental disorders | |
| Liang et al. | Polygenic transcriptome risk scores (PTRS) can improve portability of polygenic risk scores across ancestries | |
| JP7813140B2 (en) | Systems and methods for using sequencing data for pathogen detection - Patents.com | |
| AU784645B2 (en) | Method for providing clinical diagnostic services | |
| Maron et al. | Genetics of hypertrophic cardiomyopathy after 20 years: clinical perspectives | |
| JP5464503B2 (en) | Medical analysis system | |
| WO2019169049A1 (en) | Multimodal modeling systems and methods for predicting and managing dementia risk for individuals | |
| Ireland et al. | Genetic testing in hypertrophic cardiomyopathy | |
| Ahmed et al. | Early detection of Alzheimer's disease using single nucleotide polymorphisms analysis based on gradient boosting tree | |
| JP2003508853A (en) | Artificial intelligence system for gene analysis | |
| WO2018160548A1 (en) | Markers for coronary artery disease and uses thereof | |
| KR100806436B1 (en) | Computer readable medium containing a marker selection program for genetic diagnosis, and marker selection apparatus and system, and genetic diagnosing function creation apparatus and system | |
| US20210343414A1 (en) | Methods and apparatus for phenotype-driven clinical genomics using a likelihood ratio paradigm | |
| Wang et al. | DeepPerVar: a multi-modal deep learning framework for functional interpretation of genetic variants in personal genome | |
| Rugna et al. | Distinct Leishmania infantum Strains Circulate in Humans and Dogs in the Emilia–Romagna Region, Northeastern Italy | |
| Vinciguerra | The potential for artificial intelligence applied to epigenetics | |
| Zieliński et al. | Evaluating the risk of endometriosis based on patients’ self-assessment questionnaires | |
| Mandape et al. | Dense SNP-based analyses complement forensic anthropology biogeographical ancestry assessments | |
| US20200024663A1 (en) | Method for detecting mood disorders | |
| JP2002107366A (en) | Diagnosis support system | |
| Abbas et al. | Use of artificial intelligence in diagnosis of various autoimmune diseases, a comprehensive literature review about current situation & future directions | |
| WO2006126618A1 (en) | Method of determining gene polymorphism for judgment of disease risk level, method of judging disease risk level and array for relevant judgment | |
| Zentner et al. | A rapid scoring tool to assess mutation probability in patients with inherited cardiac disorders | |
| US20230289569A1 (en) | Non-Transitory Computer Readable Medium, Information Processing Device, Information Processing Method, and Method for Generating Learning Model |
Legal Events
| Date | Code | Title | Description |
|---|---|---|---|
| A621 | Written request for application examination |
Free format text: JAPANESE INTERMEDIATE CODE: A621 Effective date: 20070205 |
|
| A131 | Notification of reasons for refusal |
Free format text: JAPANESE INTERMEDIATE CODE: A131 Effective date: 20091201 |
|
| A521 | Request for written amendment filed |
Free format text: JAPANESE INTERMEDIATE CODE: A523 Effective date: 20100127 |
|
| A131 | Notification of reasons for refusal |
Free format text: JAPANESE INTERMEDIATE CODE: A131 Effective date: 20100824 |
|
| A02 | Decision of refusal |
Free format text: JAPANESE INTERMEDIATE CODE: A02 Effective date: 20101221 |