JP2012194165A - Scanning microscopic light scattering measurement/analysis device and light scattering analysis method - Google Patents
Scanning microscopic light scattering measurement/analysis device and light scattering analysis method Download PDFInfo
- Publication number
- JP2012194165A JP2012194165A JP2011083131A JP2011083131A JP2012194165A JP 2012194165 A JP2012194165 A JP 2012194165A JP 2011083131 A JP2011083131 A JP 2011083131A JP 2011083131 A JP2011083131 A JP 2011083131A JP 2012194165 A JP2012194165 A JP 2012194165A
- Authority
- JP
- Japan
- Prior art keywords
- relaxation
- data
- time
- sample
- correlation function
- Prior art date
- Legal status (The legal status is an assumption and is not a legal conclusion. Google has not performed a legal analysis and makes no representation as to the accuracy of the status listed.)
- Granted
Links
- 238000000149 argon plasma sintering Methods 0.000 title claims abstract description 88
- 238000005259 measurement Methods 0.000 title claims abstract description 82
- 238000004458 analytical method Methods 0.000 title claims abstract description 59
- 238000005314 correlation function Methods 0.000 claims abstract description 47
- 230000002159 abnormal effect Effects 0.000 claims abstract description 17
- 230000003287 optical effect Effects 0.000 claims description 49
- 238000004364 calculation method Methods 0.000 claims description 27
- 238000001514 detection method Methods 0.000 claims description 27
- 238000009792 diffusion process Methods 0.000 claims description 27
- 238000000034 method Methods 0.000 claims description 26
- 238000009826 distribution Methods 0.000 claims description 20
- 230000000116 mitigating effect Effects 0.000 claims description 17
- 230000007423 decrease Effects 0.000 claims description 5
- 230000001419 dependent effect Effects 0.000 claims description 5
- 230000009191 jumping Effects 0.000 claims description 3
- 230000002093 peripheral effect Effects 0.000 claims description 3
- 239000000523 sample Substances 0.000 description 112
- 239000000499 gel Substances 0.000 description 33
- 238000012545 processing Methods 0.000 description 16
- 238000002296 dynamic light scattering Methods 0.000 description 8
- 239000000463 material Substances 0.000 description 6
- 229920000642 polymer Polymers 0.000 description 6
- 239000000243 solution Substances 0.000 description 6
- 238000004132 cross linking Methods 0.000 description 5
- 238000010586 diagram Methods 0.000 description 4
- 238000003384 imaging method Methods 0.000 description 4
- 238000003860 storage Methods 0.000 description 4
- 238000012935 Averaging Methods 0.000 description 3
- 239000012472 biological sample Substances 0.000 description 3
- 210000004027 cell Anatomy 0.000 description 3
- 238000005315 distribution function Methods 0.000 description 3
- 239000003814 drug Substances 0.000 description 3
- 239000002245 particle Substances 0.000 description 3
- 230000005856 abnormality Effects 0.000 description 2
- 238000005311 autocorrelation function Methods 0.000 description 2
- 239000000084 colloidal system Substances 0.000 description 2
- 230000003247 decreasing effect Effects 0.000 description 2
- 230000001066 destructive effect Effects 0.000 description 2
- 239000011521 glass Substances 0.000 description 2
- 239000004973 liquid crystal related substance Substances 0.000 description 2
- 238000004519 manufacturing process Methods 0.000 description 2
- 229910052751 metal Inorganic materials 0.000 description 2
- 239000002184 metal Substances 0.000 description 2
- 239000002086 nanomaterial Substances 0.000 description 2
- 229920003023 plastic Polymers 0.000 description 2
- 239000004033 plastic Substances 0.000 description 2
- 239000004065 semiconductor Substances 0.000 description 2
- 239000002904 solvent Substances 0.000 description 2
- 230000003068 static effect Effects 0.000 description 2
- 239000000126 substance Substances 0.000 description 2
- 238000013519 translation Methods 0.000 description 2
- 230000005653 Brownian motion process Effects 0.000 description 1
- 238000012356 Product development Methods 0.000 description 1
- 230000008033 biological extinction Effects 0.000 description 1
- 238000005537 brownian motion Methods 0.000 description 1
- UIZLQMLDSWKZGC-UHFFFAOYSA-N cadmium helium Chemical compound [He].[Cd] UIZLQMLDSWKZGC-UHFFFAOYSA-N 0.000 description 1
- 238000004422 calculation algorithm Methods 0.000 description 1
- 210000000845 cartilage Anatomy 0.000 description 1
- 238000007796 conventional method Methods 0.000 description 1
- 239000002537 cosmetic Substances 0.000 description 1
- 230000006866 deterioration Effects 0.000 description 1
- 239000006185 dispersion Substances 0.000 description 1
- 230000000694 effects Effects 0.000 description 1
- 239000008151 electrolyte solution Substances 0.000 description 1
- 238000005516 engineering process Methods 0.000 description 1
- 238000011156 evaluation Methods 0.000 description 1
- 239000000835 fiber Substances 0.000 description 1
- 239000010419 fine particle Substances 0.000 description 1
- 230000009969 flowable effect Effects 0.000 description 1
- 239000012530 fluid Substances 0.000 description 1
- 238000005194 fractionation Methods 0.000 description 1
- 235000013376 functional food Nutrition 0.000 description 1
- 230000004927 fusion Effects 0.000 description 1
- CPBQJMYROZQQJC-UHFFFAOYSA-N helium neon Chemical compound [He].[Ne] CPBQJMYROZQQJC-UHFFFAOYSA-N 0.000 description 1
- 239000012497 inhomogeneous sample Substances 0.000 description 1
- 230000003834 intracellular effect Effects 0.000 description 1
- 239000007788 liquid Substances 0.000 description 1
- 239000008204 material by function Substances 0.000 description 1
- 244000005700 microbiome Species 0.000 description 1
- 210000003463 organelle Anatomy 0.000 description 1
- 230000000149 penetrating effect Effects 0.000 description 1
- 229920002401 polyacrylamide Polymers 0.000 description 1
- 238000003908 quality control method Methods 0.000 description 1
- 238000005295 random walk Methods 0.000 description 1
- 230000001172 regenerating effect Effects 0.000 description 1
- 238000011160 research Methods 0.000 description 1
- 239000007787 solid Substances 0.000 description 1
- 238000001228 spectrum Methods 0.000 description 1
- 238000012916 structural analysis Methods 0.000 description 1
- 230000008961 swelling Effects 0.000 description 1
- XLYOFNOQVPJJNP-UHFFFAOYSA-N water Substances O XLYOFNOQVPJJNP-UHFFFAOYSA-N 0.000 description 1
Images




Landscapes
- Investigating Or Analysing Materials By Optical Means (AREA)
Abstract
Description
本発明は、走査型顕微光散乱測定解析装置および光散乱解析方法に関するものである。 The present invention relates to a scanning microscopic light scattering measurement analysis apparatus and a light scattering analysis method.
動的光散乱法は、溶液内部で起こっている熱運動を光の散乱現象を通して測定することにより、溶液内部の微細な構造とその運動性を解析する方法である。 The dynamic light scattering method is a method of analyzing the fine structure inside the solution and its mobility by measuring the thermal motion occurring inside the solution through the light scattering phenomenon.
通常、光を用いる測定は、光の波長以下の構造を調べることは原理的に困難である。しかし動的光散乱法は、熱運動を通して内部構造を観測するため光の波長以下(1μm以下から0.1nmまで)の微細構造を測定することができる。従って、動的光散乱法は、人体に対して比較的安全な可視光のレーザ光源を用いて、溶液中に分散した粒子のサイズやゲルの網目構造を決定できる便利な観測法である。 Usually, in the measurement using light, it is difficult in principle to examine the structure below the wavelength of light. However, the dynamic light scattering method can measure the fine structure below the wavelength of light (from 1 μm to 0.1 nm) because the internal structure is observed through thermal motion. Therefore, the dynamic light scattering method is a convenient observation method that can determine the size of particles dispersed in a solution and the network structure of a gel using a visible light source that is relatively safe for the human body.
動的光散乱法は、透明な粒子分散系における粒子サイズを溶液状態でそのまま測定する方法として広く用いられている。一方、動的光散乱法をゲル、液晶、コロイド等の微細構造が複雑な試料の測定に応用しようという試みは早くからなされていたが、実用化には至っていなかった。これは、ゲル等からの散乱光には内部構造の不均一性に起因する過剰な成分が不可避に含まれているが、この成分を正しく評価する方法が無かったことが主な要因である。 The dynamic light scattering method is widely used as a method for directly measuring the particle size in a transparent particle dispersion system in a solution state. On the other hand, attempts to apply the dynamic light scattering method to the measurement of a sample having a complicated fine structure such as gel, liquid crystal, and colloid have been made early, but have not yet been put into practical use. This is mainly due to the fact that the scattered light from the gel or the like inevitably contains an excessive component due to the non-uniformity of the internal structure, but there is no method for correctly evaluating this component.
特にゲルにおいては、大部分が水で溶質が少ないこと、溶媒と溶質の誘電率が近く光に対するコントラストがつきにくいこと、本質的に不均一な構造であり様々なスケールの不均一性が混在するため散乱光は場所に強く依存すること等から動的光散乱法による測定の実用化が困難であった。 Especially in gels, most of them are water and have little solute, the dielectric constant of the solvent and solute is close, and the contrast to light is difficult to be applied, and the structure is essentially non-uniform, with non-uniformities of various scales mixed. Therefore, since the scattered light strongly depends on the location, it is difficult to put the measurement by the dynamic light scattering method into practical use.
このような背景において、本発明者らは、ゲルの不均一性を克服するものとして走査型顕微光散乱(SMILS)を開発した(非特許文献1〜4、特許文献1)。そして走査型顕微散乱により不均一性に起因する散乱光の過剰成分を厳密に考慮し、時間平均と空間平均を正しく行った統計平均(アンサンブル平均)の測定量を決定する方法が開発された(非特許文献1〜3参照)。 In such a background, the present inventors have developed scanning microscopic light scattering (SMILS) as a means of overcoming the non-uniformity of the gel (Non-Patent
走査型顕微光散乱は、入射光の集光部と、散乱光の検出部に対物レンズを用いることで散乱体積を直径数μmに絞り、走査機構により数μm間隔で測定位置を変えながら微小な散乱体積についての動的光散乱測定:を行うことができる。走査型顕微光散乱は微小な領域をピックアップして内部を測定でき、多数の点を連続的に測定して不均一な系でも厳密な平均量を測定することができる。 Scanning microscopic light scattering is achieved by using an objective lens for the incident light condensing unit and the scattered light detecting unit to reduce the scattering volume to several μm in diameter, and by changing the measurement position at intervals of several μm using a scanning mechanism. Dynamic light scattering measurements on the scattering volume can be made: Scanning microscopic light scattering can measure the inside by picking up a minute region, and can measure a strict average amount even in a non-uniform system by continuously measuring many points.
そして不均質または格段に微量な試料、高粘度や複雑な形状など、これまで測定が困難だった範囲の測定ができるようになり、動的揺らぎを分析する原理に基づくことでナノスケールの構造に関する情報が得られるため、非常に広い時空間領域(100ns〜1h,0.1nm〜数mm)をカバーすることができる。 In addition, it has become possible to measure in a range that has been difficult to measure, such as inhomogeneous or extremely small samples, high viscosity, and complicated shapes, and it is based on the principle of analyzing dynamic fluctuations and related to nanoscale structures. Since information is obtained, a very wide space-time region (100 ns to 1 h, 0.1 nm to several mm) can be covered.
このようにして、可視光の光源を用いながら、複雑な内部構造をもつゲルの微細な内部構造を非破壊、非接触でそのまま測定する実用的な方法が確立した。この走査型顕微光散乱測定解析装置は、ゲル解析用途等の製品化が期待されている。例えば、高強度ゲルを活かした新しい機能性材料の研究が盛んに行われつつあるが、中でもDN(Double Network)ゲルは、含水率90%で破断応力10〜40MPaと、大量の溶媒を含みながらもゴムや生体軟骨に匹敵する強度を持つゲルである(非特許文献5)。このDNゲルの構造解析ができれば、製品製造工程におけるゲル使用量の低減等において効果をもたらすと考えられる。 In this way, a practical method has been established in which a fine internal structure of a gel having a complex internal structure is measured as it is, without using a visible light source, in a non-destructive and non-contact manner. This scanning microscopic light scattering measurement analyzer is expected to be commercialized for gel analysis. For example, research on new functional materials utilizing high-strength gel is being actively conducted. Among them, DN (Double Network) gel has a moisture content of 90% and a breaking stress of 10 to 40 MPa, including a large amount of solvent. Is a gel having a strength comparable to that of rubber or living cartilage (Non-patent Document 5). If the structure analysis of this DN gel can be performed, it will be effective in reducing the amount of gel used in the product manufacturing process.
しかしながら、走査型顕微光散乱測定解析装置には、次のような点が求められている。 However, the scanning microscopic light scattering measurement analyzer is required to have the following points.
第1に、上記したようにゲル状の試料には一見透明に見えても試料の内部に屈折率の濃淡やコントラストがあるため散乱した光の強さが測定する場所に強く依存する。従って強い散乱光強度のデータほど解析に適さないデータが含まれる場合が多い。 First, as described above, even if the gel-like sample looks transparent at first glance, the intensity of the scattered light strongly depends on the place to be measured because the sample has a refractive index density and contrast. Therefore, there are many cases where data having a higher intensity of scattered light includes data that is not suitable for analysis.
そのため試料中の多くの位置で測定したり、一度に多くの位置を測定するという方法が採られているが、従来のアンサンブル平均の取り方では試料中の多くの位置で測定した緩和データを単純に数平均するため、解析に適さない緩和データに統計的な重みが掛かり、平均した後の緩和データの正確性を低下させる要因となっている。 For this reason, it is possible to measure at many positions in the sample or to measure many positions at once, but the conventional method of ensemble averaging is simply to use relaxation data measured at many positions in the sample. Therefore, the statistical weight is applied to the mitigation data that is not suitable for analysis, which is a factor that reduces the accuracy of the mitigation data after the averaging.
第2に、緩和データの中には、単純緩和(寿命)、並進運動(速度)、拡散運動(拡散係数)の3つの情報が含まれているが、専門家でないと緩和データの解釈は難しく、容易な判別ができない。そのため試料に応じたこれら3つの情報を専門家でなくとも容易に判別できることが求められている。 Secondly, the relaxation data includes three types of information: simple relaxation (lifetime), translational motion (velocity), and diffusional motion (diffusion coefficient), but it is difficult to interpret the relaxation data unless you are an expert. Easy discrimination is not possible. Therefore, it is required that these three pieces of information corresponding to the sample can be easily discriminated without being an expert.
第3に、従来の走査型顕微光散乱においては測定する散乱角を規定するために分光器としての形態をとることが多く、微量な生体試料を測定すること等が困難である。そのため、散乱角を簡易な構成で規定することができ、散乱角を規定する構成を走査型顕微光散乱に容易に組み込む技術が望まれている。 Third, conventional scanning microscopic light scattering often takes the form of a spectroscope to define the scattering angle to be measured, and it is difficult to measure a very small amount of biological sample. Therefore, there is a demand for a technology that can define the scattering angle with a simple configuration and easily incorporate the configuration that defines the scattering angle into scanning microscopic light scattering.
本発明は、以上の通りの事情に鑑みてなされたものであり、走査型の測定により多点で得られた試料の緩和データから適切な緩和データを選別してアンサンブル平均を正確に測定することができる走査型顕微光散乱測定解析装置および光散乱解析方法を提供することを課題としている。 The present invention has been made in view of the circumstances as described above, and accurately measures the ensemble average by selecting appropriate relaxation data from the relaxation data of the sample obtained at multiple points by scanning type measurement. It is an object of the present invention to provide a scanning microscopic light scattering measurement analysis device and a light scattering analysis method capable of performing the above.
また、緩和データに含まれる単純緩和、並進運動、拡散運動の情報を容易に判別することができる走査型顕微光散乱測定解析装置および光散乱解析方法を提供することを課題としている。 Another object of the present invention is to provide a scanning microscopic light scattering measurement analysis device and a light scattering analysis method capable of easily discriminating information on simple relaxation, translational motion, and diffusion motion included in relaxation data.
さらに、散乱光の散乱角を簡易な構成で規定することができ、散乱角を規定する構成を走査型顕微光散乱に容易に組み込むことができる走査型顕微光散乱測定解析装置および光散乱解析方法を提供することを課題としている。 Furthermore, a scanning microscopic light scattering measurement analysis apparatus and a light scattering analysis method that can define the scattering angle of scattered light with a simple configuration and can easily incorporate the configuration defining the scattering angle into scanning microscopic light scattering. It is an issue to provide.
上記の課題を解決するために、本発明の走査型顕微光散乱測定解析装置は、
試料にレーザ光を入射するレーザ光源と、
試料をレーザ光源からのレーザ光軸に対して相対移動可能な走査機構と、
レーザ光源から試料に入射したレーザ光の散乱光を検出する検出手段と、
走査機構により走査した各試料位置での検出手段による散乱光の検出結果に基づいて時間平均相関関数−相関時間の緩和データを演算する時間平均相関関数演算手段と、
走査機構により走査した各試料位置における時間平均相関関数−相関時間の緩和データに基づいてアンサンブル平均相関関数−相関時間の緩和データを演算するアンサンブル平均相関関数演算手段とを備えた走査型顕微光散乱測定解析装置において、
時間平均相関関数−相関時間の緩和データについて、アンサンブル平均相関関数を演算する緩和データとして採用するか否かの閾値を異常な現象に起因する振幅の大きさに基づいて設定する閾値設定手段と、
走査機構により走査した各試料位置における時間平均相関関数−相関時間の緩和データについて、閾値設定手段により設定した閾値に基づいてアンサンブル平均相関関数を演算する緩和データとして採用するか否かを選別する緩和データ選別手段とを備えることを特徴としている。In order to solve the above problems, the scanning microscopic light scattering measurement analyzer of the present invention is:
A laser light source for injecting laser light into the sample;
A scanning mechanism capable of moving the sample relative to the laser optical axis from the laser light source;
Detection means for detecting scattered light of the laser light incident on the sample from the laser light source;
A time average correlation function calculating means for calculating relaxation data of the time average correlation function-correlation time based on the detection result of the scattered light by the detection means at each sample position scanned by the scanning mechanism;
Scanning microscopic light scattering comprising: time average correlation function at each sample position scanned by the scanning mechanism-ensemble average correlation function-ensemble average correlation function calculation means for calculating correlation time relaxation data based on correlation time relaxation data In measurement analysis equipment,
About time average correlation function-correlation time relaxation data, a threshold setting means for setting a threshold as to whether or not to employ the ensemble average correlation function as relaxation data based on the magnitude of the amplitude caused by an abnormal phenomenon;
Relaxation for selecting whether or not to adopt time average correlation function-correlation time relaxation data at each sample position scanned by the scanning mechanism as relaxation data for calculating the ensemble average correlation function based on the threshold set by the threshold setting means And a data selection means.
この走査型顕微光散乱測定解析装置おいては、異常な現象に基づく振幅は、緩和成分が少なく横一直線に近い緩和データの振幅、機械的または電気的な振動による異常振幅、緩和データの裾野における跳ね上がりの振幅、および緩和データの裾野における減少振幅から選ばれる1種以上であることが好ましい。 In this scanning type microscopic light scattering measurement and analysis apparatus, the amplitude based on an abnormal phenomenon is such that the relaxation component has a small relaxation component and is close to a horizontal straight line, the abnormal amplitude due to mechanical or electrical vibration, and the base of the relaxation data. It is preferably at least one selected from the amplitude of jumping and the decreasing amplitude at the base of relaxation data.
この走査型顕微光散乱測定解析装置おいては、閾値設定手段は、閾値の初期値、変化分、および最終値を設定し、
走査型顕微光散乱測定解析装置は、緩和データ選別手段によりアンサンブル平均相関関数の演算に採用しないと決定された不採用緩和データ数の全体の緩和データ数に対する割合について許容範囲の上限値を設定する許容範囲設定手段と、
不採用緩和データ数の割合が許容範囲設定手段により設定された許容範囲を超える場合に閾値を初期値から変化分に応じて変更する閾値変更手段と、
閾値を変化分に応じて最終値まで変更しても不採用緩和データ数が許容範囲を超える場合にアンサンブル平均相関関数の演算を行わずにエラー信号を出力するエラー信号出力手段とを備えることが好ましい。In this scanning microscopic light scattering measurement analyzer, the threshold setting means sets the initial value, change, and final value of the threshold,
The scanning microscopic light scattering measurement / analysis apparatus sets an upper limit value of an allowable range for the ratio of the number of unadopted relaxation data determined not to be adopted in the calculation of the ensemble average correlation function by the relaxation data selection means to the total number of relaxation data Tolerance setting means;
A threshold value changing means for changing the threshold value from the initial value according to the amount of change when the ratio of the number of non-adopted mitigation data exceeds the allowable range set by the allowable range setting means;
An error signal output means for outputting an error signal without calculating the ensemble average correlation function when the number of non-adopted mitigation data exceeds the allowable range even if the threshold value is changed to the final value according to the change amount. preferable.
この走査型顕微光散乱測定解析装置おいては、走査機構により走査した各試料位置での散乱光をレーザ光の波長およびレーザ光軸に対する散乱角から選ばれるいずれかの空間スケールを変更して測定可能な空間スケール変更手段と、
走査機構により走査した各試料位置での散乱光の測定結果に基づいて算出したアンサンブル平均相関関数−相関時間の緩和データより、空間スケール変更手段により空間スケールを変更した緩和データごとに、逆ラプラス変換により緩和時間分布−緩和時間のピークデータを演算する緩和時間分布演算手段と、
空間スケールを変更したそれぞれの緩和時間分布−緩和時間のピークデータについて、単純緩和、並進運動、および拡散運動の3種類に対応して、緩和時間を相対移動させずに、または緩和時間を空間スケールの大きさに対して比例的に相対移動させ、あるいは緩和時間を空間スケールの大きさに対して二乗依存的に相対移動させて、各ピークデータのピーク位置を重ね合せて積算し、単純緩和、並進運動、および拡散運動を分別してピークデータを演算する分別演算手段とを備えることが好ましい。In this scanning microscopic light scattering measurement analyzer, the scattered light at each sample position scanned by the scanning mechanism is measured by changing any spatial scale selected from the wavelength of the laser light and the scattering angle with respect to the laser optical axis. Possible spatial scaling means;
From the ensemble average correlation function-correlation time relaxation data calculated based on the measurement results of scattered light at each sample position scanned by the scanning mechanism, inverse Laplace transform is performed for each relaxation data whose spatial scale is changed by the spatial scale changing means. Relaxation time distribution-relaxation time distribution calculating means for calculating peak data of relaxation time distribution-relaxation time,
Each relaxation time distribution with different spatial scales-Relaxation time peak data corresponding to three types of simple relaxation, translational motion, and diffusion motion, without relative movement of relaxation time or spatial scale of relaxation time Relatively move relative to the magnitude of, or move the relaxation time relative to the size of the space scale in a square-dependent manner, superimpose the peak positions of each peak data and integrate, It is preferable to include a classification calculation unit that calculates the peak data by dividing the translational movement and the diffusion movement.
この走査型顕微光散乱測定解析装置おいては、空間スケール変更手段は、試料への入射光軸を揃えた波長の異なる複数のレーザ光源であり、空間スケールとしてレーザ光の波長を変更することが好ましい。 In this scanning microscopic light scattering measurement analyzer, the spatial scale changing means is a plurality of laser light sources having different wavelengths with the same optical axis of incidence on the sample, and the wavelength of the laser light can be changed as a spatial scale. preferable.
この走査型顕微光散乱測定解析装置おいては、空間スケール変更手段は、試料からの散乱光のレーザ光軸に対する散乱角を変更可能な散乱角変更手段であり、空間スケールとして散乱角を変更することが好ましい。 In this scanning microscopic light scattering measurement analyzer, the spatial scale changing means is a scattering angle changing means capable of changing the scattering angle of the scattered light from the sample with respect to the laser optical axis, and changes the scattering angle as a spatial scale. It is preferable.
この走査型顕微光散乱測定解析装置おいては、試料が上面に位置する開口部を有する試料ステージと、
開口部の下方に配置され検出手段に散乱光を導入する光学系の一部を構成する対物レンズと、
対物レンズの上面に、対物レンズの上面の周縁部近傍のうち一部を散乱光通過部として開放しそれ以外の部分を覆うように配置され、レーザ光を入射した試料から開口部を通過した散乱光を対物レンズの上面のうち散乱光通過部のみから入射させることによりレーザ光軸に対する散乱角を規定するカバー部材とを備えることが好ましい。In this scanning microscopic light scattering measurement analyzer, a sample stage having an opening located on the upper surface of the sample,
An objective lens that forms a part of an optical system that is arranged below the opening and introduces scattered light to the detection means;
Scattering that is placed on the top surface of the objective lens so that a part of the vicinity of the peripheral edge of the top surface of the objective lens is opened as a scattered light passage and the other part is covered, and the sample that has entered the laser beam passes through the opening. It is preferable to include a cover member that defines a scattering angle with respect to the laser optical axis by allowing light to enter only from the scattered light passage portion of the upper surface of the objective lens.
この走査型顕微光散乱測定解析装置おいては、試料面に対向配置された対物レンズと、
対物レンズの下面側の光学系に配置され、レーザ光を入射した試料からの散乱光のレーザ光軸に対する散乱角を規定する散乱光通過孔が設けられた散乱角選択フィルタとを備えることが好ましい。In this scanning microscopic light scattering measurement analysis apparatus, an objective lens disposed opposite to the sample surface,
It is preferable to include a scattering angle selection filter provided in the optical system on the lower surface side of the objective lens and provided with a scattered light passage hole for defining a scattering angle with respect to the laser optical axis of the scattered light from the sample incident with the laser light. .
また上記の課題を解決するために、本発明の光散乱解析方法は、レーザ光源から試料にレーザ光を入射し、試料をレーザ光軸に対して相対移動させて走査し各試料位置からの散乱光を検出する走査型顕微光散乱による光散乱解析方法において、
走査した各試料位置での散乱光の検出結果に基づいて得られる時間平均相関関数−相関時間の緩和データについて、アンサンブル平均相関関数を演算する緩和データとして採用するか否かの閾値を異常な現象に起因する振幅の大きさに基づいて設定する工程と、
走査した各試料位置での散乱光の検出結果に基づいて、各試料位置における時間平均相関関数−相関時間の緩和データを演算する工程と、
走査した各試料位置における時間平均相関関数−相関時間の緩和データについて、設定した閾値に基づいてアンサンブル平均相関関数を演算する緩和データとして採用するか否かを選別する工程と、
設定した閾値に基づいてアンサンブル平均相関関数を演算する緩和データとして選別した緩和データ群に基づいてアンサンブル平均相関関数−相関時間の緩和データを演算する工程とを含むことを特徴としている。In order to solve the above-described problems, the light scattering analysis method of the present invention is a method in which laser light is incident on a sample from a laser light source, the sample is scanned relative to the laser optical axis, and the light is scattered from each sample position. In the light scattering analysis method by scanning microscopic light scattering to detect light,
Abnormal phenomenon that the threshold of whether or not to adopt the ensemble average correlation function as the relaxation data for the time average correlation function-correlation time relaxation data obtained based on the detection result of scattered light at each scanned sample position Setting based on the magnitude of the amplitude caused by
Calculating a time-average correlation function-correlation time relaxation data at each sample position based on the detection result of the scattered light at each scanned sample position;
A step of selecting whether or not to adopt as the relaxation data for calculating the ensemble average correlation function based on the set threshold for the time average correlation function-correlation time relaxation data at each scanned sample position;
And calculating a ensemble average correlation function-relaxation time relaxation data based on a relaxation data group selected as relaxation data for calculating an ensemble average correlation function based on a set threshold value.
この光散乱解析方法おいては、異常な現象に基づく振幅は、緩和成分が少なく横一直線に近い緩和データの振幅、機械的または電気的な振動による異常振幅、緩和データの裾野における跳ね上がりの振幅、および緩和データの裾野における減少振幅から選ばれる1種以上であることが好ましい。 In this light scattering analysis method, the amplitude based on the abnormal phenomenon is the relaxation data amplitude with little relaxation component and close to the horizontal line, the abnormal amplitude due to mechanical or electrical vibration, the amplitude of the jump at the base of the relaxation data, And it is preferably at least one selected from decreasing amplitudes at the base of relaxation data.
この光散乱解析方法おいては、閾値の初期値、変化分、および最終値を設定する工程と、
閾値に基づいてアンサンブル平均相関関数の演算に採用しないと決定された不採用緩和データ数の全体の緩和データ数に対する割合について許容範囲の上限値を設定する工程と、
走査した各試料位置における時間平均相関関数−相関時間の緩和データを演算した結果、不採用緩和データ数の割合が設定された許容範囲を超える場合に閾値を初期値から変化分に応じて変更する工程と、
閾値を変化分に応じて最終値まで変更しても不採用緩和データ数が許容範囲を超える場合にアンサンブル平均相関関数の演算を行わずにエラー信号を出力する工程とを含むことが好ましい。In this light scattering analysis method, a step of setting an initial value, a change amount, and a final value of a threshold value;
A step of setting an upper limit value of an allowable range for a ratio of the number of non-adopted mitigation data determined not to be adopted in the calculation of the ensemble average correlation function based on a threshold to the total mitigation data number;
As a result of calculating relaxation data of time average correlation function-correlation time at each scanned sample position, the threshold value is changed from the initial value according to the change when the ratio of the number of non-adopted relaxation data exceeds the set allowable range Process,
It is preferable to include a step of outputting an error signal without calculating the ensemble average correlation function when the number of non-adopted mitigation data exceeds the allowable range even if the threshold value is changed to the final value according to the change.
この光散乱解析方法おいては、走査した各試料位置での散乱光をレーザ光の波長およびレーザ光軸に対する散乱角から選ばれるいずれかの空間スケールを変更して測定する工程と、
走査した各試料位置での散乱光の測定結果に基づいて算出したアンサンブル平均相関関数−相関時間の緩和データより、空間スケール変更手段により空間スケールを変更した緩和データごとに、逆ラプラス変換により緩和時間分布−緩和時間のピークデータを演算する工程と、
空間スケールを変更したそれぞれの緩和時間分布−緩和時間のピークデータについて、単純緩和、並進運動、および拡散運動の3種類に対応して、緩和時間を相対移動させずに、または緩和時間を空間スケールの大きさに対して比例的に相対移動させ、あるいは緩和時間を空間スケールの大きさに対して二乗依存的に相対移動させて、各ピークデータのピーク位置を重ね合せて積算し、単純緩和、並進運動、および拡散運動を分別してピークデータを演算する工程とを含むことが好ましい。In this light scattering analysis method, measuring the scattered light at each scanned sample position by changing any spatial scale selected from the wavelength of the laser light and the scattering angle with respect to the laser optical axis;
Based on the relaxation data of the ensemble average correlation function-correlation time calculated based on the measurement result of the scattered light at each scanned sample position, the relaxation time is calculated by inverse Laplace transform for each relaxation data whose spatial scale is changed by the spatial scale changing means. A step of calculating peak data of distribution-relaxation time;
Each relaxation time distribution with different spatial scales-Relaxation time peak data corresponding to three types of simple relaxation, translational motion, and diffusion motion, without relative movement of relaxation time or spatial scale of relaxation time Relatively move relative to the magnitude of, or move the relaxation time relative to the size of the space scale in a square-dependent manner, superimpose the peak positions of each peak data and integrate, It is preferable to include a step of calculating peak data by separating translational motion and diffusion motion.
この光散乱解析方法おいては、試料への入射光軸を揃えた波長の異なる複数のレーザ光源を用いて、空間スケールとしてレーザ光の波長を変更することが好ましい。 In this light scattering analysis method, it is preferable to change the wavelength of the laser light as a spatial scale by using a plurality of laser light sources having different wavelengths with the same optical axis of incidence on the sample.
この光散乱解析方法おいては、空間スケールとして、試料からの散乱光のレーザ光軸に対する散乱角を変更することが好ましい。 In this light scattering analysis method, it is preferable to change the scattering angle of the scattered light from the sample with respect to the laser optical axis as a spatial scale.
本発明の走査型顕微光散乱測定解析装置によれば、走査型の測定により多点で得られた試料の緩和データから適切な緩和データを選別してアンサンブル平均を正確に測定することができる。また、緩和データに含まれる単純緩和、並進運動、拡散運動の情報を容易に判別することができる。さらに、散乱光の散乱角を簡易な構成で規定することができ、散乱角を規定する構成を走査型顕微光散乱に容易に組み込むことができる。 According to the scanning microscopic light scattering measurement analyzer of the present invention, it is possible to accurately measure ensemble averages by selecting appropriate relaxation data from relaxation data of a sample obtained at multiple points by scanning type measurement. In addition, simple relaxation, translational motion, and diffusion motion information included in the relaxation data can be easily identified. Furthermore, the scattering angle of the scattered light can be defined with a simple configuration, and the configuration for defining the scattering angle can be easily incorporated into the scanning microscopic light scattering.
本発明の光散乱解析方法によれば、走査型の測定により多点で得られた試料の緩和データから適切な緩和データを選別してアンサンブル平均を正確に測定することができる。また、緩和データに含まれる単純緩和、並進運動、拡散運動の情報を容易に判別することができる。 According to the light scattering analysis method of the present invention, it is possible to accurately measure ensemble averages by selecting appropriate relaxation data from relaxation data of a sample obtained at multiple points by scanning measurement. In addition, simple relaxation, translational motion, and diffusion motion information included in the relaxation data can be easily identified.
以下に、図面を参照しながら本発明の実施形態について説明する。 Embodiments of the present invention will be described below with reference to the drawings.
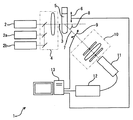
図1は、本発明の走査型顕微光散乱測定解析装置の実施形態を概略的に示した図である。 FIG. 1 is a diagram schematically showing an embodiment of a scanning microscopic light scattering measurement analyzer according to the present invention.
この走査型顕微光散乱測定解析装置1は、試料5にレーザ光3を入射するレーザ光源2と、試料5をレーザ光源2からのレーザ光軸に対して相対移動可能な走査機構6と、レーザ光源2から試料5に入射したレーザ光3の散乱光7を検出する検出手段11とを備えている。 The scanning microscopic light scattering
レーザ光源2は、例えば可視光領域の波長のレーザ光3を出射するものを用いることができ、He−Ne(ヘリウムーネオン)レーザ(λ=632.8nm)、半導体レーザ(λ=473nm、532nm、671nm等)、He−Cd(ヘリウムーカドミウム)レーザ(λ=442nm)等を用いることができる。 As the
また図1に示すように、レーザ光源2に加えて、試料5への入射光軸を揃えた波長の異なる複数のレーザ光源2a、2bを用いることもできる。これらはハーフミラーや全反射ミラーを配置してそれぞれのレーザ光源2、2a、2bが時分割で出射するように構成することができる。この実施形態では、レーザ光源2としてHe−Neレーザ、レーザ光源2aとして半導体レーザ、レーザ光源2bとしてHe−Cdレーザを用いている。 As shown in FIG. 1, in addition to the
試料5は、測定の対象となる物質であり、透明、不透明のいずれであってもよく、ゲル、固体、液晶、コロイド、高分子溶液、高分子溶融液、電解質溶液、微生物・細胞小器官・細胞内形質等の微粒子が溶解した溶液等を挙げることができる。例えば、不均質なものや透明度が低いもの、高粘度で複雑な形状をしたものでも試料5として測定、解析することができる。
レーザ光源2からのレーザ光3は、入射側の光学系4を通じて試料5に入射する。光学系4は、集光用の対物レンズ等から構成することができる。例えば、レーザ光3を集光する円筒面平凸レンズと、垂直偏光ではない余分な成分を取り除く偏光板を入射側の光学系4として配置することができる。
試料5は、必要に応じてレーザ光3に対して透明な試料セル等に収容される。試料5は、走査機構6によりレーザ光源2からのレーザ光軸に対して相対移動可能であり、コンピュータ13の指示により走査機構6の制御部を駆動し、試料5の位置を三次元に、例えばXYZ軸の座標を用いて移動させる。 The
試料5に入射したレーザ光3が試料5を通過する際に散乱する散乱光7は、レーザ光3から所定の散乱角8の方向において検出側の光学系10に導入される。散乱角8は、0°〜180°の間で設定することができ、散乱角調節機構9によりレーザ光3の光軸と光学系10とを相対的に回転移動させて散乱角8を変更することができる。
検出側の光学系10は、例えば、試料5から散乱した散乱光7を集光する対物レンズ、散乱光7の光路を変更するプリズム、偏光板、散乱光7を通過させるピンホールやスリット、散乱光7の効率を上げる凸レンズ等を適宜に配置して構成することができる。 The detection-side
検出手段11は、散乱光7を検出し電気信号に変換する。検出手段11として、例えば光電子増倍管やアバランシェダイオード等を用いることができる。 The detection means 11 detects the
検出手段11からの電気信号は、信号処理部12により処理されデジタル信号としてコンピュータ13に入力される。信号処理部12は、例えば、プリアンプ−ディスクリミネータ、パルス間隔測定器、コンピュータ13とのインターフェースとしてのデジタル入力回路等を適宜に用いて構成することができる。 The electrical signal from the detection means 11 is processed by the
コンピュータ13は、試料5の走査機構6や散乱角調節機構9を制御する。また後述する処理により、検出手段11からの信号処理部12を通じて入力された時系列の散乱光データの解析を行う。走査機構6により走査した各試料位置における時系列の散乱光データに基づいて各試料位置における散乱光強度の時間平均相関関数(自己相関関数)が演算され、これらを後述の閾値により選別した後にアンサンブル平均を取り、最終的には緩和時間分布が得られる。 The
走査型顕微鏡光散乱は、ナノ構造の情報を数分から30分程度の短時間の分析で簡便に得ることができる技術であり、例えば1μL程度の微量ゲル状試料5を走査型顕微鏡光散乱により光学的に測定し後述するような適切な統計処理を施すことにより、試料5内部のナノメートルサイズの網目構造を非破壊、非接触で定量的に測定することができる。走査機構6によりゲルの試料5の微小な内部領域において多数の点をピックアップし連続的に走査を行い適切な統計処理をすることで不均質な試料5でも厳密な平均量を測定できる。これにより、含水率に基づいた分析では得ることのできないナノスケールの網目サイズ分布を定量的に分析することができ、例えば10μmステップで1mm立方(=1μL)のゲルの試料5の領域内の100カ所を走査測定することにより、網目サイズの分布関数を定量的に決定し、微量な試料5の内部のナノ網目構造についての情報を視覚的・直感的に把握することができる。ゲルの試料5の構造解析の場合、走査型顕微光散乱で測定可能な網目サイズは通常1nm〜10μm程度であり、網目サイズの平均値だけでなく分布の形状も決定できる。 Scanning microscope light scattering is a technique that can easily obtain information on nanostructures in a short time analysis of several minutes to 30 minutes. For example, a
コンピュータ13は、データを演算処理する演算部と、各処理を実行する際にデータを保持し、読み込み、書き込む記憶部とを有している。またCPU(Central Processing Unit)等のコンピュータ13の処理全体(演算部の処理実行も含む)を制御する手段を有している。 The
コンピュータ13の演算部は、記憶部に格納されている時系列の散乱光データを用いて、時間平均相関関数を算出する。散乱光データの取得と時間平均相関関数の算出には、非特許文献1、2、特許文献1に記載の方法を適用することができる。走査型顕微光散乱を用いると試料5内部の多くの位置で連続的に時間平均相関関数gt (2)(q,τ)を測定することができる。ここで、τは相関時間、qは散乱ベクトルを表す。また、下付き添字のtは時間平均であること、上付き添宇の(2)は二次の相関関数であることを表している。The computing unit of the
この試料5内部の各位置で測定された多くのgt (2)(q,τ)を用いて、アンサンブル平均相関関数gen (1)(q,τ)を次式を用いて厳密に決定できる(H.Furukawa,S.Hirotsu,J.Phys.Soc.Jpn.,71,2873−2880(2002))。The
ここで、Iは散乱光強度、γは装置定数である。また、下付き添字のspは空間平均、enはアンサンブル平均であること、上付き添字の(1)は一次の相関関数であることを表している。1つの試料5の中の多くの場所で時間平均相関関数を細かく測定することで、正確に測定されたデータが適切に積算され、最終的に誤差の小さい結果が得られる。Here, I is the scattered light intensity, and γ is a device constant. The subscript sp represents the spatial average, en represents the ensemble average, and the superscript (1) represents a linear correlation function. By measuring the time-average correlation function finely at many locations in one
信号処理部12とコンピュータ13の演算部により各データの取得が行われる。これらは次に説明する時間平均相関関数演算手段、アンサンブル平均相関関数演算手段、閾値設定手段、緩和データ選別手段、許容範囲設定手段、閾値変更手段、エラー信号出力手段、緩和時間分布演算手段、および分別演算手段として機能する。 Each data is acquired by the
検出手段11から信号処理部12により処理された時系列の散乱光データ、時間平均相関関数−相関時間の緩和データ、アンサンブル平均相関関数−相関時間の緩和データ、緩和時間分布−緩和時間のピークデータはコンピュータ13の記憶部に格納することができる。また、次に説明する各データ処理は、アルゴリズムに基づく解析プログラムによりコンピュータ13の演算部に実行させることができる。解析プログラムは、コンピュータ13に読み込まれることにより実行可能なプログラムとして記録媒体に記録することができる。 Time-series scattered light data, time average correlation function-correlation time relaxation data, ensemble average correlation function-correlation time relaxation data, relaxation time distribution-relaxation time peak data processed from the detection means 11 by the
この実施形態では、まず図1および図3に示すように、走査機構6により走査した各試料位置での検出手段11による散乱光7の検出結果に基づいて時間平均相関関数−相関時間の緩和データを演算し、この緩和データについて次に説明する閾値による緩和データの選別を行った後、選別された緩和データに基づいてアンサンブル平均相関関数−相関時間の緩和データを演算する。 In this embodiment, first, as shown in FIGS. 1 and 3, the time average correlation function-correlation time relaxation data based on the detection result of the
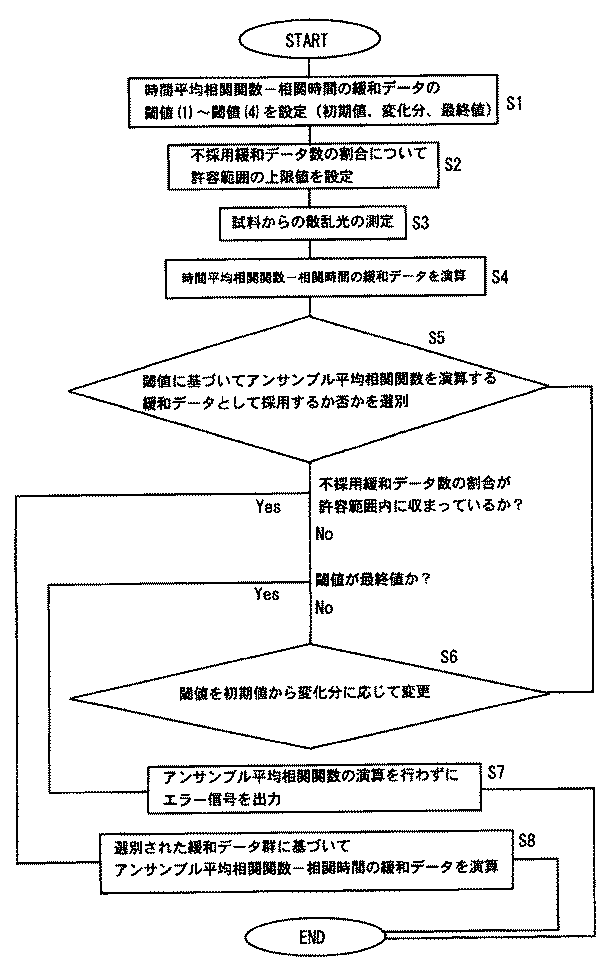
図2は、光散乱測定解析の一例を示すフローチャートである。フローチャートに沿って説明すると、まずコンピュータ13の閾値設定手段は、時間平均相関関数−相関時間の緩和データについて、アンサンブル平均相関関数を演算する緩和データとして採用するか否かの閾値を異常な現象に起因する振幅の大きさに基づいて設定する(S1)。 FIG. 2 is a flowchart showing an example of light scattering measurement analysis. Describing along the flowchart, first, the threshold setting means of the
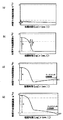
この実施形態では、異常な現象に基づく振幅として、図4(a)に示すような緩和成分が少なく横一直線に近い緩和データの振幅、図4(b)に示すような機械的または電気的な振動による異常振幅、図4(c)に示すような緩和データの裾野における跳ね上がりの振幅、および図4(d)に示すような緩和データの裾野における減少振幅について閾値(1)〜閾値(4)を設定する。 In this embodiment, as the amplitude based on the abnormal phenomenon, the amplitude of the relaxation data having few relaxation components as shown in FIG. 4A and close to a horizontal straight line, and the mechanical or electrical as shown in FIG. Threshold value (1) to threshold value (4) for the abnormal amplitude due to vibration, the amplitude of the jump at the base of the relaxation data as shown in FIG. 4C, and the decrease amplitude at the base of the relaxation data as shown in FIG. Set.
図4(a)では、緩和成分が少なく、横一直線に見えるデータについて、閾値(1)を設定する。横軸(相関時間)における所定位置での緩和成分の振幅Aが閾値(1)よりも小さい場合に緩和データを不採用にする。自己相関関数gt (1)(τ)(以下gt (2)(q,τ)をgt (1)(τ)と略記)のτ=0における振幅Aは理論的には散乱光に含まれる動的揺らぎ成分と静的揺らぎ成分の比に関係しており、動的揺らぎ成分が少なくなる程振幅Aは小さくなる(H.Furukawa,S.Hirotsu,J.Phys.Soc.Jpn.,71,2873−2880(2002))。一方、実験的には、振幅Aが小さくなりすぎると測定時のノイズの揺らぎを受けて正確な測定が難しくなるため、例えば測定精度の有効桁数を3桁程度とするのであれば、ノイズの少ない状況で測定したとしてもA<0.01となるような場合の緩和データは解析に利用できないと考えられる。In FIG. 4A, the threshold value (1) is set for data that has few relaxation components and appears to be a horizontal straight line. When the amplitude A of the relaxation component at a predetermined position on the horizontal axis (correlation time) is smaller than the threshold (1), the relaxation data is not adopted. The amplitude A at τ = 0 of the autocorrelation function g t (1) (τ) (hereinafter, g t (2) (q, τ) is abbreviated as g t (1) (τ)) is theoretically converted to scattered light. The amplitude A decreases as the dynamic fluctuation component decreases (H. Furukawa, S. Hirotsu, J. Phys. Soc. Jpn.,). 71, 2873-2880 (2002)). On the other hand, experimentally, if the amplitude A becomes too small, it becomes difficult to perform accurate measurement due to noise fluctuation at the time of measurement. For example, if the effective number of measurement accuracy is about 3 digits, Even if it is measured in a small number of situations, it is considered that relaxation data in the case of A <0.01 cannot be used for analysis.
図4(b)では、望ましくない機械的または電気的な振動、主に50Hz(ハムノイズ)が入っている緩和データについて、横軸(相関時間)における該当部分の振動の振幅Bについて閾値(2)を設定し、それよりも大きな振幅であれば緩和データを不採用にする。 In FIG. 4B, for relaxation data containing undesirable mechanical or electrical vibrations, mainly 50 Hz (hum noise), the threshold value (2) for the amplitude B of the corresponding part on the horizontal axis (correlation time). If the amplitude is larger than that, relaxation data is not adopted.
図4(c)では、測定時間内に緩和しない現象において緩和データの裾野が上方向に跳ね上がる場合があるが、この異常について閾値(3)を設定し、横軸(相関時間)における裾野の所定位置での跳ね上がりの振幅Cが閾値(3)よりも大きな場合は緩和データを不採用にする。振幅Cについては緩和データの裾野の下限(ベースライン)の計算方法にもよる。図中にここでのベースラインの計算範囲を示した。 In FIG. 4C, the base of the relaxation data may jump upward in a phenomenon that does not relax within the measurement time. A threshold (3) is set for this abnormality, and the base of the base on the horizontal axis (correlation time) is determined. When the amplitude C of the jump at the position is larger than the threshold value (3), the relaxation data is not adopted. The amplitude C depends on the calculation method of the lower limit (baseline) of the base of relaxation data. The calculation range of the baseline here is shown in the figure.
図4(d)では、測定時間内に緩和しない現象において緩和データの裾野が下方向に大きく下がる場合があるが、この異常について閾値(4)を設定している。すなわち、緩和データの裾野が下方向に大きく下がることにより、緩和データの裾野が理論的な下限(ベースライン)である1を下回る場合もある。そこで閾値(4)を設定し、横軸(相関時間)における所定位置での下方向への振幅Dが閾値(4)よりも大きな場合は緩和データを不採用にする。 In FIG. 4D, the base of the relaxation data may be greatly lowered in a phenomenon that does not relax within the measurement time. A threshold (4) is set for this abnormality. That is, there is a case where the base of the relaxation data falls below 1, which is the theoretical lower limit (baseline), due to the fact that the base of the relaxation data is greatly lowered. Therefore, a threshold value (4) is set, and relaxation data is not adopted when the downward amplitude D at a predetermined position on the horizontal axis (correlation time) is larger than the threshold value (4).
閾値(2)−(4)の設定の仕方は図中に示したτ=0における振幅αと比較すべきであるが、例えば測定精度の有効桁数を3桁程度とするのであれば、B,C,D>0.01αとなるような場合の緩和データは解析に利用できないと考えられる。 The method of setting the threshold values (2) to (4) should be compared with the amplitude α at τ = 0 shown in the figure. For example, if the effective number of measurement accuracy is about 3 digits, B , C, D> 0.01α is considered to be unusable for analysis.
そして閾値設定手段は、閾値の初期値、変化分、および最終値を設定する。これらの設定値は試料5の種類や測定条件等により適正値は異なり特に限定されないが、一例として、閾値(1)の場合は初期値0.1〜0.2程度、最終値0.01〜0.1程度として変化分を−0.001〜−0.01程度とすることができる。閾値(2)−(4)の場合は初期値0.01α〜0.1α程度、最終値0.1α〜0.2α程度として変化分を0.001〜0.01程度とすることができる。 The threshold value setting means sets an initial value, a change amount, and a final value of the threshold value. These set values differ depending on the type of
また、コンピュータ13の許容範囲設定手段は、後述する緩和データ選別手段によりアンサンブル平均相関関数の演算に採用しないと決定された不採用緩和データ数の全体の緩和データ数に対する割合について許容範囲を設定する(図2、S2)。具体的には、上記のように設定した閾値(1)〜閾値(4)に基づく不採用のデータ数を全体の何%まで許容するかを設定する。例えば、許容範囲を10%以下とした場合には、まず閾値(1)〜閾値(4)の初期値の組み合わせで不採用緩和データ数を数え、それが許容範囲である10%以下であれば不採用緩和データを取り除いてアンサンブル平均相関関数−相関時間の緩和データを演算する。 Further, the allowable range setting means of the
次に、図1および図3左側に示すように走査機構6により試料5を走査し、各試料位置での検出手段11による散乱光7の検出を行う(図2、S3)。これにより各試料位置での時系列の散乱光データが取得される。 Next, the
次に、コンピュータ13の時間平均相関関数演算手段は、走査機構6により走査した各試料位置での時系列の散乱光データに基づいて時間平均相関関数−相関時間の緩和データを演算する(図2、S4)。この時間平均相関関数−相関時間の緩和データはコンピュータ13の記憶部に格納される。 Next, the time average correlation function calculating means of the
次に、コンピュータ13の緩和データ選別手段は、走査機構6により走査した各試料位置における時間平均相関関数−相関時間の緩和データについて、閾値設定手段により設定した閾値(1)〜閾値(4)の初期値に基づいてアンサンブル平均相関関数を演算する緩和データとして採用するか否かを選別する(図2、S5)。 Next, the relaxation data selection means of the
そして不採用緩和データ数の割合が許容範囲設定手段により設定された許容範囲内に収まっている場合には、選別された緩和データ群に基づいてコンピュータ13のアンサンブル平均相関関数演算手段によりアンサンブル平均相関関数−相関時間の緩和データを演算する(図2、S8)。 If the ratio of the number of unaccepted relaxation data is within the allowable range set by the allowable range setting means, the ensemble average correlation function calculating means of the
一方、不採用緩和データ数の割合が許容範囲設定手段により設定された許容範囲を超える場合は、コンピュータ13の閾値変更手段は、閾値(1)〜閾値(4)のうち少なくともいずれかを初期値から閾値設定手段により予め設定した変化分に応じて変更する(図2、S6)。この変更はユーザがコンピュータ13への入力により行うこともでき、あるいは予め自動処理としてプログラムに組み込むようにしてもよい。 On the other hand, when the ratio of the number of non-adopted mitigation data exceeds the allowable range set by the allowable range setting unit, the threshold value changing unit of the
そしてS5に戻り、アンサンブル平均相関関数の演算のための緩和データとして採用するか否かの選別を再度行い、不採用緩和データ数の割合が許容範囲設定手段により設定された許容範囲内に収まるまでこの処理を繰り返す。 Then, returning to S5, the selection as to whether or not to adopt as relaxation data for the calculation of the ensemble average correlation function is performed again until the ratio of the number of non-adopted relaxation data falls within the allowable range set by the allowable range setting means. This process is repeated.
そして閾値を変化分に応じて変更した結果、不採用緩和データ数の割合が許容範囲設定手段により設定された許容範囲内に収まった場合には、選別された緩和データ群に基づいてコンピュータ13のアンサンブル平均相関関数演算手段によりアンサンブル平均相関関数−相関時間の緩和データを演算する(図2、S8)。 As a result of changing the threshold according to the change, when the ratio of the number of non-adopted mitigation data falls within the allowable range set by the allowable range setting means, the
一方、閾値(1)〜閾値(4)を閾値設定手段により予め設定した最終値まで変更しても不採用緩和データ数の割合が許容範囲設定手段により設定された許容範囲を超える場合は、アンサンブル平均相関関数の演算を行わずに、コンピュータ13のエラー信号出力手段は、エラー信号を出力する(図2、S7)。具体的には、例えばコンピュータ13のディスプレイ等の表示手段にエラーを表示してユーザに知らせることができる。 On the other hand, if the ratio of the number of non-adopted mitigation data exceeds the allowable range set by the allowable range setting means even if the threshold values (1) to (4) are changed to the final value preset by the threshold setting means, the ensemble Without calculating the average correlation function, the error signal output means of the
エラー信号が出力された場合には、ユーザは許容範囲設定手段により設定された許容範囲を変更して許容範囲を広げるか、あるいは閾値設定手段により設定された閾値(1)〜閾値(4)を変更してこれらの閾値を高くする等の対応をすることができる。 When an error signal is output, the user widens the allowable range by changing the allowable range set by the allowable range setting means, or changes the threshold (1) to threshold (4) set by the threshold setting means. It is possible to take measures such as changing these threshold values to be higher.
以上のようにして、走査型の測定により多点で得られた時間平均相関関数−相関時間の緩和データからアンサンブル平均のための適切なデータを選別することができ、試料5の場所に依存する不適切な緩和データを取り除いて適切なデータを選別することができる。これにより、不均質な液体やゲルを正確に測定することができ、従来測定できなかった試料の測定も可能となる。さらに図2の処理はコンピュータ13等により自動的に行うことができるので、専門家でなくとも容易に測定することができる。 As described above, appropriate data for ensemble averaging can be selected from the time average correlation function-correlation time relaxation data obtained at multiple points by scanning type measurement, and depends on the location of the
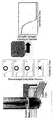
次に、以上のようにして得られたアンサンブル平均相関関数−相関時間の緩和データから逆ラプラス変換により緩和時間分布−緩和時間のピークデータを演算する方法について説明する。図5に示すように、試料5がゲルの場合には、この演算処理により内部の網目サイズの指標となる網目サイズ分布関数を導出できる。 Next, a method of calculating relaxation time distribution-relaxation time peak data by inverse Laplace transform from the ensemble average correlation function-correlation time relaxation data obtained as described above will be described. As shown in FIG. 5, when the
走査型顕微鏡光散乱を用いて得られたアンサンブル平均相関関数に、数値解析法として逆ラプラス変換を適用すると、緩和時間スペクトルを厳密に得ることができる。普通のゲルを測定すると、ゲルモードと呼ばれる網目のブラウン運動に起因する緩和モードが1つだけ測定される。ゲルモードの緩和時間τRからは、de Gennesのブロッブ理論に従って、網目サイズを定量的に求めることができる(古川英光,「若手研究者のための有機・高分子ラボガイド」,野瀬卓平,金谷利治,堀江一之編,講談社サイエンティフィク(2006),pp.206−215)。When inverse Laplace transform is applied as a numerical analysis method to an ensemble average correlation function obtained using scanning microscope light scattering, a relaxation time spectrum can be obtained strictly. When a normal gel is measured, only one relaxation mode due to the Brownian motion of the network called gel mode is measured. From the relaxation time τ R of the gel mode, the mesh size can be obtained quantitatively according to the de Gennes blob theory (Hidemitsu Furukawa, “Organic and Polymer Lab Guide for Young Researchers”, Takuhei Nose, Kanaya) Toshiji, Kazuyuki Horie, Kodansha Scientific (2006), pp. 206-215).
走査型顕微鏡光散乱を用いたアンサンブル平均測定では、厳密に緩和時間分布を決定できることから、ゲルモードの緩和時間から網目サイズの平均値を求めるだけでなく、ゲルモードの分布の幅から網目サイズ分布についての情報まで得ることができる。実際のゲルの網目は高分子の鎖同士が複雑に絡み合いながら、架橋点によるランダムな橋掛けで網目構造を形成している。従って、架橋点の空間分布や架橋点間の鎖の長さ(架橋点間分子量)を反映した網目のサイズ分布が存在するので、網目のプラウン運動に起因して観測されるゲルモードも、網目のサイズ分布を反映した緩和時問分布をもって観測される。 In the ensemble average measurement using scanning microscope light scattering, the relaxation time distribution can be determined strictly. Therefore, not only the average value of the network size is obtained from the relaxation time of the gel mode, but also the network size distribution is determined from the width of the distribution of the gel mode. You can get information. In an actual gel network, polymer chains are intertwined in a complex manner, and a network structure is formed by random cross-linking at the crosslinking points. Therefore, there is a network size distribution that reflects the spatial distribution of cross-linking points and the length of chains between cross-linking points (molecular weight between cross-linking points). Observed with a relaxed time distribution reflecting the size distribution.
この実施形態では、緩和時間分布−緩和時間のピークデータを演算すると同時に、緩和データの中に含まれている、単純緩和(寿命)、並進運動(速度)、拡散運動(拡散係数)の3つの情報を分別する。単純緩和は、測定対象が留まっていてその場所で生成/消滅を繰り返す。並進運動は、測定対象が等速直線運動により移動し、このとき移動距離が時間に比例する。拡散運動は、測定対象がランダムウォークで移動し、このとき移動距離の二乗が時間に比例する。 In this embodiment, the relaxation time distribution-relaxation time peak data is calculated, and at the same time, the simple relaxation (life), translational motion (velocity), and diffusion motion (diffusion coefficient) included in the relaxation data. Sort information. Simple relaxation repeats generation / extinction at the place where the measurement object stays. In the translational movement, the object to be measured is moved by a uniform linear motion, and the moving distance is proportional to time. In the diffusion motion, the object to be measured moves in a random walk, and at this time, the square of the moving distance is proportional to time.
この分別のために、測定に複数のレーザ光源2、2a、2bを用いて波長(記号λ)を変更するか、あるいは測定の散乱角8(記号θ)を変更することで測定の空間スケールを変更する。空間スケールは散乱ベクトルの大きさqの逆数としてq−1として定義できる(古川英光,「若手研究者のための有機・高分子ラボガイド」,野瀬卓平,金谷利治,堀江一之編,講談社サイエンティフィク(2006),pp.206−215)。ここで、散乱ベクトルの大きさは次式で計算される。For this classification, the spatial scale of the measurement is changed by changing the wavelength (symbol λ) using a plurality of
ここで、nは試料の屈折率である。正確には空間スケールに対応するのは2π/qであるが、ここでは相対的な大きさが重要であるので、簡単のためq−1として説明する。具体的には、単純緩和の場合は空間スケールを変更しても緩和時間分布−緩和時間のピークデータは横軸(時間スケール:緩和時間)方向に移動しない。なぜなら、単純緩和の場合、その寿命をτLとすれば、緩和時間τRはHere, n is the refractive index of the sample. To be precise, 2π / q corresponds to the spatial scale. However, since the relative size is important here, it will be described as q −1 for simplicity. Specifically, in the case of simple relaxation, even if the spatial scale is changed, the relaxation time distribution-relaxation time peak data does not move in the horizontal axis (time scale: relaxation time) direction. Because in the case of simple relaxation, if the lifetime is τ L , the relaxation time τ R is
となり、空間スケールq−1に依存しないためである。並進運動の場合は空間スケールを変更すると緩和時間分布−緩和時間のピークデータは横軸方向に空間スケールの大きさに比例して移動する。なぜなら、並進運動の場合、その速度ベクトルをvとすれば、緩和時間τRはThis is because it does not depend on the spatial scale q- 1 . In the case of translational motion, if the spatial scale is changed, the relaxation time distribution-relaxation time peak data moves in the horizontal axis direction in proportion to the size of the spatial scale. Because in translational motion, if the velocity vector is v, the relaxation time τ R is
となり、散乱ベクトルと速度ベクトルの内積の逆数に比例するため、空間スケールq−1に比例することになるからである。拡散運動の場合は空間スケールを変更すると緩和時間分布−緩和時間のピークデータは横軸方向に空間スケールの二乗に比例して移動する。なぜなら、拡散運動の場合、その拡散係数をDとすれば、緩和時間τRはThis is because it is proportional to the inverse of the inner product of the scattering vector and the velocity vector, and is therefore proportional to the spatial scale q- 1 . In the case of diffusion motion, if the spatial scale is changed, the relaxation time distribution-relaxation time peak data moves in the horizontal axis direction in proportion to the square of the spatial scale. Because, in the case of diffusion motion, if the diffusion coefficient is D, the relaxation time τ R is
となり、散乱ベクトルの二乗と拡散係数の積の逆数に比例するため、空間スケールq−1に二乗に比例することになるからである。この現象に基づいて単純緩和、並進運動、拡散運動のそれぞれについて緩和時間をずらして積算することにより分別する。This is because it is proportional to the square of the scattering vector and the inverse of the product of the diffusion coefficient, and is therefore proportional to the square of the spatial scale q- 1 . Based on this phenomenon, simple relaxation, translational motion, and diffusion motion are classified by shifting the relaxation time and integrating.
空間スケール変更を変更する空間スケール変更手段は、試料5への入射光軸を揃えた波長の異なる複数のレーザ光源2、2a、2bにより構成することができる。この場合は空間スケールとしてレーザ光の波長を変更する。 Spatial scale changing means for changing the spatial scale can be constituted by a plurality of
また、空間スケール変更手段は、試料5からの散乱光7のレーザ光軸に対する散乱角8を変更可能な散乱角変更手段により構成することができる。図1では散乱角調節機構9がこれに相当する。この場合は空間スケールとして散乱角8を変更する。 The space scale changing means can be constituted by a scattering angle changing means capable of changing the
走査型顕微光散乱測定解析装置1は、走査機構6により走査した各試料位置での散乱光7の測定を、空間スケール変更手段により空間スケールを変更した各条件にて行う。空間スケールとしてレーザ光3の波長を変更する場合には、試料5への入射光軸を揃えた波長の異なる複数のレーザ光源2、2a、2bにより時分割で測定を行い、各波長における散乱光7の測定を行う。3種類のレーザ光3の切り替えは、ユーザが切り替えることもでき、あるいはコンピュータ13によりレーザ光3の切り替えを制御することもできる。 The scanning microscopic light scattering
空間スケールとして試料5からの散乱光7のレーザ光軸に対する散乱角8を変更する場合には、散乱角調節機構9により散乱角8を変更した各条件にて散乱光7の測定を行う。 When the
そして空間スケールを変更して測定したそれぞれの散乱光データから、空間スケールごとに、前述したような手順によりアンサンブル平均相関関数−相関時間の緩和データを取得する。 Then, ensemble average correlation function-correlation time relaxation data is acquired for each spatial scale from the scattered light data measured by changing the spatial scale in accordance with the procedure described above.
空間スケールを変更した各緩和データは、次の処理により単純緩和、並進運動、拡散運動のいずれかに分別される。 Each relaxation data whose spatial scale is changed is classified into simple relaxation, translational motion, or diffusion motion by the following processing.
コンピュータ13の演算部は、緩和時間分布演算手段および分別演算手段として機能する。緩和時間分布演算手段は、走査機構6により走査した各試料位置での散乱光7の測定結果に基づいて算出したアンサンブル平均相関関数−相関時間の緩和データより、空間スケール変更手段により空間スケールを変更した緩和データごとに、逆ラプラス変換により緩和時間分布−緩和時間のピークデータを演算する。これによりアンサンブル平均相関関数−相関時間の緩和データをピークのデータにすることができる。 The calculation unit of the
分別演算手段は、空間スケールを変更したそれぞれの緩和時間分布−緩和時間のピークデータについて、単純緩和、並進運動、および拡散運動の3種類に対応して、緩和時間を相対移動させずに、または緩和時間を空間スケールの大きさに対して比例的に相対移動させ、あるいは緩和時間を空間スケールの大きさに対して二乗依存的に相対移動させて、各ピークデータのピーク位置を重ね合せて積算し、単純緩和、並進運動、および拡散運動を分別してピークデータを演算する。 The fractionation calculation means does not relatively move the relaxation time corresponding to three types of simple relaxation, translational motion, and diffusion motion for each relaxation time distribution-relaxation time peak data whose spatial scale has been changed, or Move the relaxation time proportionally relative to the size of the spatial scale, or move the relaxation time relative to the size of the spatial scale in a square-dependent manner and superimpose the peak positions of each peak data. Then, peak data is calculated by separating simple relaxation, translational motion, and diffusion motion.
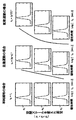
図6に示すように、空間スケールを変えながら測定した場合、単純緩和、並進運動、および拡散運動のそれぞれで横軸のずれ方が異なる。そこで、例えば並進運動を例として説明すると、図7に示すように横軸を空間スケールの大きさに対して比例的にずらすと並進運動の場合のみピーク位置を重ね合わせることができる。このようにピーク位置を重なった各データについて積算すると、並進運動のみ分別してピークを取り出すことができる。 As shown in FIG. 6, when the measurement is performed while changing the spatial scale, the horizontal axis is different in simple relaxation, translational motion, and diffusion motion. Accordingly, for example, translational motion will be described as an example. If the horizontal axis is proportionally shifted with respect to the size of the space scale as shown in FIG. 7, peak positions can be superimposed only in the case of translational motion. Thus, if it accumulate | stores about each data which overlapped the peak position, only a translation motion can be fractionated and a peak can be taken out.
単純緩和については、空間スケールを変更した各ピークデータの間で横軸をずらさずにピーク位置を重ね合わせることができ、これらの各ピークデータを積算すると、単純緩和のみ分別してピークを取り出すことができる。 For simple relaxation, the peak positions can be overlapped without shifting the horizontal axis between the peak data whose spatial scales have been changed, and when these peak data are integrated, the peaks can be extracted by separating only simple relaxation. it can.
拡散運動については、空間スケールを変更した各ピークデータの横軸を空間スケールの大きさに対して二乗依存的に、並進運動に比べてさらにずらすことでピーク位置を重ね合わせることができ、これらの各ピークデータを積算すると、拡散運動のみ分別してピークを取り出すことができる。 For the diffusion motion, the peak position can be superimposed by shifting the horizontal axis of each peak data whose spatial scale has been changed to a square dependence on the size of the spatial scale, and further shifting compared to the translational motion. When the peak data are integrated, the peak can be extracted by separating only the diffusion motion.
以上のようにして、緩和時間分布−緩和時間のピークデータを得ることができるとともに、ゲル試料内部の網目サイズの指標となる網目サイズ分布関数を導出でき、さらに、緩和データに含まれる単純緩和、並進運動、拡散運動の情報を専門家でなくとも容易に判別することができる。 As described above, relaxation time distribution-relaxation time peak data can be obtained, a network size distribution function serving as an index of the mesh size inside the gel sample can be derived, and further, simple relaxation included in the relaxation data, Information on translational movements and diffusional movements can be easily identified without being an expert.
図8(a)〜(c)は本発明の走査型顕微光散乱測定解析装置の別の実施形態の一部を概略的に示した図であり、(a)は静止した試料を試料ステージの上面に配置した例を示す正面図、(b)はカバー部材を配置した対物レンズの上面図、(c)は試料を流路に流して流速を与えながら測定を行う例を示す正面図である。 FIGS. 8A to 8C are diagrams schematically showing a part of another embodiment of the scanning microscopic light scattering measurement analyzer according to the present invention, and FIG. 8A shows a stationary sample on a sample stage. The front view which shows the example arrange | positioned on the upper surface, (b) is a top view of the objective lens which has arrange | positioned the cover member, (c) is a front view which shows the example which measures by flowing a sample through a flow path and giving a flow velocity. .
この実施形態の光散乱測定解析装置1は、測定装置を簡易に顕微鏡に組み込めるように構成されている。図8(a)に示すように、光散乱測定解析装置1は、試料5が上面14aに位置する試料ステージ14と、対物レンズ15と、対物レンズ15の上面15aに配置されたカバー部材16とを備えている。 The light scattering
試料ステージ14は、ゲル等の静止した試料5が上面14aに配置され、試料5が上面14aに位置する箇所に下方に貫通する開口部14bを有している。 The
対物レンズ15は、開口部14bの下方に配置され、図1の検出手段11に散乱光7を導入する光学系10の一部を構成する。 The
対物レンズ15の上面15aにはカバー部材16が配置されている。カバー部材16は、図8(a)、(b)に示すように、対物レンズ15の上面15aの周縁部近傍のうち一部を散乱光通過部17として開放し、それ以外の部分を覆うように配置されている。カバー部材16としては、例えば、ガラスやプラスチック製、金属製の不透明な円板の一部を透明にするかあるいは孔をあけて光が通過するようにしてあるのもの用いることができる。 A
また、散乱光通過部を可動式にすることによって、散乱角8を変更することができる。 Further, the
レーザ光源2からのレーザ光3を入射した試料5からの散乱光7は、開口部14bを通過して対物レンズ15の上面15aのうち散乱光通過部17のみから入射され、これによりレーザ光軸に対する散乱角8を規定することができる。 Scattered light 7 from the
対物レンズ15を通過した散乱光7は、光学系10を通じて図1の検出手段11に導入され、前述したようなデータ処理によりアンサンブル平均相関関数−相関時間の緩和データや緩和時間分布−緩和時間のピークデータが取得される。 The
なお、レーザ光3の試料5への入射は、図8(a)に示すような試料ステージ14の開口部14bの上方からの入射以外にも、開口部14bの斜め上方や横方向からの入射であってもよく、あるいは試料ステージ14の斜め下方からの入射であってもよい。また、対物レンズ15を通して下方からレーザ光3を入射させることも可能である。 The
また図8(c)に示すように、レーザ光3に対して透明な材料を用いたフローセル等の流路部材18を試料ステージ14の上面14aに配置することもできる。この場合、流動性の試料5を試料ステージ14の上面と平行に流し、試料5に流速を与えながら連続的な測定が可能となる。 Further, as shown in FIG. 8C, a
このように、従来の走査型顕微光散乱では散乱角8を変更するための装置構成として分光器の形態をとることが多く、微量な生体試料等を測定するのが困難な場合もあったが、対物レンズ15に入射する散乱光7をカバー部材16により選択することで、散乱角を容易に変更し顕微鏡に直接組み込むことができる。 As described above, the conventional scanning microscopic light scattering often takes the form of a spectroscope as an apparatus configuration for changing the
図9は本発明の走査型顕微光散乱測定解析装置の別の実施形態の一部を概略的に示した図である。 FIG. 9 is a diagram schematically showing a part of another embodiment of the scanning microscopic light scattering measurement analyzer of the present invention.
この実施形態の光散乱測定解析装置1も、測定装置を簡易に顕微鏡に組み込めるように構成されている。図9に示すように、光散乱測定解析装置1は、試料5の試料面5aに対向配置された対物レンズ15と、対物レンズ15の下面側の光学系10に配置され、レーザ光を入射した試料5からの散乱光7のレーザ光軸に対する散乱角8を規定する散乱光通過孔19aが設けられた散乱角選択フィルタ19とを備えている。 The light scattering
対物レンズ15は、ゲル等の静止した試料5の試料面5aに対向して配置され、散乱角選択フィルタ19、結像用レンズ20、結像面21と共に図1の検出手段11に散乱光7を導入する光学系10の一部を構成する。 The
対物レンズ15の下面側には散乱角選択フィルタ19が配置されている。散乱角選択フィルタ19は、不透明な金属板(例えば、反射を押さえるために黒色に塗られたもの)あるいはそれと同様の効果をもたらすガラス板、プラスチック板等をフィルタ素材として用いることができる。 A scattering
レーザ光源2からのレーザ光3を入射した試料5からの散乱光7は、対物レンズ15を通過して散乱角選択フィルタ19の散乱光通過孔19aのみから入射され、これによりレーザ光軸に対する散乱角8を規定することができる。そして散乱光通過孔19aの位置を変えることにより散乱角8を任意に変化させることができる。 Scattered light 7 from the
散乱角選択フィルタ19を通過した散乱光7は、光学系10を通じて図1の検出手段11に導入され、前述したようなデータ処理によりアンサンブル平均相関関数−相関時間の緩和データや緩和時間分布−緩和時間のピークデータが取得される。 The
なお、レーザ光3の試料5への入射は、試料5の上方からの入射以外にも、試料5の斜め上方や横方向からの入射であってもよく、あるいは試料5の斜め下方からの入射であってもよい。また、対物レンズ15を通して下方からレーザ光3を入射させることも可能である。 In addition to the incidence from the upper side of the
また、図8(c)の場合と同様に、レーザ光3に対して透明な材料を用いたフローセル等の流路部材18を用いて流動性の試料5に流速を与えながら連続的に測定することもできる。 Further, as in the case of FIG. 8C, continuous measurement is performed while applying a flow velocity to the
このように、従来の走査型顕微光散乱では散乱角8を変更するための装置構成として分光器の形態をとることが多く、微量な生体試料等を測定するのが困難な場合もあったが、対物レンズ15を通過した散乱光7の一部を散乱角選択フィルタ19により選択することで、散乱角を散乱光通過孔19aの位置により容易に変更し顕微鏡に直接組み込むことができる。 As described above, the conventional scanning microscopic light scattering often takes the form of a spectroscope as an apparatus configuration for changing the
以上に説明した各実施形態の走査型顕微光散乱測定解析装置1は、化学、材料、繊維、再生医療、医薬品等の産業分野での利用に加えて、医療機器や化学分析機器への組み込み、センサやアクチュエータへの応用も期待される。また、網目サイズ分布を定量的に調べることができれば、ゲル状試料の内部構造の定量的な評価や管理が可能になり、工場生産ラインにおける品質管理、劣化や耐久性、腐食性の評価等、様々な場面で利用することができる。また、近年開発が進んでいる高機能ゲルを利用した新規機能性材料や新規医薬品、ジェル状化粧品や機能性食品等の開発現場における新しい解析システム、商品開発を加速化させる重要なツールとして活用できる可能性もある。 The scanning microscopic light scattering
1 走査型顕微鏡光散乱測定解析装置
2、2a、2b レーザ光源
3 レーザ光
4 光学系
5 試料
5a 試料面
6 走査機構
7 散乱光
8 散乱角
9 散乱角調節機構
10 光学系
11 検出手段
12 信号処理部
13 コンピュータ
14 試料ステージ
14a 上面
14b 開口部
15 対物レンズ
15a 上面
16 カバー部材
17 散乱光通過部
18 流路部材
19 散乱角選択フィルタ
19a 散乱光通過孔
20 結像用レンズ
21 結像面DESCRIPTION OF
Claims (14)
試料をレーザ光源からのレーザ光軸に対して相対移動可能な走査機構と、
レーザ光源から試料に入射したレーザ光の散乱光を検出する検出手段と、
走査機構により走査した各試料位置での検出手段による散乱光の検出結果に基づいて時間平均相関関数−相関時間の緩和データを演算する時間平均相関関数演算手段と、
走査機構により走査した各試料位置における時間平均相関関数−相関時間の緩和データに基づいてアンサンブル平均相関関数−相関時間の緩和データを演算するアンサンブル平均相関関数演算手段とを備えた走査型顕微光散乱測定解析装置において、
時間平均相関関数−相関時間の緩和データについて、アンサンブル平均相関関数を演算する緩和データとして採用するか否かの閾値を異常な現象に起因する振幅の大きさに基づいて設定する閾値設定手段と、
走査機構により走査した各試料位置における時間平均相関関数−相関時間の緩和データについて、閾値設定手段により設定した閾値に基づいてアンサンブル平均相関関数を演算する緩和データとして採用するか否かを選別する緩和データ選別手段とを備えることを特徴とする走査型顕微光散乱測定解析装置。A laser light source for injecting laser light into the sample;
A scanning mechanism capable of moving the sample relative to the laser optical axis from the laser light source;
Detection means for detecting scattered light of the laser light incident on the sample from the laser light source;
A time average correlation function calculating means for calculating relaxation data of the time average correlation function-correlation time based on the detection result of the scattered light by the detection means at each sample position scanned by the scanning mechanism;
Scanning microscopic light scattering comprising: time average correlation function at each sample position scanned by the scanning mechanism-ensemble average correlation function-ensemble average correlation function calculation means for calculating correlation time relaxation data based on correlation time relaxation data In measurement analysis equipment,
About time average correlation function-correlation time relaxation data, a threshold setting means for setting a threshold as to whether or not to employ the ensemble average correlation function as relaxation data based on the magnitude of the amplitude caused by an abnormal phenomenon;
Relaxation for selecting whether or not to adopt time average correlation function-correlation time relaxation data at each sample position scanned by the scanning mechanism as relaxation data for calculating the ensemble average correlation function based on the threshold set by the threshold setting means A scanning microscopic light scattering measurement analysis apparatus comprising a data selection means.
走査型顕微光散乱測定解析装置は、緩和データ選別手段によりアンサンブル平均相関関数の演算に採用しないと決定された不採用緩和データ数の全体の緩和データ数に対する割合について許容範囲の上限値を設定する許容範囲設定手段と、
不採用緩和データ数の割合が許容範囲設定手段により設定された許容範囲を超える場合に閾値を初期値から変化分に応じて変更する閾値変更手段と、
閾値を変化分に応じて最終値まで変更しても不採用緩和データ数が許容範囲を超える場合にアンサンブル平均相関関数の演算を行わずにエラー信号を出力するエラー信号出力手段とを備えることを特徴とする請求項1または2に記載の走査型顕微光散乱測定解析装置。The threshold setting means sets an initial value, a change amount, and a final value of the threshold,
The scanning microscopic light scattering measurement / analysis apparatus sets an upper limit value of an allowable range for the ratio of the number of unadopted relaxation data determined not to be adopted in the calculation of the ensemble average correlation function by the relaxation data selection means to the total number of relaxation data Tolerance setting means;
A threshold value changing means for changing the threshold value from the initial value according to the amount of change when the ratio of the number of non-adopted mitigation data exceeds the allowable range set by the allowable range setting means;
Error signal output means for outputting an error signal without performing an ensemble average correlation function calculation when the number of non-adopted mitigation data exceeds the allowable range even if the threshold value is changed to the final value according to the change amount. The scanning microscopic light scattering measurement analyzer according to claim 1 or 2, characterized in that
走査機構により走査した各試料位置での散乱光の測定結果に基づいて算出したアンサンブル平均相関関数−相関時間の緩和データより、空間スケール変更手段により空間スケールを変更した緩和データごとに、逆ラプラス変換により緩和時間分布−緩和時間のピークデータを演算する緩和時間分布演算手段と、
空間スケールを変更したそれぞれの緩和時間分布−緩和時間のピークデータについて、単純緩和、並進運動、および拡散運動の3種類に対応して、緩和時間を相対移動させずに、または緩和時間を空間スケールの大きさに対して比例的に相対移動させ、あるいは緩和時間を空間スケールの大きさに対して二乗依存的に相対移動させて、各ピークデータのピーク位置を重ね合せて積算し、単純緩和、並進運動、および拡散運動を分別してピークデータを演算する分別演算手段とを備えることを特徴とする請求項1から3のいずれかに記載の走査型顕微光散乱測定解析装置。A spatial scale changing means capable of measuring the scattered light at each sample position scanned by the scanning mechanism by changing any spatial scale selected from the wavelength of the laser light and the scattering angle with respect to the laser optical axis;
From the ensemble average correlation function-correlation time relaxation data calculated based on the measurement results of scattered light at each sample position scanned by the scanning mechanism, inverse Laplace transform is performed for each relaxation data whose spatial scale is changed by the spatial scale changing means. Relaxation time distribution-relaxation time distribution calculating means for calculating peak data of relaxation time distribution-relaxation time,
Each relaxation time distribution with different spatial scales-Relaxation time peak data corresponding to three types of simple relaxation, translational motion, and diffusion motion, without relative movement of relaxation time or spatial scale of relaxation time Relatively move relative to the magnitude of, or move the relaxation time relative to the size of the space scale in a square-dependent manner, superimpose the peak positions of each peak data and integrate, 4. The scanning microscopic light scattering measurement and analysis apparatus according to claim 1, further comprising a classification calculation unit that calculates peak data by classifying translational movement and diffusion movement.
開口部の下方に配置され検出手段に散乱光を導入する光学系の一部を構成する対物レンズと、
対物レンズの上面に、対物レンズの上面の周縁部近傍のうち一部を散乱光通過部として開放しそれ以外の部分を覆うように配置され、レーザ光を入射した試料から開口部を通過した散乱光を対物レンズの上面のうち散乱光通過部のみから入射させることによりレーザ光軸に対する散乱角を規定するカバー部材とを備えることを特徴とする請求項1から6のいずれかに記載の走査型顕微光散乱測定解析装置。A sample stage having an opening where the sample is located on the upper surface;
An objective lens that forms a part of an optical system that is arranged below the opening and introduces scattered light to the detection means;
Scattering that is placed on the top surface of the objective lens so that a part of the vicinity of the peripheral edge of the top surface of the objective lens is opened as a scattered light passage and the other part is covered, and the sample that has entered the laser beam passes through the opening. The scanning type according to any one of claims 1 to 6, further comprising a cover member that defines a scattering angle with respect to a laser optical axis by allowing light to enter only from a scattered light passage portion of an upper surface of the objective lens. Microscopic light scattering measurement analyzer.
対物レンズの下面側の光学系に配置され、レーザ光を入射した試料からの散乱光のレーザ光軸に対する散乱角を規定する散乱光通過孔が設けられた散乱角選択フィルタとを備えることを特徴とする請求項1から6のいずれかに記載の走査型顕微光散乱測定解析装置。An objective lens disposed opposite the sample surface;
And a scattering angle selection filter provided in the optical system on the lower surface side of the objective lens and provided with a scattering light passage hole for defining a scattering angle with respect to the laser optical axis of the scattered light from the sample incident with the laser light. The scanning microscopic light scattering measurement analyzer according to any one of claims 1 to 6.
走査した各試料位置での散乱光の検出結果に基づいて得られる時間平均相関関数−相関時間の緩和データについて、アンサンブル平均相関関数を演算する緩和データとして採用するか否かの閾値を異常な現象に起因する振幅の大きさに基づいて設定する工程と、
走査した各試料位置での散乱光の検出結果に基づいて、各試料位置における時間平均相関関数−相関時間の緩和データを演算する工程と、
走査した各試料位置における時間平均相関関数−相関時間の緩和データについて、設定した閾値に基づいてアンサンブル平均相関関数を演算する緩和データとして採用するか否かを選別する工程と、
設定した閾値に基づいてアンサンブル平均相関関数を演算する緩和データとして選別した緩和データ群に基づいてアンサンブル平均相関関数−相関時間の緩和データを演算する工程とを含むことを特徴とする光散乱解析方法。In a light scattering analysis method by scanning microscopic light scattering in which laser light is incident on a sample from a laser light source, the sample is moved relative to the laser optical axis, and the scattered light from each sample position is detected.
Abnormal phenomenon that the threshold of whether or not to adopt the ensemble average correlation function as the relaxation data for the time average correlation function-correlation time relaxation data obtained based on the detection result of scattered light at each scanned sample position Setting based on the magnitude of the amplitude caused by
Calculating a time-average correlation function-correlation time relaxation data at each sample position based on the detection result of the scattered light at each scanned sample position;
A step of selecting whether or not to adopt as the relaxation data for calculating the ensemble average correlation function based on the set threshold for the time average correlation function-correlation time relaxation data at each scanned sample position;
An ensemble average correlation function based on a relaxation data group selected as relaxation data for calculating an ensemble average correlation function based on a set threshold, and a step of calculating correlation time relaxation data. .
閾値に基づいてアンサンブル平均相関関数の演算に採用しないと決定された不採用緩和データ数の全体の緩和データ数に対する割合について許容範囲の上限値を設定する工程と、
走査した各試料位置における時間平均相関関数−相関時間の緩和データを演算した結果、不採用緩和データ数の割合が設定された許容範囲を超える場合に閾値を初期値から変化分に応じて変更する工程と、
閾値を変化分に応じて最終値まで変更しても不採用緩和データ数が許容範囲を超える場合にアンサンブル平均相関関数の演算を行わずにエラー信号を出力する工程とを含むことを特徴とする請求項9または10に記載の光散乱解析方法。Setting an initial value, a change amount, and a final value of the threshold;
A step of setting an upper limit value of an allowable range for a ratio of the number of non-adopted mitigation data determined not to be adopted in the calculation of the ensemble average correlation function based on a threshold to the total mitigation data number;
As a result of calculating relaxation data of time average correlation function-correlation time at each scanned sample position, the threshold value is changed from the initial value according to the change when the ratio of the number of non-adopted relaxation data exceeds the set allowable range Process,
A step of outputting an error signal without calculating the ensemble average correlation function when the number of non-adopted mitigation data exceeds the allowable range even if the threshold value is changed to the final value according to the amount of change. The light scattering analysis method according to claim 9 or 10.
走査した各試料位置での散乱光の測定結果に基づいて算出したアンサンブル平均相関関数−相関時間の緩和データより、空間スケール変更手段により空間スケールを変更した緩和データごとに、逆ラプラス変換により緩和時間分布−緩和時間のピークデータを演算する工程と、
空間スケールを変更したそれぞれの緩和時間分布−緩和時間のピークデータについて、単純緩和、並進運動、および拡散運動の3種類に対応して、緩和時間を相対移動させずに、または緩和時間を空間スケールの大きさに対して比例的に相対移動させ、あるいは緩和時間を空間スケールの大きさに対して二乗依存的に相対移動させて、各ピークデータのピーク位置を重ね合せて積算し、単純緩和、並進運動、および拡散運動を分別してピークデータを演算する工程とを含むことを特徴とする請求項9〜11のいずれかに記載の光散乱解析方法。Measuring the scattered light at each scanned sample position by changing the spatial scale selected from the wavelength of the laser light and the scattering angle with respect to the laser optical axis;
Based on the relaxation data of the ensemble average correlation function-correlation time calculated based on the measurement result of the scattered light at each scanned sample position, the relaxation time is calculated by inverse Laplace transform for each relaxation data whose spatial scale is changed by the spatial scale changing means. A step of calculating peak data of distribution-relaxation time;
Each relaxation time distribution with different spatial scales-Relaxation time peak data corresponding to three types of simple relaxation, translational motion, and diffusion motion, without relative movement of relaxation time or spatial scale of relaxation time Relatively move relative to the magnitude of, or move the relaxation time relative to the size of the space scale in a square-dependent manner, superimpose the peak positions of each peak data and integrate, The light scattering analysis method according to claim 9, further comprising a step of calculating peak data by separating translational motion and diffusion motion.
Priority Applications (1)
| Application Number | Priority Date | Filing Date | Title |
|---|---|---|---|
| JP2011083131A JP5883233B2 (en) | 2011-03-16 | 2011-03-16 | Scanning microscopic light scattering measurement and analysis apparatus and light scattering analysis method |
Applications Claiming Priority (1)
| Application Number | Priority Date | Filing Date | Title |
|---|---|---|---|
| JP2011083131A JP5883233B2 (en) | 2011-03-16 | 2011-03-16 | Scanning microscopic light scattering measurement and analysis apparatus and light scattering analysis method |
Publications (2)
| Publication Number | Publication Date |
|---|---|
| JP2012194165A true JP2012194165A (en) | 2012-10-11 |
| JP5883233B2 JP5883233B2 (en) | 2016-03-09 |
Family
ID=47086186
Family Applications (1)
| Application Number | Title | Priority Date | Filing Date |
|---|---|---|---|
| JP2011083131A Expired - Fee Related JP5883233B2 (en) | 2011-03-16 | 2011-03-16 | Scanning microscopic light scattering measurement and analysis apparatus and light scattering analysis method |
Country Status (1)
| Country | Link |
|---|---|
| JP (1) | JP5883233B2 (en) |
Cited By (5)
| Publication number | Priority date | Publication date | Assignee | Title |
|---|---|---|---|---|
| JP2016133435A (en) * | 2015-01-20 | 2016-07-25 | 株式会社リコー | Optical apparatus and information processing system |
| JP2016176724A (en) * | 2015-03-18 | 2016-10-06 | 株式会社リコー | Information processing system |
| JP2017096933A (en) * | 2015-11-13 | 2017-06-01 | 株式会社堀場製作所 | Sample analyzer and sample analysis program |
| JP2018004492A (en) * | 2016-07-04 | 2018-01-11 | 株式会社リコー | Information processing system and information processing method |
| JP2018515787A (en) * | 2015-03-06 | 2018-06-14 | フラウンホーファー−ゲゼルシャフト ツル フェルデルング デル アンゲヴァンテン フォルシュング エー ファウFraunhofer−Gesellschaft zur Foerderung der angewandten Forschung e.V. | Method and apparatus for optically detecting motion in a biological sample having spatial extent |
Citations (5)
| Publication number | Priority date | Publication date | Assignee | Title |
|---|---|---|---|---|
| JPH10120795A (en) * | 1996-10-17 | 1998-05-12 | Tosoh Corp | Method and apparatus for measuring the degree of gelation of polyvinyl chloride |
| JP2000214086A (en) * | 1999-01-25 | 2000-08-04 | Otsuka Denshi Co Ltd | How to observe the gelation process or gel state |
| JP2006071497A (en) * | 2004-09-02 | 2006-03-16 | Hokkaido Univ | Light scattering device, light scattering measurement method, light scattering analysis device, and light scattering measurement analysis method |
| JP2008039539A (en) * | 2006-08-04 | 2008-02-21 | Shimadzu Corp | Light scattering detector |
| JP2009011927A (en) * | 2007-07-04 | 2009-01-22 | Tokyo Institute Of Technology | Ultrafiltration membrane, method for producing the same, and method for size separation of nanoparticles |
-
2011
- 2011-03-16 JP JP2011083131A patent/JP5883233B2/en not_active Expired - Fee Related
Patent Citations (5)
| Publication number | Priority date | Publication date | Assignee | Title |
|---|---|---|---|---|
| JPH10120795A (en) * | 1996-10-17 | 1998-05-12 | Tosoh Corp | Method and apparatus for measuring the degree of gelation of polyvinyl chloride |
| JP2000214086A (en) * | 1999-01-25 | 2000-08-04 | Otsuka Denshi Co Ltd | How to observe the gelation process or gel state |
| JP2006071497A (en) * | 2004-09-02 | 2006-03-16 | Hokkaido Univ | Light scattering device, light scattering measurement method, light scattering analysis device, and light scattering measurement analysis method |
| JP2008039539A (en) * | 2006-08-04 | 2008-02-21 | Shimadzu Corp | Light scattering detector |
| JP2009011927A (en) * | 2007-07-04 | 2009-01-22 | Tokyo Institute Of Technology | Ultrafiltration membrane, method for producing the same, and method for size separation of nanoparticles |
Non-Patent Citations (1)
| Title |
|---|
| 古川英光,外: "走査顕微光散乱(スマイルズ)によるゲルの網目構造解析システムの実用化", 高分子学会予稿集, vol. 59巻2号, JPN6014047418, 1 September 2010 (2010-09-01), pages 4329 - 4330, ISSN: 0003236158 * |
Cited By (6)
| Publication number | Priority date | Publication date | Assignee | Title |
|---|---|---|---|---|
| JP2016133435A (en) * | 2015-01-20 | 2016-07-25 | 株式会社リコー | Optical apparatus and information processing system |
| JP2018515787A (en) * | 2015-03-06 | 2018-06-14 | フラウンホーファー−ゲゼルシャフト ツル フェルデルング デル アンゲヴァンテン フォルシュング エー ファウFraunhofer−Gesellschaft zur Foerderung der angewandten Forschung e.V. | Method and apparatus for optically detecting motion in a biological sample having spatial extent |
| JP2016176724A (en) * | 2015-03-18 | 2016-10-06 | 株式会社リコー | Information processing system |
| JP2017096933A (en) * | 2015-11-13 | 2017-06-01 | 株式会社堀場製作所 | Sample analyzer and sample analysis program |
| US10690593B2 (en) | 2015-11-13 | 2020-06-23 | Horiba, Ltd. | Sample analyzer and recording medium recording sample analysis program |
| JP2018004492A (en) * | 2016-07-04 | 2018-01-11 | 株式会社リコー | Information processing system and information processing method |
Also Published As
| Publication number | Publication date |
|---|---|
| JP5883233B2 (en) | 2016-03-09 |
Similar Documents
| Publication | Publication Date | Title |
|---|---|---|
| Nawaz et al. | Cell visco-elasticity measured with AFM and optical trapping at sub-micrometer deformations | |
| Lei et al. | High-throughput imaging flow cytometry by optofluidic time-stretch microscopy | |
| Giavazzi et al. | Digital Fourier microscopy for soft matter dynamics | |
| Wang et al. | Holographic characterization of protein aggregates | |
| Kim et al. | Profiling individual human red blood cells using common-path diffraction optical tomography | |
| US20110090500A1 (en) | Flow cytometer apparatus for three dimensional difraction imaging and related methods | |
| JP5883233B2 (en) | Scanning microscopic light scattering measurement and analysis apparatus and light scattering analysis method | |
| JP4517145B2 (en) | Light scattering device, light scattering measurement method, light scattering analysis device, and light scattering measurement analysis method | |
| CN104568857B (en) | A kind of two-dimentional light scattering quiescence cells instrument method and device | |
| JP6858795B2 (en) | Evaluation of particle characteristics in open optical resonance cavities | |
| Cheong et al. | Holographic characterization of colloidal particles in turbid media | |
| US11193877B2 (en) | Method for the characterization of objects by means of scattered radiation analysis and related instrumentations | |
| Nepomniashchaia et al. | Use of laser correlation spectroscopy to investigate the parameters of biological suspensions | |
| Berard et al. | Precision platform for convex lens-induced confinement microscopy | |
| Lee et al. | Fast dynamics and relaxation of colloidal drops during the drying process using multispeckle diffusing wave spectroscopy | |
| Liu et al. | Remote imaging of single cell 3D morphology with ultrafast coherent phonons and their resonance harmonics | |
| Blattler et al. | A novel method for 3d nanoscale tracking of 100 nm polystyrene particles in multi-wavelength evanescent fields microscopy–absolute difference height verification– | |
| Bolognesi et al. | Digital holographic tracking of microprobes for multipoint viscosity measurements | |
| Hajjarian et al. | Evaluating platelet aggregation dynamics from laser speckle fluctuations | |
| Aristov et al. | Use of lying drop photometry for clinical laboratory diagnostics | |
| Yang et al. | Study of constrained Brownian motion of nanoparticles near an interface using optical tweezers | |
| Yue et al. | Easy method to determine refractive indices of microspheres and in micro-regions of inhomogeneous media | |
| N'guessan et al. | Characterization of red blood cells infected by Plasmodium falciparum using optical tweezers | |
| ES3040458T3 (en) | Device and method for detecting and identifying extracellular vesicles in a liquid dispersion sample | |
| EP4660608A1 (en) | Optical measurement system and computer program |
Legal Events
| Date | Code | Title | Description |
|---|---|---|---|
| A621 | Written request for application examination |
Free format text: JAPANESE INTERMEDIATE CODE: A621 Effective date: 20140228 |
|
| A977 | Report on retrieval |
Free format text: JAPANESE INTERMEDIATE CODE: A971007 Effective date: 20141031 |
|
| A131 | Notification of reasons for refusal |
Free format text: JAPANESE INTERMEDIATE CODE: A131 Effective date: 20141111 |
|
| A131 | Notification of reasons for refusal |
Free format text: JAPANESE INTERMEDIATE CODE: A131 Effective date: 20150616 |
|
| TRDD | Decision of grant or rejection written | ||
| A01 | Written decision to grant a patent or to grant a registration (utility model) |
Free format text: JAPANESE INTERMEDIATE CODE: A01 Effective date: 20160119 |
|
| A61 | First payment of annual fees (during grant procedure) |
Free format text: JAPANESE INTERMEDIATE CODE: A61 Effective date: 20160205 |
|
| R150 | Certificate of patent or registration of utility model |
Ref document number: 5883233 Country of ref document: JP Free format text: JAPANESE INTERMEDIATE CODE: R150 |
|
| LAPS | Cancellation because of no payment of annual fees |