JPWO2020162425A1 - Analyst, analysis method, and program - Google Patents
Analyst, analysis method, and program Download PDFInfo
- Publication number
- JPWO2020162425A1 JPWO2020162425A1 JP2020571198A JP2020571198A JPWO2020162425A1 JP WO2020162425 A1 JPWO2020162425 A1 JP WO2020162425A1 JP 2020571198 A JP2020571198 A JP 2020571198A JP 2020571198 A JP2020571198 A JP 2020571198A JP WO2020162425 A1 JPWO2020162425 A1 JP WO2020162425A1
- Authority
- JP
- Japan
- Prior art keywords
- discriminator
- production equipment
- analysis
- data
- vibration
- Prior art date
- Legal status (The legal status is an assumption and is not a legal conclusion. Google has not performed a legal analysis and makes no representation as to the accuracy of the status listed.)
- Granted
Links
Images


Classifications
-
- G—PHYSICS
- G01—MEASURING; TESTING
- G01H—MEASUREMENT OF MECHANICAL VIBRATIONS OR ULTRASONIC, SONIC OR INFRASONIC WAVES
- G01H1/00—Measuring characteristics of vibrations in solids by using direct conduction to the detector
- G01H1/12—Measuring characteristics of vibrations in solids by using direct conduction to the detector of longitudinal or not specified vibrations
-
- G—PHYSICS
- G01—MEASURING; TESTING
- G01H—MEASUREMENT OF MECHANICAL VIBRATIONS OR ULTRASONIC, SONIC OR INFRASONIC WAVES
- G01H17/00—Measuring mechanical vibrations or ultrasonic, sonic or infrasonic waves, not provided for in the other groups of this subclass
-
- G—PHYSICS
- G01—MEASURING; TESTING
- G01M—TESTING STATIC OR DYNAMIC BALANCE OF MACHINES OR STRUCTURES; TESTING OF STRUCTURES OR APPARATUS, NOT OTHERWISE PROVIDED FOR
- G01M99/00—Subject matter not provided for in other groups of this subclass
-
- G—PHYSICS
- G06—COMPUTING OR CALCULATING; COUNTING
- G06N—COMPUTING ARRANGEMENTS BASED ON SPECIFIC COMPUTATIONAL MODELS
- G06N20/00—Machine learning
-
- G—PHYSICS
- G06—COMPUTING OR CALCULATING; COUNTING
- G06T—IMAGE DATA PROCESSING OR GENERATION, IN GENERAL
- G06T7/00—Image analysis
- G06T7/20—Analysis of motion
Landscapes
- Engineering & Computer Science (AREA)
- Physics & Mathematics (AREA)
- General Physics & Mathematics (AREA)
- Theoretical Computer Science (AREA)
- Computer Vision & Pattern Recognition (AREA)
- Software Systems (AREA)
- Data Mining & Analysis (AREA)
- Evolutionary Computation (AREA)
- Medical Informatics (AREA)
- Computing Systems (AREA)
- General Engineering & Computer Science (AREA)
- Mathematical Physics (AREA)
- Artificial Intelligence (AREA)
- Multimedia (AREA)
- Measurement Of Mechanical Vibrations Or Ultrasonic Waves (AREA)
- Testing Of Devices, Machine Parts, Or Other Structures Thereof (AREA)
Abstract
解析装置(100)は、生産設備(10)に設けられた振動センサの検出結果を画像化する画像処理部(102)と、画像化したデータを機械学習処理の対象にして判別器(110)を生成する生成部(104)と、判別器(110)を用いて生産設備(10)の状態解析処理を行う解析部(106)と、を備える。 The analysis device (100) includes an image processing unit (102) that images the detection result of the vibration sensor provided in the production facility (10), and a discriminator (110) that targets the imaged data for machine learning processing. It is provided with a generation unit (104) for generating the above and an analysis unit (106) for performing a state analysis process of the production equipment (10) using the discriminator (110).
Description
本発明は、解析装置、解析方法、およびプログラムに関し、特に、設備の状態を監視するセンサのデータを解析する解析装置、解析方法、およびプログラム関する。 The present invention relates to an analysis device, an analysis method, and a program, and more particularly to an analysis device, an analysis method, and a program for analyzing data of a sensor that monitors the state of equipment.
機械系設備を用いた生産材の製造品質管理に振動や音響センサを用いて状態監視する方法がある。例えば、生産材の加工時に加工機で生じた振動データを取得し、異常振動を捉えたときに生産材の加工をストップすることにより製造ロスを回避することや、生産設備の稼働状況を振動にて監視し、メンテナンスの効率化や、設備を長寿命化するための最適な稼働条件を見出すことなどにより、製造業の生産効率を向上させる技術として注目されている。 There is a method of condition monitoring using vibration and acoustic sensors for manufacturing quality control of production materials using mechanical equipment. For example, it is possible to avoid manufacturing loss by acquiring vibration data generated by the processing machine during processing of production materials and stopping processing of production materials when abnormal vibration is detected, and to change the operating status of production equipment to vibration. It is attracting attention as a technology for improving the production efficiency of the manufacturing industry by monitoring and finding the optimum operating conditions for improving the efficiency of maintenance and extending the life of equipment.
特許文献1には、監視対象の設備にセンサを取り付け、当該センサが測定した時系列データに基づきその設備の監視を行う方法が開示されている。 Patent Document 1 discloses a method in which a sensor is attached to a device to be monitored and the device is monitored based on the time-series data measured by the sensor.
上述した特許文献1に記載されたシステムのように、センサで収集したデータに基づき設備の異常等を検出しようとすると、解析すべきデータの量が多くなり得る。また、ディープラーニングなどの機械学習により正常/異常状態モデルを構築することも考えられるが、この方法では、あくまで異常と推察される状態を抽出させるだけに留まり、稼働を停止するなどのアクションにしか適用できない。 As in the system described in Patent Document 1 described above, if an attempt is made to detect an abnormality in equipment based on data collected by a sensor, the amount of data to be analyzed may increase. It is also possible to build a normal / abnormal state model by machine learning such as deep learning, but this method only extracts the state that is presumed to be abnormal, and only takes actions such as stopping the operation. Not applicable.
本発明は上記事情に鑑みてなされたものであり、その目的とするところは、生産設備の状態監視を効率よく高精度に行う技術を提供することにある。 The present invention has been made in view of the above circumstances, and an object of the present invention is to provide a technique for efficiently and accurately monitoring the state of production equipment.
本発明の各側面では、上述した課題を解決するために、それぞれ以下の構成を採用する。 In each aspect of the present invention, the following configurations are adopted in order to solve the above-mentioned problems.
第一の側面は、解析装置に関する。
第一の側面に係る第1の解析装置は、
生産設備に設けられた振動センサの検出結果を画像化する画像処理手段と、
前記画像化したデータを機械学習処理の対象にして判別器を生成する生成手段と、
前記判別器を用いて前記生産設備の状態解析処理を行う解析手段と、を有する。
第一の側面に係る第2の解析装置は、
生産設備に設けられた振動センサの検出結果に基づいて当該生産設備の異常判定処理を第1の判別器を用いて行う判定手段と、
前記第1の判別器により正常か異常かの判別ができなかった前記検出結果を画像化する画像処理手段と、
前記画像化したデータを機械学習処理の対象として第2の判別器を生成する生成手段と、
前記第2の判別器を用いて前記生産設備の状態解析処理を行う解析手段と、を有する。The first aspect relates to an analyzer.
The first analysis device according to the first aspect is
Image processing means for imaging the detection results of vibration sensors installed in production equipment,
A generation means for generating a discriminator by using the imaged data as a target of machine learning processing,
It has an analysis means for performing a state analysis process of the production equipment using the discriminator.
The second analysis device according to the first aspect is
Judgment means for performing abnormality determination processing of the production equipment using the first discriminator based on the detection result of the vibration sensor provided in the production equipment, and
An image processing means for imaging the detection result that could not be discriminated as normal or abnormal by the first discriminator, and
A generation means for generating a second discriminator using the imaged data as a target of machine learning processing,
It has an analysis means for performing a state analysis process of the production equipment using the second discriminator.
第二の側面は、少なくとも1つのコンピュータにより実行される解析方法に関する。
第二の側面に係る第1の解析方法は、
解析装置が、
生産設備に設けられた振動センサの検出結果を画像化し、
前記画像化したデータを機械学習処理の対象にして判別器を生成し、
前記判別器を用いて前記生産設備の状態解析処理を行う、ことを含む。
第二の側面に係る第2の解析方法は、
解析装置が、
生産設備に設けられた振動センサの検出結果に基づいて当該生産設備の異常判定処理を第1の判別器を用いて行い、
前記第1の判別器により正常か異常かの判別ができなかった前記検出結果を画像化し、
前記画像化したデータを機械学習処理の対象として第2の判別器を生成し、
前記第2の判別器を用いて前記生産設備の状態解析処理を行う、ことを含む。The second aspect relates to an analysis method performed by at least one computer.
The first analysis method according to the second aspect is
The analyzer is
The detection result of the vibration sensor installed in the production equipment is visualized and
A discriminator is generated by using the imaged data as a target of machine learning processing.
It includes performing a state analysis process of the production equipment using the discriminator.
The second analysis method according to the second aspect is
The analyzer is
Based on the detection result of the vibration sensor installed in the production equipment, the abnormality determination process of the production equipment is performed using the first discriminator.
The detection result that could not be discriminated as normal or abnormal by the first discriminator was imaged and imaged.
A second discriminator is generated by using the imaged data as a target of machine learning processing.
It includes performing a state analysis process of the production equipment using the second discriminator.
なお、本発明の他の側面としては、上記第二の側面の方法を少なくとも1つのコンピュータに実行させるプログラムであってもよいし、このようなプログラムを記録したコンピュータが読み取り可能な記録媒体であってもよい。この記録媒体は、非一時的な有形の媒体を含む。
このコンピュータプログラムは、コンピュータにより実行されたとき、コンピュータに、解析装置上で、その解析方法を実施させるコンピュータプログラムコードを含む。As another aspect of the present invention, it may be a program that causes at least one computer to execute the method of the second aspect, or it is a recording medium that can be read by a computer that records such a program. You may. This recording medium includes a non-temporary tangible medium.
This computer program contains computer program code that causes the computer to perform its analysis method on an analyzer when executed by the computer.
なお、以上の構成要素の任意の組合せ、本発明の表現を方法、装置、システム、記録媒体、コンピュータプログラムなどの間で変換したものもまた、本発明の態様として有効である。 It should be noted that any combination of the above components and the conversion of the expression of the present invention between methods, devices, systems, recording media, computer programs and the like are also effective as aspects of the present invention.
また、本発明の各種の構成要素は、必ずしも個々に独立した存在である必要はなく、複数の構成要素が一個の部材として形成されていること、一つの構成要素が複数の部材で形成されていること、ある構成要素が他の構成要素の一部であること、ある構成要素の一部と他の構成要素の一部とが重複していること、等でもよい。 Further, the various components of the present invention do not necessarily have to be individually independent, and a plurality of components are formed as one member, and one component is formed of a plurality of members. It may be that a certain component is a part of another component, a part of a certain component overlaps with a part of another component, and the like.
また、本発明の方法およびコンピュータプログラムには複数の手順を順番に記載してあるが、その記載の順番は複数の手順を実行する順番を限定するものではない。このため、本発明の方法およびコンピュータプログラムを実施するときには、その複数の手順の順番は内容的に支障のない範囲で変更することができる。 Further, although the method and the computer program of the present invention describe a plurality of procedures in order, the order of description does not limit the order in which the plurality of procedures are executed. Therefore, when implementing the method and computer program of the present invention, the order of the plurality of procedures can be changed within a range that does not hinder the contents.
さらに、本発明の方法およびコンピュータプログラムの複数の手順は個々に相違するタイミングで実行されることに限定されない。このため、ある手順の実行中に他の手順が発生すること、ある手順の実行タイミングと他の手順の実行タイミングとの一部ないし全部が重複していること、等でもよい。 Furthermore, the methods of the present invention and the plurality of procedures of a computer program are not limited to being executed at different timings. Therefore, another procedure may occur during the execution of a certain procedure, a part or all of the execution timing of the certain procedure and the execution timing of the other procedure may overlap, and the like.
上記各側面によれば、生産設備の状態監視を効率よく高精度に行う技術を提供することができる。 According to each of the above aspects, it is possible to provide a technique for efficiently and accurately monitoring the state of production equipment.
上述した目的、およびその他の目的、特徴および利点は、以下に述べる好適な実施の形態、およびそれに付随する以下の図面によってさらに明らかになる。 The above-mentioned objectives and other objectives, features and advantages are further clarified by the preferred embodiments described below and the accompanying drawings below.
以下、本発明の実施の形態について、図面を用いて説明する。尚、すべての図面において、同様な構成要素には同様の符号を付し、適宜説明を省略する。 Hereinafter, embodiments of the present invention will be described with reference to the drawings. In all drawings, similar components are designated by the same reference numerals, and the description thereof will be omitted as appropriate.
(第1の実施の形態)
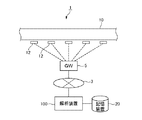
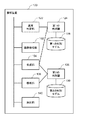
図1は、本発明の実施の形態に係る解析装置を用いた設備監視システム1のシステム構成を概念的に示す図である。
設備監視システム1が監視対象とする設備は、生産設備10であり、本実施形態では、ベルトコンベアを例として説明する。図の例では、ベルトコンベアを監視するための複数のセンサ12がベルトコンベアの移動方向に沿って複数箇所に設置されている。各センサ12は、例えば、振動センサである。また、一方向の振動を検知する振動センサの場合、複数方向の振動を検出するために1箇所につき複数の振動センサを設置してもよい。(First Embodiment)
FIG. 1 is a diagram conceptually showing a system configuration of an equipment monitoring system 1 using an analysis device according to an embodiment of the present invention.
The equipment to be monitored by the equipment monitoring system 1 is the
振動センサから出力される測定データは、振動波形を示す時系列データである。
振動センサは、監視対象の生産設備10に生じた振動を測定する。振動センサは、一軸方向の加速度を測定する一軸加速度センサであってもよいし、三軸方向の加速度を測定する三軸加速度センサであってもよいし、その他であってもよい。なお、複数の振動センサは、同種の振動センサであってもよいし、複数種類の振動センサが混在してもよい。The measurement data output from the vibration sensor is time series data showing the vibration waveform.
The vibration sensor measures the vibration generated in the
解析装置100は、ネットワーク3を介してGW(GateWay)5と接続され、生産設備10に複数設けられているセンサ12から検出結果を受信する。解析装置100は、記憶装置20に接続される。記憶装置20は、解析装置100が解析する振動データが格納される。記憶装置20は、解析装置100とは別体の装置であってもよいし、解析装置100の内部に含まれる装置であってもよいし、これらの組み合わせであってもよい。
The
実施形態の各図において、本発明の本質に関わらない部分の構成については省略してあり、図示されていない。 In each figure of the embodiment, the configuration of the portion not related to the essence of the present invention is omitted and is not shown.
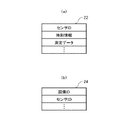
図2は、本実施形態の記憶装置20が記憶する振動データ22と設備情報24のデータ構造の一例を示す図である。
振動データ22は、振動センサを識別するセンサID毎に、時刻情報と、測定データとが紐付けられている。設備情報24は、設備を識別する設備ID毎に、少なくとも一つの振動センサのセンサIDが紐付けられている。FIG. 2 is a diagram showing an example of the data structure of the
In the
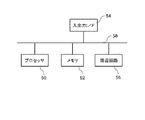
図3は、本実施形態の各装置のハードウェア構成を例示するブロック図である。各装置は、プロセッサ50、メモリ52、入出力インターフェイス(I/F)54、周辺回路56、バス58を有する。周辺回路56には、様々なモジュールが含まれる。処理装置は周辺回路56を有さなくてもよい。
FIG. 3 is a block diagram illustrating a hardware configuration of each device of the present embodiment. Each device has a
バス58は、プロセッサ50、メモリ52、周辺回路56及び入出力インターフェイス54が相互にデータを伝送するためのデータ伝送路である。プロセッサ50は、例えばCPU(Central Processing Unit)、GPU(Graphics Processing Unit)などの演算処理装置である。メモリ52、例えばRAM(Random Access Memory)やROM(Read Only Memory)などのメモリである。入出力インターフェイス54は、入力装置、外部装置、外部サーバ、センサ等から情報を取得するためのインターフェイスや、出力装置、外部装置、外部サーバ等に情報を出力するためのインターフェイスなどを含む。入力装置は、例えばキーボード、マウス、マイク等である。出力装置は、例えばディスプレイ、スピーカ、プリンタ、メーラ等である。プロセッサ50は、各モジュールに指令を出し、それらの演算結果をもとに演算を行うことができる。
The
後述する図4の本実施形態の解析装置100の各構成要素は、図3に示すコンピュータのハードウェアとソフトウェアの任意の組合せによって実現される。そして、その実現方法、装置にはいろいろな変形例があることは、当業者には理解されるところである。以下説明する各実施形態の解析装置を示す機能ブロック図は、ハードウェア単位の構成ではなく、論理的な機能単位のブロックを示している。
Each component of the
プロセッサ50が、プログラムをメモリ52に読み出して実行することにより、図4の解析装置100の各ユニットの各機能を実現することができる。
The
本実施形態のコンピュータプログラムは、解析装置100を実現させるためのコンピュータ(図3のプロセッサ50)に、生産設備10に設けられた振動センサ12の検出結果を画像化する手順、画像化したデータを機械学習処理の対象にして判別器を生成する手順、判別器を用いて生産設備10の異常判定処理を行う手順、を実行させるように記述されている。
In the computer program of the present embodiment, a procedure for imaging the detection result of the
本実施形態のコンピュータプログラムは、コンピュータで読み取り可能な記録媒体に記録されてもよい。記録媒体は特に限定されず、様々な形態のものが考えられる。また、プログラムは、記録媒体からコンピュータのメモリ52(図3)にロードされてもよいし、ネットワークを通じてコンピュータにダウンロードされ、メモリ52にロードされてもよい。
The computer program of this embodiment may be recorded on a computer-readable recording medium. The recording medium is not particularly limited, and various forms can be considered. Further, the program may be loaded from the recording medium into the
コンピュータプログラムを記録する記録媒体は、非一時的な有形のコンピュータが使用可能な媒体を含み、その媒体に、コンピュータが読み取り可能なプログラムコードが埋め込まれる。コンピュータプログラムが、コンピュータ上で実行されたとき、コンピュータに、解析装置100を実現する本実施形態の解析方法を実行させる。
A recording medium for recording a computer program includes a medium that can be used by a non-temporary tangible computer, and a computer-readable program code is embedded in the medium. When the computer program is executed on the computer, the computer is made to execute the analysis method of the present embodiment that realizes the
図4は、本実施形態の解析装置100の論理的な構成を示す機能ブロック図である。解析装置100は、画像処理部102と、生成部104と、解析部106と、を備える。
画像処理部102は、生産設備10に設けられた振動センサの検出結果を画像化する。生成部104は、画像化したデータを機械学習処理の対象にして判別器110を生成する。解析部106は、判別器110を用いて生産設備10の状態解析処理を行う。FIG. 4 is a functional block diagram showing a logical configuration of the
The
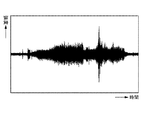
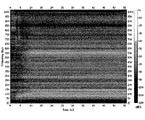
振動は、振幅、周波数、および位相の3つの要素からなり、測定データは、変位、速度、および加速度の3つのパラメータで示すことができる。振動センサの測定データは、複数のパラメータで示される複数の振動波形を含む時系列データであるため、そのまま機械学習にかけても特徴を捉えられず、適切な学習モデルを生成することができない。そこで、本実施形態では、画像処理部102により測定データを画像化する。図5は画像化前の測定データの時系列データを示す図である。図6は、画像処理部102により画像化した画像データを示す図である。
Vibration consists of three components: amplitude, frequency, and phase, and measurement data can be presented with three parameters: displacement, velocity, and acceleration. Since the measurement data of the vibration sensor is time-series data including a plurality of vibration waveforms indicated by a plurality of parameters, the characteristics cannot be captured even if the machine learning is applied as it is, and an appropriate learning model cannot be generated. Therefore, in the present embodiment, the measurement data is imaged by the
画像処理部102は、生産設備10のセンサ12の検出結果(以下、振動データとも呼ぶ)を取得する。そして、画像処理部102は、取得した振動データをFFT処理してから周波数分割し、そして、得られた振動スペクトラムデータを画像化して画像データを得る。これらの処理により、データ容量を圧縮することができ、機械学習処理および判別処理を高速化することができる。
The
実施形態において「取得」とは、自装置が他の装置や記憶媒体に格納されているデータまたは情報を取りに行くこと(能動的な取得)、および、自装置に他の装置から出力されるデータまたは情報を入力すること(受動的な取得)の少なくとも一方を含む。能動的な取得の例は、他の装置にリクエストまたは問い合わせしてその返信を受信すること、及び、他の装置や記憶媒体にアクセスして読み出すこと等がある。また、受動的な取得の例は、配信(または、送信、プッシュ通知等)される情報を受信すること等がある。さらに、「取得」とは、受信したデータまたは情報の中から選択して取得すること、または、配信されたデータまたは情報を選択して受信することであってもよい。 In the embodiment, "acquisition" means that the own device retrieves data or information stored in another device or storage medium (active acquisition), and is output to the own device from the other device. Includes at least one of entering data or information (passive acquisition). Examples of active acquisition include making a request or inquiry to another device and receiving the reply, and accessing and reading another device or storage medium. Further, an example of passive acquisition may be receiving information to be delivered (or transmitted, push notification, etc.). Further, "acquisition" may be to select and acquire from received data or information, or to select and receive delivered data or information.
判別器110は、生成部104により、画像化されたデータを機械学習処理の対象にして生成される。解析部106は、この判別器110を用いて、生産設備10の状態解析処理を行う。
The
機械学習は、例えば、ディープラーニング(深層学習)を用いることができるが、これに限定されない。判別器110が判別する生産設備10の状態は、例えば、正常か、それ以外の状態である。以後、正常以外の状態は「Unknown」とも呼ぶ。本実施形態では、判別器110は異常状態の判別は行わない。判別器110の機械学習処理については後述する実施形態で詳細に説明する。
Machine learning can use, for example, deep learning, but is not limited to this. The state of the
判別器110の判別結果はオペレータが参照できるように出力されてもよい。出力方法は、例えば、解析装置100のディスプレイに表示してもよいし、解析装置100からプリンタに印字出力されてもよいし、通信回線を介して他の装置(例えば、操作端末等)に送信されてもよい。
The discrimination result of the
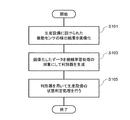
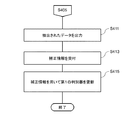
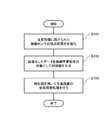
このように構成された本実施形態の解析装置100の動作について説明する。図7は、本実施形態の解析装置100の動作の一例を示すフローチャートである。
まず、画像処理部102は、生産設備10に設けられた振動センサの検出結果を画像化する(ステップS101)。そして、生成部104は、画像化したデータを機械学習処理の対象にして判別器110を生成する(ステップS103)。そして、解析部106は、判別器110を用いて生産設備10の状態解析処理を行う(ステップS105)。The operation of the
First, the
図8は、図7のステップS101の画像化処理の詳細フローの一例を示すフローチャートである。まず、画像処理部102は、センサ12の測定データをFFT処理してから周波数分割し(ステップS113)、得られた振動スペクトラムデータを画像化して画像データを出力する(ステップS115)。ステップS115で得られた画像データは、図7のステップS103で解析部106により判別器110を用いた生産設備10の状態解析処理が行われる。
FIG. 8 is a flowchart showing an example of the detailed flow of the imaging process in step S101 of FIG. 7. First, the
以上説明したように、本実施形態において、画像処理部102によりセンサ12の測定データが画像化された後、生成部104により画像化された画像データを機械学習処理の対象にして判別器110が生成され、そして、この判別器110を用いて解析部106により生産設備10の状態解析処理が行われる。このように、本実施形態によれば、振動センサの検出結果を機械学習する際に、機械学習処理の対象となる振動波形データを画像化することで、データ量を圧縮できるので、処理負荷を低減するとともに、処理速度を高速化できる。
As described above, in the present embodiment, after the measurement data of the
(第2の実施の形態)
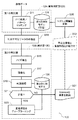
図9は、本実施形態の解析装置100の論理的な構成を示す機能ブロック図である。解析装置100は、図4の解析装置100と同様な画像処理部102と、生成部104と、解析部106と、を備えるとともに、さらに、異常判定部120を備える。(Second embodiment)
FIG. 9 is a functional block diagram showing a logical configuration of the
異常判定部120は、生産設備10に設けられた振動センサの検出結果に基づいて当該生産設備10の異常判定処理を第1の判別器124を用いて行う。異常判定部120は、第1の判別器124を用いた異常判定処理の結果を出力する。出力された結果は、設備監視システム1において生産設備10の監視処理に使用されてもよい。
The
また、本実施形態の画像処理部102は、画像化対象となる検出結果が、第1の判別器124により正常か異常かの判別ができなかった検出結果である点で上記実施形態の画像処理部102と相違する。生成部104は、このように閾値解析により正常か異常かの判別ができなかった測定データを機械学習処理するための第2の判別器126を生成する。
Further, the
振動センサで計測される振動は、複数の要因からなる複数の振動波形が含まれる。一般に、振動センサから検出される測定データは、高速フーリエ変換(FFT: Fast Fourie Transform)処理を行うことにより周波数解析が行われる。測定データをFFT処理することにより、特徴点な周波数(ピーク)が検出され、検出されたピークレベルを閾値により正常か異常かを判別することで異常診断することが可能になる。 The vibration measured by the vibration sensor includes a plurality of vibration waveforms composed of a plurality of factors. Generally, the measurement data detected from the vibration sensor is subjected to frequency analysis by performing a fast Fourier transform (FFT) process. By performing FFT processing on the measured data, a characteristic frequency (peak) is detected, and it is possible to diagnose an abnormality by determining whether the detected peak level is normal or abnormal by a threshold value.
しかし、この閾値解析により正常か異常かの判別ができない場合がある。生成部104は、このように閾値解析により正常か異常かの判別できなかった測定データを機械学習処理の対象として第2の判別器126を生成する。この第2の判別器126は、図4の判別器110に相当する。
However, it may not be possible to determine whether it is normal or abnormal by this threshold analysis. The
「第1の判別器124で判別できない」場合とは、例えば、第1の判別モデル128に登録されている振動波形パターンと検出結果がマッチングしなかった場合、マッチング結果の尤度が所定値以上得られず、設備診断に必要とされる基準以上(例えば、検出率90%以上)の信頼性が得られなかった場合、等である。
The case where "the
解析部106は、第2の判別器126を用いて生産設備10の状態解析処理を行う。解析部106は、第1の判別器124により正常か異常かの判別ができなかった検出結果を画像化したデータについて第2の判別器126を用いて生産設備10の状態解析処理を行う。
The
第1の判別器124は、第1の判別モデル128を用いて、正常か異常かを判別する。第1の判別モデル128は、例えば振動スペクトルのパターンマッチングや、閾値判定を用いたモデルである。
The
一例として、第1の判別器124は、振動センサの測定データをFFT処理して得られた周波数分布から、特定周波数のピークレベル、最大および平均ピークレベルの比、S/N比(Signal-to-Noise ratio)、および特定周波数の範囲でのピークレベルの積算値の少なくともいずれか一つについてそれぞれ求め、求めた値に閾値を設定し、閾値の範囲内か否かに基づいて異常判定処理を行う。そして閾値範囲内の場合は、正常と判別し、閾値範囲外の場合は異常と判別する。
As an example, the
第1の判別器124は複数の特定周波数を用いて上記した判定処理を行ってもよい。その場合は、第1の判別器124は特定周波数毎に判定結果を出力してもよい。また、第1の判別器124は、複数の特定周波数のうち1つでも閾値を外れた値があった場合に異常と判定してもよいし、複数の特定周波数のうちの所定数以上の特定周波数が閾値を外れた値があった場合に異常と判定してもよいし、複数の特定周波数のすべてが閾値を外れていた場合に異常と判定してもよいし、複数の特定周波数のすべてが閾値範囲内の場合に正常と判定してもよい。また、不具合事象毎に複数の特定周波数の値の組み合わせをモデル化して第1の判別モデル128に登録しておき、第1の判別器124は第1の判別モデル128とのパターンマッチングにより、不具合事象を判別してもよい。判別された不具合事象を、異常判定部120は、対応する不具合事象項目をオペレータに通知してもよい。
The
閾値は自動設定されてもよいし、オペレータによる手動設定で行われてもよい。自動設定の場合は、生成部104は、第1の判別モデル128に登録されている振動特性パターン(周波数分布)について、特定周波数のピークレベル、最大および平均ピークレベルの比、S/N比(Signal-to-Noise ratio)、および特定周波数の範囲でのピークレベルの積算値の少なくともいずれか一つについてそれぞれ求め、正常時と異常時の境界範囲を検出して閾値を設定してもよい。
The threshold value may be set automatically or may be set manually by the operator. In the case of automatic setting, the
手動設定の場合、生成部104は、第1の判別モデル128に登録されている振動特性パターン(周波数分布)について、特定周波数のピークレベル、最大および平均ピークレベルの比、S/N比(Signal-to-Noise ratio)、および特定周波数の範囲でのピークレベルの積算値の少なくともいずれか一つについてそれぞれ求めた結果をオペレータに提示して、第1の判別器124の閾値の設定をオペレータ操作によりそれぞれ受け付けてもよい。オペレータへの結果の提示方法は様々考えられるが、例として、解析装置100のディスプレイに表示してもよいし、解析装置100からプリンタに印字出力されてもよいし、通信回線を介して他の装置(例えば、操作端末等)に送信されてもよい。
In the case of manual setting, the
第2の判別器126は、生成部104により生成され、上記実施形態の生成部104で生成される判別器110に相当する。生成部104は、第2の判別器126により正常と判別されたデータのみを機械学習させ、正常状態を正規化して第2の判別モデル130を更新する。ここで、正規化とは、正常時の振動センサの測定データの画像化データのパターンをモデル化することである。第2の判別器126は、第2の判別モデル130の範囲から外れたデータを、例えば、「Unknown」として抽出する。つまり、この第2の判別器126を用いて解析部106により、第1の判別器124で判別できなかった検出結果について、さらに、第2の判別モデル130に基づいて、生産設備10の状態が、正常か「Unknown」かが判別される。第2の判別器126は、生産設備10の異常状態は判別しない、正常以外の状態は「Unknown」と判別する。
The
この判別器110により「Unknown」と判別されたデータは、オペレータにより参照されて、分析されてもよい。オペレータにより分析された結果は、検出結果の異常判定処理の閾値に反映されてもよい。「Unknown」と判別されたデータの利用方法については後述する実施形態で詳細に説明する。
The data determined to be "Unknown" by the
このように構成された本実施形態の解析装置100の動作について説明する。図10は、本実施形態の解析装置100の動作の一例を示すフローチャートである。
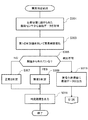
まず、異常判定部120は、生産設備10に設けられた振動センサの検出結果に基づいて当該生産設備10の異常判定処理を第1の判別器124を用いて行う(ステップS121)。そして、画像処理部102は、第1の判別器124により正常か異常かの判別ができなかった検出結果を(ステップS123のNO)、画像化する(ステップS125)。判別できた場合は(ステップS123のYES)、本処理を終了する。The operation of the
First, the
そして、生成部104は、画像化したデータを機械学習処理の対象にして第2の判別器126を生成する(ステップS127)。そして、解析部106は、第2の判別器126を用いて生産設備10の状態解析処理を行う(ステップS129)。
Then, the
また、本実施形態のコンピュータプログラムは、解析装置100を実現させるためのコンピュータ(図3のプロセッサ50)に、生産設備10に設けられた振動センサ12の検出結果に基づいて当該生産設備10の異常判定処理を第1の判別器124を用いて行う手順、第1の判別器124により正常か異常かの判別ができなかった検出結果を画像化する手順、画像化したデータを機械学習処理の対象として第2の判別器126を生成する手順、第2の判別器126を用いて生産設備10の状態解析処理を行う手順、を実行させるように記述されている。
Further, in the computer program of the present embodiment, the computer (
以上説明したように、本実施形態において、異常判定部120により第1の判別器124を用いて振動センサの検出結果に基づく異常判定処理で判別結果が得られなかった場合に、そのときの振動センサの検出結果を画像処理部102により画像化し、第2の判別器126により正常か「Unknown」かが判別される。このように、本実施形態によれば、第2の判別器126には、正常状態に対応する振動センサの検出結果のみを機械学習させ、正常状態について正規化するので、少量多品種や変種変動生産などで、製造条件が常に流動的が不具合事象の情報が積み上がりにくい場合であっても、判別の精度を向上できる。
As described above, in the present embodiment, when the
また、上記実施形態と同様に、振動センサの検出結果を機械学習する際に、機械学習処理の対象となる振動波形データを画像化することで、データ量を圧縮できるので、処理負荷を低減するとともに、処理速度を高速化できる。 Further, as in the above embodiment, when the detection result of the vibration sensor is machine-learned, the data amount can be compressed by imaging the vibration waveform data to be the target of the machine learning process, so that the processing load is reduced. At the same time, the processing speed can be increased.
(第3の実施の形態)
図11は、本実施形態の解析装置100における異常判定処理の手順の一例を示すフローチャートである。本実施形態は、第1の判別器124を用いた生産設備10の異常判定処理の結果を出力する構成を有する点以外は図9の解析装置100と同様である。(Third embodiment)
FIG. 11 is a flowchart showing an example of the procedure of abnormality determination processing in the
まず、異常判定部120は、生産設備10に設けられた振動センサから振動データを取得する(ステップS301)。そして、異常判定部120は、第1の判別器124を用いて取得した振動データの異常判定処理を実行する(ステップS303)。ここで、振動データはFFT処理された後、異常判定部120の第1の判別モデル128によって正常か異常を判別される(ステップS305)。
First, the
異常判定部120は、FFT処理して得られた周波数分布から、特定周波数のピークレベル、最大および平均ピークレベルの比、S/N比(Signal-to-Noise ratio)、および特定周波数の範囲でのピークレベルの積算値の少なくともいずれか一つについてそれぞれ求め、閾値を用いてこれらの値が正常か異常かを判別する(ステップS305)。閾値の範囲内の場合(ステップS305のNO)、第1の判別器124は、生産設備10は正常であると判定し(ステップS307)、異常判定部120は、生産設備10は正常であることを示す判定結果を出力する(ステップS311)。
From the frequency distribution obtained by FFT processing, the
閾値の範囲外の場合(ステップS305のYES)、第1の判別器124は、生産設備10は異常状態であると判定し(ステップS309)、生産設備10は異常状態であることを示す判定結果を出力する(ステップS311)。
When it is out of the threshold range (YES in step S305), the
また、第1の判別器124による正常か異常かの判別ができなかった場合(ステップS305の判別不可)、異常判定部120は、画像処理部102に振動データを出力し(ステップS313)、図10のステップS125に進む。
Further, when the
本実施形態では、生産設備10の異常判定処理に第1の判別器124を用い、第2の判別器126は異常判定処理には使用しない。また、第2の判別器126の判別結果は、第1の判別器124の第2の判別モデル130を更新するのに使用されるが、この構成については後述する実施形態で説明する。
In the present embodiment, the
以上説明したように、本実施形態において、異常判定部120により第1の判別器124を用いて生産設備10の異常判定処理を行い、異常判定部120は第2の判別器126を生産設備10の異常判定処理には使用しない。生成部104によって更新される第2の判別器126の判別結果を用いて第1の判別器124を更新することができる。この構成によれば、第2の判別器126の判別結果を反映した第1の判別器124を用いて異常判定処理を行うことができるので、判定結果の精度を向上できる。
As described above, in the present embodiment, the
(第4の実施の形態)
図12は、本実施形態の解析装置100の画像処理部102の論理的な構成を示す機能ブロック図である。本実施形態の解析装置100は、画像処理部102において、測定データからノイズを除去する処理を行ってから、画像化処理を行う構成を有する点以外は上記実施形態と同様である。本実施形態の構成は、他のいずれの実施形態の構成と組み合わせてもよい。(Fourth Embodiment)
FIG. 12 is a functional block diagram showing a logical configuration of the
画像処理部102は、ノイズ除去部112と、画像化処理部114とを含む。ノイズ除去部112は、検出結果に対してノイズ除去処理を行う。画像化処理部114は、ノイズ除去部112によるノイズ除去処理が行われた後の検出結果を画像化する。ノイズ除去により測定データの振動波形が鮮明になる。
The
ノイズ除去処理は、例えば、複数配置された振動センサからの環境ノイズを予め計測して記憶しておき、ノイズデータを元に差分処理することを含む。ただしノイズ除去処理は他の方法で行われてもよい。 The noise removal processing includes, for example, measuring and storing environmental noise from a plurality of arranged vibration sensors in advance, and performing differential processing based on the noise data. However, the noise removal process may be performed by another method.
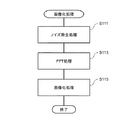
図13は、本実施形態の解析装置100の画像処理部102の動作の一例を示すフローチャートである。図13のフローチャートは、上記実施形態で説明した図8のフローチャートのステップS113およびステップS115に加え、さらにステップS111を含む。
FIG. 13 is a flowchart showing an example of the operation of the
ステップS111では、ノイズ除去部112は、測定データのノイズ除去処理を行う。そして、ステップS111でノイズ除去処理されたデータを画像化処理部114がFFT処理してから周波数分割処理し(ステップS113)、得られた振動スペクトラムデータを画像化して画像データを出力する(ステップS115)。ステップS115で得られた画像データは、図7のステップS103で解析部106により判別器110を用いた生産設備10の状態解析処理が行われる。
In step S111, the
以上説明したように、本実施形態において、ノイズ除去部112によりノイズ除去処理されたセンサ12の測定データを、画像化処理部114により画像化する。この構成により本実施形態によれば、上記実施形態と同様に機械学習処理又は判別処理の高速化を図ることができるとともに、さらに、ノイズ除去により測定データの振動波形が鮮明になり、FFT処理および画像化処理の精度が向上し、測定データの解析結果の精度および信頼性が向上する。
As described above, in the present embodiment, the measurement data of the
(第5の実施の形態)
図14は、本実施形態の解析装置100の論理的な構成を示す機能ブロック図である。本実施形態の解析装置100は、上記実施形態とは、生産設備10の状態解析処理により正常でないと判別されたデータを抽出し、そのデータに基づき第1の判別器124の第1の第1の判別モデル128を更新する構成を有する点以外は上記実施形態と同様である。(Fifth Embodiment)
FIG. 14 is a functional block diagram showing a logical configuration of the
解析装置100は、図9の解析装置100と同様な画像処理部102と、生成部104と、解析部106と、異常判定部120と、を備えるとともに、さらに抽出部140を備える。
The
抽出部140は、第2の判別器126を用いた状態解析処理で正常でない(「Unknown」)と判定されたデータを抽出する。生成部104は、抽出されたデータに基づく補正情報を受け付け第1の判別器124の第1の判別モデル128を更新する。ここで、補正情報は、不具合事象と振動特性とを紐付けた情報を含む。
The
抽出されるデータとは、「Unknown」と判別された画像化データに対応する、画像処理部102が画像化処理する前の、振動センサから受信した生の振動波形データと、当該データの時刻情報を含む。この「Unknown」と判別された振動データが示す振動は、未だ特定されていない生産設備10の不具合事象により引き起こされている可能性がある。
The extracted data is the raw vibration waveform data received from the vibration sensor before the
そこで、抽出された振動データを時刻情報とともに、設備監視システム1が有している生産設備10の稼働情報、状態情報、加工物の情報等を用いて、オペレータが人手で分析を行い、当該振動の原因となった不具合事象を特定する。
Therefore, the operator manually analyzes the extracted vibration data together with the time information, using the operation information, state information, work information, etc. of the
そのため、解析装置100は、抽出部140が抽出したデータを出力し、オペレータに提示する。オペレータへのデータの提示方法は様々考えられるが、例として、解析装置100のディスプレイに表示してもよいし、解析装置100からプリンタに印字出力されてもよいし、通信回線を介して他の装置(例えば、操作端末等)に送信されてもよい。
Therefore, the
オペレータが特定した不具合情報に、対応する振動の振動特性情報を紐付けた図15の補正情報30を、オペレータは操作画面等を用いて解析装置100に入力する。生成部104は、入力された補正情報30を受け付け、第1の判別器124の第1の判別モデル128を更新する。
The operator inputs the
図16は、解析部106による判別処理の詳細フローの一例を示すフローチャートである。解析部106は、図13のステップS115で出力された画像データを第2の判別器126にかけ、生産設備10の状態解析処理を行う(ステップS401)。第2の判別器126により正常と判別されたデータは(ステップS401の「正常」)、生成部104に受け渡され、正常データとして機械学習処理される(ステップS403)。一方、解析部106は、第2の判別器126により正規化の範囲から外れたデータを(ステップS401の「Unknown」)、抽出する(ステップS405)。
FIG. 16 is a flowchart showing an example of the detailed flow of the discrimination process by the
なお、図16のフローを用いて、図8のステップS115で出力された画像データについても同様に処理してよい。 In addition, using the flow of FIG. 16, the image data output in step S115 of FIG. 8 may be processed in the same manner.
図17は、図16のステップS405で抽出されたデータを用いた判別器の更新処理手順の一例を示すフローチャートである。
まず、抽出部140は、ステップS405で抽出したデータ(振動データと時刻情報)を出力する(ステップS411)。ここでは、例えば、解析装置100のディスプレイに表示する。そして、オペレータは、ステップS411で表示された振動データを時刻情報とともに、設備監視システム1が有している生産設備10の稼働情報、状態情報、加工物の情報等を用いて分析を行い、当該振動の原因となった不具合事象を特定する。オペレータは、特定した不具合事象と、対応する振動特性情報とを紐付けた情報を作成し、解析装置100の操作画面に従い、第1の判別器124の閾値の補正情報として入力する。FIG. 17 is a flowchart showing an example of an update processing procedure of the discriminator using the data extracted in step S405 of FIG.
First, the
生成部104は、入力された補正情報を受け付け(ステップS413)、受け付けた補正情報を用いて第1の判別器124を更新する(ステップS415)。
The
具体的には、受け付けた補正情報に含まれる、振動特性情報と不具合事象とを第1の判別モデル128に登録し、特定周波数のピークレベル、最大および平均ピークレベルの比、S/N比(Signal-to-Noise ratio)、および特定周波数の範囲でのピークレベルの積算値の少なくともいずれか一つについてそれぞれ求め、正常時と異常時の境界範囲を検出して閾値を設定する。あるいは、オペレータが、上記特定した不具合事象に対応する振動特性情報から求められた各値を元に閾値をそれぞれ設定して操作画面を用いて入力してもよい。
Specifically, the vibration characteristic information and the malfunction event included in the received correction information are registered in the
以上説明したように、本実施形態において、抽出部140により第2の判別器126の「Unknown」データが抽出され、オペレータに提示され、生成部104によりオペレータにより分析された不具合事象と振動特性情報とを紐付けた補正情報が受け付けられ、補正情報に基づき第1の判別器124が更新される。このように、本実施形態によれば、第1の判別器124が判別できなかった測定データについて、さらに第2の判別器126により判別処理を行い、「Unknown」とされたデータを抽出してオペレータが解析し、その結果を第1の判別器124に反映するので、異常判定処理の精度を向上させることができる。
As described above, in the present embodiment, the "Unknown" data of the
また、第2の判別器126には、正常時の情報のみを機械学習させるので、少量多品種や変種変動生産などで、製造条件が常に流動的が不具合事象の情報が積み上がりにくい場合であっても、第1の判別モデル128を更新できるので生産設備10の異常状態の判定精度を向上させることができる。
In addition, since the
(第5の実施の形態の変形態様)
図14の解析装置100は、図9の解析装置100の構成に抽出部140を設けた構成としていた。その変形態様として、図4の解析装置100において、抽出部140を設けた構成としてもよい。(Variation of the fifth embodiment)
The
解析装置100は、異常判定部120と、抽出部140と、さらに備える。異常判定部120は、検出結果が示す振動センサの振動の特徴解析処理を行い、閾値を用いて生産設備10の異常判定処理を行う。抽出部140は、状態解析処理で生産設備10が正常状態でないと判定されたデータを抽出する。生成部104は、抽出されたデータに基づく補正情報を受け付け、閾値を更新する。補正情報は、不具合事象と振動特性とを紐付けた情報を含む。
The
以上、図面を参照して本発明の実施形態について述べたが、これらは本発明の例示であり、上記以外の様々な構成を採用することもできる。
たとえば、図18は、図16の状態解析処理のステップS401で正常と判別された場合の処理手順の一例を示すフローチャートである。この実施形態は、第2の判別器126により正常と判別された検出結果を第2の判別器126の教師データとする構成を有する点以外は上記実施形態と同様である。Although the embodiments of the present invention have been described above with reference to the drawings, these are examples of the present invention, and various configurations other than the above can be adopted.
For example, FIG. 18 is a flowchart showing an example of a processing procedure when it is determined to be normal in step S401 of the state analysis processing of FIG. This embodiment is the same as the above embodiment except that it has a configuration in which the detection result determined to be normal by the
生成部104は、第2の判別器126を用いた状態解析処理により、正常と判定された検出結果を(図16のステップS401の正常)、生産設備10の正常状態の教師データとして第2の判別器126の第2の判別モデル130を更新する(ステップS501)。
The
この構成によれば、第2の判別器126を用いた状態解析処理により、正常と判定された検出結果を生産設備10の正常状態の教師データとして第2の判別モデル130が生成部104により更新される。このように、第1の判別器124による異常判定処理において判別できなかった測定データから正常状態の教師データを生成し、第2の判別モデル130を更新することができ、第2の判別器126の判別精度を向上することができる。
According to this configuration, the
さらに、上記実施形態の第1の判別器124と、第2の判別器126に加え、解析装置100は、第3の判別器(不図示)を備えてもよい。図19は、解析装置100が第3の判別器を用いて不具合モデルを構築し、不具合事象を識別する処理手順の一例を示すフローチャートである。第3の判別器は、第1の判別器124で正常と判別された測定データを取得する(ステップS601)。さらに、第3の判別器は、第2の判別器126でUnknownと判別された測定データを取得する(ステップS603)。そして、第3の判別器は、これらのデータを機械学習し、不具合事象を分類したモデルを構築する(ステップS605)。なお、第3の判別器が機械学習する各測定データについても、上記実施形態で説明したノイズ除去処理および画像化処理を行ってよい。
Further, in addition to the
さらに、第3の判別器を用いて、生産設備10のセンサ12の測定データが正常か異常かを判定し、さらに、異常の場合に不具合事象を識別する(ステップS607)。
Further, using the third discriminator, it is determined whether the measurement data of the
また、複数のセンサ12の各々の位置情報を設備情報24に記憶しておき、振動データと位置情報の関係をさらに、機械学習させ、分類モデル202、第1の判別モデル128、および第2の判別モデル130の少なくともいずれか一つに反映させてもよい。
Further, the position information of each of the plurality of
さらに、複数のセンサ12の測定データの測定条件(設備種別、環境(温度、湿度)等)等の情報を設備情報24に記憶しておいてもよい。この測定条件、生産設備10の稼働情報に含まれる稼働状態、稼働条件等から近い条件の測定データをグルーピングして、グループ毎に測定データを機械学習させ、分類モデル202、第1の判別モデル128、および第2の判別モデル130の少なくともいずれか一つに反映させてもよい。
Further, information such as measurement conditions (equipment type, environment (temperature, humidity), etc.) of the measurement data of the plurality of
(実施例1)
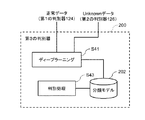
図20は、実施例1の解析装置を説明するためのフロー図である。
まず、異常判定部120は、生産設備10のセンサ12から振動データが入力されると、第1の判別器124においてFFT処理を行う(ステップS11)。このとき第1の判別モデル128を用いてパターンマッチング処理により振動特性を特定する。そして、第1の判別器124は振動特性が閾値の範囲内の場合は正常と判定し、閾値210の範囲を外れた場合は異常と判定する。異常判定部120はこの結果を設備監視システム1に生産設備10の異常判定結果として出力する(不図示)。(Example 1)
FIG. 20 is a flow chart for explaining the analysis device of the first embodiment.
First, when the vibration data is input from the
さらに、異常判定部120は、ステップS11で第1の判別器124により正常か否かの判別ができなかったデータを抽出し(ステップS13)、第2の判別器126の機械学習処理の対象として解析部106に受け渡す。
Further, the
解析部106は、第1の判別器124で判別できなかったセンサ12の測定データについてノイズ除去処理を行い(ステップS15)、周波数分析して画像化する(ステップS17)。解析部106は、画像化されたデータを第2の判別器126を用いて判別し(ステップS19)、生産設備10の状態が正常か否かを判別する(ステップS21)。正常と判別された場合(ステップS21のYES)、生成部104は、当該正常と判別された測定データを機械学習し第2の判別器126の第2の判別モデル130を更新する(ステップS23)。
The
一方、正常と判別されなかった(「Unknown」)場合(ステップS21のNO)、抽出部140は、当該Unknownとなった測定データを抽出して出力する(ステップS31)。オペレータは、この抽出されたUnknownなデータを参照し、生産設備10の稼働情報等とともに分析して、不具合事象を特定する。そして、不具合事象と振動特性とを紐付けた補正情報を解析装置100に入力する(ステップS33)。
On the other hand, when it is not determined to be normal (“Unknown”) (NO in step S21), the
生成部104は、入力された補正情報を受け付け、受け付けた補正情報を元に第1の判別モデル128と閾値を更新する(ステップS35)。
The
このようにして、解析装置100により、第1の判別器124で異常判定できなかった測定データを、第2の判別器126により機械学習することで、正常でないUnknownなデータを抽出し、生産設備10の稼働情報とともにオペレータが分析することで不具合事象を特定し、振動特性と不具合事象を紐付けた補正情報として解析装置100に入力することで、補正情報を元に第1の判別器124の第1の判別モデル128と閾値を更新することができる。
In this way, the
(実施例2)
図21は、実施例2の解析装置を説明するためのフロー図である。
この実施例の解析装置100は、第1の判別器124と、第2の判別器126と、に加え、さらに、第3の判別器200を備える。
第3の判別器200は、第1の判別器124により正常と判別された測定データと、第2の判別器126によりUnknownと判別された測定データとを用いて機械学習する(ステップS41)。第2の判別器126は、機械学習により、正常と異常の分類モデル202を構築する。分類モデル202は、不具合事象をクラス分けする。(Example 2)
FIG. 21 is a flow chart for explaining the analysis device of the second embodiment.
The
The
第3の判別器200は、この分類モデル202を用いて、測定データが正常か異常の判別を行うとともに、さらに、不具合事象を識別して特定することができる。
The
以上、実施形態および実施例を参照して本願発明を説明したが、本願発明は上記実施形態および実施例に限定されるものではない。本願発明の構成や詳細には、本願発明のスコープ内で当業者が理解し得る様々な変更をすることができる。
なお、本発明において利用者に関する情報を取得、利用する場合は、これを適法に行うものとする。Although the present invention has been described above with reference to the embodiments and examples, the present invention is not limited to the above embodiments and examples. Various changes that can be understood by those skilled in the art can be made within the scope of the present invention in terms of the configuration and details of the present invention.
In addition, when information about a user is acquired and used in this invention, this shall be done legally.
上記の実施形態の一部または全部は、以下の付記のようにも記載されうるが、以下に限られない。
1. 生産設備に設けられた振動センサの検出結果を画像化する画像処理手段と、
前記画像化したデータを機械学習処理の対象にして判別器を生成する生成手段と、
前記判別器を用いて前記生産設備の状態解析処理を行う解析手段と、を備える解析装置。
2. 1.に記載の解析装置において、
前記検出結果が示す前記振動センサの振動の特徴解析処理を行い、閾値を用いて前記生産設備の異常判定処理を行う判定手段と、
前記状態解析処理で前記生産設備が正常状態でないと判定されたデータを抽出する抽出手段と、をさらに備え、
前記生成手段は、抽出された前記データに基づく補正情報を受け付け、前記閾値を更新し、
前記補正情報は、不具合事象と振動特性とを紐付けた情報を含む、解析装置。
3. 生産設備に設けられた振動センサの検出結果に基づいて当該生産設備の異常判定処理を第1の判別器を用いて行う判定手段と、
前記第1の判別器により正常か異常かの判別ができなかった前記検出結果を画像化する画像処理手段と、
前記画像化したデータを機械学習処理の対象として第2の判別器を生成する生成手段と、
前記第2の判別器を用いて前記生産設備の状態解析処理を行う解析手段と、
を備える、
解析装置。
4. 3.に記載の解析装置において、
前記状態解析処理で前記生産設備が正常状態でないと判定されたデータを抽出する抽出手段をさらに備え、
前記生成手段は、抽出された前記データに基づく補正情報を受け付け前記第1の判別器を更新し、
前記補正情報は、不具合事象と振動特性とを紐付けた情報を含む、解析装置。
5. 1.から4.のいずれか一つに記載の解析装置において、
前記生成手段は、前記状態解析処理により正常と判定された前記データを前記機械学習処理の教師データとする、解析装置。
6. 1.から5.のいずれか一つに記載の解析装置において、
前記検出結果に対してノイズ除去処理を行う処理手段をさらに備え、
前記画像処理手段は、前記処理手段による前記ノイズ除去処理が行われた後の前記検出結果を画像化する、解析装置。
7. 1.から6.のいずれか一つに記載の解析装置において、
前記生産設備は、ベルトコンベアであり、
前記振動センサは、前記ベルトコンベアに設けられた複数の振動センサである、解析装置。Some or all of the above embodiments may also be described, but not limited to:
1. 1. Image processing means for imaging the detection results of vibration sensors installed in production equipment,
A generation means for generating a discriminator by using the imaged data as a target of machine learning processing,
An analysis device including an analysis means for performing a state analysis process of the production equipment using the discriminator.
2. 2. 1. 1. In the analyzer described in
A determination means for performing characteristic analysis processing of the vibration of the vibration sensor indicated by the detection result and performing abnormality determination processing for the production equipment using a threshold value.
Further provided with an extraction means for extracting data determined by the state analysis process that the production equipment is not in a normal state.
The generation means receives the correction information based on the extracted data, updates the threshold value, and receives the correction information.
The correction information is an analysis device including information linking a malfunction event and a vibration characteristic.
3. 3. Judgment means for performing abnormality determination processing of the production equipment using the first discriminator based on the detection result of the vibration sensor provided in the production equipment, and
An image processing means for imaging the detection result that could not be discriminated as normal or abnormal by the first discriminator, and
A generation means for generating a second discriminator using the imaged data as a target of machine learning processing,
An analysis means for performing a state analysis process of the production equipment using the second discriminator, and an analysis means.
To prepare
Analytical device.
4. 3. 3. In the analyzer described in
Further provided with an extraction means for extracting data determined by the state analysis process that the production equipment is not in a normal state.
The generation means receives the correction information based on the extracted data, updates the first discriminator, and updates the first discriminator.
The correction information is an analysis device including information linking a malfunction event and a vibration characteristic.
5. 1. 1. From 4. In the analyzer described in any one of
The generation means is an analysis device that uses the data determined to be normal by the state analysis process as teacher data for the machine learning process.
6. 1. 1. From 5. In the analyzer described in any one of
Further provided with a processing means for performing noise removal processing on the detection result,
The image processing means is an analysis device that images the detection result after the noise removal processing by the processing means is performed.
7. 1. 1. From 6. In the analyzer described in any one of
The production equipment is a belt conveyor.
The vibration sensor is an analysis device which is a plurality of vibration sensors provided on the belt conveyor.
8. 解析装置が、
生産設備に設けられた振動センサの検出結果を画像化し、
前記画像化したデータを機械学習処理の対象にして判別器を生成し、
前記判別器を用いて前記生産設備の状態解析処理を行う、
解析方法。
9. 8.に記載の解析方法において、
前記解析装置が、さらに、
前記検出結果が示す前記振動センサの振動の特徴解析処理を行い、閾値を用いて前記生産設備の異常判定処理を行い、
前記状態解析処理で前記生産設備が正常状態でないと判定されたデータを抽出し、
抽出された前記データに基づく補正情報を受け付け、前記閾値を更新し、
前記補正情報は、不具合事象と振動特性とを紐付けた情報を含む、解析方法。
10. 解析装置が、
生産設備に設けられた振動センサの検出結果に基づいて当該生産設備の異常判定処理を第1の判別器を用いて行い、
前記第1の判別器により正常か異常かの判別ができなかった前記検出結果を画像化し、
前記画像化したデータを機械学習処理の対象として第2の判別器を生成し、
前記第2の判別器を用いて前記生産設備の状態解析処理を行う、
解析方法。
11. 10.に記載の解析方法において、
前記解析装置が、さらに、
前記状態解析処理で前記生産設備が正常状態でないと判定されたデータを抽出し、
抽出された前記データに基づく補正情報を受け付け前記第1の判別器を更新し、
前記補正情報は、不具合事象と振動特性とを紐付けた情報を含む、解析方法。
12. 8.から11.のいずれか一つに記載の解析方法において、
前記解析装置が、さらに、
前記状態解析処理により正常と判定された前記データを前記機械学習処理の教師データとする、解析方法。
13. 8.から12.のいずれか一つに記載の解析方法において、
前記解析装置が、さらに、
前記検出結果に対してノイズ除去処理を行い、
前記ノイズ除去処理が行われた後の前記検出結果を画像化する、解析方法。
14. 8.から13.のいずれか一つに記載の解析方法において、
前記生産設備は、ベルトコンベアであり、
前記振動センサは、前記ベルトコンベアに設けられた複数の振動センサである、解析方法。8. The analyzer is
The detection result of the vibration sensor installed in the production equipment is visualized and
A discriminator is generated by using the imaged data as a target of machine learning processing.
The state analysis process of the production equipment is performed using the discriminator.
analysis method.
9. 8. In the analysis method described in
The analysis device further
The vibration characteristic analysis process of the vibration sensor indicated by the detection result is performed, and the abnormality determination process of the production equipment is performed using the threshold value.
Data determined by the state analysis process that the production equipment is not in a normal state is extracted, and the data is extracted.
The correction information based on the extracted data is received, the threshold value is updated, and the threshold value is updated.
The correction information is an analysis method including information linking a malfunction event and a vibration characteristic.
10. The analyzer is
Based on the detection result of the vibration sensor installed in the production equipment, the abnormality determination process of the production equipment is performed using the first discriminator.
The detection result that could not be discriminated as normal or abnormal by the first discriminator was imaged and imaged.
A second discriminator is generated by using the imaged data as a target of machine learning processing.
The state analysis process of the production equipment is performed using the second discriminator.
analysis method.
11. 10. In the analysis method described in
The analysis device further
Data determined by the state analysis process that the production equipment is not in a normal state is extracted, and the data is extracted.
The correction information based on the extracted data is received, and the first discriminator is updated.
The correction information is an analysis method including information linking a malfunction event and a vibration characteristic.
12. 8. From 11. In the analysis method described in any one of
The analysis device further
An analysis method in which the data determined to be normal by the state analysis process is used as the teacher data of the machine learning process.
13. 8. From 12. In the analysis method described in any one of
The analysis device further
Noise removal processing is performed on the detection result, and the noise is removed.
An analysis method for imaging the detection result after the noise removal process is performed.
14. 8. From 13. In the analysis method described in any one of
The production equipment is a belt conveyor.
The analysis method, wherein the vibration sensor is a plurality of vibration sensors provided on the belt conveyor.
15. コンピュータに、
生産設備に設けられた振動センサの検出結果を画像化する手順、
前記画像化したデータを機械学習処理の対象にして判別器を生成する手順、
前記判別器を用いて前記生産設備の異常判定処理を行う手順、を実行させるためのプログラム。
16. 15.に記載のプログラムにおいて、
前記検出結果が示す前記振動センサの振動の特徴解析処理を行い、閾値を用いて前記生産設備の異常判定処理を行う手順、
前記状態解析処理で前記生産設備が正常状態でないと判定されたデータを抽出する手順、
前記生成する手順において、抽出された前記データに基づく補正情報を受け付け、前記閾値を更新する手順、をさらにコンピュータに実行させ、
前記補正情報は、不具合事象と振動特性とを紐付けた情報を含む、プログラム。
17. コンピュータに、
生産設備に設けられた振動センサの検出結果に基づいて当該生産設備の異常判定処理を第1の判別器を用いて行う手順、
前記第1の判別器により正常か異常かの判別ができなかった前記検出結果を画像化する手順、
前記画像化したデータを機械学習処理の対象として第2の判別器を生成する手順、
前記第2の判別器を用いて前記生産設備の状態解析処理を行う手順、を実行させるためのプログラム。
18. 17.に記載のプログラムにおいて、
前記状態解析処理で前記生産設備が正常状態でないと判定されたデータを抽出する手順、
前記生成する手順において、抽出された前記データに基づく補正情報を受け付け前記第1の判別器を更新する手順、をさらにコンピュータに実行させ、
前記補正情報は、不具合事象と振動特性とを紐付けた情報を含む、プログラム。
19. 15.から18.のいずれか一つに記載のプログラムにおいて、
前記生成する手順において、前記状態解析処理により正常と判定された前記データを前記機械学習処理の教師データとする手順をさらにコンピュータに実行させるためのプログラム。
20. 15.から19.のいずれか一つに記載のプログラムにおいて、
前記検出結果に対してノイズ除去処理を行う手順、
前記画像化する手順において、前記ノイズ除去処理が行われた後の前記検出結果を画像化する手順、をさらにコンピュータに実行させるためのプログラム。
21. 15.から20.のいずれか一つに記載のプログラムにおいて、
前記生産設備は、ベルトコンベアであり、
前記振動センサは、前記ベルトコンベアに設けられた複数の振動センサである、プログラム。15. On the computer
Procedure for imaging the detection result of the vibration sensor installed in the production equipment,
A procedure for generating a discriminator by targeting the imaged data to machine learning processing,
A program for executing a procedure for performing an abnormality determination process of the production equipment using the discriminator.
16. 15. In the program described in
A procedure for performing a characteristic analysis process of vibration of the vibration sensor indicated by the detection result and performing an abnormality determination process of the production equipment using a threshold value.
A procedure for extracting data determined by the state analysis process that the production equipment is not in a normal state.
In the procedure for generating, the computer is further executed to receive the correction information based on the extracted data and update the threshold value.
The correction information is a program including information linking a malfunction event and a vibration characteristic.
17. On the computer
A procedure for performing abnormality determination processing of the production equipment using the first discriminator based on the detection result of the vibration sensor provided in the production equipment.
A procedure for imaging the detection result for which normality or abnormality could not be determined by the first discriminator.
A procedure for generating a second discriminator using the imaged data as a target of machine learning processing,
A program for executing a procedure for performing a state analysis process of the production equipment using the second discriminator.
18. 17. In the program described in
A procedure for extracting data determined by the state analysis process that the production equipment is not in a normal state.
In the procedure for generating, the computer is further made to execute the procedure for receiving the correction information based on the extracted data and updating the first discriminator.
The correction information is a program including information linking a malfunction event and a vibration characteristic.
19. 15. From 18. In the program described in any one of
A program for causing a computer to further perform a procedure of using the data determined to be normal by the state analysis process as teacher data of the machine learning process in the generated procedure.
20. 15. From 19. In the program described in any one of
Procedure for performing noise removal processing on the detection result,
A program for causing a computer to further perform a procedure for imaging the detection result after the noise removal process is performed in the imaging procedure.
21. 15. From 20. In the program described in any one of
The production equipment is a belt conveyor.
The vibration sensor is a program, which is a plurality of vibration sensors provided on the belt conveyor.
この出願は、2019年2月5日に出願された日本出願特願2019−019068号を基礎とする優先権を主張し、その開示の全てをここに取り込む。 This application claims priority on the basis of Japanese Application Japanese Patent Application No. 2019-019068 filed on February 5, 2019 and incorporates all of its disclosures herein.
バス58は、プロセッサ50、メモリ52、周辺回路56及び入出力インターフェイス54が相互にデータを伝送するためのデータ伝送路である。プロセッサ50は、例えばCPU(Central Processing Unit)、GPU(Graphics Processing Unit)などの演算処理装置である。メモリ52は、例えばRAM(Random Access Memory)やROM(Read Only Memory)などのメモリである。入出力インターフェイス54は、入力装置、外部装置、外部サーバ、センサ等から情報を取得するためのインターフェイスや、出力装置、外部装置、外部サーバ等に情報を出力するためのインターフェイスなどを含む。入力装置は、例えばキーボード、マウス、マイク等である。出力装置は、例えばディスプレイ、スピーカ、プリンタ、メーラ等である。プロセッサ50は、各モジュールに指令を出し、それらの演算結果をもとに演算を行うことができる。
The
画像処理部102は、生産設備10のセンサ12の検出結果(以下、振動データとも呼ぶ)を取得する。そして、画像処理部102は、取得した振動データをFFT処理してから周波数分割し、そして、得られた振動スペクトラムデータを画像化して画像データを得る。これらの処理により、データ量を圧縮することができ、機械学習処理および判別処理を高速化することができる。
The
図8は、図7のステップS101の画像化処理の詳細フローの一例を示すフローチャートである。まず、画像処理部102は、センサ12の測定データをFFT処理してから周波数分割し(ステップS113)、得られた振動スペクトラムデータを画像化して画像データを出力する(ステップS115)。ステップS115で得られた画像データは、図7のステップS105で解析部106により判別器110を用いた生産設備10の状態解析処理が行われる。
FIG. 8 is a flowchart showing an example of the detailed flow of the imaging process in step S101 of FIG. 7. First, the
振動センサで計測される振動は、複数の要因からなる複数の振動波形が含まれる。一般に、振動センサから検出される測定データは、高速フーリエ変換(FFT: Fast Fourie Transform)処理を行うことにより周波数解析が行われる。測定データをFFT処理することにより、特徴的な周波数(ピーク)が検出され、検出されたピークレベルを閾値により正常か異常かを判別することで異常診断することが可能になる。 The vibration measured by the vibration sensor includes a plurality of vibration waveforms composed of a plurality of factors. Generally, the measurement data detected from the vibration sensor is subjected to frequency analysis by performing a fast Fourier transform (FFT) process. By performing FFT processing on the measured data, a characteristic frequency (peak) is detected, and it is possible to diagnose an abnormality by determining whether the detected peak level is normal or abnormal by a threshold value.
一例として、第1の判別器124は、振動センサの測定データをFFT処理して得られた周波数分布から、特定周波数のピークレベル、最大および平均ピークレベルの比、S/N比(Signal-to-Noise ratio)、および特定周波数の範囲でのピークレベルの積算値の少なくともいずれか一つについてそれぞれ求め、求めた値に閾値を設定し、閾値の範囲内か否かに基づいて異常判定処理を行う。そして閾値範囲内の場合は、第1の判別器124は、正常と判別し、閾値範囲外の場合は異常と判別する。
As an example, the
この第2判別器126により「Unknown」と判別されたデータは、オペレータにより参照されて、分析されてもよい。オペレータにより分析された結果は、検出結果の異常判定処理の閾値に反映されてもよい。「Unknown」と判別されたデータの利用方法については後述する実施形態で詳細に説明する。
The data determined to be "Unknown" by the
以上説明したように、本実施形態において、異常判定部120により第1の判別器124を用いて振動センサの検出結果に基づく異常判定処理で判別結果が得られなかった場合に、そのときの振動センサの検出結果を画像処理部102により画像化し、第2の判別器126により正常か「Unknown」かが判別される。このように、本実施形態によれば、第2の判別器126には、正常状態に対応する振動センサの検出結果のみを機械学習させ、正常状態について正規化するので、少量多品種や変種変動生産などで、製造条件が常に流動的で不具合事象の情報が積み上がりにくい場合であっても、判別の精度を向上できる。
As described above, in the present embodiment, when the
本実施形態では、生産設備10の異常判定処理に第1の判別器124を用い、第2の判別器126は異常判定処理には使用しない。また、第2の判別器126の判別結果は、第1の判別器124の第1の判別モデル128を更新するのに使用されるが、この構成については後述する実施形態で説明する。
In the present embodiment, the
(第5の実施の形態)
図14は、本実施形態の解析装置100の論理的な構成を示す機能ブロック図である。本実施形態の解析装置100は、生産設備10の状態解析処理により正常でないと判別されたデータを抽出し、そのデータに基づき第1の判別器124の第1の判別モデル128を更新する構成を有する点以外は上記実施形態と同様である。
(Fifth Embodiment)
FIG. 14 is a functional block diagram showing a logical configuration of the
オペレータが特定した不具合事象に、対応する振動の振動特性情報を紐付けた図15の補正情報30を、オペレータは操作画面等を用いて解析装置100に入力する。生成部104は、入力された補正情報30を受け付け、第1の判別器124の第1の判別モデル128を更新する。
The operator inputs the
また、第2の判別器126には、正常時の情報のみを機械学習させるので、少量多品種や変種変動生産などで、製造条件が常に流動的で不具合事象の情報が積み上がりにくい場合であっても、第1の判別モデル128を更新できるので生産設備10の異常状態の判定精度を向上させることができる。
Further, since the
(実施例1)
図20は、実施例1の解析装置を説明するためのフロー図である。
まず、異常判定部120は、生産設備10のセンサ12から振動データが入力されると、第1の判別器124においてFFT処理を行う(ステップS11)。このとき第1の判別モデル128を用いてパターンマッチング処理により振動特性を特定する。そして、第1の判別器124は振動特性が閾値の範囲内の場合は正常と判定し、閾値の範囲を外れた場合は異常と判定する。異常判定部120はこの結果を設備監視システム1に生産設備10の異常判定結果として出力する(不図示)。
(Example 1)
FIG. 20 is a flow chart for explaining the analysis device of the first embodiment.
First, when the vibration data is input from the
15. コンピュータに、
生産設備に設けられた振動センサの検出結果を画像化する手順、
前記画像化したデータを機械学習処理の対象にして判別器を生成する手順、
前記判別器を用いて前記生産設備の状態解析処理を行う手順、を実行させるためのプログラム。
16. 15.に記載のプログラムにおいて、
前記検出結果が示す前記振動センサの振動の特徴解析処理を行い、閾値を用いて前記生産設備の異常判定処理を行う手順、
前記状態解析処理で前記生産設備が正常状態でないと判定されたデータを抽出する手順、
前記生成する手順において、抽出された前記データに基づく補正情報を受け付け、前記閾値を更新する手順、をさらにコンピュータに実行させ、
前記補正情報は、不具合事象と振動特性とを紐付けた情報を含む、プログラム。
17. コンピュータに、
生産設備に設けられた振動センサの検出結果に基づいて当該生産設備の異常判定処理を第1の判別器を用いて行う手順、
前記第1の判別器により正常か異常かの判別ができなかった前記検出結果を画像化する手順、
前記画像化したデータを機械学習処理の対象として第2の判別器を生成する手順、
前記第2の判別器を用いて前記生産設備の状態解析処理を行う手順、を実行させるためのプログラム。
18. 17.に記載のプログラムにおいて、
前記状態解析処理で前記生産設備が正常状態でないと判定されたデータを抽出する手順、
前記生成する手順において、抽出された前記データに基づく補正情報を受け付け前記第1の判別器を更新する手順、をさらにコンピュータに実行させ、
前記補正情報は、不具合事象と振動特性とを紐付けた情報を含む、プログラム。
19. 15.から18.のいずれか一つに記載のプログラムにおいて、
前記生成する手順において、前記状態解析処理により正常と判定された前記データを前記機械学習処理の教師データとする手順をさらにコンピュータに実行させるためのプログラム。
20. 15.から19.のいずれか一つに記載のプログラムにおいて、
前記検出結果に対してノイズ除去処理を行う手順、
前記画像化する手順において、前記ノイズ除去処理が行われた後の前記検出結果を画像化する手順、をさらにコンピュータに実行させるためのプログラム。
21. 15.から20.のいずれか一つに記載のプログラムにおいて、
前記生産設備は、ベルトコンベアであり、
前記振動センサは、前記ベルトコンベアに設けられた複数の振動センサである、プログラム。
15. On the computer
Procedure for imaging the detection result of the vibration sensor installed in the production equipment,
A procedure for generating a discriminator by targeting the imaged data to machine learning processing,
A program for executing a procedure for performing a state analysis process of the production equipment using the discriminator.
16. 15. In the program described in
A procedure for performing a characteristic analysis process of vibration of the vibration sensor indicated by the detection result and performing an abnormality determination process of the production equipment using a threshold value.
A procedure for extracting data determined by the state analysis process that the production equipment is not in a normal state.
In the procedure for generating, the computer is further executed to receive the correction information based on the extracted data and update the threshold value.
The correction information is a program including information linking a malfunction event and a vibration characteristic.
17. On the computer
A procedure for performing abnormality determination processing of the production equipment using the first discriminator based on the detection result of the vibration sensor provided in the production equipment.
A procedure for imaging the detection result for which normality or abnormality could not be determined by the first discriminator.
A procedure for generating a second discriminator using the imaged data as a target of machine learning processing,
A program for executing a procedure for performing a state analysis process of the production equipment using the second discriminator.
18. 17. In the program described in
A procedure for extracting data determined by the state analysis process that the production equipment is not in a normal state.
In the procedure for generating, the computer is further made to execute the procedure for receiving the correction information based on the extracted data and updating the first discriminator.
The correction information is a program including information linking a malfunction event and a vibration characteristic.
19. 15. From 18. In the program described in any one of
A program for causing a computer to further perform a procedure of using the data determined to be normal by the state analysis process as teacher data of the machine learning process in the generated procedure.
20. 15. From 19. In the program described in any one of
Procedure for performing noise removal processing on the detection result,
A program for causing a computer to further perform a procedure for imaging the detection result after the noise removal process is performed in the imaging procedure.
21. 15. From 20. In the program described in any one of
The production equipment is a belt conveyor.
The vibration sensor is a program, which is a plurality of vibration sensors provided on the belt conveyor.
Claims (21)
前記画像化したデータを機械学習処理の対象にして判別器を生成する生成手段と、
前記判別器を用いて前記生産設備の状態解析処理を行う解析手段と、を備える解析装置。Image processing means for imaging the detection results of vibration sensors installed in production equipment,
A generation means for generating a discriminator by using the imaged data as a target of machine learning processing,
An analysis device including an analysis means for performing a state analysis process of the production equipment using the discriminator.
前記検出結果が示す前記振動センサの振動の特徴解析処理を行い、閾値を用いて前記生産設備の異常判定処理を行う判定手段と、
前記状態解析処理で前記生産設備が正常状態でないと判定されたデータを抽出する抽出手段と、をさらに備え、
前記生成手段は、抽出された前記データに基づく補正情報を受け付け、前記閾値を更新し、
前記補正情報は、不具合事象と振動特性とを紐付けた情報を含む、解析装置。In the analysis apparatus according to claim 1,
A determination means for performing characteristic analysis processing of the vibration of the vibration sensor indicated by the detection result and performing abnormality determination processing for the production equipment using a threshold value.
Further provided with an extraction means for extracting data determined by the state analysis process that the production equipment is not in a normal state.
The generation means receives the correction information based on the extracted data, updates the threshold value, and receives the correction information.
The correction information is an analysis device including information linking a malfunction event and a vibration characteristic.
前記第1の判別器により正常か異常かの判別ができなかった前記検出結果を画像化する画像処理手段と、
前記画像化したデータを機械学習処理の対象として第2の判別器を生成する生成手段と、
前記第2の判別器を用いて前記生産設備の状態解析処理を行う解析手段と、
を備える、
解析装置。Judgment means for performing abnormality determination processing of the production equipment using the first discriminator based on the detection result of the vibration sensor provided in the production equipment, and
An image processing means for imaging the detection result that could not be discriminated as normal or abnormal by the first discriminator, and
A generation means for generating a second discriminator using the imaged data as a target of machine learning processing,
An analysis means for performing a state analysis process of the production equipment using the second discriminator, and an analysis means.
To prepare
Analytical device.
前記状態解析処理で前記生産設備が正常状態でないと判定されたデータを抽出する抽出手段をさらに備え、
前記生成手段は、抽出された前記データに基づく補正情報を受け付け前記第1の判別器を更新し、
前記補正情報は、不具合事象と振動特性とを紐付けた情報を含む、解析装置。In the analysis apparatus according to claim 3,
Further provided with an extraction means for extracting data determined by the state analysis process that the production equipment is not in a normal state.
The generation means receives the correction information based on the extracted data, updates the first discriminator, and updates the first discriminator.
The correction information is an analysis device including information linking a malfunction event and a vibration characteristic.
前記生成手段は、前記状態解析処理により正常と判定された前記データを前記機械学習処理の教師データとする、解析装置。In the analysis apparatus according to any one of claims 1 to 4.
The generation means is an analysis device that uses the data determined to be normal by the state analysis process as teacher data for the machine learning process.
前記検出結果に対してノイズ除去処理を行う処理手段をさらに備え、
前記画像処理手段は、前記処理手段による前記ノイズ除去処理が行われた後の前記検出結果を画像化する、解析装置。In the analysis apparatus according to any one of claims 1 to 5,
Further provided with a processing means for performing noise removal processing on the detection result,
The image processing means is an analysis device that images the detection result after the noise removal processing by the processing means is performed.
前記生産設備は、ベルトコンベアであり、
前記振動センサは、前記ベルトコンベアに設けられた複数の振動センサである、解析装置。In the analysis apparatus according to any one of claims 1 to 6.
The production equipment is a belt conveyor.
The vibration sensor is an analysis device which is a plurality of vibration sensors provided on the belt conveyor.
生産設備に設けられた振動センサの検出結果を画像化し、
前記画像化したデータを機械学習処理の対象にして判別器を生成し、
前記判別器を用いて前記生産設備の状態解析処理を行う、
解析方法。The analyzer is
The detection result of the vibration sensor installed in the production equipment is visualized and
A discriminator is generated by using the imaged data as a target of machine learning processing.
The state analysis process of the production equipment is performed using the discriminator.
analysis method.
前記解析装置が、さらに、
前記検出結果が示す前記振動センサの振動の特徴解析処理を行い、閾値を用いて前記生産設備の異常判定処理を行い、
前記状態解析処理で前記生産設備が正常状態でないと判定されたデータを抽出し、
抽出された前記データに基づく補正情報を受け付け、前記閾値を更新し、
前記補正情報は、不具合事象と振動特性とを紐付けた情報を含む、解析方法。In the analysis method according to claim 8,
The analysis device further
The vibration characteristic analysis process of the vibration sensor indicated by the detection result is performed, and the abnormality determination process of the production equipment is performed using the threshold value.
Data determined by the state analysis process that the production equipment is not in a normal state is extracted, and the data is extracted.
The correction information based on the extracted data is received, the threshold value is updated, and the threshold value is updated.
The correction information is an analysis method including information linking a malfunction event and a vibration characteristic.
生産設備に設けられた振動センサの検出結果に基づいて当該生産設備の異常判定処理を第1の判別器を用いて行い、
前記第1の判別器により正常か異常かの判別ができなかった前記検出結果を画像化し、
前記画像化したデータを機械学習処理の対象として第2の判別器を生成し、
前記第2の判別器を用いて前記生産設備の状態解析処理を行う、
解析方法。The analyzer is
Based on the detection result of the vibration sensor installed in the production equipment, the abnormality determination process of the production equipment is performed using the first discriminator.
The detection result that could not be discriminated as normal or abnormal by the first discriminator was imaged and imaged.
A second discriminator is generated by using the imaged data as a target of machine learning processing.
The state analysis process of the production equipment is performed using the second discriminator.
analysis method.
前記解析装置が、さらに、
前記状態解析処理で前記生産設備が正常状態でないと判定されたデータを抽出し、
抽出された前記データに基づく補正情報を受け付け前記第1の判別器を更新し、
前記補正情報は、不具合事象と振動特性とを紐付けた情報を含む、解析方法。In the analysis method according to claim 10,
The analysis device further
Data determined by the state analysis process that the production equipment is not in a normal state is extracted, and the data is extracted.
The correction information based on the extracted data is received, and the first discriminator is updated.
The correction information is an analysis method including information linking a malfunction event and a vibration characteristic.
前記解析装置が、さらに、
前記状態解析処理により正常と判定された前記データを前記機械学習処理の教師データとする、解析方法。In the analysis method according to any one of claims 8 to 11.
The analysis device further
An analysis method in which the data determined to be normal by the state analysis process is used as the teacher data of the machine learning process.
前記解析装置が、さらに、
前記検出結果に対してノイズ除去処理を行い、
前記ノイズ除去処理が行われた後の前記検出結果を画像化する、解析方法。In the analysis method according to any one of claims 8 to 12,
The analysis device further
Noise removal processing is performed on the detection result, and the noise is removed.
An analysis method for imaging the detection result after the noise removal processing is performed.
前記生産設備は、ベルトコンベアであり、
前記振動センサは、前記ベルトコンベアに設けられた複数の振動センサである、解析方法。In the analysis method according to any one of claims 8 to 13.
The production equipment is a belt conveyor.
The analysis method, wherein the vibration sensor is a plurality of vibration sensors provided on the belt conveyor.
生産設備に設けられた振動センサの検出結果を画像化する手順、
前記画像化したデータを機械学習処理の対象にして判別器を生成する手順、
前記判別器を用いて前記生産設備の異常判定処理を行う手順、を実行させるためのプログラム。On the computer
Procedure for imaging the detection result of the vibration sensor installed in the production equipment,
A procedure for generating a discriminator by targeting the imaged data to machine learning processing,
A program for executing a procedure for performing an abnormality determination process of the production equipment using the discriminator.
前記検出結果が示す前記振動センサの振動の特徴解析処理を行い、閾値を用いて前記生産設備の異常判定処理を行う手順、
前記状態解析処理で前記生産設備が正常状態でないと判定されたデータを抽出する手順、
前記生成する手順において、抽出された前記データに基づく補正情報を受け付け、前記閾値を更新する手順、をさらにコンピュータに実行させ、
前記補正情報は、不具合事象と振動特性とを紐付けた情報を含む、プログラム。In the program of claim 15,
A procedure for performing a characteristic analysis process of vibration of the vibration sensor indicated by the detection result and performing an abnormality determination process of the production equipment using a threshold value.
A procedure for extracting data determined by the state analysis process that the production equipment is not in a normal state.
In the procedure for generating, the computer is further executed to receive the correction information based on the extracted data and update the threshold value.
The correction information is a program including information linking a malfunction event and a vibration characteristic.
生産設備に設けられた振動センサの検出結果に基づいて当該生産設備の異常判定処理を第1の判別器を用いて行う手順、
前記第1の判別器により正常か異常かの判別ができなかった前記検出結果を画像化する手順、
前記画像化したデータを機械学習処理の対象として第2の判別器を生成する手順、
前記第2の判別器を用いて前記生産設備の状態解析処理を行う手順、を実行させるためのプログラム。On the computer
A procedure for performing abnormality determination processing of the production equipment using the first discriminator based on the detection result of the vibration sensor provided in the production equipment.
A procedure for imaging the detection result for which normality or abnormality could not be determined by the first discriminator.
A procedure for generating a second discriminator using the imaged data as a target of machine learning processing,
A program for executing a procedure for performing a state analysis process of the production equipment using the second discriminator.
前記状態解析処理で前記生産設備が正常状態でないと判定されたデータを抽出する手順、
前記生成する手順において、抽出された前記データに基づく補正情報を受け付け前記第1の判別器を更新する手順、をさらにコンピュータに実行させ、
前記補正情報は、不具合事象と振動特性とを紐付けた情報を含む、プログラム。In the program of claim 17,
A procedure for extracting data determined by the state analysis process that the production equipment is not in a normal state.
In the procedure for generating, the computer is further made to execute the procedure for receiving the correction information based on the extracted data and updating the first discriminator.
The correction information is a program including information linking a malfunction event and a vibration characteristic.
前記生成する手順において、前記状態解析処理により正常と判定された前記データを前記機械学習処理の教師データとする手順をさらにコンピュータに実行させるためのプログラム。In the program according to any one of claims 15 to 18.
A program for causing a computer to further perform a procedure of using the data determined to be normal by the state analysis process as teacher data of the machine learning process in the generated procedure.
前記検出結果に対してノイズ除去処理を行う手順、
前記画像化する手順において、前記ノイズ除去処理が行われた後の前記検出結果を画像化する手順、をさらにコンピュータに実行させるためのプログラム。In the program according to any one of claims 15 to 19.
Procedure for performing noise removal processing on the detection result,
A program for causing a computer to further perform a procedure for imaging the detection result after the noise removal process is performed in the imaging procedure.
前記生産設備は、ベルトコンベアであり、
前記振動センサは、前記ベルトコンベアに設けられた複数の振動センサである、プログラム。In the program according to any one of claims 15 to 20,
The production equipment is a belt conveyor.
The vibration sensor is a program, which is a plurality of vibration sensors provided on the belt conveyor.
Applications Claiming Priority (3)
| Application Number | Priority Date | Filing Date | Title |
|---|---|---|---|
| JP2019019068 | 2019-02-05 | ||
| JP2019019068 | 2019-02-05 | ||
| PCT/JP2020/004042 WO2020162425A1 (en) | 2019-02-05 | 2020-02-04 | Analysis device, analysis method, and program |
Publications (2)
| Publication Number | Publication Date |
|---|---|
| JPWO2020162425A1 true JPWO2020162425A1 (en) | 2021-12-09 |
| JP7188463B2 JP7188463B2 (en) | 2022-12-13 |
Family
ID=71947695
Family Applications (1)
| Application Number | Title | Priority Date | Filing Date |
|---|---|---|---|
| JP2020571198A Active JP7188463B2 (en) | 2019-02-05 | 2020-02-04 | ANALYSIS DEVICE, ANALYSIS METHOD, AND PROGRAM |
Country Status (6)
| Country | Link |
|---|---|
| JP (1) | JP7188463B2 (en) |
| KR (1) | KR20210107844A (en) |
| CN (1) | CN113383216A (en) |
| PH (1) | PH12021551623A1 (en) |
| TW (1) | TW202045898A (en) |
| WO (1) | WO2020162425A1 (en) |
Families Citing this family (4)
| Publication number | Priority date | Publication date | Assignee | Title |
|---|---|---|---|---|
| JP2022053036A (en) * | 2020-09-24 | 2022-04-05 | 国立大学法人大阪大学 | Degradation-status prediction system and degradation-status prediction method |
| JP7581063B2 (en) * | 2021-01-25 | 2024-11-12 | 株式会社日本製鋼所 | COMPUTER PROGRAM, ABNORMALITY DETECTION METHOD, ABNORMALITY DETECTION DEVICE, MOLDING MACHINE SYSTEM, AND LEARNING MODEL GENERATION METHOD |
| JP7647480B2 (en) * | 2021-10-01 | 2025-03-18 | 株式会社デンソー | Noise factor determination device and noise factor determination method |
| JP2023083737A (en) * | 2021-12-06 | 2023-06-16 | Ihi運搬機械株式会社 | Belt conveyor abnormality detection device |
Citations (3)
| Publication number | Priority date | Publication date | Assignee | Title |
|---|---|---|---|---|
| JP2011107093A (en) * | 2009-11-20 | 2011-06-02 | Jx Nippon Oil & Energy Corp | Apparatus and method for diagnosing abnormality of vibrating body |
| JP2018092453A (en) * | 2016-12-06 | 2018-06-14 | 日本電気通信システム株式会社 | Learning device, learning method and program |
| JP2018178810A (en) * | 2017-04-10 | 2018-11-15 | 株式会社デンソーテン | Knock control device, knock adaptation method and knock adaptation program |
Family Cites Families (7)
| Publication number | Priority date | Publication date | Assignee | Title |
|---|---|---|---|---|
| JP3170076B2 (en) * | 1992-12-18 | 2001-05-28 | 株式会社小野測器 | Rolling bearing failure diagnosis device |
| JP2000321176A (en) * | 1999-05-17 | 2000-11-24 | Mitsui Eng & Shipbuild Co Ltd | Error detection method and device |
| JP4862708B2 (en) * | 2007-03-19 | 2012-01-25 | Jfeスチール株式会社 | Deterioration degree diagnosis method, deterioration degree diagnosis device, and deterioration diagnosis program |
| CN102494882B (en) * | 2011-11-30 | 2013-11-06 | 中国神华能源股份有限公司 | Device for online monitoring and fault diagnosis of spring of vibrating screen for mining and method thereof |
| WO2018216258A1 (en) * | 2017-05-25 | 2018-11-29 | 日本電気株式会社 | Processing device, processing method, and program |
| CN107560849B (en) * | 2017-08-04 | 2020-02-18 | 华北电力大学 | Wind turbine bearing fault diagnosis method based on multi-channel deep convolutional neural network |
| CN108896296A (en) * | 2018-04-18 | 2018-11-27 | 北京信息科技大学 | A kind of wind turbine gearbox method for diagnosing faults based on convolutional neural networks |
-
2020
- 2020-02-04 PH PH1/2021/551623A patent/PH12021551623A1/en unknown
- 2020-02-04 CN CN202080012631.9A patent/CN113383216A/en active Pending
- 2020-02-04 WO PCT/JP2020/004042 patent/WO2020162425A1/en not_active Ceased
- 2020-02-04 KR KR1020217024139A patent/KR20210107844A/en not_active Ceased
- 2020-02-04 JP JP2020571198A patent/JP7188463B2/en active Active
- 2020-02-05 TW TW109103484A patent/TW202045898A/en unknown
Patent Citations (3)
| Publication number | Priority date | Publication date | Assignee | Title |
|---|---|---|---|---|
| JP2011107093A (en) * | 2009-11-20 | 2011-06-02 | Jx Nippon Oil & Energy Corp | Apparatus and method for diagnosing abnormality of vibrating body |
| JP2018092453A (en) * | 2016-12-06 | 2018-06-14 | 日本電気通信システム株式会社 | Learning device, learning method and program |
| JP2018178810A (en) * | 2017-04-10 | 2018-11-15 | 株式会社デンソーテン | Knock control device, knock adaptation method and knock adaptation program |
Also Published As
| Publication number | Publication date |
|---|---|
| KR20210107844A (en) | 2021-09-01 |
| WO2020162425A1 (en) | 2020-08-13 |
| JP7188463B2 (en) | 2022-12-13 |
| CN113383216A (en) | 2021-09-10 |
| TW202045898A (en) | 2020-12-16 |
| PH12021551623A1 (en) | 2022-04-18 |
Similar Documents
| Publication | Publication Date | Title |
|---|---|---|
| JPWO2020162425A1 (en) | Analyst, analysis method, and program | |
| JP6672132B2 (en) | Lift diagnostic system, lift diagnostic device, and lift diagnostic method | |
| RU2704073C2 (en) | Method and system for training acoustic or vibration analysis of machine | |
| US8140915B2 (en) | Detecting apparatus, system, program, and detecting method | |
| EP3206103A1 (en) | Model based system monitoring | |
| JP5162114B2 (en) | Method and apparatus for signal signature analysis for event detection in rotating machinery | |
| JP7006282B2 (en) | Equipment abnormality diagnostic equipment | |
| KR20210006832A (en) | Method and apparatus for machine fault diagnosis | |
| US20140058615A1 (en) | Fleet anomaly detection system and method | |
| US20220091590A1 (en) | Failure sign detection system and failure sign detection method | |
| TWI861824B (en) | Abnormal diagnosis method, abnormal diagnosis device, and abnormal diagnosis program | |
| CN113591984A (en) | Method and device for detecting equipment operation event, electronic equipment and storage medium | |
| US20210149387A1 (en) | Facility failure prediction system and method for using acoustic signal of ultrasonic band | |
| JP6898607B2 (en) | Abnormality sign detection system and abnormality sign detection method | |
| CN115917458A (en) | Data processing device, data processing method, and data processing program | |
| JP2004020484A (en) | Error monitoring device and error monitoring program | |
| CN118937970A (en) | A mine circuit fault self-diagnosis method and system | |
| US20230315559A1 (en) | Fault diagnosis apparatus, non-transitory computer-readable recording medium, and fault diagnosis method | |
| CN110411730A (en) | A kind of rotating equipment failures judgment method, system and readable storage medium storing program for executing | |
| CN118642871A (en) | Industrial software compatibility adaptation method and device based on intermediate business model | |
| WO2024120018A1 (en) | Detection method, training method, electrical appliance, monitoring system, storage medium, and device | |
| JP2024078846A (en) | Abnormality determination method, abnormality determination device, and program | |
| CN118642930B (en) | Methods, devices, electronic equipment, and storage media for detecting anomalies in big data tasks | |
| CN114286931B (en) | Abnormal portion detection device, abnormal portion detection method, and computer-readable recording medium | |
| JP7524784B2 (en) | Information processing device, control system, and report output method |
Legal Events
| Date | Code | Title | Description |
|---|---|---|---|
| A521 | Request for written amendment filed |
Free format text: JAPANESE INTERMEDIATE CODE: A523 Effective date: 20210730 |
|
| A621 | Written request for application examination |
Free format text: JAPANESE INTERMEDIATE CODE: A621 Effective date: 20210730 |
|
| A131 | Notification of reasons for refusal |
Free format text: JAPANESE INTERMEDIATE CODE: A131 Effective date: 20220628 |
|
| A521 | Request for written amendment filed |
Free format text: JAPANESE INTERMEDIATE CODE: A523 Effective date: 20220818 |
|
| TRDD | Decision of grant or rejection written | ||
| A01 | Written decision to grant a patent or to grant a registration (utility model) |
Free format text: JAPANESE INTERMEDIATE CODE: A01 Effective date: 20221101 |
|
| A61 | First payment of annual fees (during grant procedure) |
Free format text: JAPANESE INTERMEDIATE CODE: A61 Effective date: 20221114 |
|
| R151 | Written notification of patent or utility model registration |
Ref document number: 7188463 Country of ref document: JP Free format text: JAPANESE INTERMEDIATE CODE: R151 |