US7720641B2 - Application of abnormal event detection technology to delayed coking unit - Google Patents
Application of abnormal event detection technology to delayed coking unit Download PDFInfo
- Publication number
- US7720641B2 US7720641B2 US11/786,950 US78695007A US7720641B2 US 7720641 B2 US7720641 B2 US 7720641B2 US 78695007 A US78695007 A US 78695007A US 7720641 B2 US7720641 B2 US 7720641B2
- Authority
- US
- United States
- Prior art keywords
- model
- models
- measurements
- variables
- abnormal
- Prior art date
- Legal status (The legal status is an assumption and is not a legal conclusion. Google has not performed a legal analysis and makes no representation as to the accuracy of the status listed.)
- Active
Links
Images




Classifications
-
- C—CHEMISTRY; METALLURGY
- C10—PETROLEUM, GAS OR COKE INDUSTRIES; TECHNICAL GASES CONTAINING CARBON MONOXIDE; FUELS; LUBRICANTS; PEAT
- C10B—DESTRUCTIVE DISTILLATION OF CARBONACEOUS MATERIALS FOR PRODUCTION OF GAS, COKE, TAR, OR SIMILAR MATERIALS
- C10B55/00—Coking mineral oils, bitumen, tar, and the like or mixtures thereof with solid carbonaceous material
-
- G—PHYSICS
- G05—CONTROLLING; REGULATING
- G05B—CONTROL OR REGULATING SYSTEMS IN GENERAL; FUNCTIONAL ELEMENTS OF SUCH SYSTEMS; MONITORING OR TESTING ARRANGEMENTS FOR SUCH SYSTEMS OR ELEMENTS
- G05B23/00—Testing or monitoring of control systems or parts thereof
- G05B23/02—Electric testing or monitoring
- G05B23/0205—Electric testing or monitoring by means of a monitoring system capable of detecting and responding to faults
- G05B23/0218—Electric testing or monitoring by means of a monitoring system capable of detecting and responding to faults characterised by the fault detection method dealing with either existing or incipient faults
- G05B23/0243—Electric testing or monitoring by means of a monitoring system capable of detecting and responding to faults characterised by the fault detection method dealing with either existing or incipient faults model based detection method, e.g. first-principles knowledge model
- G05B23/0254—Electric testing or monitoring by means of a monitoring system capable of detecting and responding to faults characterised by the fault detection method dealing with either existing or incipient faults model based detection method, e.g. first-principles knowledge model based on a quantitative model, e.g. mathematical relationships between inputs and outputs; functions: observer, Kalman filter, residual calculation, Neural Networks
-
- G—PHYSICS
- G05—CONTROLLING; REGULATING
- G05B—CONTROL OR REGULATING SYSTEMS IN GENERAL; FUNCTIONAL ELEMENTS OF SUCH SYSTEMS; MONITORING OR TESTING ARRANGEMENTS FOR SUCH SYSTEMS OR ELEMENTS
- G05B23/00—Testing or monitoring of control systems or parts thereof
- G05B23/02—Electric testing or monitoring
- G05B23/0205—Electric testing or monitoring by means of a monitoring system capable of detecting and responding to faults
- G05B23/0259—Electric testing or monitoring by means of a monitoring system capable of detecting and responding to faults characterized by the response to fault detection
- G05B23/0286—Modifications to the monitored process, e.g. stopping operation or adapting control
- G05B23/0289—Reconfiguration to prevent failure, e.g. usually as a reaction to incipient failure detection
Definitions
- the present invention relates to the operation of a Delayed Coking Unit (DCU) comprising of feed heaters, main fractionator, wet gas compressor, and downstream light ends processing towers referred to as the Gas Plant.
- DCU Delayed Coking Unit
- the present invention relates to determining when the process is deviating from normal operation and automatic generation of notification.
- Delayed Coking is a high-severity thermal cracking process used in petroleum refineries.
- the process unit, DCU thermally decomposes the “bottom” of the crude barrel, which are typically the bottom streams of the atmospheric and vacuum crude distillation towers and produces a value-added mixture of olefins, naphthas, gas oils and petroleum coke.
- the overall reaction is endothermic with the furnace supplying the necessary heat for vaporization and cracking.
- the olefins are used in the petrochemical industry. Naphthas are used for various gasoline blends. Gas Oils are sent to other refinery units to be further cracked into naphthas and olefins.
- the coke which is essentially carbon with varying amounts of impurities, is calcined (roasted to dry, without melting) and used in the aluminum, steel or chemical industries. Coke can also be burned as fuel, or gasified to produced steam or electricity.
- FIG. 23 shows a typical DCU layout.
- One or more fired heaters with horizontal tubes are used in the process to reach thermal cracking temperatures of 905 to 941° F. (485 to 505° C.).
- coking formation of Petroleum Coke
- the thermodynamic conditions of the drum are well-suited for the cracking operation to proceed.
- These drums are designed to normally operate at a top drum vapor temperature of 825° F. (441° C.) and a pressure of 15 psig (103 kpag).
- the cracked products (vapors) are sent into a fractionator while coke accumulates in the drum.
- the fractionator separates the hydrocarbon mixture received from the coke drum into various fractions.
- the overhead product of the fractionator is sent through wet gas compressors to a light ends processing unit to further separate the light mixture.
- the feed from the furnace is directed to an empty drum.
- Multiple drums are thus operated in a staggered fashion to ensure continuity of operations of the furnaces, fractionator and the gas plant.
- the coke in the filled drum is quenched, cut and removed with high-pressure water to a pit located below the coke drums.
- a bridge crane is used to transfer coke from the pit to a pad where water is allowed to drain from the coke before it is crushed and loaded onto railcars for transport.
- the emptied drum is cleaned and readied for the next cycle.
- the furnaces are brought offline about once every 3 months to clean coke deposits formed over time in the tubes through a process known as “decoking”. In some refineries the furnaces are cleaned online through a process known as steam spalling.
- the delayed coking unit is thus capable of turndown to a nominal 50% of capacity which represents operation with one furnace and pair of drums out of service.
- the complete schematic with DCU and the downstream units is shown in FIG. 24 .
- the current commercial practice is to use advanced process control applications to automatically adjust the process in response to minor process disturbances, to rely on human process intervention for moderate to severe abnormal operations, and to use automatic emergency process shutdown systems for very severe abnormal operations.
- the normal practice to notify the console operator of the start of an abnormal process operation is through “process alarms”. These alarms are triggered when key process measurements (temperatures, pressures, flows, levels and compositions) violate predefined static set of operating ranges. These operating ranges are kept as wide as possible to avoid false alarms, and to avoid multiple related and repetitive alarms. Thus, when an alarm occurs, it is often too late for the operator to bring the process to normal operations without compromising the optimal production rates.
- DCS Distributed Control System
- the operator must survey this list of sensors and its trends, compare them with mental knowledge of normal DCU operation, and use their skill to discover the potential problems. Due to the very large number of sensors in an operating DCU, abnormalities can be and are easily missed.
- the DCS alarm system which is based on the alarming of each sensor when it violates predetermined limits. In any large-scale complex process such as the DCU, this type of notification is clearly a limitation as it often comes in too late for the operator to act to mitigate the problem.
- the present invention provides a more effective notification to the operator of the DCU.
- the present invention is a method and system for detecting an abnormal event for the process units of a DCU.
- the system and method compare the current operation to various models of normal operation for the covered units. If the difference between the operation of the unit and the normal operation indicates an abnormal condition in a process unit, then the cause of the abnormal condition is determined and relevant information is presented efficiently to the operator to take corrective actions.
- the method is for abnormal event detection (AED) for some process units of a delayed coking unit (DCU).
- the method includes steps of comparing online measurements from the process units to a set of models for normal operation of the corresponding process units, determining if the current operation differs from expected normal operations so as to indicate the presence of an abnormal condition in a process unit, and assisting the process operator to determine the underlying cause of an abnormal condition in the DCU.
- the system includes a set of models for the process units describing operations of the process units including automatic detection of drum switches and furnace decoking operations, a display which indicates if the current operation differs from expected normal operations so as to indicate the presence of an abnormal condition in the process unit, and a display which indicates the underlying cause of an abnormal condition in the DCU.
- FIG. 1 shows how the information in the online system flows through the various transformations, model calculations, fuzzy Petri nets and consolidation to arrive at a summary trend which indicates the normality/abnormality of the process areas.
- FIG. 2 shows a valve flow plot to the operator as a simple x-y plot.
- FIG. 3 shows three-dimensional redundancy expressed as a PCA model.
- FIG. 4 shows a schematic diagram of a fuzzy network setup.
- FIG. 5 shows a schematic diagram of the overall process for developing an abnormal event application.
- FIG. 6 shows a schematic diagram of the anatomy of a process control cascade.
- FIG. 7 shows a schematic diagram of the anatomy of a multivariable constraint controller, MVCC.
- FIG. 8 shows a schematic diagram of the on-line inferential estimate of current quality.
- FIG. 9 shows the KPI analysis of historical data.
- FIG. 10 shows a diagram of signal to noise ratio.
- FIG. 11 shows how the process dynamics can disrupt the correlation between the current values of two measurements.
- FIG. 12 shows the probability distribution of process data.
- FIG. 13 shows illustration of the press statistic
- FIG. 14 shows the two-dimensional energy balance model.
- FIG. 15 shows a typical stretch of Flow, Valve Position, and Delta Pressure data with the long period of constant operation.
- FIG. 16 shows a type 4 fuzzy discriminator.
- FIG. 17 shows a flow versus valve Pareto chart.
- FIG. 18 shows a schematic diagram of operator suppression logic.
- FIG. 19 shows a schematic diagram of event suppression logic.
- FIG. 20 shows the setting of the duration of event suppression.
- FIG. 21 shows the event suppression and the operator suppression disabling predefined sets of inputs in the PCA model.
- FIG. 22 shows how design objectives are expressed in the primary interfaces used by the operator.
- FIG. 23 shows the schematic layout of a DCU.
- FIG. 24 shows the typical overall schematic of DCU and the light ends towers displayed for monitoring and control at the operator console.
- FIG. 25 shows the operator display of all the problem monitors for the DCU operation along with a display of a log of recent alerts.
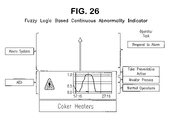
- FIG. 26 shows the components of fuzzy logic based continuous abnormality indicator.
- FIG. 27 shows the fuzzy logic network for detecting a level controller monitor problem.
- FIG. 28 shows that complete drill down for a Furnace Operation problem along with all the supporting evidences.
- FIG. 29 shows the overview display with a red triangle indicating that the furnace area has a problem. It also shows an alert message log indicating the exact nature of the problem and a list of the worst actors.
- FIG. 30 is a display that is shown to the operator when selecting the red triangle on FIG. 29 . This display indicates to the operator the sub-area of the furnace where the problem is most likely occurring.
- FIG. 31 shows the Pareto chart for the tags involved in the Furnace Abnormal operation scenario in FIG. 30 .
- FIG. 32 shows the multi-trends for the tags in FIG. 31 . It shows the current tag values and also the model predictions.
- FIG. 33 shows a more detailed trend including the control chart for the worst actor (first bar) shown in the Pareto chart of FIG. 31 .
- FIG. 34 shows the historical trend of the abnormality of the furnace sub-area. This trend will allow the operator to trace the last several problems and their corresponding drill downs similar to those shown in FIGS. 31 through 33 .
- FIG. 35 shows the Pareto chart for the furnace feed valves.
- FIG. 36 shows the X-Y plot for one of the furnace feed valves. This is displayed when the operator selects one of the valve bars from the Pareto chart in FIG. 35 .
- FIG. 37 shows the furnace Valve Flow Monitor fuzzy network
- FIG. 38 shows an example of valve out of controllable range.
- FIG. 39 shows the distribution of principal components during PCA model development.
- FIG. 40 shows the Alert Suppression networks used to suppress alerts during known events.
- the present invention is a method to provide early notification of abnormal conditions in sections of the DCU to the operator using Abnormal Event Detection (AED) technology.
- AED Abnormal Event Detection
- this method uses fuzzy logic to combine multiple supportive evidences of abnormalities that contribute to an operational problem and estimates its probability in real-time. This probability is presented as a continuous signal to the operator thus removing any chattering associated with the current single sensor alarming-based on/off methods.
- the operator is provided with a set of tools that allow complete investigation and drill down to the root cause of a problem for focused action. This approach has been demonstrated to furnish the operator with advanced warning of the abnormal operation that can be minutes to hours earlier than the conventional alarm system. This early notification lets the operator to make informed decision and take corrective action to avert any escalation or mishaps.
- This method has been successfully applied to the DCU. For example, FIG. 28 shows the complete drill down for a Furnace Operation Problem.
- the DCU application uses diverse sources of specific operational knowledge to combine indications from Principal Component Analysis (PCA), correlation-based engineering models, and relevant sensor transformations into several fuzzy logic networks.
- This fuzzy logic network aggregates the evidence and indicates the combined confidence level of a potential problem. Therefore, the network can detect a problem with higher confidence at its initial developing stages and provide crucial lead-time for the operator to take compensatory or corrective actions to avoid serious incidents.
- PCA Principal Component Analysis
- This is a key advantage over the present commercial practice of monitoring DCU based on single sensor alarming from a DCS system. Very often the alarm comes in too late for the operator to mitigate an operational problem due to the complicated, fast dynamic nature of DCU or (b) multiple alarms could flood the operator, confusing them and thus hindering rather than aiding in response.
- the present invention divides the DCU operation into the following overall monitors:
- the overall monitors carry out “gross model checking” to detect any deviation in the overall operation and cover a large number of sensors.
- the special concern monitors cover areas with potentially serious concerns and consist of focused models for early detection.
- the application provides for several practical tools such as those dealing with suppression of notifications generated from normal/routine operational events and elimination of false positives due to special cause operations such as drum-switching.
- the operator user interface is a critical component of the system as it provides the operator with a bird's eye view of the process.
- the display is intended to give the operator a quick overview of DCU operations and indicate the probability of any developing abnormalities.
- FIG. 25 shows the operator interface for the system.
- the interface consists of the abnormality monitors mentioned above. This was developed to represent the list of important abnormal indications in each operation area. Comparing model results with the state of key sensors generates abnormal indications. Fuzzy logic (described below) is used to aggregate abnormal indications to evaluate a single probability of a problem. Based on specific knowledge about the normal operation of each section, we developed a fuzzy logic network to take the input from sensors and model residuals to evaluate the probability of a problem.
- FIG. 26 shows the components of the probability indicator.
- FIG. 27 shows a logic network for a controller monitor.
- the green nodes show the sub problems that combine together to determine the final certainty of a level controller monitor problem.
- the estimated probability of an abnormal condition is shown to the operating team in a continuous trend to indicate the condition's progression.
- FIG. 28 shows the complete drill down of a furnace problem.
- FIG. 29 shows the operator display of a furnace operation problem along with continuous signal indications for all other problem areas.
- This display gives the operator a significant advantage to get an overview of the health of the process than having to check the status of each sensor individually. More importantly, it gives the operator ‘peace-of-mind’. Due to its extensive coverage, chances of missing any event are remote. So it is also used as a normality-indicator. When the probability of abnormality reaches 0.6, the problem indicator turns yellow (warning) and when the probability reaches 0.9 the indicator turns red (alert).
- This invention comprises of Principal Component Analysis (PCA) models to cover the areas of Furnaces (Heaters) and Gas Plant.
- PCA Principal Component Analysis
- the process units in the gas plant can be combined to build a single PCA model or the major gas plant columns can be separated to build multiple PCA models (e.g. absorber, debutanizer).
- PCA models e.g. absorber, debutanizer.
- the coverage of the PCA models was determined based on the interactions of the different processing units.
- special concern monitors intended to watch conditions that could escalate into serious events. The objective is to detect the problems early on so that the operator has sufficient lead-time to act.
- this invention has mechanism built-in to detect their onset and suppress the notifications.
- This mechanism is typically a logic network with a set of source conditions, which, when true, will suppress a set of pre-specified models.
- FIG. 30 shows the result of selecting the red triangle of FIG. 29 . It indicates that the West Heater (Furnace) Operation has a problem. This assists the operator in isolating and diagnosing the root cause of the condition so that compensatory or corrective actions can be taken.
- the Pareto-chart icon corresponding to the West Heater is selected, a Pareto chart indicating the residual (extent of abnormality) of deviating sensors sorted by their deviations, from worst to best is displayed as shown in FIG. 31 .
- FIG. 31 demonstrated this functionality through a list of sensors organized in a Pareto chart. Upon selecting an individual bar, a custom plot showing the tag trend versus model prediction for the sensor is created as shown in FIG. 33 . The operator can also look at trends of problem sensors together using the “multi-trend view”. For instance, FIG. 32 shows the trends of the value and model predictions of the sensors in the Pareto chart of FIG. 31 .
- FIG. 32 shows the trends of the value and model predictions of the sensors in the Pareto chart of FIG. 31 .
- FIG. 35 shows the same concept this time applied to the ranking of valve-flow monitors based on the normalized-projection-deviation error. Selecting the bar in this case generates an X-Y scatter plot of FIG. 36 that shows the current operation point in the context of the bounds of normal operation. A history of recent abnormality is also retained. The extent of retention is configurable in the system.
- FIG. 34 shows the historical trend of the abnormality of the furnace sub-area. This trend will allow the operator to trace the last several problems and their corresponding drill downs similar to those shown in FIGS. 31 through 33 . It must be noted that history is retained for the first onset of abnormality as indicated by the red asterisk in FIG. 34 , since this is the most relevant snapshot of abnormality.
- the advantages of this invention include:
- the application has PCA models, engineering relationship models and heuristics to detect abnormal operation in a DCU.
- the first steps involve analyzing the concerned unit for historical operational problems. This problem identification step is important to define the scope of the application.
- the first step in the application development is to identify a significant problem, which will benefit process operations.
- the abnormal event detection application in general can be applied to two different classes of problems.
- the first is a generic abnormal event application that monitors an entire process area looking for any abnormal event. This type will use several hundred measurements, but does not require a historical record of any specific abnormal operations.
- the application will only detect and link an abnormal event to a portion (tags) of the process. Diagnosis of the problem requires the skill of the operator or engineer.
- the second type is focused on a specific abnormal operation.
- This type will provide a specific diagnosis once the abnormality is detected. It typically involves only a small number of measurements (5-20), but requires a historical data record of the event.
- This model can be a PCA/PLS model or based on simple engineering correlations (e.g. mass/energy-balances, control action and corresponding process changes). This document covers both kinds of applications in order to provide extensive coverage. The operator or the engineer would then rely on their process knowledge/expertise to accurately diagnose the cause. Typically most of the events seem to be primarily the result of problems with the instruments and valves.
- PCA Principal Components
- Each principal component captures a unique portion of the process variability caused by these different independent influences on the process.
- the principal components are extracted in the order of decreasing process variation.
- Each subsequent principal component captures a smaller portion of the total process variability.
- the major principal components should represent significant underlying sources of process variation. As an example, the first principal component often represents the effect of feed rate changes since this is usually the largest single source of process changes.
- PCA Principal Component Analysis
- the application has PCA models covering the furnaces area (HEATER-PCA) and light ends towers (GASPLANT-PCA). This allows extensive coverage of the overall DCU operation and early alerts.
- the PCA model development comprises of the following steps:
- This data set should:
- the historical data spanned 1.5 years of operation to cover both summer and winter periods. With one-minute averaged data, the number of time stamped values turns out to be around 750,000+ for each tag. In order to make the data-set more manageable while still retaining underlying information, engineering judgment was applied and every 3rd point was retained resulting in about 250,000+ points for each sensor. This allowed the representative behavior to be captured by the PCA models.
- Basic statistics such as average, min/max and standard deviation are calculated for all the tags to determine the extent of variation/information contained within. Also, operating logs were examined to remove data contained within windows with known unit shutdowns or abnormal operations. Each candidate measurement was scrutinized to determine appropriateness for inclusion in the training data set.
- the historical data is divided into periods with known abnormal operations and periods with no identified abnormal operations.
- the data with no identified abnormal operations will be the preliminary training data set used for model development.
- PCs principal components
- the number of PCs should ultimately match the number of degrees of freedom in the process, however this is not usually known since this includes all the different sources of process disturbances.
- the training data set should now be run through this preliminary model to identify time periods where the data does not match the model. These time periods should be examined to see whether an abnormal event was occurring at the time. If this is judged to be the case, then these time periods should also be flagged as times with known abnormal events occurring. These time periods should be excluded from the training data set and the model rebuilt with the modified data.
- the process of creating balanced training data sets using data and process analysis is outlined in Section IV “Data & Process Analysis” under the section “Developing PCA Models for AED” in Appendix 1.
- the model development strategy is to start with a very rough model (the consequence of a questionable training data set) then use the model to gather a high quality training data set. This data is then used to improve the model, which is then used to continue to gather better quality training data. This process is repeated until the model is satisfactory.
- the model can be built quickly using standard statistical tools.
- An example of such a program showing the percent variance captured by each principal component is shown in FIG. 39 .
- the initial model needs to be enhanced by creating a new training data set. This is done by using the model to monitor the process. Once the model indicates a potential abnormal situation, the engineer should investigate and classify the process situation. The engineer will find three different situations, either some special process operation is occurring, an actual abnormal situation is occurring, or the process is normal and it is a false indication.
- the developer or site engineer may determine that it is necessary to improve one of the models. Either the process conditions have changed or the model is providing a false indication. In this event, the training data set could be augmented with additional process data and improved model coefficients could be obtained.
- the trigger points can be recalculated using the same rules of thumb mentioned previously.
- Old data that no longer adequately represents process operations should be removed from the training data set. If a particular type of operation is no longer being done, all data from that operation should be removed. After a major process modification, the training data and AED model may need to be rebuilt from scratch.
- the DCU PCA model started with an initial set of about 600 tags, which was then refined to about 300 tags.
- the Heater-PCA models include about 60 tags each.
- the Gas Plant-PCA model includes about 100 tags and covers the sections downstream of the main fractionator involved in the recovery—compressors, absorber and debutanizer ( FIG. 24 ). The details of the Heater-PCA models are shown in Appendix 2A and the Gas Plant-PCA model is described in Appendix 2B.
- the engineering models comprise of correlation-based models focused on specific detection of abnormal conditions.
- the detailed description of building engineering models can be found under “Simple Engineering Models for AED” section in Appendix 1.
- the engineering model requirements for the DCU application were determined by: performing an engineering evaluation of historical process data and interviews with console operators and equipment specialists.
- the engineering evaluation included areas of critical concern and worst case scenarios for DCU operation.
- the following engineering models were developed for the DCU AED application:
- the DCU has about 20 critical level and pressure control loops. These PID control loops are monitored to detect four different abnormal process conditions: Frozen process value which is indicative of a faulty instrument or control, highly variant process value, accumulation of significant control error outside a dead band, and process value staying on the same side of the set point for a significant length of time.
- the tuning parameters and thresholds for detecting these four conditions are set based on historical and statistical analysis of normal operations for a period of at least 3 months. Details of these control loops are provided in Appendix 3A.
- Process Consistency Monitors are checks that the console operator would otherwise perform based on years of process experience.
- the console operator knowledge, along with thresholds and tuning parameters are captured in these consistency checks. In the initial implementation 6 such checks have been included. Details follow and are also provided in Appendix 3B.
- the Heater Pass Flow Material Balance Monitor sums the individual pass flows (for example, sum of four flows in a furnace containing four passes) and compares it to the total pass flow meter. If these are inconsistent it is more than likely that at least one of the flow meters is erroneous.
- Main Fractionator Flooding Monitor monitors temperatures of two trays, in the flash zone and the bottom of the column, that are close to each other. If these temperatures are sufficiently close then that is indicative of flooding.
- Main Fractionator Overhead Accumulator to Flare Monitor monitors the consistency between two pressures in the overhead vapor line, one is the flare line pressure, and the other is the pressure in the compressor line. Inconsistency between these two could result in an undesirable hydrocarbon release.
- Debutanizer Bottoms Flooding Monitor monitors the difference between the debutanizer bottoms and the reboiler inlet temperatures. If this difference is less than a specific threshold while the debutanizer bottoms temperature is greater than a specified maximum, then that is indicative of flooding.
- Main Fractionator Overhead Accumulator Temperature Monitor monitors two temperatures in the overhead vapor line, with one of them used to control the fractionator reflux flow. Inconsistency between these temperatures could result undesirable fractionation in the column.
- CSO Cat Slurry Oil
- Steam Flow Monitor monitors the sum of the CSO and velocity steam flows. If there is no flow in this line, then it is possible to plug the line. This will result in improper plugging of the drum at the beginning of the coking cycle, which in turn can affect the type of coke produced and the cutting of coke.
- the Flow-Valve position consistency monitor was derived from a comparison of the measured flow (compensated for the pressure drop across the valve) with a model estimate of the flow. These are powerful checks as the condition of the control loops are being directly monitored in the process.
- the model estimate of the flow is obtained from historical data by fitting coefficients to the valve curve equation (assumed to be either linear or parabolic).
- 22 flow/valve position consistency models were developed. An example is shown in FIG. 36 for a heater feed valve. This valve is crucial in maintaining the corresponding pass temperature to avoid any tube coking. If allowed to develop, tube coking could bring the entire unit down and can result in several million dollars of production losses.
- the details of the valve flow models are given in Appendix 3C.
- a time-varying drift term was added to the model estimate to compensate for long term sensor drift.
- the operator can also request a reset of the drift term after a sensor recalibration or when a manual bypass valve has been opened or closed. This modification to the flow estimator significantly improved the robustness for implementation within an online detection algorithm.
- FIG. 37 shows both the components of the fuzzy net and an example of value-exceedance is shown in FIG. 38 .
- the procedure for implementing the engineering models within AED is straightforward.
- the trigger points for notification were determined from the statistical analysis of historical data in combination with console operator input.
- the computational models e.g. flow/valve position models
- the trigger points for notification were initially derived from the standard deviation of the model residual.
- known AED indications were reviewed with the operator to ensure that the trigger points were appropriate and modified as necessary. Section “Deploying PCA Models and Simple Engineering Models for AED” in Appendix 1 describes details of engineering model deployment.
- valve/flow diagnostics could provide the operator with redundant notification. Model suppression was applied to the valve/flow diagnostics to provide the operator with a single alert to a problem with a valve/flow pair. For instance, unless the sum of pass flows do not match with the total flow measurement into a heater within a pre-specified tolerance, the pass flow valves will not be activated.
- the operator typically makes many moves (e.g., set point changes, tags under maintenance, decokes etc.) and other process changes in routine daily operations.
- the system provides for event suppression.
- the step changes in the corresponding PV and other related tags might generate notifications.
- the result can be an abnormality signal.
- fuzzy net uses the condition check and the list of models to be suppressed as shown in FIG. 40 .
- tags in PCA models, valve flow models and fuzzy nets can be temporarily disabled for specified time periods by the operator and reactivated using a condition-based algorithm.
- a configurable automatic reactivation time of 12 hours is used to prevent operators from forgetting to reactivate.
- the developer should confirm that there is not a better way to solve the problem. In particular the developer should make the following checks before trying to build an abnormal event detection application.
- the alarm system will identify the problem as quickly as an abnormal event detection application.
- the sequence of events e.g. The order in which measurements become unusual
- abnormal event detection applications can give the operator advanced warning when abnormal events develop slowly (longer than 15 minutes). These applications are sensitive to a change in the pattern of the process data rather than requiring a large excursion by a single variable. Consequently alarms can be avoided. If the alarm system has been configured to alert the operator when the process moves away from a small operating region (not true safety alarms), this application may be able to replace these alarms.
- the AED system In addition to just detecting the presence of an abnormal event the AED system also isolates the deviant sensors for the operator to investigate the event. This is a crucial advantage considering that modern plants have thousands of sensors and it is humanly infeasible to monitor them all online. The AED system can thus be thought of as another powerful addition to the operator toolkit to deal with abnormal situations efficiently and effectively.
- a methodology and system has been developed to create and to deploy on-line, sets of models, which are used to detect abnormal operations and help the operator isolate the location of the root cause.
- the models employ principal component analysis (PCA).
- PCA principal component analysis
- These sets of models are composed of both simple models that represent known engineering relationships and principal component analysis (PCA) models that represent normal data patterns that exist within historical databases. The results from these many model calculations are combined into a small number of summary time trends that allow the process operator to easily monitor whether the process is entering an abnormal operation.
- FIG. 1 shows how the information in the online system flows through the various transformations, model calculations, fuzzy Petri nets and consolidations to arrive at a summary trend which indicates the normality/abnormality of the process areas.
- the heart of this system is the various models used to monitor the normality of the process operations.
- the PCA models described in this invention are intended to broadly monitor continuous refining and chemical processes and to rapidly detect developing equipment and process problems.
- the intent is to provide blanket monitoring of all the process equipment and process operations under the span of responsibility of a particular console operator post. This can involve many major refining or chemical process operating units (e.g. distillation towers, reactors, compressors, heat exchange trains, etc.), which have hundreds to thousands of process measurements.
- the monitoring is designed to detect problems which develop on a minutes to hours timescale, as opposed to long term performance degradation.
- the process and equipment problems do not need to be specified beforehand. This is in contrast to the use of PCA models cited in the literature which are structured to detect a specific important process problem and to cover a much smaller portion of the process operations.
- the method for PCA model development and deployment includes a number of novel extensions required for their application to continuous refining and chemical processes including:
- PCA models are supplemented by simple redundancy checks that are based on known engineering relationships that must be true during normal operations. These can be as simple as checking physically redundant measurements, or as complex as material and engineering balances.
- redundancy checks are simple 2 ⁇ 2 checks, e.g.
- Multidimensional checks are represented with “PCA like” models.
- FIG. 3 there are three independent and redundant measures, X 1 , X 2 , and X 3 . Whenever X 3 changes by one, X 1 changes by a 13 and X 2 changes by a 23 .
- This set of relationships is expressed as a PCA model with a single principal component direction, P.
- This type of model is presented to the operator in a manner similar to the broad PCA models.
- the gray area shows the area of normal operations.
- the principal component loadings of P are directly calculated from the engineering equations, not in the traditional manner of determining P from the direction of greatest variability.
- Each statistical index from the PCA models is fed into a fuzzy Petri net to convert the index into a zero to one scale, which continuously indicates the range from normal operation (value of zero) to abnormal operation (value of one).
- Each redundancy check is also converted to a continuous normal—abnormal indication using fuzzy nets.
- fuzzy nets There are two different indices used for these models to indicate abnormality; deviation from the model and deviation outside the operating range (shown on FIG. 3 ). These deviations are equivalent to the sum of the square of the error and the Hotelling T square indices for PCA models. For checks with dimension greater than two, it is possible to identify which input has a problem. In FIG. 3 , since the X 3 ⁇ X 2 relationship is still within the normal envelope, the problem is with input X 1 .
- Each deviation measure is converted by the fuzzy Petri net into a zero to one scale that will continuously indicate the range from normal operation (value of zero) to abnormal operation (value of one).
- the overall process for developing an abnormal event application is shown in FIG. 5 .
- the basic development strategy is iterative where the developer starts with a rough model, then successively improves that model's capability based on observing how well the model represents the actual process operations during both normal operations and abnormal operations.
- the models are then restructured and retrained based on these observations.
- console operator is expected to diagnosis the process problem based on his process knowledge and training.
- the initial decision is to create groups of equipment that will be covered by a single PCA model.
- the specific process units included requires an understanding of the process integration/interaction. Similar to the design of a multivariable constraint controller, the boundary of the PCA model should encompass all significant process interactions and key upstream and downstream indications of process changes and disturbances.
- Equipment groups are defined by including all the major material and energy integrations and quick recycles in the same equipment group. If the process uses a multivariable constraint controller, the controller model will explicitly identify the interaction points among the process units. Otherwise the interactions need to be identified through an engineering analysis of the process.
- Process groups should be divided at a point where there is a minimal interaction between the process equipment groups. The most obvious dividing point occurs when the only interaction comes through a single pipe containing the feed to the next downstream unit.
- the temperature, pressure, flow, and composition of the feed are the primary influences on the downstream equipment group and the pressure in the immediate downstream unit is the primary influence on the upstream equipment group.
- the process control applications provide additional influence paths between upstream and downstream equipment groups. Both feedforward and feedback paths can exist. Where such paths exist the measurements which drive these paths need to be included in both equipment groups. Analysis of the process control applications will indicate the major interactions among the process units.
- Process operating modes are defined as specific time periods where the process behavior is significantly different. Examples of these are production of different grades of product (e.g. polymer production), significant process transitions (e.g. startups, shutdowns, feedstock switches), processing of dramatically different feedstock (e.g. cracking naphtha rather than ethane in olefins production), or different configurations of the process equipment (different sets of process units running).
- grades of product e.g. polymer production
- significant process transitions e.g. startups, shutdowns, feedstock switches
- processing of dramatically different feedstock e.g. cracking naphtha rather than ethane in olefins production
- different configurations of the process equipment different sets of process units running.
- the signal to noise ratio is a measure of the information content in the input signal.
- the signal to noise ratio is calculated as follows:
- the data set used to calculate the S/N should exclude any long periods of steady-state operation since that will cause the estimate for the noise content to be excessively large.
- the cross correlation is a measure of the information redundancy the input data set.
- the cross correlation between any two signals is calculated as:
- the first circumstance occurs when there is no significant correlation between a particular input and the rest of the input data set. For each input, there must be at least one other input in the data set with a significant correlation coefficient, such as 0.4.
- the second circumstance occurs when the same input information has been (accidentally) included twice, often through some calculation, which has a different identifier. Any input pairs that exhibit correlation coefficients near one (for example above 0.95) need individual examination to determine whether both inputs should be included in the model. If the inputs are physically independent but logically redundant (i.e., two independent thermocouples are independently measuring the same process temperature) then both these inputs should be included in the model.
- the process control system could be configured on an individual measurement basis to either assign a special code to the value for that measurement to indicate that the measurement is a Bad Value, or to maintain the last good value of the measurement. These values will then propagate throughout any calculations performed on the process control system. When the “last good value” option has been configured, this can lead to erroneous calculations that are difficult to detect and exclude. Typically when the “Bad Value” code is propagated through the system, all calculations which depend on the bad measurement will be flagged bad as well.
- Constrained variables are ones where the measurement is at some limit, and this measurement matches an actual process condition (as opposed to where the value has defaulted to the maximum or minimum limit of the transmitter range—covered in the Bad Value section). This process situation can occur for several reasons:
- FIG. 6 shows a typical “cascade” process control application, which is a very common control structure for refining and chemical processes. Although there are many potential model inputs from such an application, the only ones that are candidates for the model are the raw process measurements (the “PVs” in this figure) and the final output to the field valve.
- PVs the raw process measurements
- the PV of the ultimate primary of the cascade control structure is a poor candidate for inclusion in the model.
- This measurement usually has very limited movement since the objective of the control structure is to keep this measurement at the set point.
- There can be movement in the PV of the ultimate primary if its set point is changed but this usually is infrequent.
- the data patterns from occasional primary set point moves will usually not have sufficient power in the training dataset for the model to characterize the data pattern.
- this measurement should be scaled based on those brief time periods during which the operator has changed the set point and until the process has moved close to the vale of the new set point (for example within 95% of the new set point change thus if the set point change is from 10 to 11, when the PV reaches 10.95)
- thermocouples located near a temperature measurement used as a PV for an Ultimate Primary. These redundant measurements should be treated in the identical manner that is chosen for the PV of the Ultimate Primary.
- Cascade structures can have set point limits on each secondary and can have output limits on the signal to the field control valve. It is important to check the status of these potentially constrained operations to see whether the measurement associated with a set point has been operated in a constrained manner or whether the signal to the field valve has been constrained. Date during these constrained operations should not be used.
- FIG. 7 shows a typical MVCC process control application, which is a very common control structure for refining and chemical processes.
- An MVCC uses a dynamic mathematical model to predict how changes in manipulated variables, MVs, (usually valve positions or set points of regulatory control loops) will change control variables, CVs (the dependent temperatures, pressures, compositions and flows which measure the process state).
- An MVCC attempts to push the process operation against operating limits. These limits can be either MV limits or CV limits and are determined by an external optimizer. The number of limits that the process operates against will be equal to the number of MVs the controller is allowed to manipulate minus the number of material balances controlled. So if an MVCC has 12 MVs, 30 CVs and 2 levels then the process will be operated against 10 limits.
- An MVCC will also predict the effect of measured load disturbances on the process and compensate for these load disturbances (known as feed forward variables, FF).
- Whether or not a raw MV or CV is a good candidate for inclusion in the PCA model depends on the percentage of time that MV or CV is held against its operating limit by the MVCC. As discussed in the Constrained Variables section, raw variables that are constrained more than 10% of the time are poor candidates for inclusion in the PCA model. Normally unconstrained variables should be handled per the Constrained Variables section discussion.
- an unconstrained MV is a set point to a regulatory control loop
- the set point should not be included; instead the measurement of that regulatory control loop should be included.
- the signal to the field valve from that regulatory control loop should also be included.
- an unconstrained MV is a signal to a field valve position, then it should be included in the model.
- the process control system databases can have a significant redundancy among the candidate inputs into the PCA model.
- One type of redundancy is “physical redundancy”, where there are multiple sensors (such as thermocouples) located in close physical proximity to each other within the process equipment.
- the other type of redundancy is “calculational redundancy”, where raw sensors are mathematically combined into new variables (e.g. pressure compensated temperatures or mass flows calculated from volumetric flow measurements).
- both the raw measurement and an input which is calculated from that measurement should not be included in the model.
- the general preference is to include the version of the measurement that the process operator is most familiar with.
- the exception to this rule is when the raw inputs must be mathematically transformed in order to improve the correlation structure of the data for the model. In that case the transformed variable should be included in the model but not the raw measurement.
- Physical redundancy is very important for providing cross validation information in the model.
- raw measurements which are physically redundant, should be included in the model.
- these measurements must be specially scaled so as to prevent them from overwhelming the selection of principal components (see the section on variable scaling).
- a common process example occurs from the large number of thermocouples that are placed in reactors to catch reactor runaways.
- the developer can identify the redundant measurements by doing a cross-correlation calculation among all of the candidate inputs. Those measurement pairs with a very high cross-correlation (for example above 0.95) should be individually examined to classify each pair as either physically redundant or calculationally redundant.
- Span the normal operating range Datasets, which span small parts of the operating range, are composed mostly of noise. The range of the data compared to the range of the data during steady state operations is a good indication of the quality of the information in the dataset.
- History should be as similar as possible to the data used in the on-line system:
- the online system will be providing spot values at a frequency fast enough to detect the abnormal event. For continuous refining and chemical operations this sampling frequency will be around one minute.
- the training data should be as equivalent to one-minute spot values as possible.
- the strategy for data collection is to start with a long operating history (usually in the range of 9 months to 18 months), then try to remove those time periods with obvious or documented abnormal events. By using such a long time period,
- the training data set needs to have examples of all the normal operating modes, normal operating changes and changes and normal minor disturbances that the process experiences. This is accomplished by using data from over a long period of process operations (e.g. 9-18 months). In particular, the differences among seasonal operations (spring, summer, fall and winter) can be very significant with refinery and chemical processes.
- the model would start with a short initial set of training data (e.g. 6 weeks) then the training dataset is expanded as further data is collected and the model updated monthly until the models are stabilized (e.g. the model coefficients don't change with the addition of new data)
- the various operating journals for this time period should also be collected. This will be used to designate operating time periods as abnormal, or operating in some special mode that needs to be excluded from the training dataset. In particular, important historical abnormal events can be selected from these logs to act as test cases for the models.
- Old data that no longer properly represents the current process operations should be removed from the training data set. After a major process modification, the training data and PCA model may need to be rebuilt from scratch. If a particular type of operation is no longer being done, all data from that operation should be removed from the training data set.
- Operating logs should be used to identify when the process was run under different operating modes. These different modes may require separate models. Where the model is intended to cover several operating modes, the number of samples in the training dataset from each operating model should be approximately equivalent.
- the developer should gather several months of process data using the site's process historian, preferably getting one minute spot values. If this is not available, the highest resolution data, with the least amount of averaging should be used.
- FIG. 8 shows the online calculation of a continuous quality estimate. This same model structure should be created and applied to the historical data. This quality estimate then becomes the input into the PCA model.
- the quality of historical data is difficult to determine.
- the inclusion of abnormal operating data can bias the model.
- the strategy of using large quantities of historical data will compensate to some degree the model bias caused by abnormal operating in the training data set.
- the model built from historical data that predates the start of the project must be regarded with suspicion as to its quality.
- the initial training dataset should be replaced with a dataset, which contains high quality annotations of the process conditions, which occur during the project life.
- the model development strategy is to start with an initial “rough” model (the consequence of a questionable training data set) then use the model to trigger the gathering of a high quality training data set.
- annotations and data will be gathered on normal operations, special operations, and abnormal operations. Anytime the model flags an abnormal operation or an abnormal event is missed by the model, the cause and duration of the event is annotated. In this way feedback on the model's ability to monitor the process operation can be incorporated in the training data.
- This data is then used to improve the model, which is then used to continue to gather better quality training data. This process is repeated until the model is satisfactory.
- the historical data is divided into periods with known abnormal operations and periods with no identified abnormal operations.
- the data with no identified abnormal operations will be the training data set.
- the training data set should now be run through this preliminary model to identify time periods where the data does not match the model. These time periods should be examined to see whether an abnormal event was occurring at the time. If this is judged to be the case, then these time periods should also be flagged as times with known abnormal events occurring. These time periods should be excluded from the training data set and the model rebuilt with the modified data.
- FIG. 9 shows a histogram of a KPI. Since the operating goal for this KPI is to maximize it, the operating periods where this KPI is low are likely abnormal operations. Process qualities are often the easiest KPIs to analyze since the optimum operation is against a specification limit and they are less sensitive to normal feed rate variations.
- Noise we are referring to the high frequency content of the measurement signal which does not contain useful information about the process.
- Noise can be caused by specific process conditions such as two-phase flow across an orifice plate or turbulence in the level. Noise can be caused by electrical inductance. However, significant process variability, perhaps caused by process disturbances is useful information and should not be filtered out.
- the amount of noise in the signal can be quantified by a measure known as the signal to noise ratio (see FIG. 10 ). This is defined as the ratio of the amount of signal variability due to process variation to the amount of signal variability due to high frequency noise. A value below four is a typical value for indicating that the signal has substantial noise, and can harm the model's effectiveness.
- Signals with very poor signal to noise ratios may not be sufficiently improved by filtering techniques to be directly included in the model.
- the scaling of the variable should be set to de-sensitize the model by significantly increasing the size of the scaling factor (typically by a factor in the range of 2-10).
- Transformed variables should be included in the model for two different reasons.
- FIG. 11 shows how the process dynamics can disrupt the correlation between the current values of two measurements.
- one value is constantly changing while the other is not, so there is no correlation between the current values during the transition.
- these two measurements can be brought back into time synchronization by transforming the leading variable using a dynamic transfer function.
- a first order with deadtime dynamic model shown in Equation 9 in the Laplace transform format
- the process measurements are transformed to deviation variables: deviation from a moving average operating point. This transformation to remove the average operating point is required when creating PCA models for abnormal event detection. This is done by subtracting the exponentially filtered value (see Equations 8 and 9 for exponential filter equations) of a measurement from its raw value and using this difference in the model.
- X′ X ⁇ X filtered Equation 10
- the time constant for the exponential filter should be about the same size as the major time constant of the process. Often a time constant of around 40 minutes will be adequate.
- the consequence of this transformation is that the inputs to the PCA model are a measurement of the recent change of the process from the moving average operating point.
- the data In order to accurately perform this transform, the data should be gathered at the sample frequency that matches the on-line system, often every minute or faster. This will result in collecting 525,600 samples for each measurement to cover one year of operating data. Once this transformation has been calculated, the dataset is resampled to get down to a more manageable number of samples, typically in the range of 30,000 to 50,000 samples.
- the model can be built quickly using standard tools.
- the scaling should be based on the degree of variability that occurs during normal process disturbances or during operating point changes not on the degree of variability that occurs during continuous steady state operations.
- First is to identify time periods where the process was not running at steady state, but was also not experiencing a significant abnormal event.
- a limited number of measurements act as the key indicators of steady state operations. These are typically the process key performance indicators and usually include the process feed rate, the product production rates and the product quality. These key measures are used to segment the operations into periods of normal steady state operations, normally disturbed operations, and abnormal operations. The standard deviation from the time periods of normally disturbed operations provides a good scaling factor for most of the measurements.
- the scaling factor can be approximated by looking at the data distribution outside of 3 standard deviations from the mean. For example, 99.7% of the data should lie, within 3 standard deviations of the mean and that 99.99% of the data should lie, within 4 standard deviations of the mean.
- the span of data values between 99.7% and 99.99% from the mean can act as an approximation for the standard deviation of the “disturbed” data in the data set. See FIG. 12 .
- PCA transforms the actual process variables into a set of independent variables called Principal Components, PC, which are linear combinations of the original variables (Equation 13).
- PC i A i,1 *X 1 +A i,2 *X 2 +A i,3 *X 3 + . . . Equation 13
- Process variation can be due to intentional changes, such as feed rate changes, or unintentional disturbances, such as ambient temperature variation.
- Each principal component models a part of the process variability caused by these different independent influences on the process.
- the principal components are extracted in the direction of decreasing variation in the data set, with each subsequent principal component modeling less and less of the process variability.
- Significant principal components represent a significant source of process variation, for example the first principal component usually represents the effect of feed rate changes since this is usually the source of the largest process changes. At some point, the developer must decide when the process variation modeled by the principal components no longer represents an independent source of process variation.
- the engineering approach to selecting the correct number of principal components is to stop when the groups of variables, which are the primary contributors to the principal component no longer make engineering sense.
- the primary cause of the process variation modeled by a PC is identified by looking at the coefficients, A i,n , of the original variables (which are called loadings). Those coefficients, which are relatively large in magnitude, are the major contributors to a particular PC.
- Someone with a good understanding of the process should be able to look at the group of variables, which are the major contributors to a PC and assign a name (e.g. feed rate effect) to that PC.
- the coefficients become more equal in size. At this point the variation being modeled by a particular PC is primarily noise.
- the process data will not have a gaussian or normal distribution. Consequently, the standard statistical method of setting the trigger for detecting an abnormal event at 3 standard deviations of the error residual should not be used. Instead the trigger point needs to be set empirically based on experience with using the model.
- the trigger level should be set so that abnormal events would be signaled at a rate acceptable to the site engineer, typically 5 or 6 times each day. This can be determined by looking at the SPE x statistic for the training data set (this is also referred to as the Q statistic or the DMOD x statistic). This level is set so that real abnormal events will not get missed but false alarms will not overwhelm the site engineer.
- the initial model needs to be enhanced by creating a new training data set. This is done by using the model to monitor the process. Once the model indicates a potential abnormal situation, the engineer should investigate and classify the process situation. The engineer will find three different situations, either some special process operation is occurring, an actual abnormal situation is occurring, or the process is normal and it is a false indication.
- the new training data set is made up of data from special operations and normal operations. The same analyses as were done to create the initial model need to be performed on the data, and the model re-calculated. With this new model the trigger lever will still be set empirically, but now with better annotated data, this trigger point can be tuned so as to only give an indication when a true abnormal event has occurred.
- the “filtered bias” term updates continuously to account for persistent unmeasured process changes that bias the engineering redundancy model.
- the convergence factor, “N”, is set to eliminate any persistent change after a user specified time period, usually on the time scale of days.
- the “normal operating range” and the “normal model deviation” are determined from the historical data for the engineering redundancy model. In most cases the max_error value is a single value; however this can also be a vector of values that is dependent on the x axis location.
- FIG. 14 shows a two dimensional energy balance.
- a particularly valuable engineering redundancy model is the flow versus valve position model. This model is graphically shown in FIG. 2 .
- the particular form of this model is:
- FIG. 15 shows a typical stretch of Flow, Valve Position, and Delta Pressure data with the long periods of constant operation.
- the first step is to isolate the brief time periods where there is some significant variation in the operation, as shown. This should be then mixed with periods of normal operation taken from various periods in history.
- the valves characteristic curve can be either fit with a linear valve curve, with a quadratic valve curve or with a piecewise linear function.
- the piecewise linear function is the most flexible and will fit any form of valve characteristic curve.
- the model is developed in two phases, first where a small dataset, which only contains periods of Delta Pressure variation is used to fit the model. Then the pressure dependent parameters (“a” and perhaps the missing upstream or downstream pressure) are fixed at the values determined, and the model is re-developed with the larger dataset.
- the “normal operating range” As with any two-dimensional engineering redundancy model, there are two measures of abnormality, the “normal operating range” and the “normal model deviation”.
- the “normal model deviation” is based on a normalized index: the error/max_error. This is fed into a type 4 fuzzy discriminator ( FIG. 16 ). The developer can pick the transition from normal (value of zero) to abnormal (value of 1) in a standard way by using the normalized index.
- the “normal operating range” index is the valve position distance from the normal region. It typically represents the operating region of the valve where a change in valve position will result in little or no change in the flow through the valve.
- a common way of grouping Flow/Valve models which is favored by the operators is to put all of these models into a single fuzzy network so that the trend indicator will tell them that all of their critical flow controllers are working.
- the model indications into the fuzzy network ( FIG. 4 ) will contain the “normal operating range” and the “normal model deviation” indication for each of the flow/valve models.
- the trend will contain the discriminator result from the worst model indication.
- FIG. 17 When a common equipment type is grouped together, another operator favored way to look at this group is through a Pareto chart of the flow/valves ( FIG. 17 ).
- the top 10 abnormal valves are dynamically arranged from the most abnormal on the left to the least abnormal on the right.
- Each Pareto bar also has a reference box indicating the degree of variation of the model abnormality indication that is within normal.
- the chart in FIG. 17 shows that “Valve 10 ” is substantially outside the normal box but that the others are all behaving normally. The operator would next investigate a plot for “Valve 10 ” similar to FIG. 2 to diagnose the problem with the flow control loop.
- This engineering unit version of the model can be converted to a standard PCA model format as follows:
- the multidimensional engineering redundancy model can now be handled using the standard PCA structure for calculation, exception handling, operator display and interaction.
- suppression which is automatically triggered by an external, measurable event
- suppression which is initiated by the operator.
- the logic behind these two types of suppression is shown in FIGS. 18 and 19 . Although these diagrams show the suppression occurring on a fuzzified model index, suppression can occur on a particular measurement, on a particular model index, on an entire model, or on a combination of models within the process area.
- timers For operator initiated suppression, there are two timers, which determine when the suppression is over. One timer verifies that the suppressed information has returned to and remains in the normal state. Typical values for this timer are from 15-30 minutes. The second timer will reactivate the abnormal event check, regardless of whether it has returned to the normal state. Typical values for this timer are either equivalent to the length of the operator's work shift (8 to 12 hours) or a very large time for semi-permanent suppression.
- a measurable trigger is required. This can be an operator set point change, a sudden measurement change, or a digital signal. This signal is converted into a timing signal, shown in FIG. 20 .
- timing signal As long as the timing signal is above a threshold (shown as 0.05 in FIG. 20 ), the event remains suppressed.
- the developer sets the length of the suppression by changing the filter time constant, T f . Although a simple timer could also be used for this function, this timing signal will account for trigger signals of different sizes, creating longer suppressions for large changes and shorter suppressions for smaller changes.
- FIG. 21 shows the event suppression and the operator suppression disabling predefined sets of inputs in the PCA model.
- the set of inputs to be automatically suppressed is determined from the on-line model performance. Whenever the PCA model gives an indication that the operator does not want to see, this indication can be traced to a small number of individual contributions to the Sum of Error Square index. To suppress these individual contributions, the calculation of this index is modified as follows:
- the contribution weights are set to zero for each of the inputs that are to be suppressed.
- the contribution weight is gradually returned to a value of 1.
- the model indices can be segregated into groupings that better match the operators' view of the process and can improve the sensitivity of the index to an abnormal event.
- these groupings are based around smaller sub-units of equipment (e.g. reboiler section of a tower), or are sub-groupings, which are relevant to the function of the equipment (e.g. product quality).
- each principal component can be subdivided to match the equipment groupings and an index analogous to the Hotelling T 2 index can be created for each subgroup.
- the thresholds for these indices are calculated by running the testing data through the models and setting the sensitivity of the thresholds based on their performance on the test data.
- Inputs will appear in several PCA models so that all interactions affecting the model are encompassed within the model. This can cause multiple indications to the operator when these inputs are the major contributors to the sum of error squared index.
- any input which appears in multiple PCA models, is assigned one of those PCA models as its primary model.
- the contribution weight in Equation 29 for the primary PCA model will remain at one while for the non-primary PCA models, it is set to zero.
- the primary objectives of the operator interface are to:
- the final output from a fuzzy Petri net is a normality trend as is shown in FIG. 4 .
- This trend represents the model index that indicates the greatest likelihood of abnormality as defined in the fuzzy discriminate function.
- the number of trends shown in the summary is flexible and decided in discussions with the operators.
- On this trend are two reference lines for the operator to help signal when they should take action, a yellow line typically set at a value of 0.6 and a red line typically set at a value of 0.9. These lines provide guidance to the operator as to when he is expected to take action.
- the green triangle in FIG. 4 will turn yellow and when the trend crosses the red line, the green triangle will turn red.
- the triangle also has the function that it will take the operator to the display associated with the model giving the most abnormal indication.
- the model is a PCA model or it is part of an equipment group (e.g. all control valves)
- selecting the green triangle will create a Pareto chart.
- a PCA model of the dozen largest contributors to the model index, this will indicate the most abnormal (on the left) to the least abnormal (on the right)
- the key abnormal event indicators will be among the first 2 or 3 measurements.
- the Pareto chart includes a red box around each bar to provide the operator with a reference as to how unusual the measurement can be before it is regarded as an indication of abnormality.
- the HEATER PCA Model 5 Principal Components (Named) With Sensor Description, Engineering Units, and Principal Component Loading
- the GASPLANT PCA Model 6 Principal Components (Named) With Sensor Description, Engineering Units, and Principal Component Loading
- ABS REFLUX-LEAN OIL KBBL/D 3.32E ⁇ 01 ABS REFLUX-LEAN OIL Output % 2.87E ⁇ 01 3 DEB BTMS LVL Output % ⁇ 2.84E ⁇ 01 4 NAPHTHA TO STORAGE KBBL/D ⁇ 2.81E ⁇ 01 5 NAPHTHA TO STORAGE Output % ⁇ 2.63E ⁇ 01 6 NAPTHA TO ABS KBBL/D ⁇ 2.59E ⁇ 01 7 M.F.
- Control Deadband A threshold set to evaluate control offset error or accumulated controller error
- Accumulated Error Tolerance AET: Signed Value representing the cumulative error (PV-SP) over a specified time. Accumulation starts when PV is outside the dead band (CDB) and stays on the same side of the set point.
- High Standard Deviation Threshold HST: Value to be compared with current standard deviation calculated over SDTW minutes
- High Standard Deviation Tolerance (HSTM) If current value of standard deviation remains above HST for HSTM minutes instrument is considered to be highly variant.
- Tolerance Value (of Name Calculation absolute value) Units Heat Pass Flows Monitor Sum of individual pass Must be less than BBL/D flows - the total flow 2000 for each furnace Main Fractionator Flooding Flash Zone Must be greater than DEGF Monitor Temperature - 50 Bottoms Temperature Main Fractionator Overhead Overhead Cannot be greater DEGF Temperature Monitor Temperature - than 3 Overhead Outlet Temperature Main Fractionator Overhead Overhead Flare Line 1 PSIG Accumulator to Flare Monitor Pressure - Overhead Compressor Line Pressure Debutanizer Bottoms Debutanizer Bottoms Debutanizer Bottoms Debut Btms >250 DEGF Flooding Monitor Temperature - Delta >10 Reboiler Inlet Temperature Cat Slurry Oil and Steam CSO Flow + 150 # Must be greater than BBL/D Flow Monitor Steam Flow for each 0.01 (Hydrocarbon) heater LB/H (Steam) C.
- Valve-Flow-Models 22 valve-flow models have been developed for the DCU AED application. All the valve models have bias-updating implemented. The flow is compensated for the Delta Pressure in this manner: Compensated Flow FL/(DP/StdDP) ⁇ A where,
- HTR BBL/D 507.764 0.2 1312.5 1ST PASS-W.
- HTR BBL/D 747.437 0 1181.25 2ND PASS-W.
- HTR BBL/D 657.98 0 1312.5 3RD PASS-W.
- HTR BBL/D 667.437 0 1200 4TH PASS-W.
- HTR BBL/D 653.891 0 1200
Landscapes
- Engineering & Computer Science (AREA)
- Chemical & Material Sciences (AREA)
- Physics & Mathematics (AREA)
- Oil, Petroleum & Natural Gas (AREA)
- Chemical Kinetics & Catalysis (AREA)
- General Physics & Mathematics (AREA)
- Automation & Control Theory (AREA)
- General Chemical & Material Sciences (AREA)
- Materials Engineering (AREA)
- Organic Chemistry (AREA)
- Artificial Intelligence (AREA)
- Evolutionary Computation (AREA)
- Mathematical Physics (AREA)
- Testing And Monitoring For Control Systems (AREA)
- Testing Or Calibration Of Command Recording Devices (AREA)
Priority Applications (6)
| Application Number | Priority Date | Filing Date | Title |
|---|---|---|---|
| US11/786,950 US7720641B2 (en) | 2006-04-21 | 2007-04-13 | Application of abnormal event detection technology to delayed coking unit |
| PCT/US2007/009576 WO2007124002A2 (en) | 2006-04-21 | 2007-04-19 | Application of abnormal event detection technology to delayed coking unit |
| CA2649863A CA2649863C (en) | 2006-04-21 | 2007-04-19 | Application of abnormal event detection technology to delayed coking unit |
| JP2009506582A JP2009534746A (ja) | 2006-04-21 | 2007-04-19 | 異常事象検出技術のディレードコーキングユニットへの適用 |
| EP07775776.3A EP2021965A4 (de) | 2006-04-21 | 2007-04-19 | Anwendung einer technologie zur erkennung anomaler ereignisse auf einen delayed-koker |
| NO20084879A NO20084879L (no) | 2006-04-21 | 2008-11-20 | Anvendelse av abnorm deteksjonsteknologi pa forsinket forkokningsenhet |
Applications Claiming Priority (2)
| Application Number | Priority Date | Filing Date | Title |
|---|---|---|---|
| US79429606P | 2006-04-21 | 2006-04-21 | |
| US11/786,950 US7720641B2 (en) | 2006-04-21 | 2007-04-13 | Application of abnormal event detection technology to delayed coking unit |
Publications (2)
| Publication Number | Publication Date |
|---|---|
| US20070250292A1 US20070250292A1 (en) | 2007-10-25 |
| US7720641B2 true US7720641B2 (en) | 2010-05-18 |
Family
ID=38620537
Family Applications (1)
| Application Number | Title | Priority Date | Filing Date |
|---|---|---|---|
| US11/786,950 Active US7720641B2 (en) | 2006-04-21 | 2007-04-13 | Application of abnormal event detection technology to delayed coking unit |
Country Status (6)
| Country | Link |
|---|---|
| US (1) | US7720641B2 (de) |
| EP (1) | EP2021965A4 (de) |
| JP (1) | JP2009534746A (de) |
| CA (1) | CA2649863C (de) |
| NO (1) | NO20084879L (de) |
| WO (1) | WO2007124002A2 (de) |
Cited By (36)
| Publication number | Priority date | Publication date | Assignee | Title |
|---|---|---|---|---|
| US20090149981A1 (en) * | 2007-08-14 | 2009-06-11 | Wayne Errol Evans | System and methods for continuous, online monitoring of a chemical plant or refinery |
| US20090240637A1 (en) * | 2008-03-18 | 2009-09-24 | Youssef Drissi | Resilient classifier for rule-based system |
| US8903973B1 (en) | 2008-11-10 | 2014-12-02 | Tanium Inc. | Parallel distributed network management |
| US8904039B1 (en) | 2008-11-10 | 2014-12-02 | Tanium Inc. | Large-scale network querying and reporting |
| US8972566B1 (en) * | 2008-11-10 | 2015-03-03 | Tanium Inc. | Distributed statistical detection of network problems and causes |
| US9059961B2 (en) | 2012-12-21 | 2015-06-16 | Tanium Inc. | Creation and maintenance of self-organizing communication orbits in distributed networks |
| US20150212501A1 (en) * | 2014-01-30 | 2015-07-30 | Exxonmobil Research And Engineering Company | Real time optimization of batch processes |
| US9667738B2 (en) | 2014-03-24 | 2017-05-30 | Tanium Inc. | Local data caching for data transfers on a network of computational devices |
| US9769275B2 (en) | 2014-03-24 | 2017-09-19 | Tanium Inc. | Data caching and distribution in a local network |
| US9769037B2 (en) | 2013-11-27 | 2017-09-19 | Tanium Inc. | Fast detection and remediation of unmanaged assets |
| US9910752B2 (en) | 2015-04-24 | 2018-03-06 | Tanium Inc. | Reliable map-reduce communications in a decentralized, self-organizing communication orbit of a distributed network |
| US10047956B2 (en) | 2014-10-22 | 2018-08-14 | Honeywell International Inc. | Monitoring efficiency and operational mode changes of combustion equipment |
| US10048238B2 (en) | 2014-06-27 | 2018-08-14 | Union Carbide Chemicals & Plastics Technology Llc | Method of monitoring production of a chemical product and a chromatograph used therewith |
| US10095864B2 (en) | 2016-03-08 | 2018-10-09 | Tanium Inc. | System and method for performing event inquiries in a network |
| US20180306443A1 (en) * | 2017-04-24 | 2018-10-25 | Honeywell International Inc. | Apparatus and method for two-stage detection of furnace flooding or other conditions |
| US10498744B2 (en) | 2016-03-08 | 2019-12-03 | Tanium Inc. | Integrity monitoring in a local network |
| US10824729B2 (en) | 2017-07-14 | 2020-11-03 | Tanium Inc. | Compliance management in a local network |
| US10841365B2 (en) | 2018-07-18 | 2020-11-17 | Tanium Inc. | Mapping application dependencies in a computer network |
| US10873645B2 (en) | 2014-03-24 | 2020-12-22 | Tanium Inc. | Software application updating in a local network |
| US10929345B2 (en) | 2016-03-08 | 2021-02-23 | Tanium Inc. | System and method of performing similarity search queries in a network |
| US11153383B2 (en) | 2016-03-08 | 2021-10-19 | Tanium Inc. | Distributed data analysis for streaming data sources |
| WO2021242488A1 (en) * | 2020-05-29 | 2021-12-02 | Imubit Israel Ltd | Systems and methods for optimizing refinery coker process |
| US11343355B1 (en) | 2018-07-18 | 2022-05-24 | Tanium Inc. | Automated mapping of multi-tier applications in a distributed system |
| US11372938B1 (en) | 2016-03-08 | 2022-06-28 | Tanium Inc. | System and method for performing search requests in a network |
| US11461208B1 (en) | 2015-04-24 | 2022-10-04 | Tanium Inc. | Reliable map-reduce communications in a decentralized, self-organizing communication orbit of a distributed network |
| US11494651B2 (en) | 2018-01-30 | 2022-11-08 | Imubit Israel Ltd | Systems and methods for optimizing refinery coker process |
| US11563764B1 (en) | 2020-08-24 | 2023-01-24 | Tanium Inc. | Risk scoring based on compliance verification test results in a local network |
| US11609835B1 (en) | 2016-03-08 | 2023-03-21 | Tanium Inc. | Evaluating machine and process performance in distributed system |
| US11711810B1 (en) | 2012-12-21 | 2023-07-25 | Tanium Inc. | System, security and network management using self-organizing communication orbits in distributed networks |
| US11831670B1 (en) | 2019-11-18 | 2023-11-28 | Tanium Inc. | System and method for prioritizing distributed system risk remediations |
| US11886154B2 (en) | 2018-01-30 | 2024-01-30 | Imubit Israel Ltd. | Systems and methods for optimizing refinery coker process |
| US11886229B1 (en) | 2016-03-08 | 2024-01-30 | Tanium Inc. | System and method for generating a global dictionary and performing similarity search queries in a network |
| US11993751B2 (en) | 2018-01-30 | 2024-05-28 | Imubit Israel Ltd. | Predictive control systems and methods with fluid catalytic cracking volume gain optimization |
| US12045022B2 (en) | 2018-01-30 | 2024-07-23 | Imubit Israel Ltd. | Predictive control systems and methods with offline gains learning and online control |
| US12056622B2 (en) | 2021-02-03 | 2024-08-06 | International Business Machines Corporation | Identifying influential effects to be adjusted in goal seek analysis |
| US12231467B1 (en) | 2021-10-19 | 2025-02-18 | Tanium Inc. | System and method for deputizing satellite endpoints |
Families Citing this family (83)
| Publication number | Priority date | Publication date | Assignee | Title |
|---|---|---|---|---|
| US7567887B2 (en) * | 2004-09-10 | 2009-07-28 | Exxonmobil Research And Engineering Company | Application of abnormal event detection technology to fluidized catalytic cracking unit |
| US7295950B2 (en) * | 2005-06-23 | 2007-11-13 | International Business Machines Corporation | Monitoring multiple channels of data from real time process to detect recent abnormal behavior |
| US8489360B2 (en) | 2006-09-29 | 2013-07-16 | Fisher-Rosemount Systems, Inc. | Multivariate monitoring and diagnostics of process variable data |
| US8140300B2 (en) * | 2008-05-15 | 2012-03-20 | Becton, Dickinson And Company | High throughput flow cytometer operation with data quality assessment and control |
| US9323234B2 (en) * | 2009-06-10 | 2016-04-26 | Fisher-Rosemount Systems, Inc. | Predicted fault analysis |
| US8326789B2 (en) * | 2009-08-20 | 2012-12-04 | Uop Llc | Expert system integrated with remote performance management |
| CN102117527A (zh) * | 2009-12-30 | 2011-07-06 | 捷达世软件(深圳)有限公司 | 异常监控报警系统及方法 |
| US8862250B2 (en) * | 2010-05-07 | 2014-10-14 | Exxonmobil Research And Engineering Company | Integrated expert system for identifying abnormal events in an industrial plant |
| CN101847004B (zh) * | 2010-06-03 | 2011-11-09 | 中南大学 | 焦炉多回路控制系统的性能评估与故障诊断方法 |
| CN101989087B (zh) * | 2010-09-26 | 2013-01-23 | 中国石油化工股份有限公司 | 工业化加工渣油的在线实时故障监测与诊断的系统装置 |
| WO2013089602A1 (en) * | 2011-12-15 | 2013-06-20 | Telefonaktiebolaget L M Ericsson (Publ) | Method and trend analyzer for analyzing data in a communication network |
| US9130825B2 (en) * | 2011-12-27 | 2015-09-08 | Tektronix, Inc. | Confidence intervals for key performance indicators in communication networks |
| WO2013171862A1 (ja) * | 2012-05-16 | 2013-11-21 | 東芝三菱電機産業システム株式会社 | 設定計算システムの学習装置及び学習方法 |
| US10649449B2 (en) | 2013-03-04 | 2020-05-12 | Fisher-Rosemount Systems, Inc. | Distributed industrial performance monitoring and analytics |
| US10866952B2 (en) | 2013-03-04 | 2020-12-15 | Fisher-Rosemount Systems, Inc. | Source-independent queries in distributed industrial system |
| US10649424B2 (en) | 2013-03-04 | 2020-05-12 | Fisher-Rosemount Systems, Inc. | Distributed industrial performance monitoring and analytics |
| US9665088B2 (en) | 2014-01-31 | 2017-05-30 | Fisher-Rosemount Systems, Inc. | Managing big data in process control systems |
| US10386827B2 (en) | 2013-03-04 | 2019-08-20 | Fisher-Rosemount Systems, Inc. | Distributed industrial performance monitoring and analytics platform |
| US9823626B2 (en) | 2014-10-06 | 2017-11-21 | Fisher-Rosemount Systems, Inc. | Regional big data in process control systems |
| US10223327B2 (en) | 2013-03-14 | 2019-03-05 | Fisher-Rosemount Systems, Inc. | Collecting and delivering data to a big data machine in a process control system |
| US10678225B2 (en) | 2013-03-04 | 2020-06-09 | Fisher-Rosemount Systems, Inc. | Data analytic services for distributed industrial performance monitoring |
| US9558220B2 (en) | 2013-03-04 | 2017-01-31 | Fisher-Rosemount Systems, Inc. | Big data in process control systems |
| US9804588B2 (en) | 2014-03-14 | 2017-10-31 | Fisher-Rosemount Systems, Inc. | Determining associations and alignments of process elements and measurements in a process |
| US10282676B2 (en) | 2014-10-06 | 2019-05-07 | Fisher-Rosemount Systems, Inc. | Automatic signal processing-based learning in a process plant |
| US9397836B2 (en) | 2014-08-11 | 2016-07-19 | Fisher-Rosemount Systems, Inc. | Securing devices to process control systems |
| US10909137B2 (en) | 2014-10-06 | 2021-02-02 | Fisher-Rosemount Systems, Inc. | Streaming data for analytics in process control systems |
| US9740802B2 (en) | 2013-03-15 | 2017-08-22 | Fisher-Rosemount Systems, Inc. | Data modeling studio |
| US10133243B2 (en) | 2013-03-15 | 2018-11-20 | Fisher-Rosemount Systems, Inc. | Method and apparatus for seamless state transfer between user interface devices in a mobile control room |
| US20160048139A1 (en) * | 2013-04-25 | 2016-02-18 | Dow Global Technologies Llc | Real-Time Chemical Process Monitoring, Assessment and Decision-Making Assistance Method |
| USD749621S1 (en) * | 2013-08-06 | 2016-02-16 | Graftech International Holdings, Inc. | Display screen with graphical user interface for a furnace monitoring system |
| WO2015063435A1 (en) * | 2013-10-30 | 2015-05-07 | Ge Aviation Systems Limited | Method of regression for change detection |
| US10042355B2 (en) | 2014-02-04 | 2018-08-07 | Exxonmobil Research And Engineering Company | Flexible time modeling of a facility |
| US9946252B2 (en) * | 2014-02-04 | 2018-04-17 | Exxonmobil Research And Engineering Company | Operational programming of a facility |
| US10168691B2 (en) | 2014-10-06 | 2019-01-01 | Fisher-Rosemount Systems, Inc. | Data pipeline for process control system analytics |
| EP3026518A1 (de) * | 2014-11-25 | 2016-06-01 | ABB Technology AG | Verfahren für eine Root-Analyse einer Alarmflutfolge |
| US10095200B2 (en) | 2015-03-30 | 2018-10-09 | Uop Llc | System and method for improving performance of a chemical plant with a furnace |
| US20170315543A1 (en) * | 2015-03-30 | 2017-11-02 | Uop Llc | Evaluating petrochemical plant errors to determine equipment changes for optimized operations |
| US9864823B2 (en) | 2015-03-30 | 2018-01-09 | Uop Llc | Cleansing system for a feed composition based on environmental factors |
| CN106292563B (zh) * | 2015-05-29 | 2018-11-02 | 中国科学院过程工程研究所 | 一种工业固废综合利用产业链风险监控管理系统 |
| CN105205224B (zh) * | 2015-08-28 | 2018-10-30 | 江南大学 | 基于模糊曲线分析的时间差高斯过程回归软测量建模方法 |
| US11162912B2 (en) * | 2015-09-11 | 2021-11-02 | KABUSHI Kl KAISHA TOSHIBA | Electronic apparatus, index calculating method, and computer program product |
| US10228685B2 (en) * | 2015-10-22 | 2019-03-12 | Globalfoundries Inc. | Use of multivariate models to control manufacturing operations |
| US10503483B2 (en) | 2016-02-12 | 2019-12-10 | Fisher-Rosemount Systems, Inc. | Rule builder in a process control network |
| KR101827108B1 (ko) * | 2016-05-04 | 2018-02-07 | 두산중공업 주식회사 | 플랜트 이상 감지 학습 시스템 및 방법 |
| RU2637464C1 (ru) * | 2016-06-30 | 2017-12-04 | ФЕДЕРАЛЬНОЕ ГОСУДАРСТВЕННОЕ КАЗЕННОЕ ВОЕННОЕ ОБРАЗОВАТЕЛЬНОЕ УЧРЕЖДЕНИЕ ВЫСШЕГО ОБРАЗОВАНИЯ "Военная академия Ракетных войск стратегического назначения имени Петра Великого" МИНИСТЕРСТВА ОБОРОНЫ РОССИЙСКОЙ ФЕДЕРАЦИИ | Устройство моделирования сценариев развития ситуации |
| US10222787B2 (en) | 2016-09-16 | 2019-03-05 | Uop Llc | Interactive petrochemical plant diagnostic system and method for chemical process model analysis |
| US11223668B2 (en) * | 2017-01-12 | 2022-01-11 | Telefonaktiebolaget Lm Ericsson (Publ) | Anomaly detection of media event sequences |
| US10754359B2 (en) | 2017-03-27 | 2020-08-25 | Uop Llc | Operating slide valves in petrochemical plants or refineries |
| US10678272B2 (en) | 2017-03-27 | 2020-06-09 | Uop Llc | Early prediction and detection of slide valve sticking in petrochemical plants or refineries |
| US10844290B2 (en) | 2017-03-28 | 2020-11-24 | Uop Llc | Rotating equipment in a petrochemical plant or refinery |
| US10816947B2 (en) | 2017-03-28 | 2020-10-27 | Uop Llc | Early surge detection of rotating equipment in a petrochemical plant or refinery |
| US10794644B2 (en) | 2017-03-28 | 2020-10-06 | Uop Llc | Detecting and correcting thermal stresses in heat exchangers in a petrochemical plant or refinery |
| US11396002B2 (en) * | 2017-03-28 | 2022-07-26 | Uop Llc | Detecting and correcting problems in liquid lifting in heat exchangers |
| US11037376B2 (en) | 2017-03-28 | 2021-06-15 | Uop Llc | Sensor location for rotating equipment in a petrochemical plant or refinery |
| US10663238B2 (en) | 2017-03-28 | 2020-05-26 | Uop Llc | Detecting and correcting maldistribution in heat exchangers in a petrochemical plant or refinery |
| US10670027B2 (en) | 2017-03-28 | 2020-06-02 | Uop Llc | Determining quality of gas for rotating equipment in a petrochemical plant or refinery |
| US10794401B2 (en) | 2017-03-28 | 2020-10-06 | Uop Llc | Reactor loop fouling monitor for rotating equipment in a petrochemical plant or refinery |
| US10752844B2 (en) | 2017-03-28 | 2020-08-25 | Uop Llc | Rotating equipment in a petrochemical plant or refinery |
| US10962302B2 (en) | 2017-03-28 | 2021-03-30 | Uop Llc | Heat exchangers in a petrochemical plant or refinery |
| US11130111B2 (en) | 2017-03-28 | 2021-09-28 | Uop Llc | Air-cooled heat exchangers |
| US10670353B2 (en) | 2017-03-28 | 2020-06-02 | Uop Llc | Detecting and correcting cross-leakage in heat exchangers in a petrochemical plant or refinery |
| US10752845B2 (en) | 2017-03-28 | 2020-08-25 | Uop Llc | Using molecular weight and invariant mapping to determine performance of rotating equipment in a petrochemical plant or refinery |
| DE102017108496B4 (de) * | 2017-04-21 | 2023-06-29 | Windmöller & Hölscher Kg | Verfahren und Vorrichtungen sowie System zum Auf- und Abwickeln eines Wickels |
| US10695711B2 (en) | 2017-04-28 | 2020-06-30 | Uop Llc | Remote monitoring of adsorber process units |
| US11365886B2 (en) | 2017-06-19 | 2022-06-21 | Uop Llc | Remote monitoring of fired heaters |
| US10913905B2 (en) | 2017-06-19 | 2021-02-09 | Uop Llc | Catalyst cycle length prediction using eigen analysis |
| US10739798B2 (en) | 2017-06-20 | 2020-08-11 | Uop Llc | Incipient temperature excursion mitigation and control |
| US11130692B2 (en) | 2017-06-28 | 2021-09-28 | Uop Llc | Process and apparatus for dosing nutrients to a bioreactor |
| WO2019005541A1 (en) * | 2017-06-30 | 2019-01-03 | Uop Llc | ERROR ASSESSMENT OF A PETROCHEMICAL PLANT TO DETERMINE EQUIPMENT CHANGES FOR OPTIMIZED OPERATIONS |
| US10994240B2 (en) | 2017-09-18 | 2021-05-04 | Uop Llc | Remote monitoring of pressure swing adsorption units |
| US11194317B2 (en) | 2017-10-02 | 2021-12-07 | Uop Llc | Remote monitoring of chloride treaters using a process simulator based chloride distribution estimate |
| US11676061B2 (en) | 2017-10-05 | 2023-06-13 | Honeywell International Inc. | Harnessing machine learning and data analytics for a real time predictive model for a FCC pre-treatment unit |
| US11105787B2 (en) | 2017-10-20 | 2021-08-31 | Honeywell International Inc. | System and method to optimize crude oil distillation or other processing by inline analysis of crude oil properties |
| US10901403B2 (en) | 2018-02-20 | 2021-01-26 | Uop Llc | Developing linear process models using reactor kinetic equations |
| US10734098B2 (en) | 2018-03-30 | 2020-08-04 | Uop Llc | Catalytic dehydrogenation catalyst health index |
| US10953377B2 (en) | 2018-12-10 | 2021-03-23 | Uop Llc | Delta temperature control of catalytic dehydrogenation process reactors |
| CN109817287B (zh) * | 2019-02-01 | 2023-08-11 | 华东理工大学 | 一种延迟焦化模型集成方法 |
| US11415438B2 (en) | 2019-07-17 | 2022-08-16 | ExxonMobil Technology and Engineering Company | Intelligent system for identifying sensor drift |
| EP4100808A1 (de) * | 2020-02-04 | 2022-12-14 | Basf Se | Industrieanlagenüberwachung |
| CN111767275B (zh) * | 2020-06-28 | 2024-04-19 | 北京林克富华技术开发有限公司 | 数据的处理方法及装置、数据处理系统 |
| US12380364B2 (en) | 2021-09-07 | 2025-08-05 | PeerNova, Inc. | Outlier determination among models of future event prediction |
| EP4312090B1 (de) * | 2022-07-26 | 2025-05-28 | Siemens Aktiengesellschaft | Verfahren zur identifikation eines prozessmodells für eine modellbasierte, prädiktive mehrgrössenregelung einer prozessanlage |
| US20240193525A1 (en) * | 2022-12-12 | 2024-06-13 | Saudi Arabian Oil Company | Automated costing of intermediate products of a crude distillation unit in a refinery |
Citations (73)
| Publication number | Priority date | Publication date | Assignee | Title |
|---|---|---|---|---|
| US3175968A (en) | 1961-06-23 | 1965-03-30 | Phillips Petroleum Co | Automatic control and optimization of a fluidized catalytic cracker |
| US4060716A (en) * | 1975-05-19 | 1977-11-29 | Rockwell International Corporation | Method and apparatus for automatic abnormal events monitor in operating plants |
| US4549934A (en) * | 1984-04-25 | 1985-10-29 | Conoco, Inc. | Flash zone draw tray for coker fractionator |
| US4764318A (en) * | 1986-03-20 | 1988-08-16 | Ruetgerswerke Aktiengesellschaft | Process for the continuous coking of pitches and utilization of the coke obtained thereby |
| JPH022408A (ja) | 1988-06-16 | 1990-01-08 | Nippon Atom Ind Group Co Ltd | プラント・機器の診断支援システム |
| EP0428135A2 (de) | 1989-11-13 | 1991-05-22 | Komatsu Ltd. | Gerät und Verfahren zur Fehlerdiagnose |
| US5023045A (en) | 1989-02-07 | 1991-06-11 | Doryokuro Kakunenryo Kaihatsu Jigyodan | Plant malfunction diagnostic method |
| US5333240A (en) | 1989-04-14 | 1994-07-26 | Hitachi, Ltd. | Neural network state diagnostic system for equipment |
| US5351247A (en) | 1988-12-30 | 1994-09-27 | Digital Equipment Corporation | Adaptive fault identification system |
| EP0626697A1 (de) | 1993-05-21 | 1994-11-30 | Hitachi, Ltd. | Verfahren und Einrichtung zur Überwachung und zur Fehlererkennung einer Anlage; mit der Einrichtung ausgerüstete Anlage |
| US5457625A (en) | 1994-04-13 | 1995-10-10 | The M. W. Kellogg Company | Maximizing process production rates using permanent constraints |
| US5465321A (en) | 1993-04-07 | 1995-11-07 | The United States Of America As Represented By The Administrator Of The National Aeronautics And Space Administration | Hidden markov models for fault detection in dynamic systems |
| US5539877A (en) | 1994-06-27 | 1996-07-23 | International Business Machine Corporation | Problem determination method for local area network systems |
| JPH10143343A (ja) | 1996-11-07 | 1998-05-29 | Fuji Electric Co Ltd | 連想型プラント異常診断装置 |
| US5817958A (en) | 1994-05-20 | 1998-10-06 | Hitachi, Ltd. | Plant monitoring and diagnosing method and system, as well as plant equipped with the system |
| US5859964A (en) | 1996-10-25 | 1999-01-12 | Advanced Micro Devices, Inc. | System and method for performing real time data acquisition, process modeling and fault detection of wafer fabrication processes |
| US5949678A (en) | 1993-12-22 | 1999-09-07 | Telefonaktiebolaget Lm Ericsson | Method for monitoring multivariate processes |
| US5950147A (en) | 1997-06-05 | 1999-09-07 | Caterpillar Inc. | Method and apparatus for predicting a fault condition |
| US5949677A (en) | 1997-01-09 | 1999-09-07 | Honeywell Inc. | Control system utilizing fault detection |
| US6115656A (en) | 1997-06-17 | 2000-09-05 | Mcdonnell Douglas Corporation | Fault recording and reporting method |
| US6133132A (en) | 2000-01-20 | 2000-10-17 | Advanced Micro Devices, Inc. | Method for controlling transistor spacer width |
| US6207043B1 (en) * | 1996-06-11 | 2001-03-27 | Basf Aktiengesellschaft | Method of preparing low-sulphur aliphatic compounds |
| US6368975B1 (en) | 1999-07-07 | 2002-04-09 | Applied Materials, Inc. | Method and apparatus for monitoring a process by employing principal component analysis |
| US20020077792A1 (en) | 2000-10-27 | 2002-06-20 | Panacya, Inc. | Early warning in e-service management systems |
| US6466877B1 (en) | 1999-09-15 | 2002-10-15 | General Electric Company | Paper web breakage prediction using principal components analysis and classification and regression trees |
| US6485631B1 (en) * | 1999-02-11 | 2002-11-26 | Ellycrack As | Process for thermal, and optionally catalytic, upgrading and hydrogenation of hydrocarbons |
| US6505145B1 (en) | 1999-02-22 | 2003-01-07 | Northeast Equipment Inc. | Apparatus and method for monitoring and maintaining plant equipment |
| US6522978B1 (en) | 1999-09-15 | 2003-02-18 | General Electric Company | Paper web breakage prediction using principal components analysis and classification and regression trees |
| US20030083756A1 (en) | 2000-03-10 | 2003-05-01 | Cyrano Sciences, Inc. | Temporary expanding integrated monitoring network |
| US6564119B1 (en) | 1998-07-21 | 2003-05-13 | Dofasco Inc. | Multivariate statistical model-based system for monitoring the operation of a continuous caster and detecting the onset of impending breakouts |
| US6606580B1 (en) | 2000-05-09 | 2003-08-12 | Rolls Royce, Plc | Fault diagnosis |
| US6625569B2 (en) | 2001-03-08 | 2003-09-23 | California Institute Of Technology | Real-time spatio-temporal coherence estimation for autonomous mode identification and invariance tracking |
| US6636842B1 (en) | 2000-07-15 | 2003-10-21 | Intevep, S.A. | System and method for controlling an industrial process utilizing process trajectories |
| US20040002776A1 (en) | 2000-06-09 | 2004-01-01 | Bickford Randall L. | Surveillance system and method having an operating mode partitioned fault classification model |
| US6681344B1 (en) | 2000-09-14 | 2004-01-20 | Microsoft Corporation | System and method for automatically diagnosing a computer problem |
| US20040033617A1 (en) | 2002-08-13 | 2004-02-19 | Sonbul Yaser R. | Topological near infrared analysis modeling of petroleum refinery products |
| US20040078683A1 (en) | 2000-05-05 | 2004-04-22 | Buia Christhoper A. | Systems and methods for managing and analyzing faults in computer networks |
| US20040078171A1 (en) | 2001-04-10 | 2004-04-22 | Smartsignal Corporation | Diagnostic systems and methods for predictive condition monitoring |
| US6735541B2 (en) | 2001-02-16 | 2004-05-11 | Exxonmobil Research And Engineering Company | Process unit monitoring program |
| US6760639B2 (en) | 2000-01-29 | 2004-07-06 | Abb Research Ltd. | System and method for determining the effectiveness of production installations, fault events and the causes of faults |
| US20040172229A1 (en) | 2001-08-17 | 2004-09-02 | General Electric Company | System and method for measuring quality of baseline modeling techniques |
| US6809837B1 (en) | 1999-11-29 | 2004-10-26 | Xerox Corporation | On-line model prediction and calibration system for a dynamically varying color reproduction device |
| US6813532B2 (en) | 2001-03-01 | 2004-11-02 | Fisher-Rosemount Systems, Inc. | Creation and display of indices within a process plant |
| US20050067816A1 (en) | 2002-12-18 | 2005-03-31 | Buckman Robert F. | Method and apparatus for body impact protection |
| US6904386B2 (en) | 2002-10-07 | 2005-06-07 | Honeywell International Inc. | Control system and method for detecting plugging in differential pressure cells |
| US6907383B2 (en) | 1996-03-28 | 2005-06-14 | Rosemount Inc. | Flow diagnostic system |
| US20050141782A1 (en) | 2003-12-31 | 2005-06-30 | Honeywell International Inc. | Principal component analysis based fault classification |
| US20050149297A1 (en) | 2003-12-31 | 2005-07-07 | Valerie Guralnik | Principal component analysis based fault classification |
| US20050197805A1 (en) | 2001-03-01 | 2005-09-08 | Fisher-Rosemount Systems, Inc. | Data presentation system for abnormal situation prevention in a process plant |
| US6954713B2 (en) | 2001-03-01 | 2005-10-11 | Fisher-Rosemount Systems, Inc. | Cavitation detection in a process plant |
| US20050267710A1 (en) * | 2004-05-28 | 2005-12-01 | Fisher-Rosemount Systems, Inc. | System and method for detecting an abnormal situation associated with a heater |
| US20050267702A1 (en) | 2004-05-28 | 2005-12-01 | General Electric Company | Method for developing a unified quality assessment and providing an automated fault diagnostic tool for turbine machine systems and the like |
| US6978210B1 (en) | 2000-10-26 | 2005-12-20 | Conocophillips Company | Method for automated management of hydrocarbon gathering systems |
| US6980938B2 (en) | 2002-01-10 | 2005-12-27 | Cutler Technology Corporation | Method for removal of PID dynamics from MPC models |
| US20060020423A1 (en) * | 2004-06-12 | 2006-01-26 | Fisher-Rosemount Systems, Inc. | System and method for detecting an abnormal situation associated with a process gain of a control loop |
| US20060036403A1 (en) | 2001-04-10 | 2006-02-16 | Smartsignal Corporation | Diagnostic systems and methods for predictive condition monitoring |
| US20060058898A1 (en) * | 2004-09-10 | 2006-03-16 | Emigholz Kenneth F | System and method for abnormal event detection in the operation of continuous industrial processes |
| US20060074598A1 (en) | 2004-09-10 | 2006-04-06 | Emigholz Kenneth F | Application of abnormal event detection technology to hydrocracking units |
| US20060073013A1 (en) * | 2004-09-10 | 2006-04-06 | Emigholz Kenneth F | Application of abnormal event detection technology to fluidized catalytic cracking unit |
| US20060074599A1 (en) | 2004-09-10 | 2006-04-06 | Emigholz Kenneth F | Application of abnormal event detection technology to olefins recovery trains |
| US7079984B2 (en) | 2004-03-03 | 2006-07-18 | Fisher-Rosemount Systems, Inc. | Abnormal situation prevention in a process plant |
| US7085610B2 (en) | 1996-03-28 | 2006-08-01 | Fisher-Rosemount Systems, Inc. | Root cause diagnostics |
| US7096074B2 (en) | 2002-05-30 | 2006-08-22 | Insyst Ltd. | Methods and apparatus for early fault detection and alert generation in a process |
| US20070005266A1 (en) | 2004-05-04 | 2007-01-04 | Fisher-Rosemount Systems, Inc. | Process plant monitoring based on multivariate statistical analysis and on-line process simulation |
| US7181654B2 (en) | 2004-09-17 | 2007-02-20 | Fisher-Rosemount Systems, Inc. | System and method for detecting an abnormal situation associated with a reactor |
| US20070088448A1 (en) | 2005-10-19 | 2007-04-19 | Honeywell International Inc. | Predictive correlation model system |
| US20070088534A1 (en) | 2005-10-18 | 2007-04-19 | Honeywell International Inc. | System, method, and computer program for early event detection |
| US20070088528A1 (en) | 2005-10-14 | 2007-04-19 | Fisher-Rosemount Systems, Inc. | Statistical signatures used with multivariate statistical analysis for fault detection and isolation and abnormal condition prevention in a process |
| US20070124113A1 (en) | 2005-11-28 | 2007-05-31 | Honeywell International, Inc. | Fault detection system and method using multiway principal component analysis |
| US20080097637A1 (en) | 2006-03-21 | 2008-04-24 | Nguyen Anh T | Application of abnormal event detection (AED) technology to polymers process |
| WO2008047098A1 (en) | 2006-10-18 | 2008-04-24 | Bp Oil International Limited | Abnormal event detection using principal component analysis |
| US20080281557A1 (en) | 2007-02-27 | 2008-11-13 | Emigholz Kenneth F | Method and system of using inferential measurements for abnormal event detection in continuous industrial processes |
| US20090149981A1 (en) | 2007-08-14 | 2009-06-11 | Wayne Errol Evans | System and methods for continuous, online monitoring of a chemical plant or refinery |
Family Cites Families (2)
| Publication number | Priority date | Publication date | Assignee | Title |
|---|---|---|---|---|
| AU572263B2 (en) * | 1983-08-01 | 1988-05-05 | Conoco Inc. | Delayed coking |
| US6919017B2 (en) * | 2002-04-11 | 2005-07-19 | Conocophillips Company | Separation process and apparatus for removal of particulate material from flash zone gas oil |
-
2007
- 2007-04-13 US US11/786,950 patent/US7720641B2/en active Active
- 2007-04-19 WO PCT/US2007/009576 patent/WO2007124002A2/en not_active Ceased
- 2007-04-19 CA CA2649863A patent/CA2649863C/en not_active Expired - Fee Related
- 2007-04-19 JP JP2009506582A patent/JP2009534746A/ja active Pending
- 2007-04-19 EP EP07775776.3A patent/EP2021965A4/de not_active Withdrawn
-
2008
- 2008-11-20 NO NO20084879A patent/NO20084879L/no not_active Application Discontinuation
Patent Citations (78)
| Publication number | Priority date | Publication date | Assignee | Title |
|---|---|---|---|---|
| US3175968A (en) | 1961-06-23 | 1965-03-30 | Phillips Petroleum Co | Automatic control and optimization of a fluidized catalytic cracker |
| US4060716A (en) * | 1975-05-19 | 1977-11-29 | Rockwell International Corporation | Method and apparatus for automatic abnormal events monitor in operating plants |
| US4549934A (en) * | 1984-04-25 | 1985-10-29 | Conoco, Inc. | Flash zone draw tray for coker fractionator |
| US4764318A (en) * | 1986-03-20 | 1988-08-16 | Ruetgerswerke Aktiengesellschaft | Process for the continuous coking of pitches and utilization of the coke obtained thereby |
| JPH022408A (ja) | 1988-06-16 | 1990-01-08 | Nippon Atom Ind Group Co Ltd | プラント・機器の診断支援システム |
| US5351247A (en) | 1988-12-30 | 1994-09-27 | Digital Equipment Corporation | Adaptive fault identification system |
| US5023045A (en) | 1989-02-07 | 1991-06-11 | Doryokuro Kakunenryo Kaihatsu Jigyodan | Plant malfunction diagnostic method |
| US5333240A (en) | 1989-04-14 | 1994-07-26 | Hitachi, Ltd. | Neural network state diagnostic system for equipment |
| EP0428135A2 (de) | 1989-11-13 | 1991-05-22 | Komatsu Ltd. | Gerät und Verfahren zur Fehlerdiagnose |
| US5465321A (en) | 1993-04-07 | 1995-11-07 | The United States Of America As Represented By The Administrator Of The National Aeronautics And Space Administration | Hidden markov models for fault detection in dynamic systems |
| EP0626697A1 (de) | 1993-05-21 | 1994-11-30 | Hitachi, Ltd. | Verfahren und Einrichtung zur Überwachung und zur Fehlererkennung einer Anlage; mit der Einrichtung ausgerüstete Anlage |
| US5949678A (en) | 1993-12-22 | 1999-09-07 | Telefonaktiebolaget Lm Ericsson | Method for monitoring multivariate processes |
| US5457625A (en) | 1994-04-13 | 1995-10-10 | The M. W. Kellogg Company | Maximizing process production rates using permanent constraints |
| US5817958A (en) | 1994-05-20 | 1998-10-06 | Hitachi, Ltd. | Plant monitoring and diagnosing method and system, as well as plant equipped with the system |
| US5539877A (en) | 1994-06-27 | 1996-07-23 | International Business Machine Corporation | Problem determination method for local area network systems |
| US6907383B2 (en) | 1996-03-28 | 2005-06-14 | Rosemount Inc. | Flow diagnostic system |
| US7085610B2 (en) | 1996-03-28 | 2006-08-01 | Fisher-Rosemount Systems, Inc. | Root cause diagnostics |
| US6207043B1 (en) * | 1996-06-11 | 2001-03-27 | Basf Aktiengesellschaft | Method of preparing low-sulphur aliphatic compounds |
| US5859964A (en) | 1996-10-25 | 1999-01-12 | Advanced Micro Devices, Inc. | System and method for performing real time data acquisition, process modeling and fault detection of wafer fabrication processes |
| JPH10143343A (ja) | 1996-11-07 | 1998-05-29 | Fuji Electric Co Ltd | 連想型プラント異常診断装置 |
| US5949677A (en) | 1997-01-09 | 1999-09-07 | Honeywell Inc. | Control system utilizing fault detection |
| US5950147A (en) | 1997-06-05 | 1999-09-07 | Caterpillar Inc. | Method and apparatus for predicting a fault condition |
| US6115656A (en) | 1997-06-17 | 2000-09-05 | Mcdonnell Douglas Corporation | Fault recording and reporting method |
| US6564119B1 (en) | 1998-07-21 | 2003-05-13 | Dofasco Inc. | Multivariate statistical model-based system for monitoring the operation of a continuous caster and detecting the onset of impending breakouts |
| US6485631B1 (en) * | 1999-02-11 | 2002-11-26 | Ellycrack As | Process for thermal, and optionally catalytic, upgrading and hydrogenation of hydrocarbons |
| US6505145B1 (en) | 1999-02-22 | 2003-01-07 | Northeast Equipment Inc. | Apparatus and method for monitoring and maintaining plant equipment |
| US6368975B1 (en) | 1999-07-07 | 2002-04-09 | Applied Materials, Inc. | Method and apparatus for monitoring a process by employing principal component analysis |
| US6521080B2 (en) | 1999-07-07 | 2003-02-18 | Applied Materials Inc. | Method and apparatus for monitoring a process by employing principal component analysis |
| US6466877B1 (en) | 1999-09-15 | 2002-10-15 | General Electric Company | Paper web breakage prediction using principal components analysis and classification and regression trees |
| US6522978B1 (en) | 1999-09-15 | 2003-02-18 | General Electric Company | Paper web breakage prediction using principal components analysis and classification and regression trees |
| US6809837B1 (en) | 1999-11-29 | 2004-10-26 | Xerox Corporation | On-line model prediction and calibration system for a dynamically varying color reproduction device |
| US6133132A (en) | 2000-01-20 | 2000-10-17 | Advanced Micro Devices, Inc. | Method for controlling transistor spacer width |
| US6760639B2 (en) | 2000-01-29 | 2004-07-06 | Abb Research Ltd. | System and method for determining the effectiveness of production installations, fault events and the causes of faults |
| US20030083756A1 (en) | 2000-03-10 | 2003-05-01 | Cyrano Sciences, Inc. | Temporary expanding integrated monitoring network |
| US20040078683A1 (en) | 2000-05-05 | 2004-04-22 | Buia Christhoper A. | Systems and methods for managing and analyzing faults in computer networks |
| US6606580B1 (en) | 2000-05-09 | 2003-08-12 | Rolls Royce, Plc | Fault diagnosis |
| US20040002776A1 (en) | 2000-06-09 | 2004-01-01 | Bickford Randall L. | Surveillance system and method having an operating mode partitioned fault classification model |
| US6917839B2 (en) | 2000-06-09 | 2005-07-12 | Intellectual Assets Llc | Surveillance system and method having an operating mode partitioned fault classification model |
| US6636842B1 (en) | 2000-07-15 | 2003-10-21 | Intevep, S.A. | System and method for controlling an industrial process utilizing process trajectories |
| US6681344B1 (en) | 2000-09-14 | 2004-01-20 | Microsoft Corporation | System and method for automatically diagnosing a computer problem |
| US6978210B1 (en) | 2000-10-26 | 2005-12-20 | Conocophillips Company | Method for automated management of hydrocarbon gathering systems |
| US20020077792A1 (en) | 2000-10-27 | 2002-06-20 | Panacya, Inc. | Early warning in e-service management systems |
| US6735541B2 (en) | 2001-02-16 | 2004-05-11 | Exxonmobil Research And Engineering Company | Process unit monitoring program |
| US6925338B2 (en) | 2001-03-01 | 2005-08-02 | Fisher-Rosemount Systems, Inc. | Fiducial technique for estimating and using degradation levels in a process plant |
| US6813532B2 (en) | 2001-03-01 | 2004-11-02 | Fisher-Rosemount Systems, Inc. | Creation and display of indices within a process plant |
| US6954713B2 (en) | 2001-03-01 | 2005-10-11 | Fisher-Rosemount Systems, Inc. | Cavitation detection in a process plant |
| US20050197805A1 (en) | 2001-03-01 | 2005-09-08 | Fisher-Rosemount Systems, Inc. | Data presentation system for abnormal situation prevention in a process plant |
| US6625569B2 (en) | 2001-03-08 | 2003-09-23 | California Institute Of Technology | Real-time spatio-temporal coherence estimation for autonomous mode identification and invariance tracking |
| US20060036403A1 (en) | 2001-04-10 | 2006-02-16 | Smartsignal Corporation | Diagnostic systems and methods for predictive condition monitoring |
| US20040078171A1 (en) | 2001-04-10 | 2004-04-22 | Smartsignal Corporation | Diagnostic systems and methods for predictive condition monitoring |
| US20040172229A1 (en) | 2001-08-17 | 2004-09-02 | General Electric Company | System and method for measuring quality of baseline modeling techniques |
| US6980938B2 (en) | 2002-01-10 | 2005-12-27 | Cutler Technology Corporation | Method for removal of PID dynamics from MPC models |
| US7096074B2 (en) | 2002-05-30 | 2006-08-22 | Insyst Ltd. | Methods and apparatus for early fault detection and alert generation in a process |
| US20040033617A1 (en) | 2002-08-13 | 2004-02-19 | Sonbul Yaser R. | Topological near infrared analysis modeling of petroleum refinery products |
| US6904386B2 (en) | 2002-10-07 | 2005-06-07 | Honeywell International Inc. | Control system and method for detecting plugging in differential pressure cells |
| US20050067816A1 (en) | 2002-12-18 | 2005-03-31 | Buckman Robert F. | Method and apparatus for body impact protection |
| US20050149297A1 (en) | 2003-12-31 | 2005-07-07 | Valerie Guralnik | Principal component analysis based fault classification |
| US20050141782A1 (en) | 2003-12-31 | 2005-06-30 | Honeywell International Inc. | Principal component analysis based fault classification |
| US7079984B2 (en) | 2004-03-03 | 2006-07-18 | Fisher-Rosemount Systems, Inc. | Abnormal situation prevention in a process plant |
| US20070005266A1 (en) | 2004-05-04 | 2007-01-04 | Fisher-Rosemount Systems, Inc. | Process plant monitoring based on multivariate statistical analysis and on-line process simulation |
| US6973396B1 (en) | 2004-05-28 | 2005-12-06 | General Electric Company | Method for developing a unified quality assessment and providing an automated fault diagnostic tool for turbine machine systems and the like |
| US20050267702A1 (en) | 2004-05-28 | 2005-12-01 | General Electric Company | Method for developing a unified quality assessment and providing an automated fault diagnostic tool for turbine machine systems and the like |
| US20050267710A1 (en) * | 2004-05-28 | 2005-12-01 | Fisher-Rosemount Systems, Inc. | System and method for detecting an abnormal situation associated with a heater |
| US20060020423A1 (en) * | 2004-06-12 | 2006-01-26 | Fisher-Rosemount Systems, Inc. | System and method for detecting an abnormal situation associated with a process gain of a control loop |
| US20060074599A1 (en) | 2004-09-10 | 2006-04-06 | Emigholz Kenneth F | Application of abnormal event detection technology to olefins recovery trains |
| US20060073013A1 (en) * | 2004-09-10 | 2006-04-06 | Emigholz Kenneth F | Application of abnormal event detection technology to fluidized catalytic cracking unit |
| US20060074598A1 (en) | 2004-09-10 | 2006-04-06 | Emigholz Kenneth F | Application of abnormal event detection technology to hydrocracking units |
| US20060058898A1 (en) * | 2004-09-10 | 2006-03-16 | Emigholz Kenneth F | System and method for abnormal event detection in the operation of continuous industrial processes |
| US7181654B2 (en) | 2004-09-17 | 2007-02-20 | Fisher-Rosemount Systems, Inc. | System and method for detecting an abnormal situation associated with a reactor |
| US20070088528A1 (en) | 2005-10-14 | 2007-04-19 | Fisher-Rosemount Systems, Inc. | Statistical signatures used with multivariate statistical analysis for fault detection and isolation and abnormal condition prevention in a process |
| US20070088534A1 (en) | 2005-10-18 | 2007-04-19 | Honeywell International Inc. | System, method, and computer program for early event detection |
| US20070088448A1 (en) | 2005-10-19 | 2007-04-19 | Honeywell International Inc. | Predictive correlation model system |
| US20070124113A1 (en) | 2005-11-28 | 2007-05-31 | Honeywell International, Inc. | Fault detection system and method using multiway principal component analysis |
| US7243048B2 (en) | 2005-11-28 | 2007-07-10 | Honeywell International, Inc. | Fault detection system and method using multiway principal component analysis |
| US20080097637A1 (en) | 2006-03-21 | 2008-04-24 | Nguyen Anh T | Application of abnormal event detection (AED) technology to polymers process |
| WO2008047098A1 (en) | 2006-10-18 | 2008-04-24 | Bp Oil International Limited | Abnormal event detection using principal component analysis |
| US20080281557A1 (en) | 2007-02-27 | 2008-11-13 | Emigholz Kenneth F | Method and system of using inferential measurements for abnormal event detection in continuous industrial processes |
| US20090149981A1 (en) | 2007-08-14 | 2009-06-11 | Wayne Errol Evans | System and methods for continuous, online monitoring of a chemical plant or refinery |
Non-Patent Citations (5)
| Title |
|---|
| Bell, Michael B., NOVA Chemicals; Foslien, Wendy K., Honeywell; "Early Event Detection-Results From A Prototype Implementation", 2005 Spring National Meeting Atlanta GA, Apr. 10-14, 17th Annual Ethylene Producers' Conference Session TA006-Ethylene Plant Process Control. |
| Bell, Michael, Errington, Jamie, NOVA Chemicals Corporation; Reising, Dal Vernon, Mylaraswamy, Dinkar, Honeywell Laboratories; "Early Event Detection-A Prototype Implementation". |
| Mylaraswamy, Dinkar, Bullemer, Peter, Honeywell Laboratories; Emigholz, Ken, EMRE, ExxonMobil, "Fielding a Multiple State Estimator Platform", NPRA Computer Conference, Chicago, IL, Nov. 2000. |
| U.S. Appl. No. 11/212,188, filed Apr. 6, 2006, Emigholz. |
| Workman et al. 'Process Analytical Chemistry', In: Analytical Chemistry, vol. 71, No. 12, p. 121-180, Published May 1, 1999. |
Cited By (66)
| Publication number | Priority date | Publication date | Assignee | Title |
|---|---|---|---|---|
| US20090149981A1 (en) * | 2007-08-14 | 2009-06-11 | Wayne Errol Evans | System and methods for continuous, online monitoring of a chemical plant or refinery |
| US20090240637A1 (en) * | 2008-03-18 | 2009-09-24 | Youssef Drissi | Resilient classifier for rule-based system |
| US7958065B2 (en) * | 2008-03-18 | 2011-06-07 | International Business Machines Corporation | Resilient classifier for rule-based system |
| US8904039B1 (en) | 2008-11-10 | 2014-12-02 | Tanium Inc. | Large-scale network querying and reporting |
| US10708116B2 (en) | 2008-11-10 | 2020-07-07 | Tanium Inc. | Parallel distributed network management |
| US8972566B1 (en) * | 2008-11-10 | 2015-03-03 | Tanium Inc. | Distributed statistical detection of network problems and causes |
| US12316486B1 (en) | 2008-11-10 | 2025-05-27 | Tanium Inc. | Parallel distributed network management |
| US11258654B1 (en) | 2008-11-10 | 2022-02-22 | Tanium Inc. | Parallel distributed network management |
| US8903973B1 (en) | 2008-11-10 | 2014-12-02 | Tanium Inc. | Parallel distributed network management |
| US11711810B1 (en) | 2012-12-21 | 2023-07-25 | Tanium Inc. | System, security and network management using self-organizing communication orbits in distributed networks |
| US10136415B2 (en) | 2012-12-21 | 2018-11-20 | Tanium Inc. | System, security and network management using self-organizing communication orbits in distributed networks |
| US9246977B2 (en) | 2012-12-21 | 2016-01-26 | Tanium Inc. | System, security and network management using self-organizing communication orbits in distributed networks |
| US12150129B1 (en) | 2012-12-21 | 2024-11-19 | Tanium Inc. | System, security and network management using self-organizing communication orbits in distributed networks |
| US9059961B2 (en) | 2012-12-21 | 2015-06-16 | Tanium Inc. | Creation and maintenance of self-organizing communication orbits in distributed networks |
| US10111208B2 (en) | 2012-12-21 | 2018-10-23 | Tanium Inc. | System and method for performing security management operations in network having non-static collection of nodes |
| US9769037B2 (en) | 2013-11-27 | 2017-09-19 | Tanium Inc. | Fast detection and remediation of unmanaged assets |
| US10148536B2 (en) | 2013-11-27 | 2018-12-04 | Tanium Inc. | Fast detection and remediation of unmanaged assets |
| US20150212501A1 (en) * | 2014-01-30 | 2015-07-30 | Exxonmobil Research And Engineering Company | Real time optimization of batch processes |
| US10133268B2 (en) * | 2014-01-30 | 2018-11-20 | Exxonmobil Research And Engineering Company | Real time optimization of batch processes |
| US9769275B2 (en) | 2014-03-24 | 2017-09-19 | Tanium Inc. | Data caching and distribution in a local network |
| US12309239B1 (en) | 2014-03-24 | 2025-05-20 | Tanium Inc. | Software application updating in a local network |
| US10412188B2 (en) | 2014-03-24 | 2019-09-10 | Tanium Inc. | Data caching, distribution and request consolidation in a local network |
| US11277489B2 (en) | 2014-03-24 | 2022-03-15 | Tanium Inc. | Software application updating in a local network |
| US10873645B2 (en) | 2014-03-24 | 2020-12-22 | Tanium Inc. | Software application updating in a local network |
| US9667738B2 (en) | 2014-03-24 | 2017-05-30 | Tanium Inc. | Local data caching for data transfers on a network of computational devices |
| US10048238B2 (en) | 2014-06-27 | 2018-08-14 | Union Carbide Chemicals & Plastics Technology Llc | Method of monitoring production of a chemical product and a chromatograph used therewith |
| US10047956B2 (en) | 2014-10-22 | 2018-08-14 | Honeywell International Inc. | Monitoring efficiency and operational mode changes of combustion equipment |
| US10649870B1 (en) | 2015-04-24 | 2020-05-12 | Tanium Inc. | Reliable map-reduce communications in a decentralized, self-organizing communication orbit of a distributed network |
| US11461208B1 (en) | 2015-04-24 | 2022-10-04 | Tanium Inc. | Reliable map-reduce communications in a decentralized, self-organizing communication orbit of a distributed network |
| US11809294B1 (en) | 2015-04-24 | 2023-11-07 | Tanium Inc. | Reliable map-reduce communications in a decentralized, self-organizing communication orbit of a distributed network |
| US9910752B2 (en) | 2015-04-24 | 2018-03-06 | Tanium Inc. | Reliable map-reduce communications in a decentralized, self-organizing communication orbit of a distributed network |
| US11914495B1 (en) | 2016-03-08 | 2024-02-27 | Tanium Inc. | Evaluating machine and process performance in distributed system |
| US12132784B1 (en) | 2016-03-08 | 2024-10-29 | Tanium Inc. | Distributed data analysis for streaming data sources |
| US10095864B2 (en) | 2016-03-08 | 2018-10-09 | Tanium Inc. | System and method for performing event inquiries in a network |
| US11153383B2 (en) | 2016-03-08 | 2021-10-19 | Tanium Inc. | Distributed data analysis for streaming data sources |
| US10929345B2 (en) | 2016-03-08 | 2021-02-23 | Tanium Inc. | System and method of performing similarity search queries in a network |
| US12229032B1 (en) | 2016-03-08 | 2025-02-18 | Tanium Inc. | Evaluating machine and process performance in distributed system |
| US11372938B1 (en) | 2016-03-08 | 2022-06-28 | Tanium Inc. | System and method for performing search requests in a network |
| US10372904B2 (en) | 2016-03-08 | 2019-08-06 | Tanium Inc. | Cost prioritized evaluations of indicators of compromise |
| US10482242B2 (en) | 2016-03-08 | 2019-11-19 | Tanium Inc. | System and method for performing event inquiries in a network |
| US11886229B1 (en) | 2016-03-08 | 2024-01-30 | Tanium Inc. | System and method for generating a global dictionary and performing similarity search queries in a network |
| US11609835B1 (en) | 2016-03-08 | 2023-03-21 | Tanium Inc. | Evaluating machine and process performance in distributed system |
| US11700303B1 (en) | 2016-03-08 | 2023-07-11 | Tanium Inc. | Distributed data analysis for streaming data sources |
| US10498744B2 (en) | 2016-03-08 | 2019-12-03 | Tanium Inc. | Integrity monitoring in a local network |
| US20180306443A1 (en) * | 2017-04-24 | 2018-10-25 | Honeywell International Inc. | Apparatus and method for two-stage detection of furnace flooding or other conditions |
| US11215363B2 (en) * | 2017-04-24 | 2022-01-04 | Honeywell International Inc. | Apparatus and method for two-stage detection of furnace flooding or other conditions |
| US10824729B2 (en) | 2017-07-14 | 2020-11-03 | Tanium Inc. | Compliance management in a local network |
| US12449775B2 (en) | 2018-01-30 | 2025-10-21 | Imubit Israel Ltd. | Control system with neural network predictor for industrial processes with chemical reactions |
| US11886154B2 (en) | 2018-01-30 | 2024-01-30 | Imubit Israel Ltd. | Systems and methods for optimizing refinery coker process |
| US11494651B2 (en) | 2018-01-30 | 2022-11-08 | Imubit Israel Ltd | Systems and methods for optimizing refinery coker process |
| US12066800B2 (en) | 2018-01-30 | 2024-08-20 | Imubit Israel Ltd. | Control system with optimization of neural network predictor |
| US11993751B2 (en) | 2018-01-30 | 2024-05-28 | Imubit Israel Ltd. | Predictive control systems and methods with fluid catalytic cracking volume gain optimization |
| US12045022B2 (en) | 2018-01-30 | 2024-07-23 | Imubit Israel Ltd. | Predictive control systems and methods with offline gains learning and online control |
| US12049592B2 (en) | 2018-01-30 | 2024-07-30 | Imubit Israel Ltd. | Predictive control systems and methods with hydrocracker conversion optimization |
| US12556623B1 (en) | 2018-07-18 | 2026-02-17 | Tanium Inc. | Automated mapping of multi-tier applications in a distributed system |
| US11956335B1 (en) | 2018-07-18 | 2024-04-09 | Tanium Inc. | Automated mapping of multi-tier applications in a distributed system |
| US10841365B2 (en) | 2018-07-18 | 2020-11-17 | Tanium Inc. | Mapping application dependencies in a computer network |
| US11343355B1 (en) | 2018-07-18 | 2022-05-24 | Tanium Inc. | Automated mapping of multi-tier applications in a distributed system |
| US12284204B1 (en) | 2019-11-18 | 2025-04-22 | Tanium Inc. | System and method for prioritizing distributed system risk remediations |
| US11831670B1 (en) | 2019-11-18 | 2023-11-28 | Tanium Inc. | System and method for prioritizing distributed system risk remediations |
| WO2021242488A1 (en) * | 2020-05-29 | 2021-12-02 | Imubit Israel Ltd | Systems and methods for optimizing refinery coker process |
| US12231457B1 (en) | 2020-08-24 | 2025-02-18 | Tanium Inc. | Risk scoring based on compliance verification test results in a local network |
| US11777981B1 (en) | 2020-08-24 | 2023-10-03 | Tanium Inc. | Risk scoring based on compliance verification test results in a local network |
| US11563764B1 (en) | 2020-08-24 | 2023-01-24 | Tanium Inc. | Risk scoring based on compliance verification test results in a local network |
| US12056622B2 (en) | 2021-02-03 | 2024-08-06 | International Business Machines Corporation | Identifying influential effects to be adjusted in goal seek analysis |
| US12231467B1 (en) | 2021-10-19 | 2025-02-18 | Tanium Inc. | System and method for deputizing satellite endpoints |
Also Published As
| Publication number | Publication date |
|---|---|
| WO2007124002A2 (en) | 2007-11-01 |
| US20070250292A1 (en) | 2007-10-25 |
| NO20084879L (no) | 2009-01-21 |
| EP2021965A4 (de) | 2014-04-30 |
| JP2009534746A (ja) | 2009-09-24 |
| EP2021965A2 (de) | 2009-02-11 |
| CA2649863A1 (en) | 2007-11-01 |
| CA2649863C (en) | 2013-09-24 |
| WO2007124002A3 (en) | 2009-04-02 |
Similar Documents
| Publication | Publication Date | Title |
|---|---|---|
| US7720641B2 (en) | Application of abnormal event detection technology to delayed coking unit | |
| US8005645B2 (en) | Application of abnormal event detection technology to hydrocracking units | |
| US7567887B2 (en) | Application of abnormal event detection technology to fluidized catalytic cracking unit | |
| US7349746B2 (en) | System and method for abnormal event detection in the operation of continuous industrial processes | |
| US7761172B2 (en) | Application of abnormal event detection (AED) technology to polymers | |
| US7424395B2 (en) | Application of abnormal event detection technology to olefins recovery trains | |
| US10786797B2 (en) | Estimation of cyclone life based on remaining abrasion resistant lining thickness |
Legal Events
| Date | Code | Title | Description |
|---|---|---|---|
| AS | Assignment |
Owner name: EXXONMOBIL RESEARCH AND ENGINEERING COMPANY, NEW J Free format text: ASSIGNMENT OF ASSIGNORS INTEREST;ASSIGNORS:ALAGAPPAN, PERRY;WOO, STEPHEN S.;WORDEN, KEVIN R.;AND OTHERS;REEL/FRAME:023840/0211;SIGNING DATES FROM 20070606 TO 20070618 Owner name: EXXONMOBIL RESEARCH AND ENGINEERING COMPANY,NEW JE Free format text: ASSIGNMENT OF ASSIGNORS INTEREST;ASSIGNORS:ALAGAPPAN, PERRY;WOO, STEPHEN S.;WORDEN, KEVIN R.;AND OTHERS;SIGNING DATES FROM 20070606 TO 20070618;REEL/FRAME:023840/0211 |
|
| STCF | Information on status: patent grant |
Free format text: PATENTED CASE |
|
| FPAY | Fee payment |
Year of fee payment: 4 |
|
| MAFP | Maintenance fee payment |
Free format text: PAYMENT OF MAINTENANCE FEE, 8TH YEAR, LARGE ENTITY (ORIGINAL EVENT CODE: M1552) Year of fee payment: 8 |
|
| MAFP | Maintenance fee payment |
Free format text: PAYMENT OF MAINTENANCE FEE, 12TH YEAR, LARGE ENTITY (ORIGINAL EVENT CODE: M1553); ENTITY STATUS OF PATENT OWNER: LARGE ENTITY Year of fee payment: 12 |