WO2010016109A1 - サンプルの帰属クラス予測方法、帰属クラス予測プログラムおよび帰属クラス予測装置 - Google Patents
サンプルの帰属クラス予測方法、帰属クラス予測プログラムおよび帰属クラス予測装置 Download PDFInfo
- Publication number
- WO2010016109A1 WO2010016109A1 PCT/JP2008/064058 JP2008064058W WO2010016109A1 WO 2010016109 A1 WO2010016109 A1 WO 2010016109A1 JP 2008064058 W JP2008064058 W JP 2008064058W WO 2010016109 A1 WO2010016109 A1 WO 2010016109A1
- Authority
- WO
- WIPO (PCT)
- Prior art keywords
- sample
- learning
- class
- discrimination score
- samples
- Prior art date
- Legal status (The legal status is an assumption and is not a legal conclusion. Google has not performed a legal analysis and makes no representation as to the accuracy of the status listed.)
- Ceased
Links
Images



Classifications
-
- G—PHYSICS
- G16—INFORMATION AND COMMUNICATION TECHNOLOGY [ICT] SPECIALLY ADAPTED FOR SPECIFIC APPLICATION FIELDS
- G16B—BIOINFORMATICS, i.e. INFORMATION AND COMMUNICATION TECHNOLOGY [ICT] SPECIALLY ADAPTED FOR GENETIC OR PROTEIN-RELATED DATA PROCESSING IN COMPUTATIONAL MOLECULAR BIOLOGY
- G16B40/00—ICT specially adapted for biostatistics; ICT specially adapted for bioinformatics-related machine learning or data mining, e.g. knowledge discovery or pattern finding
- G16B40/20—Supervised data analysis
-
- G—PHYSICS
- G06—COMPUTING OR CALCULATING; COUNTING
- G06F—ELECTRIC DIGITAL DATA PROCESSING
- G06F18/00—Pattern recognition
- G06F18/20—Analysing
- G06F18/21—Design or setup of recognition systems or techniques; Extraction of features in feature space; Blind source separation
- G06F18/214—Generating training patterns; Bootstrap methods, e.g. bagging or boosting
-
- G—PHYSICS
- G06—COMPUTING OR CALCULATING; COUNTING
- G06F—ELECTRIC DIGITAL DATA PROCESSING
- G06F18/00—Pattern recognition
- G06F18/20—Analysing
- G06F18/24—Classification techniques
- G06F18/245—Classification techniques relating to the decision surface
- G06F18/2451—Classification techniques relating to the decision surface linear, e.g. hyperplane
-
- G—PHYSICS
- G16—INFORMATION AND COMMUNICATION TECHNOLOGY [ICT] SPECIALLY ADAPTED FOR SPECIFIC APPLICATION FIELDS
- G16B—BIOINFORMATICS, i.e. INFORMATION AND COMMUNICATION TECHNOLOGY [ICT] SPECIALLY ADAPTED FOR GENETIC OR PROTEIN-RELATED DATA PROCESSING IN COMPUTATIONAL MOLECULAR BIOLOGY
- G16B40/00—ICT specially adapted for biostatistics; ICT specially adapted for bioinformatics-related machine learning or data mining, e.g. knowledge discovery or pattern finding
-
- G—PHYSICS
- G06—COMPUTING OR CALCULATING; COUNTING
- G06F—ELECTRIC DIGITAL DATA PROCESSING
- G06F18/00—Pattern recognition
- G06F18/20—Analysing
- G06F18/21—Design or setup of recognition systems or techniques; Extraction of features in feature space; Blind source separation
- G06F18/213—Feature extraction, e.g. by transforming the feature space; Summarisation; Mappings, e.g. subspace methods
- G06F18/2132—Feature extraction, e.g. by transforming the feature space; Summarisation; Mappings, e.g. subspace methods based on discrimination criteria, e.g. discriminant analysis
-
- G—PHYSICS
- G16—INFORMATION AND COMMUNICATION TECHNOLOGY [ICT] SPECIALLY ADAPTED FOR SPECIFIC APPLICATION FIELDS
- G16C—COMPUTATIONAL CHEMISTRY; CHEMOINFORMATICS; COMPUTATIONAL MATERIALS SCIENCE
- G16C20/00—Chemoinformatics, i.e. ICT specially adapted for the handling of physicochemical or structural data of chemical particles, elements, compounds or mixtures
- G16C20/30—Prediction of properties of chemical compounds, compositions or mixtures
-
- G—PHYSICS
- G16—INFORMATION AND COMMUNICATION TECHNOLOGY [ICT] SPECIALLY ADAPTED FOR SPECIFIC APPLICATION FIELDS
- G16C—COMPUTATIONAL CHEMISTRY; CHEMOINFORMATICS; COMPUTATIONAL MATERIALS SCIENCE
- G16C20/00—Chemoinformatics, i.e. ICT specially adapted for the handling of physicochemical or structural data of chemical particles, elements, compounds or mixtures
- G16C20/70—Machine learning, data mining or chemometrics
Definitions
- the present invention relates to a method, a program, and an apparatus for predicting a class to which a sample belongs for a sample whose class is unknown.
- the classification rate and the prediction rate are considerably lower than the character recognition problem.
- the classification rate is 80% to 90%, and the prediction rate is said to be 70% to 80%.
- the cause is that the cause of the toxic expression in the compound is complicated and diverse, and the structure between the compounds is diverse.
- the safety evaluation of a compound is a very important problem. If the classification and prediction are wrong, especially when a toxic compound is classified and predicted as a safe compound, the impact on society is great. In this respect, there is a strong demand to improve the accuracy of classification prediction in the safety evaluation of compounds.
- a learning sample set is discriminated and analyzed, and divided into a sample group clearly belonging to class 1 or class 2 and a sample group (gray class sample) not clearly belonging to which class.
- a sample group with a clear class attribution is assigned to a class based on the result of discriminant analysis, and a gray class sample group is assigned to a new learning sample set to perform a new discriminant analysis. This process is repeated until there is no gray class sample, so that the classification rate is almost 100%.
- a plurality of discriminant functions obtained by performing the KY method serve as a prediction model for predicting the belonging class of a sample whose characteristics for classification are unknown. In this prediction model, since the classification rate is almost 100%, a high prediction rate can be expected.
- a prediction model is created by collecting samples whose characteristic values, i.e., the values of objective variables, are the target of sample prediction, and applying data analysis using this as a learning sample set. As the number of samples included in the learning sample set increases, a more reliable prediction model can be created. Therefore, even if the prediction model is once created, when new data that can be used as a learning sample is accumulated, it is desired to create a new prediction model with a new learning sample set to which the data is added. .
- an object of the present invention is to provide sample assignment that can always perform classification classification prediction of unknown samples using new learning sample data without using an existing prediction model while maintaining a high prediction rate.
- a program and an apparatus therefor This method is called a model-free prediction method in that an existing prediction model is not required.
- a sample attribution class prediction method includes: a) assigning each learning sample to the first or second based on a plurality of explanatory variables generated for each learning sample of the learning sample set. Obtaining a discriminant function for classifying and predicting the class; b) calculating a discriminant score for each learning sample and the unknown sample based on the discriminant function; c) determining a discriminant score for the unknown sample among all the learning samples. Determine whether it is greater than or equal to the maximum discrimination score or less than the minimum discrimination score.
- the sample attribution class prediction program a) assigns each learning sample to the first or second based on a plurality of explanatory variables generated for each learning sample of the learning sample set.
- a procedure for obtaining a discriminant function for classifying and predicting into a class b) a procedure for calculating a discriminant score for each learning sample and an unknown sample based on the discriminant function; and c) a discriminant score for the unknown sample comprising all the learning samples.
- a sample attribution class predicting apparatus analyzes a learning sample set composed of a plurality of samples known to belong to class 1 or class 2 to analyze the class 1 or class 2
- a discriminant analysis is performed based on the explanatory variables generated for and a discriminant function for obtaining the discriminant function for discriminating between the class 1 and the class 2 is obtained.
- the discriminant function creating engine and the learning samples based on the created discriminant function A discrimination score calculation device for calculating a discrimination score of the unknown sample, and a discrimination score of each calculated learning sample Comparing the discrimination score of the unknown sample, comparing the discrimination score comparison device, the attribution class determination device for determining the attribution class of the unknown sample based on the comparison result of the discrimination score comparison device, and the comparison of the discrimination score comparison device
- a sample set setting device that constructs a new learning sample set by removing a learning sample having at least a maximum discrimination score and a learning sample having a minimum discrimination score from the learning sample set based on a result; Using the new learning sample set as the learning sample set, the explanatory variable generating device, the discriminant function creation engine, the discriminant score calculating device, the discriminant score comparing device, the belonging class determining device, and the sample set setting device.
- a control device that repeatedly operates, the belonging class determination device
- the comparison result in the discrimination score comparison device is that the discrimination score of the unknown sample is either greater than or equal to the maximum discrimination score among the learning samples, or less than the minimum discrimination score, the unknown sample According to the discrimination score, the belonging class of the unknown sample is determined.
- a discriminant function for classifying and predicting each learning sample into the first class or the second class can be obtained.
- the discrimination score of each sample calculated based on this discriminant function is considered as an index indicating the probability of classification prediction. Therefore, the learning sample having the maximum discrimination score and the learning sample having the minimum discrimination score have the highest accuracy of class classification prediction performed according to the sign of the discrimination score.
- the class of the unknown sample is determined according to the discrimination score, for example, the sign.
- the unknown sample is not determined according to the discrimination score, and at least the maximum and minimum discrimination from the training sample set A learning sample having a score is removed to construct a new learning sample set. Thereafter, a new discriminant analysis is performed for the new learning sample set. By continuing this until the unknown sample discrimination score is equal to or greater than the maximum discrimination score in the learning sample or smaller than the minimum discrimination score, the unknown sample can be subjected to class classification prediction with very high accuracy.
- class prediction of an unknown sample can be performed in parallel with the data analysis. Therefore, since an existing classification prediction model is not required, it is not necessary to update the classification prediction model as the learning sample data is accumulated.
- the classification classification prediction of unknown samples is performed based on whether the discrimination score of the unknown sample is larger than the maximum discrimination score in the learning sample set or smaller than the minimum discrimination score. Becomes extremely high.
- FIG. 1 shows the pattern space as a result of an ideal two-class classification.
- FIG. 2 shows the pattern space as a result of normal two-class classification.
- FIG. 3 is a flowchart showing a basic processing procedure for implementing the class assignment method for unknown samples.
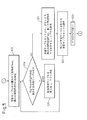
- FIG. 4 is a diagram illustrating a first half of a flowchart illustrating a processing procedure according to an embodiment.
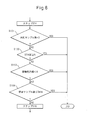
- FIG. 5 is a diagram showing the latter half of the processing procedure of the embodiment shown in FIG.
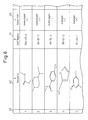
- FIG. 6 is a diagram illustrating an example of the sample data table.
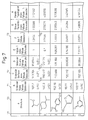
- FIG. 7 is a diagram illustrating an example of the data table of the final parameter set.
- FIG. 8 is a diagram showing details of one step shown in FIG.
- FIG. 9 is a block diagram illustrating a schematic configuration of a characteristic prediction apparatus according to an embodiment.
- Fig. 1 shows the pattern space as a result of ideal two-class classification by discriminant analysis. Ideal means that the classification rate is 100%.
- S indicates an identification plane or hyperplane
- the area A on the right side of the identification plane S is an area where a class 1 sample exists (hereinafter referred to as class 1 area)
- the area B on the left side is a class 2 sample.
- An existing area hereinafter referred to as a class 2 area).
- ⁇ indicates a sample originally belonging to class 1
- x indicates a sample originally belonging to class 2.
- the class 1 sample ⁇ and the class 2 sample x are located on both sides of the identification surface S, respectively, and the class 1 region A and class 2 The region B in FIG. However, in the normal two-class classification, the region A and the region B overlap.
- Fig. 2 shows the pattern space as a result of normal two-class classification.
- the classification rate is less than 100%, the areas A and B are not completely classified by the identification surface S and an overlapping area C is formed as shown in the figure.
- the sample is originally a class 1 sample, it enters the class 2 region and is mistakenly classified as a class 2 sample.
- the sample is originally a class 2 sample, it enters the class 1 region and mistakenly class 1 Sample 2 is generated that is classified as a sample.
- These incorrectly classified samples are called misclassified samples, and correctly classified samples are called correct classified samples. Accordingly, misclassified samples include both samples that are originally class 1 and samples that are originally class 2.
- the discriminant function (prediction model) Y for discriminating between class 1 and class 2 is represented by the following formula (1).
- Y represents the value of the objective variable
- x1, x2,... Xn are the values of the explanatory variables (hereinafter referred to as parameters), a1, a2,. Show.
- the values x1, x2,... Xn of the explanatory variables are different values for each sample, and the weighting coefficients a1, a2,.
- the weight coefficient is selected so that the sample belonging to class 1 has a positive value of the objective variable Y, and the sample belonging to class 2 has a negative value of the objective variable Y.
- the identification surface S shown in FIGS. 1 and 2 is a plane (hyperplane) in which the value of Y is zero.
- the value Y (k) of the objective variable for each sample can be obtained.
- This value Y (k) is meant as “object variable” or “independent variable” in discriminant analysis, but when viewed as numerical data, it indicates “discriminant score” which is a continuous variable.
- the discrimination score indicates the distance between each sample and the identification surface S in the pattern space.
- the discriminant function is usually created so that the discrimination score of the class 1 sample has a plus (positive) sign and the discrimination score of the class 2 sample has a minus (negative) sign. Therefore, the determination of the belonging class of a sample has meaning only whether the discrimination score is positive or negative.
- the magnitude (absolute value) of the discrimination score does not indicate the magnitude or strength of the characteristic for classification purposes.
- the discrimination score Y (k) is calculated by applying the parameter value specified by each sample to Equation (1), the relationship between the samples based on the discrimination score Y (k) is fixed. Yes.
- the misclassified samples 1 and 2 tend to occur in the vicinity of the identification surface S. That is, misclassified samples 1 and 2 are likely to occur in a region where the distance between the identification surface S and the sample is small. As the distance between the identification surface S and the sample increases, the degree of occurrence of misclassified samples decreases.
- the discrimination score Y (k) represents the distance between the discrimination surface S and the sample. Therefore, the probability of occurrence of misclassified samples decreases as the discrimination score increases or decreases. That is, the discrimination score may be considered as an index indicating the probability of class attribution.
- the predicted value of the objective variable is obtained for a sample whose value of the objective variable is unknown, that is, when the belonging class is predicted, the value of the explanatory variable is calculated for the unknown sample, and this is substituted into Equation (1).
- the class to which the unknown sample belongs is determined. For example, if the value of Y is positive, the unknown sample is assigned to class 1, and if the value of Y is negative, the unknown sample is assigned to class 2.
- the present inventor determines the misclassification region C based on the discriminant score of each learning sample, and performs a new discriminant analysis on the result, thereby obtaining a classification rate of almost 100%.
- a method for creating a prediction model having the same has already been proposed (PCT / 2007/073334).
- the discrimination score of each learning sample is calculated based on the discriminant function obtained for the learning sample set, and the belonging class of each learning sample is predicted.
- the prediction class is compared with the class based on the actual measurement value, and if the two do not match, the sample is set as a misclassified sample.
- the maximum and minimum discrimination scores are detected in the misclassified samples, and the area between them is defined as misclassified area C. If the misclassified region C is specified, it can be determined whether or not the prediction of the unknown samples 10a and 10b based on the discrimination score is correct.
- the discriminant score of each learning sample is obtained, and at the same time, the value is compared with the actual measurement value to determine whether each learning sample is a misclassified sample or a correct classified sample.
- the misclassified region C cannot be accurately specified. From this point of view, the present inventor considered that if the classification prediction can be executed without specifying the misclassification region C, the prediction process is simplified and the prediction accuracy is further improved.
- the misclassified sample has a high probability of being present in the vicinity of the identification surface S.
- the sample classification prediction becomes more accurate.
- the sample having the maximum discrimination score Pmax and the sample having the minimum discrimination score Pmini are normal classification samples.
- samples in the vicinity of these samples are also normal classification samples. Or the probability of being a correct classification sample is very high.
- the unknown sample can be reliably predicted to be a class 1 sample or a class 2 sample.
- the class prediction based on the discrimination score is determined to be accurate. Otherwise, By determining that the class prediction is not accurate, the class prediction of the unknown sample can be performed with high accuracy without specifying the misclassified region C.
- FIG. 3 is a flowchart showing a basic procedure for performing class attribution prediction of an unknown sample in a model-free manner based on the judgment criteria regarding the accuracy of prediction as described above. Note that FIG. 3 shows a procedure for predicting the class membership of one unknown sample in a model-free manner, but it is easy to apply this flowchart to the case of simultaneously predicting the class membership of a plurality of unknown samples.
- step S1 a plurality of learning samples whose target variable is actually measured, that is, whether it is class 1 or class 2, are prepared and input to a discriminant analysis system, and these are classified into two classes. Perform analysis.
- step S2 the discriminant score of each learning sample is calculated using the discriminant function obtained by the discriminant analysis in step S1.
- step S3 a discrimination score of a sample whose objective variable is unknown is calculated using the same discrimination function.
- the discrimination scores obtained in steps S2 and S3 are sorted in order of magnitude, and the discrimination score R of the unknown sample is compared with the maximum discrimination score Pmax and the minimum discrimination score Pmini of the learning sample.
- step S7 the unknown sample is scored. Based on the positive / negative of the discrimination score R, class assignment of an unknown sample is performed, and prediction is terminated.
- step S4 determines whether the discrimination score R of the unknown sample is smaller than the maximum discrimination score Pmax in the learning sample and larger than the minimum discrimination score Pmini (NO in step S4). If it is determined in step S4 that the discrimination score R of the unknown sample is smaller than the maximum discrimination score Pmax in the learning sample and larger than the minimum discrimination score Pmini (NO in step S4), the process proceeds to step S5. Transition to remove a number of learning samples from the learning sample set and build a new sample set.
- the learning samples to be removed may be specified as 1) m samples in the descending order of discrimination score from the sample with the largest discrimination score, and n samples in descending order of discrimination score from the sample with the smallest discrimination score.
- m n or m ⁇ n.
- the values of m and n may be determined in consideration of class population.
- the number of samples to be removed in step S4 is two in total: the sample with the largest discrimination score and the sample with the smallest discrimination score. Therefore, in step S4, at least the learning sample with the largest discrimination score and the learning sample with the smallest discrimination score are removed.
- the number of samples to be removed in one discriminant analysis may be determined based on this maximum number. good. For example, if the total number of samples is 1000 and the maximum number of repetitions is 100, if 10 samples are removed in one discriminant analysis, all samples are removed in 100 discriminant analyses. be able to.
- a new learning sample set is constructed from the remaining learning samples, and the process returns to step S1 to start a new discriminant analysis.
- the learning sample set is different from the initial learning sample set, a new combination of explanatory variables (final parameter set) is selected as a result of feature extraction, and a discriminant function different from the first discriminant analysis is obtained. can get.
- the pattern space obtained by the first discriminant analysis is different from the pattern space obtained by the second discriminant analysis.
- the discriminant score of each learning sample and unknown sample is different from the discriminant score in the first discriminant analysis.
- step S4 the magnitudes of the learning sample and the unknown sample are compared based on the newly calculated discrimination score. If YES is determined in step S4, the class attribution is determined in step S7 based on the sign of the unknown sample discrimination score. If it is determined NO in step S4, step S5 and subsequent steps are executed.
- step S4 class attribution of an unknown sample can be accurately predicted without specifying a misclassified region (gray zone).
- the maximum number of repetitions may be set in advance.
- the classification rate and the prediction rate decrease as the number of learning samples increases.
- the number of repetitions of steps S1 to S6 is increased, and the unknown is performed without reducing the accuracy of class prediction.
- Predict class membership of samples Therefore, even if tens of thousands or hundreds of thousands of compound data are accumulated by the operation of the REACH rule, all these are used as learning samples, and the prediction accuracy is maintained at a high level, and class assignment of unknown samples is performed. Can be predicted.
- the sample is a compound
- target variables for prediction are activity (+, mutagen) and inactivity (-, non-mutagen) in the Ames test.
- FIG. 4 and FIG. 5 are flowcharts showing an implementation procedure for predicting activity and inactivity in the Ames test of a compound.
- a learning sample set and an unknown sample that is a prediction target compound are prepared and input to the system.
- the learning sample set is composed of a plurality of compounds whose measured values of activity and inactivity in the Ames test are known.
- An unknown sample is a sample whose chemical structure is known but whose actual values of activity and inactivity in the Ames test are unknown. There may be one unknown sample or a plurality of unknown samples.
- the prepared learning sample is input to the sample belonging class prediction device in the form of a one-dimensional, two-dimensional, or three-dimensional structural formula, and a table for storing sample data as shown in FIG. 6 is created.
- a column 60 indicates a two-dimensional or three-dimensional structural formula of a sample compound.
- Column 61 shows the CAS number of the compound, and column 62 shows the results of the Ames test.
- mutagen indicates mutagenicity (+) as a result of the Ames test, and nonmutagen indicates no mutagenicity ( ⁇ ).
- a data table is shown for classifying a sample that is mutagen into class 1 (positive class) and a sample that is non- mutagen into class 2 (negative class).
- Column 63 shows the sample number.
- a similar data table is created for the unknown sample, but the column 62 describing the measured values of the Ames test is blank.
- initial parameters for calculating the objective variable that is, the values of the explanatory variables (x1, x2,... Xx) are generated.
- Initial parameters can be automatically generated from the structure of the compound.
- ADMEWORKS-ModelBuilder registered trademark sold by Fujitsu Limited can automatically generate about 800 parameters based on the two-dimensional or three-dimensional structure of the compound and various physical properties. Initial parameters are generated for each learning sample and unknown sample.
- STAGE is set to 1 in order to start the first discriminant analysis.
- step S13 feature extraction is performed on the initial parameters of the learning sample, and noise parameters unnecessary for classification are removed. Thereby, the final parameter set (x1, x2,... Xn) is determined (step S14).
- the feature extraction can be performed using various known methods such as a single correlation coefficient, a multiple correlation coefficient, an appearance frequency, a Fischer ratio, and a Variance method.
- Various engines for feature extraction are also generally provided.
- FIG. 7 is a table showing the final parameter set selected as having an influence on the Ames test result as a result of feature extraction, and numerical data for these parameters of individual compounds.
- Column 70 identifies the compound by structural formula, and column 71 and subsequent columns indicate various parameters.
- column 71 indicates the molecular weight of the compound
- column 72 indicates the molecular surface area
- column 73 indicates the logP value as a parameter.
- the value written in the cell 74 in the data table is the data indicating the molecular weight of one molecule of the sample
- the value in the cell 75 is the data indicating the molecular surface area of the sample 1
- the value in the cell 76 is the logP of the sample 1. It is data indicating a value.
- the value shown in each cell becomes the parameter data of that sample.
- Column 77 indicates the sample number of each sample.
- step S14 it is determined whether or not an analysis end condition is satisfied.
- the analysis termination conditions include, for example, that there are no unknown samples to be assigned (class prediction), whether the maximum number of STAGEs set in advance has been reached, the number of samples in the learning sample set is Whether or not the predetermined number or less is set, or whether or not the reliability index is equal to or less than a predetermined value.
- the reliability index is a value obtained by dividing the number of samples by the number of parameters, and when this value is small, the discriminant obtained from these samples and parameters has little meaning in terms of science and data analysis, The analysis is judged to have failed. In a normal discriminant analysis, 4 is set as this value, but a larger value than 4 is regarded as a more reliable discriminant.
- FIG. 8 shows details of step S15.
- Steps S151 to S154 correspond to step S15 in FIG.
- step S151 it is confirmed whether there is an unknown sample to be predicted. When there is no unknown sample (YES in step S151), the prediction process ends.
- step S152 it is determined whether or not the current processing stage has reached a predetermined maximum number N of stages. If the number of stages is N or more (YES in step S152), the process ends.
- step S153 it is determined whether or not the value of the reliability index determined by the number of samples and the number of parameters is less than 4. If the reliability index is 4 or less (YES in step S153), the process ends.
- step S154 it is determined whether or not the learning sample number has reached a predetermined minimum sample number Smini. If the number of samples is equal to or less than the minimum number (YES in step S154), the process ends.
- step S16 is executed when all of the end conditions are not satisfied.
- steps S151 to S154 may be arbitrary, and steps S152 and 154 may be omitted.
- steps S152 and 154 may be omitted.
- a restriction on processing time may be included.
- step S15 when the end condition is satisfied in step S15 (YES in step S15), the analysis process is ended. If the termination condition is not reached in step S15 (NO in step S15), a discriminant for the first stage (STAGE 1) is constructed using the final parameter set in step S16. In discriminant analysis, the discriminant function is expressed as the above equation (1).
- step S17 the discriminant score of each learning sample is calculated using the created discriminant function, and further, the discriminant score of an unknown sample is calculated using the same discriminant function.
- the parameter data x11, x21, x31,... are obtained from the data described in each cell in FIG. Accordingly, when the coefficients a1, a2,... Are obtained for each parameter by discriminant analysis, the discriminant score Yk of the sample k is obtained by introducing the data in each cell shown in the table of FIG. Calculated.
- step S18 the maximum discrimination score Pmax and the minimum discrimination score Pmini of the learning samples are specified by sorting the discrimination scores Yk for all the learning samples.
- the discrimination score R of the unknown sample obtained in step S17 is compared with the maximum and minimum discrimination scores Pmax and Pmini of the learning sample, and whether there is an unknown sample satisfying R ⁇ Pmax or R ⁇ Pmini. Determine whether. If there is an unknown sample satisfying R ⁇ Pmax or R ⁇ Pmini among a plurality of unknown samples (YES in step S19), the sample is taken out and assigned in accordance with the sign of the discrimination score (step S20).
- step S19 and step S20 are repeatedly executed until there is no other unknown sample satisfying R (unknown sample discrimination score) ⁇ Pmax or R ⁇ Pmini in step S19.
- R unknown sample discrimination score
- step S21 a sample with a large or small discrimination score is removed from each class of the learning sample set according to the sample removal rule.
- the rule for sample removal may be any rule described with reference to FIG. 3 and may be arbitrarily designated by the user.
- step S22 the remaining learning samples are set as a new learning sample set.
- Step S15 the analysis termination condition is satisfied in Step S15, and thus the classification prediction process is terminated at that time.
- the belonging class determination of the unknown sample is performed when the discrimination score of the unknown sample is equal to or greater than the maximum discrimination score Pmax of the learning sample, or when it is equal to or less than the minimum discrimination score Pmini. Reliability is very high.
- the same method may be used in each STAGE, or a different method may be used.
- the Bayes discriminant analysis method may be used in STAGE 1 and the AdaBoost method may be used in STAGE 2.
- the number of learning samples to be removed in each stage may be fixed, or a different number may be set for each stage. For example, a relatively large number of samples may be removed in a relatively early stage, and a smaller number of samples may be removed in a higher-order stage.
- FIG. 9 is a block diagram showing a schematic configuration of the sample belonging class prediction apparatus according to the third embodiment.
- the prediction device 100 includes an input device 110 that inputs data of learning samples and unknown samples, and an output device 120 that outputs prediction results of unknown samples or necessary data during processing.
- the sample is a compound
- the value of a known objective variable of the compound that is, information on whether it is class 1 or class 2, for example, safety data
- the value of the objective variable is not input.
- reference numeral 150 denotes a table for storing a final parameter set, which stores the final parameter set as a result of performing feature extraction on the initial parameter set.
- Reference numeral 160 denotes a prediction result storage table that stores class assignment information about unknown samples, that is, prediction result information. Normally, these tables 130, 140, 150 and 160 are stored in one storage device.
- the analysis unit 200 includes a control unit 220, an initial parameter generation engine 210, a feature extraction engine 230, a discrimination function creation engine 240, a discrimination score calculation unit 250, a sample set setting unit 260, an analysis end condition detection unit 270, and a discrimination score comparison unit. 280 and a class assignment execution unit 290.
- the initial parameter generation engine 210 is not required when the initial parameters are generated outside the apparatus.
- the initial parameter generation engine 210 When the sample is a compound, the initial parameter generation engine 210 generates a plurality of structure descriptors based on the structural formula of the compound input from the input device 110.
- Reference numeral 300 denotes a sample library, which stores, as library data, the structural formulas, safety data, initial parameter values, and the like of learning samples used for past characteristic prediction.
- the feature extraction engine 230 performs feature extraction on the initial parameter set, determines a final parameter set, and stores the final parameter set in the final parameter set table 130.
- the discriminant function creation engine 240 includes various existing discriminant analysis engines, and refers to the final parameter set table 130 using a discriminant analysis engine arbitrarily designated by the user or a discriminant analysis engine appropriately selected by the system. While performing discriminant analysis of the input sample, a discriminant function is created.
- the discriminant score calculation unit 250 calculates the discriminant score of each sample by inputting the parameters of each sample into the discriminant function created by the discriminant function creation engine 240.
- the sample set setting unit 260 removes samples having a large discrimination score and small samples from the learning sample set according to a preset sample removal rule, and constructs a new learning sample set.
- the feature extraction engine 230, the discriminant function creation engine 240, the discriminant score calculation unit 250, and the new sample set setting unit 260 operate under the control of the control unit 220, and execute the processes shown in FIGS.
- the analysis end condition detection unit 270 is 1) when the unknown sample for predicting the belonging class becomes 0, 2) when the repetition of the process exceeds a preset number of times (or time), and 3) newly set. The execution of the analysis is stopped at any time when the number of samples in the learning sample set is equal to or less than the predetermined number, or 4) when the reliability index is equal to or less than a predetermined value.
- the discrimination score comparison unit 280 compares the discrimination score R of the unknown sample with the maximum discrimination score Pmax or the minimum discrimination score Pmini of the learning sample.
- the belonging class determination unit 290 performs class assignment of unknown samples based on the result of the discrimination score comparison unit 280. That is, if the discrimination score R of the unknown sample is greater than or equal to the maximum discrimination score Pmax of the learning sample or less than the minimum discrimination score Pmini, the unknown sample is assigned to a class based on the sign of the discrimination score R, and none of them Do not make class assignments.
- the result of the belonging class determination unit 290 is temporarily stored in the prediction result storage table 160 and then output in an arbitrary shape via the output device 120.
- the output device various storage devices, displays, printers, and the like can be selected.
- various files for example, USB files), display display, printout, and the like can be selected as appropriate.
- Each program described above can be stored in a computer-readable recording medium, and these recording media can be distributed and distributed. Similarly, each of the above programs can be distributed and distributed via a communication line such as the Internet.
- the computer-readable recording medium include a magnetic recording device, an optical disk, a magneto-optical disk, and a semiconductor memory (RAM, ROM, etc.).
- the magnetic recording device includes a hard disk drive (HDD), a flexible disk (FD), a magnetic tape (MT), and the like.
- the optical disc include a DVD (Digital Versatile Disc), a DVD-RAM, a CD-ROM, a CD-R, and a CD-RW.
- the magneto-optical disk include MO (Magneto-Optical disc).
- the learning sample data input via the input device 110 and the initial parameter set data generated for these learning samples are input and stored in the sample library via the analysis unit 200. Therefore, using the sample library 300, when performing class attribution prediction of an unknown sample, the prediction can be executed only by inputting the structural formula data of the unknown sample via the input device 110.
- the latest learning sample is stored together with the existing learning sample data stored in the sample library 300 by inputting the data from the input device 110 to the belonging class prediction device 100. You can create a set. Class prediction is performed using this latest learning sample set as an initial sample set. Therefore, in this apparatus, the characteristic prediction of an unknown sample can be executed by a database to which a new learning sample is always added.
- the input device 110 and the output device 120 may be configured with a display device having an interactive graphic user interface.
- the analysis end condition selection, sample removal rule selection, and the like may be performed while the user interacts with the computer via the display screen.
- the method, program, and apparatus disclosed in this specification can be applied to all industrial fields to which the two-class classification can be applied.
- the main application fields are listed below.
- the Ames test is incorporated as one of the most important items in the national level compound regulations such as the compound examination law and the occupational safety and health law related to the toxic compound regulations. If the Ames test is not passed, compound production will not be possible in Japan, and the company's production activities will be stopped. In addition, overseas production, exports, etc. will not be able to operate due to the safety regulations of the target countries.
- the REACH regulation in the European Parliament obliges companies that use a compound to predict and evaluate the results of the Ames test for that compound.
- the present invention provides a very useful tool for predicting such test results.
- the Ames test is one of mutagenicity tests developed by Dr. Ames in the United States, and is a simple method for carcinogenicity tests. For this reason, it is a test adopted as a guideline for the safety of many chemical substances or products using these chemical substances.
Landscapes
- Engineering & Computer Science (AREA)
- Data Mining & Analysis (AREA)
- Physics & Mathematics (AREA)
- Life Sciences & Earth Sciences (AREA)
- Theoretical Computer Science (AREA)
- Medical Informatics (AREA)
- Health & Medical Sciences (AREA)
- Evolutionary Biology (AREA)
- Evolutionary Computation (AREA)
- Bioinformatics & Computational Biology (AREA)
- Artificial Intelligence (AREA)
- Computer Vision & Pattern Recognition (AREA)
- Bioinformatics & Cheminformatics (AREA)
- Bioethics (AREA)
- Biophysics (AREA)
- Databases & Information Systems (AREA)
- Epidemiology (AREA)
- Public Health (AREA)
- Software Systems (AREA)
- Biotechnology (AREA)
- General Health & Medical Sciences (AREA)
- Spectroscopy & Molecular Physics (AREA)
- General Physics & Mathematics (AREA)
- General Engineering & Computer Science (AREA)
- Information Retrieval, Db Structures And Fs Structures Therefor (AREA)
Abstract
既成の予測モデルを使用することなく、高い精度で未知サンプルの帰属クラスを予測する。 未知サンプルの帰属クラスを予測するために、a)学習サンプルセットをデータ解析して各学習サンプルを第1または第2のクラスに分類予測する判別関数を求め、b)前記判別関数に基づいて各学習サンプルと未知サンプルの判別得点を算出し、c)未知サンプルの判別得点が、全ての学習サンプルのうちの最大の判別得点以上あるいは最小の判別得点以下の何れかであるか否かを判定し、d)前記c)で肯定判断の場合、前記未知サンプルの判別得点に従ってその帰属クラスを決定し、e)前記c)で否定判断の場合、少なくとも、前記最大の判別得点を有する学習サンプルと前記最小の判別得点を有する学習サンプルとを学習サンプルセットから除去して、残りの学習サンプルによって新たな学習サンプルセットを構築し、f)前記a)~e)のステップを繰り返す。
Description
本発明は、クラス未知のサンプルについて、そのサンプルが帰属するクラスを予測するための方法、プログラムおよび装置に関する。
典型的なクラス分類問題として文字認識問題がある。そのデータ解析は極めて高い水準まで達しており、一般には99%以上の認識率が達成される。一方で、環境問題等で最近注目されるようになった化合物の毒性(以下、安全性)評価のための二クラス分類問題では、文字認識問題に比べてその分類率や予測率はかなり低い。通常、分類率としては80%から90%が精々であり、予測率は70%から80%が限界と言われている。その原因は、化合物における毒性発現の要因が複雑で多岐にわたること、更に化合物間の構造が多様であること等である。ところが、化合物の安全性評価は極めて重要性の高い問題であり、その分類や予測が間違った場合、特に、毒性化合物を安全な化合物と分類予測した場合に社会に与えるインパクトは大きい。この点で、化合物の安全性評価における分類予測の正確さを改善することが強く求められている。
従って、現在、化合物のクラス分類問題において分類率を上げることが特に重要な問題であると認識され、そのために種々の努力がなされている。本発明者は、二クラス分類問題において分類率を限りなく100%に近づけることが可能な方法、即ち、「K-step・Yard・sampling・method」(以下、KY法)を提案している(特許文献1、非特許文献1参照)。
この方法では、まず、学習サンプルセットを判別分析して、クラス1あるいはクラス2に属することが明確なサンプル群と、どちらのクラスに属するかが明確でないサンプル(グレークラスサンプル)群に別ける。クラス帰属が明確なサンプル群については判別分析の結果に基づくクラスにアサインし、グレークラスサンプル群についてはこれを新たな学習サンプルセットに設定して新たな判別分析を行う。このプロセスをグレークラスサンプルがなくなるまで繰り返すことにより、分類率をほぼ100%とするようにしている。
KY法を実施することによって得られた複数の判別関数は、分類目的である特性が未知のサンプルについて、その帰属クラスを予測するための予測モデルとなる。この予測モデルでは分類率がほぼ100%であるため、高い予測率を期待することができる。
最近、EUでREACH規則の運用が開始されており、その運用に伴って化合物の毒性に関して大量のデータの蓄積が進むものと考えられる。通常、予測モデルは、サンプルの予測目的である特性値、即ち、目的変数の値が既知のサンプルを集め、これを学習サンプルセットとしてデータ解析を適用することにより作成される。学習サンプルセットに含まれるサンプル数が多いほど、信頼性の高い予測モデルを作成することができる。したがって、一旦作成された予測モデルであっても、学習サンプルとして使用可能な新たなデータが蓄積されると、そのデータを加えた新たな学習サンプルセットで新たな予測モデルを作成することが望まれる。
しかしながら、そのためには定期的に予測モデルを更新する必要があり、多大の労力と経費を要する。上述したKY法によって予測モデルを作成する場合、学習サンプルセットを何段階にもわたって判別分析する必要があり、1個の学習サンプルセットから予測モデルを作成するためには、従来の方法に比べてより多くの労力と経費を要する。したがって、固定された学習サンプルセットに基づいて作成された予測モデルを使用することなく、未知サンプルの予測を行うことができれば、極めて効率的に未知サンプルの帰属を決定することができる。また、その場合、常に新しいデータを加えた学習サンプルセットに基づいてクラス帰属を予測することが可能となるため、予測率の向上が期待される。
したがって、本発明の課題は、高い予測率を維持しながら、既成の予測モデルを使用することなく、常に新しい学習サンプルデータを用いて未知サンプルのクラス分類予測を行うことが可能な、サンプルの帰属クラス予測方法、そのためのプログラムおよび装置を提供することである。既成の予測モデルを必要としない点で、この方法をモデルフリー予測方法と呼ぶ。
前記課題を解決するために、サンプルの帰属クラス予測方法は、a)学習サンプルセットの各学習サンプルに対して発生させた複数の説明変数に基づいて、前記各学習サンプルを第1または第2のクラスに分類予測する判別関数を求め、b)前記判別関数に基づいて前記各学習サンプルと未知サンプルの判別得点を算出し、c)前記未知サンプルの判別得点が、前記全ての学習サンプルのうちの最大の判別得点以上あるいは最小の判別得点以下の何れかであるか否かを判定し、d)前記c)で肯定判断の場合、前記未知サンプルの判別得点に従ってその帰属クラスを決定し、e)前記c)で否定判断の場合、少なくとも、前記最大の判別得点を有する学習サンプルと前記最小の判別得点を有する学習サンプルとを前記学習サンプルセットから除去して、残りの学習サンプルによって新たな学習サンプルセットを構築し、f)前記新たな学習サンプルセットに対して、前記a)~e)のステップを繰り返す、各ステップを備える。
前記課題を解決するために、サンプルの帰属クラス予測プログラムは、a)学習サンプルセットの各学習サンプルに対して発生させた複数の説明変数に基づいて、前記各学習サンプルを第1または第2のクラスに分類予測する判別関数を求める手順と、b)前記判別関数に基づいて各学習サンプルと未知サンプルの判別得点を算出する手順と、c)前記未知サンプルの判別得点が、前記全ての学習サンプルのうちの最大の判別得点以上あるいは最小の判別得点以下の何れかであるか否かを判定する手順と、d)前記c)で肯定判断の場合、前記未知サンプルの判別得点に従ってその帰属クラスを決定する手順と、e)前記c)で否定判断の場合、少なくとも、前記最大の判別得点を有する学習サンプルと前記最小の判別得点を有する学習サンプルとを前記学習サンプルセットから除去して、残りの学習サンプルによって新たな学習サンプルセットを構築する手順と、f)前記新たな学習サンプルセットに対して、前記a)~e)の手順を繰り返して実行する手順と、をコンピュータに実行させる。
前記課題を解決するために、サンプルの帰属クラス予測装置は、クラス1あるいはクラス2に帰属することが既知の複数のサンプルで構成される学習サンプルセットをデータ解析して、前記クラス1あるいはクラス2への帰属が不明である未知サンプルの帰属クラスを予測する装置であって、前記学習サンプルセットの各学習サンプルと前記未知サンプルに対して説明変数を発生する説明変数発生装置と、前記各学習サンプルについて発生した説明変数に基づいて判別分析を行い、上記クラス1およびクラス2を判別するための判別関数を得る、判別関数作成エンジンと、前記作成された判別関数に基づいて、前記各学習サンプルと前記未知サンプルの判別得点を算出する、判別得点算出装置と、前記算出された各学習サンプルの判別得点と前記未知サンプルの判別得点を比較する、判別得点比較装置と、前記判別得点比較装置の比較結果に基づいて、前記未知サンプルの帰属クラスを決定する帰属クラス決定装置と、前記判別得点比較装置の比較結果に基づいて、前記学習サンプルセットから、少なくとも最大の判別得点を有する学習サンプルと最小の判別得点を有する学習サンプルとを取り除いて新たな学習サンプルセットを構築するサンプルセット設定装置と、前記設定された新たな学習サンプルセットを前記学習サンプルセットとして用いて前記説明変数発生装置、前記判別関数作成エンジン、前記判別得点算出装置、前記判別得点比較装置、前記帰属クラス決定装置および前記サンプルセット設定装置を繰り返し動作させる制御装置と、を備え、前記帰属クラス決定装置は、前記判別得点比較装置における比較結果が、前記未知サンプルの判別得点が前記各学習サンプルのうちの最大の判別得点以上か、あるいは最小の判別得点以下かの何れかである場合、前記未知サンプルの判別得点にしたがって前記未知サンプルの帰属クラスを決定するようにしている。
学習サンプルセットを判別分析することにより、各学習サンプルを第1のクラスまたは第2のクラスに分類予測する判別関数を得ることができる。この判別関数に基づいて計算された各サンプルの判別得点は、分類予測の確からしさを示す指標と考えられる。したがって、最大の判別得点を有する学習サンプル、最小の判別得点を有する学習サンプルは、判別得点の符号に従って行われるクラス分類予測の精度がもっとも高い。
未知サンプルの判別得点を同じ判別式を用いて計算し、もしこの判別得点が、学習サンプル中の最大の判別得点以上か、あるいは最小の判別得点以下の場合、判別得点に従った未知サンプルのクラス分類精度は、前記最大あるいは最小の判別得点を有する学習サンプルのクラス分類精度と同じかそれ以上となる。したがって、この場合、未知サンプルのクラスを判別得点の、例えば符号にしたがって決定する。
一方、未知サンプルの判別得点が、学習サンプル中の最大の判別得点より小さくかつ最小の判別得点以上の場合、判別得点にしたがって未知サンプルをクラス決定せず、学習サンプルセットから少なくとも最大、最小の判別得点を有する学習サンプルを除去して新たな学習サンプルセットを構築する。その後、この新たな学習サンプルセットについて新たな判別分析を行う。これを、未知サンプルの判別得点が、学習サンプル中の最大の判別得点以上か、あるいは最小の判別得点より小さくなるまで続けることにより、未知サンプルを非常に高い精度でクラス分類予測することができる。
本明細書で開示する方法、プログラムおよび装置によれば、学習サンプルセットが存在すればそのデータ解析と並行して未知サンプルのクラス予測を行うことができる。したがって、既成の分類予測モデルを必要としないので、学習サンプルデータの蓄積に伴って分類予測モデルを更新する必要がなくなる。また、未知サンプルのクラス分類予測は、未知サンプルの判別得点が、学習サンプルセット中の最大の判別得点よりも大かあるいは最小の判別得点よりも小さいかに基づいて行われるため、その分類予測精度は極めて高くなる。
1 クラス1の誤分類サンプル
2 クラス2の誤分類サンプル
100 サンプルの帰属クラス予測装置
110 入力装置
120 出力装置
130 入力データテーブル
140 初期パラメータセットテーブル
150 最終パラメータセットテーブル
160 予測結果保存テーブル
200 解析部
210 初期パラメータ発生エンジン
220 制御部
230 特徴抽出エンジン
240 判別関数作成エンジン
250 判別得点算出部
260 サンプルセット設定部
270 解析終了条件検出部
280 判別得点比較部
290 帰属クラス決定部
300 サンプルライブラリ
2 クラス2の誤分類サンプル
100 サンプルの帰属クラス予測装置
110 入力装置
120 出力装置
130 入力データテーブル
140 初期パラメータセットテーブル
150 最終パラメータセットテーブル
160 予測結果保存テーブル
200 解析部
210 初期パラメータ発生エンジン
220 制御部
230 特徴抽出エンジン
240 判別関数作成エンジン
250 判別得点算出部
260 サンプルセット設定部
270 解析終了条件検出部
280 判別得点比較部
290 帰属クラス決定部
300 サンプルライブラリ
最適な実施形態を説明する前に、本発明の原理について説明する。
図1は、判別分析による、理想的な二クラス分類の結果としてのパターン空間を示す。理想的とは、分類率が100%であることを意味する。図において、Sは識別面あるいは超平面を示し、識別面Sの右側の領域Aがクラス1のサンプルが存在する領域(以下、クラス1領域)であり、左側の領域Bがクラス2のサンプルが存在する領域(以下、クラス2領域)である。○は本来クラス1に属するサンプル、×は本来クラス2に属するサンプルを示す。
二クラス分類が理想的に、即ち分類率100%で行われた場合は、識別面Sの両側にそれぞれクラス1のサンプル○、クラス2のサンプル×が位置し、クラス1の領域Aとクラス2の領域Bは重ならない。ところが、通常の二クラス分類では領域Aと領域Bに重なりが生じる。
図2は、通常の二クラス分類の結果としてのパターン空間を示す。分類率が100%未満の場合、図示するように、識別面Sによって領域A、Bが完全に分類されず、重複領域Cが形成される。その結果、本来はクラス1のサンプルであってもクラス2領域に入り込み、クラス2サンプルとして間違って分類されるサンプル1、本来はクラス2のサンプルであってもクラス1領域に入り込み間違ってクラス1サンプルとして分類されるサンプル2が発生する。これら間違って分類されるサンプルを誤分類サンプルと呼び、正しく分類されるサンプルを正分類サンプルと呼ぶ。従って、誤分類サンプルには、本来クラス1であるサンプルおよび本来クラス2であるサンプルの両者が含まれる。
クラス1とクラス2を判別するための判別関数(予測モデル)Yは、以下の式(1)で示される。
Y=a1x1±a2x2±・・・±anxn±C (1)
式(1)において、Yは目的変数の値を示し、x1、x2、・・・xnは説明変数(以下、パラメータ)の値、a1、a2、・・・anは重み係数、Cは定数を示す。説明変数の値x1、x2、・・・xnは各サンプルによって異なる値であり、重み係数a1、a2、・・・anは全サンプルに共通の値である。通常、クラス1に帰属するサンプルは目的変数Yの値が正の値に、クラス2に属するサンプルは目的変数Yの値が負の値になるように重み係数が選択されている。この場合、図1および2に示す識別面Sは、Yの値が0となる平面(超平面)を示す。
式(1)に、各サンプルについて求めた説明変数(パラメータ)の値x1、x2、・・・xnを代入することにより、各サンプルの目的変数の値Y(k)を求めることができる。この値Y(k)は、判別分析においては「目的変数」あるいは「独立変数」として意味づけされるが、数値データとしてみた場合、連続変数である「判別得点」を示す。判別得点は、パターン空間上において、各サンプルと識別面Sとの間の距離を示している。
二クラス分類において、通常、クラス1サンプルの判別得点はプラス(正)の符号を有し、クラス2サンプルの判別得点はマイナス(負)の符号を有するように判別関数が作成されている。従って、サンプルの帰属クラスの決定には、判別得点がプラスであるか、マイナスであるかしか意味を持たない。判別得点の大きさ(絶対値)が、分類目的の特性の大きさあるいは強さを示すものでは決してない。しかしながら、判別得点Y(k)は、各サンプルによって特定されるパラメータ値を式(1)に当てはめて計算するものであるため、判別得点Y(k)に基づく各サンプル間の関係は固定されている。
図2に示すように、誤分類サンプル1、2は、識別面Sの近傍において発生する傾向がある。即ち、識別面Sとサンプル間の距離が小さい領域において誤分類サンプル1、2が発生しやすい。識別面Sとサンプル間の距離が大きくなる程、誤分類サンプルの発生の度合いが小さくなる。判別得点Y(k)は、識別面Sとサンプル間の距離を表すもので、従って、判別得点が大きいほど、あるいは小さいほど、誤分類サンプルの発生確率が低くなる。即ち、判別得点は、クラス帰属の確からしさを示す指標であると考えてもよい。
一方、目的変数の値が未知のサンプルについて、目的変数の予測値を求める場合、即ち帰属クラスを予測する場合、未知サンプルについて説明変数の値を算出し、これを式(1)に代入してYの値を決定する。値Yの符号にしたがって、未知サンプルが所属するクラスを決定する。例えば、Yの値がプラスの場合、未知サンプルをクラス1にアサインし、Yの値がマイナスの場合、未知サンプルをクラス2にアサインする。
この場合、図2を参照することによって明らかなように、未知サンプルの判別得点Yの絶対値が大きい場合、パターン空間上での未知サンプルの位置10aが識別面Sから充分はなれていると考えられる。したがってその場合の予測結果は正しいと考えられる。一方、未知サンプルの判別得点Yの絶対値が小さい場合は、パターン空間上での未知サンプルの位置10bは識別面Sからあまり離れていないと考えられる。そのため、未知サンプルの位置10bが誤分類領域Cにある可能性が高く、予測結果の信頼性は低い。
したがって、未知サンプル10a、10bの予測が正確か否かを判定するためには、誤分類領域Cを特定することが必要である。本発明者は、KY法の一手法として、誤分類領域Cを各学習サンプルの判別得点に基づいて決定し、その結果に対して新たな判別分析を行うことにより、ほぼ100%の分類率を有する予測モデルを作成する方法を既に提案している(PCT/2007/074334)。
この方法では、学習サンプルセットに対して求めた判別関数に基づいて個々の学習サンプルの判別得点を計算し、個々の学習サンプルの帰属クラスを予測する。この予測クラスと実測値に基づくクラスとを比較し、両者が一致しない場合そのサンプルを誤分類サンプルとする。誤分類サンプル中で最大、最小の判別得点を検出し、その間の領域を誤分類領域Cとしている。誤分類領域Cが特定されれば、判別得点に基づく未知サンプル10a、10bの予測が正しいか否かがわかる。
この方法では、1個の判別関数を求めた時点で、学習サンプル個々の判別得点を求めると同時に、その値を実測値と比較して個々の学習サンプルが誤分類サンプルか正分類サンプルかを特定する必要がある。また、判別手法によって誤分類サンプルの発生の度合いが変化するため、誤分類領域Cを正確に特定することはできない。このような観点から、本発明者は、誤分類領域Cを特定することなく分類予測を実行することができれば、予測プロセスが簡単となり、さらに予測精度も向上すると考えた。
誤分類サンプルは識別面Sの近傍に存在する確率が高い。一方、判別得点が識別面S(Y=0)から離れるほど、サンプルの分類予測は正確となる。図2から明らかなように、最大の判別得点Pmaxを有するサンプル、最小の判別得点Pminiを有するサンプルは正分類サンプルである。また、これらのサンプルの近傍のサンプルも正分類サンプルである。あるいは正分類サンプルである確率が非常に高い。したがって、判別得点に基づいて未知サンプルのクラス予測を行う場合、未知サンプルの判別得点Rが、学習サンプル中の最大の判別得点Pmax以上か(点Ra)、最小の判別得点Pmini以下の場合(点Rb)、その未知サンプルは確実にクラス1サンプル、あるいはクラス2サンプルであると予測することができる。
したがって、未知サンプルの判別得点Rが学習サンプル中の最大の判別得点Pmax以上か、あるいは最小の判別得点Pmini以下の場合、判別得点に基づくクラス予測を正確であると判断し、それ以外の場合、クラス予測は正確でないと判断することにより、誤分類領域Cを特定することなく、未知サンプルのクラス予測を高い精度で実施することができる。
図3は、以上に述べたような予測の正確性に関する判断基準に基づいて、モデルフリーで未知サンプルのクラス帰属予測を行う基本的手順を示すフローチャートである。なお、図3では一個の未知サンプルのクラス帰属をモデルフリーで予測する手順を示しているが、このフローチャートを同時に複数の未知サンプルのクラス帰属を予測する場合に適用させることは容易である。
まず、ステップS1において、目的変数の実測値、即ち、クラス1であるかクラス2であるかが既知の学習サンプルを複数個用意し、判別分析用のシステムに入力して、これらについて二クラス判別分析を行う。次のステップS2では、ステップS1の判別分析によって求めた判別関数を用いて、個々の学習サンプルの判別得点を計算する。ステップS3では、同じ判別関数を用いて目的変数が未知のサンプルの判別得点を計算する。ステップS4では、ステップS2及びS3で求めた判別得点を大小順にソートし、未知サンプルの判別得点Rと、学習サンプルの最大の判別得点Pmaxおよび最小の判別得点Pminiとを比較する。この比較の結果、未知サンプルの判別得点Rが学習サンプル中の最大の判別得点Pmax以上か、あるいは最小の判別得点Pmini以下と判断されると(ステップS4のYES)、ステップS7において、未知サンプルの判別得点Rの正負に基づいて未知サンプルのクラスアサインを行い、予測を終了する。
一方、ステップS4で、未知サンプルの判別得点Rが、学習サンプル中の最大の判別得点Pmaxよりも小さくかつ最小の判別得点Pminiよりも大きいと判定される(ステップS4のNO)と、ステップS5に移行して、学習サンプルセットからある数の学習サンプルを除去し、新たなサンプルセットを構築する。
除去する学習サンプルは、1)判別得点の最大のサンプルから判別得点の大きい順にm個と、判別得点の最小のサンプルから判別得点の小さい順にn個のサンプルを指定するようにしても良い。この場合、m=nであっても良いし、m≠nであっても良い。また、クラスポピュレーションを考慮に入れてmとnの値を決定しても良い。あるいは、2)最大あるいは最小の判別得点を100%とした場合、例えば100%から90%の範囲内の判別得点を有するサンプルを除去するようにしても良い。個数m、nがあまり大きいと、取り除くサンプルの範囲が、最大、最小の判別得点を有するサンプルの近傍から外れ、誤分類領域に入り込む。したがって、学習サンプルの総数の10%以下、数%程度が望ましい。
最も精度の高い分類予測を行おうとする場合には、ステップS4で除去するサンプルは、判別得点が最大のサンプルと、判別得点が最小のサンプルの計2個である。したがって、ステップS4では、少なくとも、判別得点が最大の学習サンプルと、判別得点が最小の学習サンプルとを取り除く。なお、図3において、後述するステップS1からステップS6までの繰り返しの最大の回数をシステムにおいて設定した場合、この最大回数に基づいて、1回の判別分析で取り除くサンプル数を決定するようにしても良い。例えば、総サンプル数が1000個であり、繰り返しの最大回数を100回とした場合、1回の判別分析では10個のサンプルを取り除くようにすれば、100回の判別分析で全てのサンプルを取り除くことができる。
図3のステップS6では、残りの学習サンプルによって新たな学習サンプルセットを構築し、ステップS1に戻って新たな判別分析を開始する。この場合、学習サンプルセットが初期学習サンプルセットとは異なっているので、特徴抽出の結果、新たな説明変数の組合せ(最終パラメータセット)が選択され、第1回目の判別分析とは異なる判別関数が得られる。したがって、第1回目の判別分析によるパターン空間と、第2回目の判別分析によるパターン空間とは異なったものとなる。また、個々の学習サンプルおよび未知サンプルの判別得点も第1回目の判別分析における判別得点とは異なってくる。
したがって、ステップS4では、学習サンプルと未知サンプルについて新に算出された判別得点に基づいて、その大小が比較される。ステップS4でYESと判定されると、ステップS7で未知サンプルの判別得点の符号に基づいてそのクラス帰属が決定される。ステップS4でNOと判定されると、ステップS5以降を実行する。
以上のように、ステップS1~ステップS6をステップS4でYESとなるまで繰り返すことにより、誤分類領域(グレーゾーン)を特定することなく、未知サンプルのクラス帰属を正確に予測することができる。なお、システムにおいて、繰り返し数の最大値を予め設定しておいても良い。
従来の分類予測方法では、学習サンプル数の数が多くなればなる程、分類率、予測率は低下する。これに対して、図3の方法では、学習サンプルの数が多くなった場合であっても、ステップS1~ステップS6の繰り返しの回数を多くするだけで、クラス予測の精度を落とすことなく、未知サンプルのクラス帰属を予測することができる。したがって、REACH規則の運用によって何万、あるいは何十万という化合物データが蓄積された場合であっても、これらを全て学習サンプルとして、しかも高いに予測精度を維持して、未知サンプルのクラス帰属を予測することができる。
以下に、第1の実施形態について説明する。この実施形態では、サンプルを化合物とし、予測を行う目的変数をAmesテストにおける活性(+、mutagen)、非活性(-、non-mutagen)としている。
図4および図5は、化合物のAmesテストにおける活性、非活性を予測するための実施手順を示すフローチャートである。まず、ステップS10において、学習サンプルセットおよび予測対象化合物である未知サンプルを用意し、システムに入力する。学習サンプルセットは、Amesテストにおける活性、非活性の実測値が既知の複数の化合物で構成される。未知サンプルは、化学的構造は既知であるがAmesテストにおける活性、非活性の実測値が不明のサンプルである。未知サンプルは1個であっても、複数個を用意しても何れでも良い。
用意された学習サンプルは、1次元、2次元あるいは3次元構造式の形でサンプルの帰属クラス予測装置に入力され、図6に示すようなサンプルデータを保存するためのテーブルが作成される。図6において、コラム60はサンプルである化合物の2次元あるいは3次元の構造式を示す。コラム61はその化合物のCAS番号を示し、コラム62は、Amesテストの結果を示している。コラム62において、mutagenはAmesテストの結果、変異原性有り(+)を示し、nonmutagenは変異原性を持たない(-)ことを示している。図示の例では、mutagenであるサンプルをクラス1(ポジティブクラス)に、nonmutagenであるサンプルをクラス2(ネガティブクラス)に二クラス分類するためのデータテーブルを示している。コラム63は、サンプル番号を示す。未知サンプルについても、同様のデータテーブルが作成されるが、Amesテストの実測値を記載するコラム62は空欄である。
次に、図4のステップS11において、目的変数を算出するための初期パラメータ、即ち説明変数(x1、x2・・・xx)の値を発生させる。初期パラメータは、化合物の構造から自動的に発生させることができる。例えば、富士通株式会社で販売するADMEWORKS-ModelBuilder(登録商標)では、化合物の2次元あるいは3次元構造、各種の物性に基づいて自動的に約800個のパラメータを発生させることができる。初期パラメータは、各学習サンプルおよび未知サンプルについて発生させる。ステップS12では、第1回目の判別分析を開始するために、STAGEを1に設定する。
ステップS13では、学習サンプルの初期パラメータに対して特徴抽出を行い、分類に不必要なノイズパラメータを除去する。これによって、最終パラメータセット(x1、x2・・・xn)が決定される(ステップS14)。特徴抽出としては、単相関係数、重相関係数、出現頻度、Fischer比、Variance法などの種々の既知手法を用いて実施することができる。特徴抽出のための各種のエンジンも一般に提供されている。
図7は、特徴抽出の結果、Amesテスト結果に影響ありとして選択された最終パラメータセットと、個々の化合物のこれらのパラメータに対する数値データを示すテーブルである。コラム70は化合物を構造式で特定し、コラム71以降は各種のパラメータを示している。例えば、コラム71は化合物の分子量を、コラム72は分子表面積を、コラム73はlogPの値をパラメータとしたことを示している。データテーブル中のセル74内に記載された値は、サンプル1分子の分子量を示すデータ、セル75内の値はサンプル1の分子表面積の値を示すデータ、セル76内の値はサンプル1のlogP値を示すデータである。各セル内に示された値が、そのサンプルのパラメータデータとなる。なお、コラム77は各サンプルのサンプル番号を示している。
ステップS14では、解析の終了条件を満足したか否かが判定される。解析の終了条件とは、例えば、クラスアサイン(クラス予測)を行おうとする未知サンプルが存在しないこと、予め設定された最大のSTAGE数に達したか否か、学習サンプルセット中のサンプル数が予め設定した一定個数以下となったか否か、あるいは、信頼性指標が予め決定された値以下となったか否か、等である。ここで、信頼性指標とはサンプル数をパラメータ数で除した値であり、この値が小さくなると、これらのサンプルとパラメータとから得られる判別式ほとんど科学的およびデータ解析的に意味を持たず、その解析は失敗したと判断される。通常の判別分析ではこの値として4が設定されるが、4よりも大きければ大きいほど信頼性の高い判別式とみなされる。
図8に、ステップS15の詳細を示す。ステップS151からステップS154が図4のステップS15に相当する。まず、ステップS151で、予測を行おうとする未知サンプルが存在するか否かを確認する。未知サンプルが存在しない場合(ステップS151のYES)は、予測処理を終了する。ステップS152で、現在の処理STAGEが予め決定しておいた最大のSTAGE数N以上となったか否かを判定する。STAGE数がN以上となった場合(ステップS152のYES)は、処理を終了する。
ステップS153では、サンプル数とパラメータ数で決定される信頼性指標の値が4未満となったか否かを判定する。信頼性指標が4以下となった場合(ステップS153のYES)は、処理を終了する。ステップS154では、学習サンプル数が予め決定した最低のサンプル数Sminiに達したか否かを判定する。最低のサンプル数以下になった場合(ステップS154のYES)は、処理を終了する。
従って、図示の実施形態では、終了条件の全てが満足されない場合に、ステップS16が実行される。なお、ステップS151からステップS154の実行順序は任意でよく、また、ステップS152、154等は省略しても良い。更に、ステップS152に代わって、あるいは追加のステップとして、処理時間に関する制限を入れても良い。
再び図4に戻ると、ステップS15で終了条件が満足される(ステップS15のYES)と、解析処理を終了する。ステップS15で終了条件に達しない場合(ステップS15のNO)、ステップS16で最終パラメータセットを用いて第1段階(STAGE1)の判別式を構築する。判別分析では、判別関数は上記式(1)として示される。
ステップS17では、作成した判別関数を用いて各学習サンプルの判別得点を計算し、更に、同じ判別関数を用いて未知サンプルの判別得点を計算する。k番目のサンプルの判別得点Ykは、
Yk=a1x1k±a2x2k±・・・±anxnk±C (2)
として計算される。ここで、x1k、x2k、・・・xnkは、k番目のサンプルのパラメータ(説明変数)データ、a1、a2、a3・・・anは各パラメータに対する重み係数であり、各サンプルについて共通である。Cは定数である。
Yk=a1x1k±a2x2k±・・・±anxnk±C (2)
として計算される。ここで、x1k、x2k、・・・xnkは、k番目のサンプルのパラメータ(説明変数)データ、a1、a2、a3・・・anは各パラメータに対する重み係数であり、各サンプルについて共通である。Cは定数である。
パラメータデータx11、x21、x31・・・は、図7の各セル内に記載されたデータから得られる。したがって、判別分析により、各パラメータに対する係数a1、a2・・・を求めると、図7のテーブルに示される各セル内のデータを式(2)に導入することによって、サンプルkの判別得点Ykが計算される。
図5に示すステップS18では、判別得点Ykを全学習サンプルについてソートすることにより、学習サンプルの最大の判別得点Pmax、最小の判別得点Pminiを特定する。ステップS18では、ステップS17で求めた未知サンプルの判別得点Rと、学習サンプルの最大、最小の判別得点Pmax、Pminiとを比較し、R≧PmaxあるいはR≦Pminiを満足する未知サンプルがあるか否かを判定する。複数の未知サンプルのうち、R≧PmaxあるいはR≦Pminiを満足する未知サンプルがあれば(ステップS19のYES)、そのサンプルを取り出し、判別得点の符号にしたがってクラスアサインする(ステップS20)。
次に、再びステップS19に戻って、R≧PmaxあるいはR≦Pminiを満足する他の未知サンプルがあるか否かを判定する。ステップS19とステップS20は、ステップS19においてR(未知サンプルの判別得点)≧PmaxあるいはR≦Pminiを満足する他の未知サンプルがなくなるまで、繰り返して実行される。この結果、ステップS20において、現在のSTAGEでR≧PmaxあるいはR≦Pminiを満足する全ての未知サンプルが取りだされ、そのクラスが決定される。
ステップS19でNOとなった場合、ステップS21において、学習サンプルセットの各クラスから判別得点の大きいあるいは小さいサンプルを、サンプル除去のルールに従って除去する。サンプル除去のルールは、図3を参照して説明したいずれのルールでも良く、ユーザが任意に指定すれば良い。ステップS22では、残りの学習サンプルを新たな学習サンプルセットに設定する。ステップS23ではSTAGEを1だけ進めてSTAGE=2とし、その後、図5のステップS13以下を実行することにより、STAGE2での未知サンプルのクラスアサイン(帰属クラス決定)を実行する。
以上のようにして、ステップS13からステップS23を繰り返し実行することにより、全ての未知サンプルのクラスアサインが終了すると、ステップS15で解析終了条件が満足されるため、その時点で分類予測処理が終了する。この場合、未知サンプルの帰属クラス決定は、未知サンプルの判別得点が学習サンプルの最大の判別得点Pmax以上となった場合、あるいは最小の判別得点Pmini以下となった場合に行われるため、その予測の信頼性は非常に高いものとなる。
なお、各STAGEで実施する判別分析手法としては、各STAGEで同じ手法を使用しても良いし、あるいは異なる手法を使用しても良い。例えば、STAGE1でBayes判別分析法を使用し、STAGE2でAdaBoost法を使用するようにしても良い。更に、各STAGEで除去する学習サンプルの個数を一定にしても良いし、あるいはSTAGE毎に異なる個数を設定しても良い。例えば、比較的初期のSTAGEでは比較的多くのサンプルを除去し、高次のSTAGEではそれよりも小さい数のサンプルを除去するようにしても良い。
以上の結果、モデルフリーでかつ高い予測精度で、未知サンプルの帰属クラス予測を行うことができる。また、予測過程の各STAGEにおいて、各学習サンプルを正分類サンプルと誤分類サンプルとに分類する必要がなくなるので、予測のための計算時間を大幅に短縮することができる。
図9は、第3の実施形態に係るサンプルの帰属クラス予測装置の概略構成を示すブロック図である。本実施形態にかかる予測装置100は、学習サンプル、未知サンプルのデータを入力する入力装置110、未知サンプルの予測結果あるいは処理途中の必要なデータを出力する出力装置120を備えている。サンプルが化合物の場合、入力装置110から化合物の1次元構造式あるいは2次元構造式と共に、その化合物の既知の目的変数の値(即ち、クラス1かクラス2かに関する情報、例えば、安全性データ)が入力され、入力データテーブル130に保持される。未知サンプルを入力する場合は目的変数の値は入力されない。
入力装置110を介して、初期パラメータセットのデータを入力し、これを初期パラメータセットテーブル140に保存するようにしても良い。解析部200が、入力されたサンプルについて初期パラメータを自動的に発生するためのエンジン210を有している場合は、初期パラメータセットデータを入力装置110から入力する必要はない。
図9において、150は最終パラメータセットを保存するテーブルであり、初期パラメータセットに対して特徴抽出を行った結果としての最終パラメータセットを保存する。160は、未知サンプルについてのクラスアサイン情報、即ち予測結果情報を保存する予測結果保存テーブルである。通常、これらのテーブル130、140、150、160は一個の記憶装置に格納されている。
解析部200は、制御部220と、初期パラメータ発生エンジン210、特徴抽出エンジン230、判別関数作成エンジン240、判別得点算出部250、サンプルセット設定部260および解析終了条件検出部270、判別得点比較部280およびクラスアサイン実施部290を備えている。なお、初期パラメータを本装置の外部で発生させる場合は、初期パラメータ発生エンジン210は必要とされない。サンプルが化合物の場合は、初期パラメータ発生エンジン210は、入力装置110から入力された化合物の構造式に基づいて、複数の構造記述子を発生する。300はサンプルライブラリであり、過去の特性予測に用いた学習サンプルの構造式、安全性データ、初期パラメータ値などをライブラリデータとして保存している。
特徴抽出エンジン230は、初期パラメータセットに対して特徴抽出を行って最終パラメータセットを決定し、これを最終パラメータセットテーブル130に保存する。判別関数作成エンジン240は、種々の既存の判別分析エンジンを備えており、ユーザによって任意に指定された判別分析エンジン、あるいはシステムが適宜選択した判別分析エンジンを用いて、最終パラメータセットテーブル130を参照しながら、入力サンプルの判別分析を行い、判別関数を作成する。判別得点算出部250は、判別関数作成エンジン240によって作成された判別関数に各サンプルのパラメータを入力することにより、各サンプルの判別得点を計算する。サンプルセット設定部260は、予め設定したサンプル除去ルールに従って、学習サンプルセットから判別得点の大きいサンプル、小さいサンプルを除去し、新たな学習サンプルセットを構築する。
特徴抽出エンジン230、判別関数作成エンジン240、判別得点算出部250、新たなサンプルセット設定部260は、制御部220の制御下で作動し、図5および図6に示す処理を実行する。なお、解析終了条件検出部270は、1)帰属クラスを予測する未知サンプルが0となった時点、2)処理の繰り返しが予め設定した回数(あるいは時間)を超えた場合、3)新に設定した学習サンプルセット中のサンプル数が予め決定した個数以下となった時点、4)信頼性指標が予め定めた値以下となった時点、の何れかで、解析の実行を停止する。
判別得点比較部280は、未知サンプルの判別得点Rを、学習サンプルの最大の判別得点Pmaxあるいは最小の判別得点Pminiと比較する。帰属クラス決定部290は、判別得点比較部280の結果に基づいて未知サンプルのクラスアサインを実行する。即ち、未知サンプルの判別得点Rが学習サンプルの最大の判別得点Pmax以上の場合あるいは最小の判別得点Pmini以下の場合、未知サンプルを判別得点Rの符号に基づくクラスにアサインし、その何れでもない場合、クラスアサインを行わない。帰属クラス決定部290の結果は、予測結果保存テーブル160に一旦保存された後、出力装置120を介して任意の形状で出力される。出力装置としては、種々の記憶装置、ディスプレイ、プリンタ等が選択可能であり、出力の形態としては、各種ファイル(例えばUSBファイル)、ディスプレイ表示、プリントアウト等を適宜選択することが可能である。
上記した各プログラムは、コンピュータ読取可能な記録媒体に格納することが可能であり、これらの記録媒体を頒布、流通することが可能である。また、同様に上記した各プログラムはインターネット等の通信回線を介して頒布、流通することが可能である。前記したコンピュータ読取可能な記録媒体としては、磁気記録装置、光ディスク、光磁気ディスクあるいは半導体メモリ(RAM、ROM等)などがある。一例として、磁気記録装置としてはハードディスクドライブ(HDD)、フレキシブルディスク(FD)、磁気テープ(MT)等がある。光ディスクの例としては、DVD(Digital・Versatile・Disc)、DVD-RAM、CD-ROM、CD-R、CD-RW等がある。光磁気ディスクとしてはMO(Magneto-Optical・disc)等がある。
入力装置110を介して入力された学習サンプルのデータ、これらの学習サンプルについて発生された初期パラメータセットのデータは、解析部200を介してサンプルライブラリに入力され保存される。従って、サンプルライブラリ300を利用すれば、未知サンプルのクラス帰属予測を行う場合、入力装置110を介して未知サンプルの構造式データを入力するのみで、予測を実行することができる。あるいは、新たな学習サンプルデータが用意されれば、そのデータを入力装置110から帰属クラス予測装置100に入力することにより、サンプルライブラリ300に保存された既存の学習サンプルデータと合わせて最新の学習サンプルセットを作成することができる。クラス予測は、この最新の学習サンプルセットを初期サンプルセットとして用いて行われる。従って、本装置では、常に新しい学習サンプルを加えたデータベースにより、未知サンプルの特性予測を実行することができる。
また、入力装置110および出力装置120を、対話形式のグラフィックユーザインターフェースを備えたディスプレイ装置で構成することも可能である。この場合、解析終了条件の選択、サンプル除去ルールの選択などを、ユーザがディスプレイ画面を介してコンピュータと対話しながら行うようにしても良い。
本明細書に開示する方法、プログラム、装置は、二クラス分類が適用可能な全ての産業分野に適用可能である。以下に、主な適用分野を列挙する。
1)化学データ解析
2)バイオ関連研究
3)蛋白質関連研究
4)医療関連研究
5)食品関連研究
6)経済関連研究
7)工学関連研究
8)生産歩留まり向上等を目的としたデータ解析
9)環境関連研究
1)の化学データ解析分野では、より詳細には、下記のような研究に適用できる。
(1)構造-活性/ADME/毒性/物性相関の研究
(2)構造-スペクトル相関研究
(3)メタボノミクス関連研究
(4)ケモメトリクス研究
2)バイオ関連研究
3)蛋白質関連研究
4)医療関連研究
5)食品関連研究
6)経済関連研究
7)工学関連研究
8)生産歩留まり向上等を目的としたデータ解析
9)環境関連研究
1)の化学データ解析分野では、より詳細には、下記のような研究に適用できる。
(1)構造-活性/ADME/毒性/物性相関の研究
(2)構造-スペクトル相関研究
(3)メタボノミクス関連研究
(4)ケモメトリクス研究
例えば、構造-毒性相関研究分野では、Amesテスト結果の予測を行うことが極めて重要である。何故ならば、Amesテストは、毒性化合物規制関連の化合物審査法や労働安全衛生法等の国レベルの化合物規制に、最重要項目の一つして組み込まれているからである。このAmesテストの審査を通らなければ、日本国内での化合物生産はできなくなり、企業の生産活動自体がストップする。また、海外での生産や輸出等も対象国の安全性規制により活動できなくなる。
ヨーロッパ議会におけるREACH規則では、化合物を使用する企業が、その化合物についてAmesテストの結果を予測し、評価する義務を負っている。本発明は、このようなテスト結果の予測に、非常に有用なツールを提供するものである。なお、Amesテストとは、米国のAmes博士が開発した変異原性試験の一つで、発がん性試験の簡易手法である。このために、多くの化学物質あるいはこれらを用いた製品の安全性の指針として採用されている試験である。
Claims (20)
- a)学習サンプルセットの各学習サンプルに対して発生させた複数の説明変数に基づいて、前記各学習サンプルを第1または第2のクラスに分類予測する判別関数を求め、
b)前記判別関数に基づいて前記各学習サンプルと未知サンプルの判別得点を算出し、
c)前記未知サンプルの判別得点が、前記全ての学習サンプルのうちの最大の判別得点以上あるいは最小の判別得点以下の何れかであるか否かを判定し、
d)前記c)で肯定判断の場合、前記未知サンプルの判別得点に従ってその帰属クラスを決定し、
e)前記c)で否定判断の場合、少なくとも、前記最大の判別得点を有する学習サンプルと前記最小の判別得点を有する学習サンプルとを前記学習サンプルセットから除去して、残りの学習サンプルによって新たな学習サンプルセットを構築し、
f)前記新たな学習サンプルセットに対して、前記a)~e)のステップを繰り返す、各ステップを備える、サンプルの帰属クラス予測方法。 - 請求項1に記載の方法において、さらに、g)帰属クラス未定の未知サンプルが存在するか否かを判定するステップを備え、当該ステップで否定判断の場合、前記ステップf)の繰り返しを停止する、サンプルの帰属クラス予測方法。
- 請求項1に記載の方法において、前記ステップa)における判別関数は、前記複数の説明変数に特徴抽出を実施して不要な説明変数を除去した残りの説明変数に基づいて求める、サンプルの帰属クラス予測方法。
- 請求項3に記載の方法において、前記ステップf)の繰り返しは、前記学習サンプルセット中の総サンプル数と、前記特徴抽出後の説明変数の数との比が予め決定した一定数以下となった場合、停止する、サンプルの帰属クラス予測方法。
- 請求項1に記載の方法において、前記ステップe)では、前記最大の判別得点を有する学習サンプルから判別得点の大きい順に第1の個数の学習サンプルを、前記最小の判別得点を有する学習サンプルから判別得点の小さい順に第2の個数の学習サンプルを、前記学習サンプルセットよりそれぞれ除去する、サンプルの帰属クラス予測方法。
- 請求項5に記載の方法において、前記第1の個数と前記第2の個数は、前記学習サンプルセットにおいて、実測値が前記第1クラスである学習サンプルの数と前記第2のクラスである学習サンプルの数との比に基づいて決定される、サンプルの帰属クラス予測方法。
- 請求項5に記載の方法において、前記第1の個数と前記第2の個数は、前記ステップa)における学習サンプルセット中の全サンプル数と、前記ステップf)における繰り返しの回数の最大値として予め設定した値に基づいて決定される、サンプルの帰属クラス予測方法。
- 請求項1に記載の方法において、前記各学習サンプルは化合物であり、前記第1と第2のクラスは、任意の毒性を有する化合物のクラスと前記毒性を有さない化合物のクラスである、サンプルの帰属クラス予測方法。
- a)学習サンプルセットの各学習サンプルに対して発生させた複数の説明変数に基づいて、前記各学習サンプルを第1または第2のクラスに分類予測する判別関数を求める手順と、
b)前記判別関数に基づいて各学習サンプルと未知サンプルの判別得点を算出する手順と、
c)前記未知サンプルの判別得点が、前記全ての学習サンプルのうちの最大の判別得点以上あるいは最小の判別得点以下の何れかであるか否かを判定する手順と、
d)前記c)で肯定判断の場合、前記未知サンプルの判別得点に従ってその帰属クラスを決定する手順と、
e)前記c)で否定判断の場合、少なくとも、前記最大の判別得点を有する学習サンプルと前記最小の判別得点を有する学習サンプルとを前記学習サンプルセットから除去して、残りの学習サンプルによって新たな学習サンプルセットを構築する手順と、
f)前記新たな学習サンプルセットに対して、前記a)~e)の手順を繰り返して実行する手順と、をコンピュータに実行させるための、サンプルの帰属クラス予測プログラム。 - 請求項9に記載のプログラムにおいて、さらに、g)帰属クラス未定の未知サンプルが存在するか否かを判定する手順を備え、当該手順で否定判断の場合、前記手順f)の繰り返しを停止する、サンプルの帰属クラス予測プログラム。
- 請求項9に記載のプログラムにおいて、前記手順a)における判別関数は、前記複数の説明変数に特徴抽出を実施して不要な説明変数を除去した残りの説明変数に基づいて求める、サンプルの帰属クラス予測プログラム。
- 請求項9に記載のプログラムにおいて、前記手順f)の繰り返しは、前記学習サンプルセット中の総サンプル数と、前記特徴抽出後の説明変数の数との比が予め決定した一定数以下となった場合、停止される、サンプルの帰属クラス予測プログラム。
- 請求項9に記載のプログラムにおいて、前記手順e)では、最大の判別得点を有する学習サンプルから判別得点の大きい順に第1の個数の学習サンプルを、最小の判別得点を有する学習サンプルから判別得点の小さい順に第2の個数の学習サンプルを、前記学習サンプルセットよりそれぞれ除去する、サンプルの帰属クラス予測プログラム。
- 請求項13に記載のプログラムにおいて、前記第1の個数と前記第2の個数は、前記学習サンプルセットにおいて、実測値が前記第1クラスである学習サンプルの数と前記第2のクラスである学習サンプルの数との比に基づいて決定される、サンプルの帰属クラス予測プログラム。
- 請求項13に記載のプログラムにおいて、前記第1の個数と前記第2の個数は、前記手順a)における学習サンプルセット中の全サンプル数と、前記手順f)における繰り返しの回数の最大値として予め設定した値とに基づいて決定される、サンプルの帰属クラス予測プログラム。
- 請求項9に記載のプログラムにおいて、前記各学習サンプルは化合物であり、前記第1、第2のクラスは、任意の毒性を有する化合物のクラスと前記毒性を有さない化合物のクラスである、サンプルの帰属クラス予測プログラム。
- クラス1あるいはクラス2に帰属することが既知の複数のサンプルで構成される学習サンプルセットをデータ解析して、前記クラス1あるいはクラス2への帰属が不明である未知サンプルの帰属クラスを予測する装置であって、
前記学習サンプルセットの各学習サンプルと前記未知サンプルに対して説明変数を発生する説明変数発生装置と、
前記各学習サンプルについて発生した説明変数に基づいて判別分析を行い、上記クラス1およびクラス2を判別するための判別関数を得る、判別関数作成エンジンと、
前記作成された判別関数に基づいて、前記各学習サンプルと前記未知サンプルの判別得点を算出する、判別得点算出装置と、
前記算出された各学習サンプルの判別得点と前記未知サンプルの判別得点を比較する、判別得点比較装置と、
前記判別得点比較装置の比較結果に基づいて、前記未知サンプルの帰属クラスを決定する帰属クラス決定装置と、
前記判別得点比較装置の比較結果に基づいて、前記学習サンプルセットから、少なくとも最大の判別得点を有する学習サンプルと最小の判別得点を有する学習サンプルとを取り除いて新たな学習サンプルセットを構築するサンプルセット設定装置と、
前記設定された新たな学習サンプルセットを前記学習サンプルセットとして用いて前記説明変数発生装置、前記判別関数作成エンジン、前記判別得点算出装置、前記判別得点比較装置、前記帰属クラス決定装置および前記サンプルセット設定装置を繰り返し動作させる制御装置と、を備え、
前記帰属クラス決定装置は、前記判別得点比較装置における比較結果が、前記未知サンプルの判別得点が前記各学習サンプルのうちの最大の判別得点以上か、あるいは最小の判別得点以下かの何れかである場合、前記未知サンプルの判別得点にしたがって前記未知サンプルの帰属クラスを決定する、サンプルの帰属クラス予測装置。 - 請求項17に記載の装置において、更に、分類予測に不要な説明変数を除去するために、前記説明変数発生装置によって発生された説明変数に対して特徴抽出を行うための特徴抽出エンジンを備える、サンプルの帰属クラス予測装置。
- 請求項17に記載の装置において、さらに、前記各学習サンプルおよび未知サンプルとして化合物の構造式を入力する入力装置を備え、前記説明変数発生装置は、入力された構造式に基づいて複数の構造記述子を前記説明変数として発生させる、サンプルの帰属クラス予測装置。
- 請求項19に記載の装置において、さらに、前記各学習サンプルとして入力された構造式と前記各学習サンプルの既知の帰属クラスとをデータとして保存するサンプルライブラリを備える、サンプルの帰属クラス予測装置。
Priority Applications (4)
| Application Number | Priority Date | Filing Date | Title |
|---|---|---|---|
| PCT/JP2008/064058 WO2010016109A1 (ja) | 2008-08-05 | 2008-08-05 | サンプルの帰属クラス予測方法、帰属クラス予測プログラムおよび帰属クラス予測装置 |
| EP08792225.8A EP2323080B1 (en) | 2008-08-05 | 2008-08-05 | Sample attribution class estimation method, sample attribution class estimation program, and attribution class estimation apparatus |
| JP2010523668A JP5141767B2 (ja) | 2008-08-05 | 2008-08-05 | サンプルの帰属クラス予測方法、帰属クラス予測プログラムおよび帰属クラス予測装置 |
| US13/019,683 US8682813B2 (en) | 2008-08-05 | 2011-02-02 | Sample class prediction method, prediction program, and prediction apparatus |
Applications Claiming Priority (1)
| Application Number | Priority Date | Filing Date | Title |
|---|---|---|---|
| PCT/JP2008/064058 WO2010016109A1 (ja) | 2008-08-05 | 2008-08-05 | サンプルの帰属クラス予測方法、帰属クラス予測プログラムおよび帰属クラス予測装置 |
Related Child Applications (1)
| Application Number | Title | Priority Date | Filing Date |
|---|---|---|---|
| US13/019,683 Continuation US8682813B2 (en) | 2008-08-05 | 2011-02-02 | Sample class prediction method, prediction program, and prediction apparatus |
Publications (1)
| Publication Number | Publication Date |
|---|---|
| WO2010016109A1 true WO2010016109A1 (ja) | 2010-02-11 |
Family
ID=41663339
Family Applications (1)
| Application Number | Title | Priority Date | Filing Date |
|---|---|---|---|
| PCT/JP2008/064058 Ceased WO2010016109A1 (ja) | 2008-08-05 | 2008-08-05 | サンプルの帰属クラス予測方法、帰属クラス予測プログラムおよび帰属クラス予測装置 |
Country Status (4)
| Country | Link |
|---|---|
| US (1) | US8682813B2 (ja) |
| EP (1) | EP2323080B1 (ja) |
| JP (1) | JP5141767B2 (ja) |
| WO (1) | WO2010016109A1 (ja) |
Cited By (10)
| Publication number | Priority date | Publication date | Assignee | Title |
|---|---|---|---|---|
| JP2014063494A (ja) * | 2012-09-20 | 2014-04-10 | Fujitsu Ltd | 分類装置、分類方法及び電子設備 |
| JP2018059910A (ja) * | 2016-10-06 | 2018-04-12 | 三菱電機株式会社 | 電池の状態を推定するためのシステム及び方法、および、非一時的コンピュータ可読記憶媒体 |
| WO2019187594A1 (ja) * | 2018-03-29 | 2019-10-03 | 日本電気株式会社 | 学習装置、学習方法および学習プログラム |
| CN110457654A (zh) * | 2019-08-08 | 2019-11-15 | 哈尔滨理工大学 | 一种基于现场数据的机载设备可靠性预测方法 |
| JP2020030638A (ja) * | 2018-08-23 | 2020-02-27 | パナソニックIpマネジメント株式会社 | 材料情報出力方法、材料情報出力装置、材料情報出力システム、及びプログラム |
| WO2020166486A1 (ja) * | 2019-02-12 | 2020-08-20 | Jsr株式会社 | データ処理方法、データ処理装置及びデータ処理システム |
| CN113327136A (zh) * | 2021-06-23 | 2021-08-31 | 中国平安财产保险股份有限公司 | 归因分析方法、装置、电子设备及存储介质 |
| US20220374748A1 (en) * | 2020-01-14 | 2022-11-24 | International Business Machines Corporation | Automated determination of explanatory variables |
| JP2023006500A (ja) * | 2021-06-30 | 2023-01-18 | 国立大学法人 筑波大学 | サブクラスタ抽出装置、サブクラスタ抽出方法、及びプログラム |
| CN121144967A (zh) * | 2025-11-17 | 2025-12-16 | 中国科学院合肥物质科学研究院 | 基于决策融合和近红外光谱的高粱品种的判别方法及系统 |
Families Citing this family (14)
| Publication number | Priority date | Publication date | Assignee | Title |
|---|---|---|---|---|
| US8935258B2 (en) * | 2009-06-15 | 2015-01-13 | Microsoft Corporation | Identification of sample data items for re-judging |
| WO2014037481A1 (en) * | 2012-09-06 | 2014-03-13 | Shell Internationale Research | Method of estimating the mutagenicity of hydrocarbon samples |
| CN107045506A (zh) * | 2016-02-05 | 2017-08-15 | 阿里巴巴集团控股有限公司 | 评估指标获取方法及装置 |
| US10878286B2 (en) * | 2016-02-24 | 2020-12-29 | Nec Corporation | Learning device, learning method, and recording medium |
| WO2018213112A1 (en) * | 2017-05-15 | 2018-11-22 | Bioanalytix, Inc. | Systems and methods for automated design of an analytical study for the structural characterization of a biologic composition |
| CN108038108B (zh) * | 2017-12-27 | 2021-12-10 | 东软集团股份有限公司 | 分词模型训练方法和装置、及存储介质 |
| CN109960808B (zh) * | 2019-03-26 | 2023-02-07 | 广东工业大学 | 一种文本识别方法、装置、设备及计算机可读存储介质 |
| CN110728313B (zh) * | 2019-09-29 | 2023-01-17 | 北京声智科技有限公司 | 一种用于意图分类识别的分类模型训练方法及装置 |
| JP7354063B2 (ja) * | 2020-05-14 | 2023-10-02 | 株式会社東芝 | 分類システム、プログラム及び学習システム |
| US12141663B2 (en) * | 2020-06-24 | 2024-11-12 | Surveymonkey Inc. | Double-barreled question predictor and correction |
| CN111967541B (zh) * | 2020-10-21 | 2021-01-05 | 上海冰鉴信息科技有限公司 | 基于多平台样本的数据分类方法及装置 |
| CN113177521B (zh) * | 2021-05-26 | 2022-07-01 | 电子科技大学 | 一种基于组合孪生网络的智能辐射源识别方法 |
| CN116628558B (zh) * | 2023-06-16 | 2025-12-30 | 中国人民解放军国防科技大学 | 基于分类模型的玻璃分类方法、装置、设备及介质 |
| CN117493514B (zh) * | 2023-11-09 | 2024-05-14 | 广州方舟信息科技有限公司 | 文本标注方法、装置、电子设备和存储介质 |
Citations (5)
| Publication number | Priority date | Publication date | Assignee | Title |
|---|---|---|---|---|
| JPH05143636A (ja) * | 1991-11-22 | 1993-06-11 | Omron Corp | 判別分析方法及び装置 |
| JPH08123781A (ja) * | 1994-10-20 | 1996-05-17 | Fujitsu Ltd | 3次元化合物構造式の周辺空間情報を数値データへ変換する方法、並びに、3次元化合物構造式とその周辺空間との相互作用を数値データへ変換する方法 |
| JP2002073076A (ja) * | 2000-09-04 | 2002-03-12 | Sumitomo Metal Ind Ltd | パターン認識方法、パターン認識装置及び記録媒体 |
| JP2004086897A (ja) * | 2002-08-06 | 2004-03-18 | Fuji Electric Holdings Co Ltd | モデル構築方法およびモデル構築システム |
| WO2008059624A1 (en) | 2006-11-13 | 2008-05-22 | Fujitsu Limited | Two-class classifying/predicting model making method, classifying/predicting model making program, and two-class classifying/predicting model making device |
Family Cites Families (1)
| Publication number | Priority date | Publication date | Assignee | Title |
|---|---|---|---|---|
| CN101903895B (zh) * | 2007-12-18 | 2014-03-26 | 富士通株式会社 | 化合物毒性预测模型的生成方法以及化合物毒性预测模型生成装置 |
-
2008
- 2008-08-05 JP JP2010523668A patent/JP5141767B2/ja not_active Expired - Fee Related
- 2008-08-05 WO PCT/JP2008/064058 patent/WO2010016109A1/ja not_active Ceased
- 2008-08-05 EP EP08792225.8A patent/EP2323080B1/en not_active Not-in-force
-
2011
- 2011-02-02 US US13/019,683 patent/US8682813B2/en not_active Expired - Fee Related
Patent Citations (5)
| Publication number | Priority date | Publication date | Assignee | Title |
|---|---|---|---|---|
| JPH05143636A (ja) * | 1991-11-22 | 1993-06-11 | Omron Corp | 判別分析方法及び装置 |
| JPH08123781A (ja) * | 1994-10-20 | 1996-05-17 | Fujitsu Ltd | 3次元化合物構造式の周辺空間情報を数値データへ変換する方法、並びに、3次元化合物構造式とその周辺空間との相互作用を数値データへ変換する方法 |
| JP2002073076A (ja) * | 2000-09-04 | 2002-03-12 | Sumitomo Metal Ind Ltd | パターン認識方法、パターン認識装置及び記録媒体 |
| JP2004086897A (ja) * | 2002-08-06 | 2004-03-18 | Fuji Electric Holdings Co Ltd | モデル構築方法およびモデル構築システム |
| WO2008059624A1 (en) | 2006-11-13 | 2008-05-22 | Fujitsu Limited | Two-class classifying/predicting model making method, classifying/predicting model making program, and two-class classifying/predicting model making device |
Non-Patent Citations (2)
| Title |
|---|
| "Development of K-step Yard Sampling Method and its Application to ADME-T Predictions", 34TH STRUCTURE-ACTIVITY RELATIONSHIPS SYMPOSIUM, November 2006 (2006-11-01) |
| See also references of EP2323080A4 |
Cited By (19)
| Publication number | Priority date | Publication date | Assignee | Title |
|---|---|---|---|---|
| JP2014063494A (ja) * | 2012-09-20 | 2014-04-10 | Fujitsu Ltd | 分類装置、分類方法及び電子設備 |
| JP2018059910A (ja) * | 2016-10-06 | 2018-04-12 | 三菱電機株式会社 | 電池の状態を推定するためのシステム及び方法、および、非一時的コンピュータ可読記憶媒体 |
| JPWO2019187594A1 (ja) * | 2018-03-29 | 2021-02-25 | 日本電気株式会社 | 学習装置、学習方法および学習プログラム |
| WO2019187594A1 (ja) * | 2018-03-29 | 2019-10-03 | 日本電気株式会社 | 学習装置、学習方法および学習プログラム |
| JP7122699B2 (ja) | 2018-08-23 | 2022-08-22 | パナソニックIpマネジメント株式会社 | 材料情報出力方法、材料情報出力装置、材料情報出力システム、及びプログラム |
| JP2020030638A (ja) * | 2018-08-23 | 2020-02-27 | パナソニックIpマネジメント株式会社 | 材料情報出力方法、材料情報出力装置、材料情報出力システム、及びプログラム |
| JPWO2020166486A1 (ja) * | 2019-02-12 | 2021-12-16 | Jsr株式会社 | データ処理方法、データ処理装置及びデータ処理システム |
| WO2020166486A1 (ja) * | 2019-02-12 | 2020-08-20 | Jsr株式会社 | データ処理方法、データ処理装置及びデータ処理システム |
| JP7351317B2 (ja) | 2019-02-12 | 2023-09-27 | Jsr株式会社 | データ処理方法、データ処理装置及びデータ処理システム |
| JP2023169271A (ja) * | 2019-02-12 | 2023-11-29 | Jsr株式会社 | データ処理方法、データ処理装置及びデータ処理システム |
| JP7525829B2 (ja) | 2019-02-12 | 2024-07-31 | Jsr株式会社 | データ処理方法、データ処理装置及びデータ処理システム |
| US12542199B2 (en) | 2019-02-12 | 2026-02-03 | Jsr Corporation | Data processing method, data processing device, and data processing system |
| CN110457654A (zh) * | 2019-08-08 | 2019-11-15 | 哈尔滨理工大学 | 一种基于现场数据的机载设备可靠性预测方法 |
| US20220374748A1 (en) * | 2020-01-14 | 2022-11-24 | International Business Machines Corporation | Automated determination of explanatory variables |
| CN113327136A (zh) * | 2021-06-23 | 2021-08-31 | 中国平安财产保险股份有限公司 | 归因分析方法、装置、电子设备及存储介质 |
| CN113327136B (zh) * | 2021-06-23 | 2023-06-02 | 中国平安财产保险股份有限公司 | 归因分析方法、装置、电子设备及存储介质 |
| JP2023006500A (ja) * | 2021-06-30 | 2023-01-18 | 国立大学法人 筑波大学 | サブクラスタ抽出装置、サブクラスタ抽出方法、及びプログラム |
| JP7595936B2 (ja) | 2021-06-30 | 2024-12-09 | 国立大学法人 筑波大学 | サブクラスタ抽出装置、サブクラスタ抽出方法、及びプログラム |
| CN121144967A (zh) * | 2025-11-17 | 2025-12-16 | 中国科学院合肥物质科学研究院 | 基于决策融合和近红外光谱的高粱品种的判别方法及系统 |
Also Published As
| Publication number | Publication date |
|---|---|
| EP2323080A4 (en) | 2017-04-26 |
| US8682813B2 (en) | 2014-03-25 |
| EP2323080B1 (en) | 2019-05-15 |
| JP5141767B2 (ja) | 2013-02-13 |
| US20110137841A1 (en) | 2011-06-09 |
| EP2323080A1 (en) | 2011-05-18 |
| JPWO2010016109A1 (ja) | 2012-01-12 |
Similar Documents
| Publication | Publication Date | Title |
|---|---|---|
| JP5141767B2 (ja) | サンプルの帰属クラス予測方法、帰属クラス予測プログラムおよび帰属クラス予測装置 | |
| JP4985653B2 (ja) | 2クラス分類予測モデルの作成方法、分類予測モデル作成のためのプログラムおよび2クラス分類予測モデルの作成装置 | |
| JP5104877B2 (ja) | 二クラス分類予測モデルの作成方法、分類予測モデル作成のためのプログラムおよび二クラス分類予測モデルの作成装置 | |
| Ghorbani et al. | Comparing different resampling methods in predicting students’ performance using machine learning techniques | |
| Deng et al. | A time series forest for classification and feature extraction | |
| CN105279365B (zh) | 用于学习异常检测的样本的方法 | |
| US20220108184A1 (en) | Method and device for training a machine learning system | |
| Ge et al. | Probabilistic combination of local independent component regression model for multimode quality prediction in chemical processes | |
| US20220327394A1 (en) | Learning support apparatus, learning support methods, and computer-readable recording medium | |
| US8965111B2 (en) | Learning apparatus, a learning system, learning method and a learning program for object discrimination | |
| JP2014085948A (ja) | 誤分類検出装置、方法、及びプログラム | |
| JPWO2009118845A1 (ja) | 化合物の予測信頼性評価システム | |
| US12475358B2 (en) | Method for ascertaining an output signal with the aid of a machine learning system | |
| Amayri et al. | A statistical process control chart approach for occupancy estimation in smart buildings | |
| Sachs et al. | One-class support-vector machines for the classification of bioacoustic time series | |
| Khoshgoftaar et al. | Improving software quality estimation by combining feature selection strategies with sampled ensemble learning | |
| JP4852086B2 (ja) | パターン認識装置 | |
| Yolacan et al. | A framework for studying new approaches to anomaly detection | |
| Jaskie et al. | Evaluating the Positive Unlabeled Learning Problem | |
| US20250336475A1 (en) | Predicting function from sequence using information decomposition | |
| JP2009037640A (ja) | パターン認識装置および特徴抽出パラメータの生成方法 | |
| Wahyuddin et al. | Optimizing Shapelet Lengths for Effective Time Series Classification | |
| CN120279315A (zh) | 一种基于多粒度学习的人机协同机器视觉感知方法及装置 | |
| Ravikumar et al. | Fast classification of time series data | |
| Zhu et al. | A new multi-class classification algorithm of support vector machine |
Legal Events
| Date | Code | Title | Description |
|---|---|---|---|
| 121 | Ep: the epo has been informed by wipo that ep was designated in this application |
Ref document number: 08792225 Country of ref document: EP Kind code of ref document: A1 |
|
| WWE | Wipo information: entry into national phase |
Ref document number: 2010523668 Country of ref document: JP |
|
| WWE | Wipo information: entry into national phase |
Ref document number: 2008792225 Country of ref document: EP |
|
| NENP | Non-entry into the national phase |
Ref country code: DE |