WO2011027607A1 - 異常検知・診断方法、異常検知・診断システム、及び異常検知・診断プログラム - Google Patents
異常検知・診断方法、異常検知・診断システム、及び異常検知・診断プログラム Download PDFInfo
- Publication number
- WO2011027607A1 WO2011027607A1 PCT/JP2010/060232 JP2010060232W WO2011027607A1 WO 2011027607 A1 WO2011027607 A1 WO 2011027607A1 JP 2010060232 W JP2010060232 W JP 2010060232W WO 2011027607 A1 WO2011027607 A1 WO 2011027607A1
- Authority
- WO
- WIPO (PCT)
- Prior art keywords
- data
- abnormality
- observation data
- sensor signal
- abnormality detection
- Prior art date
- Legal status (The legal status is an assumption and is not a legal conclusion. Google has not performed a legal analysis and makes no representation as to the accuracy of the status listed.)
- Ceased
Links
Images




Classifications
-
- G—PHYSICS
- G05—CONTROLLING; REGULATING
- G05B—CONTROL OR REGULATING SYSTEMS IN GENERAL; FUNCTIONAL ELEMENTS OF SUCH SYSTEMS; MONITORING OR TESTING ARRANGEMENTS FOR SUCH SYSTEMS OR ELEMENTS
- G05B23/00—Testing or monitoring of control systems or parts thereof
- G05B23/02—Electric testing or monitoring
- G05B23/0205—Electric testing or monitoring by means of a monitoring system capable of detecting and responding to faults
- G05B23/0218—Electric testing or monitoring by means of a monitoring system capable of detecting and responding to faults characterised by the fault detection method dealing with either existing or incipient faults
- G05B23/0224—Process history based detection method, e.g. whereby history implies the availability of large amounts of data
- G05B23/0227—Qualitative history assessment, whereby the type of data acted upon, e.g. waveforms, images or patterns, is not relevant, e.g. rule based assessment; if-then decisions
-
- G—PHYSICS
- G06—COMPUTING OR CALCULATING; COUNTING
- G06F—ELECTRIC DIGITAL DATA PROCESSING
- G06F18/00—Pattern recognition
- G06F18/20—Analysing
- G06F18/21—Design or setup of recognition systems or techniques; Extraction of features in feature space; Blind source separation
- G06F18/213—Feature extraction, e.g. by transforming the feature space; Summarisation; Mappings, e.g. subspace methods
- G06F18/2137—Feature extraction, e.g. by transforming the feature space; Summarisation; Mappings, e.g. subspace methods based on criteria of topology preservation, e.g. multidimensional scaling or self-organising maps
-
- G—PHYSICS
- G06—COMPUTING OR CALCULATING; COUNTING
- G06F—ELECTRIC DIGITAL DATA PROCESSING
- G06F2218/00—Aspects of pattern recognition specially adapted for signal processing
- G06F2218/12—Classification; Matching
Definitions
- the present invention relates to an abnormality detection / diagnosis method and an abnormality detection / diagnosis system for early detection of an abnormality in a plant or equipment.
- Electric power companies use waste heat from gas turbines to supply hot water for district heating and supply high-pressure steam and low-pressure steam to factories.
- Petrochemical companies operate gas turbines and other power sources.
- it is extremely important to detect the abnormality at an early stage because damage to society can be minimized.
- a system that monitors observation data and compares it with a set threshold value to detect an abnormality is often used.
- the threshold value is set by paying attention to the physical quantity of the measurement object as each observation data, it can be said that it is design-based abnormality detection.
- the set threshold value cannot be considered appropriate due to the operating environment of the equipment, the state change due to the operating years, the operating conditions, the influence of parts replacement, and the like.
- the estimated value is calculated by linear combination of observation data and data with high similarity, and the degree of deviation between the estimated value and observation data is calculated. Because the data is output, depending on the preparation of the learning data, it is possible to consider the operating environment of the equipment, the state change depending on the operating years, the operating conditions, the influence of parts replacement, and the like. However, it is necessary to explain why the observation data contains anomalies. In the case of anomaly detection in a feature space with a weak physical meaning, such as General Electric's k-means clustering, it is difficult to explain the anomaly. If the explanation is difficult, it will be treated as a false detection. Conventionally, design-based abnormality detection and case-based abnormality detection often move independently without being linked to each other.
- an object of the present invention is to solve the above problems and to provide a method for interlocking design-based abnormality detection with case-based abnormality detection.
- a rule that can also be a determination condition for abnormality detection is constructed from case-based abnormality detection by multivariate analysis, and this is applied to design-based abnormality detection.
- the threshold value can be set and controlled appropriately.
- anomaly detection based on a case base by multivariate analysis for multidimensional sensor signals controls design based anomaly detection for individual sensor signals. That is, (1) abnormality detection based on the case base selects sensor signals and sets threshold values according to various abnormalities. Specifically, abnormality detection (feature conversion), evaluation of the influence level of each signal, construction of determination conditions (rules), and selection and display of sensor signals corresponding to the abnormality are performed. (2) The design-based abnormality detection for the individual sensor signal receives the above and performs abnormality detection. Specifically, threshold setting and control, threshold display, abnormality detection and display are performed. In case-based abnormality detection, learning data is modeled by the subspace method, and abnormality candidates are detected based on the distance relationship between the observation data and the subspace.
- the top k pieces of data with high similarity are obtained for each piece of data included in the learning data, thereby generating a subspace.
- the above k is not a fixed value, but learning data with a distance from the observation data within a specified range is selected so that it is appropriate for each observation data, and the learning data is sequentially increased from the minimum number to the selected number and projected. Choose the one with the smallest distance.
- a method of detecting an abnormality is realized as a program, and this is provided to the customer by a media medium or an online service.
- the focus on the observation data becomes clear, and the explanation of the abnormality is greatly improved.
- individual sensor signals are displayed and threshold values are set, correspondence with individual sensor signals representing physical quantities is easy and the physical meaning is easy to understand.
- a multivariate analysis method with a large computational load can also be implemented, enabling highly sensitive abnormality sign detection. Thereby, a weak abnormality can be detected at an early stage.
- FIG. 1 is an example of a multidimensional time series signal targeted by the anomaly detection system of the present invention.
- FIG. 2 is an example of an individual detection technique for performing abnormality detection by threshold processing of a multidimensional time series signal.
- FIG. 3 is a representative example of case-based abnormality detection.
- FIG. 4 is a diagram for explaining various feature conversions used for case-based abnormality detection.
- FIG. 5 is a block diagram of the abnormality detection system of the present invention.
- FIG. 6 is an explanatory diagram of role assignment.
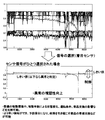
- FIG. 7 is an example of an observation signal, and is a diagram showing a result of detecting an abnormality with a certain threshold in the individual detection method.
- FIG. 8 is an explanatory diagram of a case-based abnormality detection technique using a plurality of classifiers.
- FIG. 1 is an example of a multidimensional time series signal targeted by the anomaly detection system of the present invention.
- FIG. 2 is an example of an individual detection technique for performing abnormality detection by threshold processing of
- FIG. 9 is a diagram showing a result of case-based abnormality detection.
- FIG. 10 shows an example in which threshold control is performed in the individual detection method so as to be the same as the result of case-based abnormality detection.
- FIG. 11 shows an example in which the observation signal is selected and the threshold value is controlled based on the result of the case-based abnormality detection.
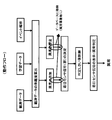
- FIG. 12 shows the flow of the present invention.
- FIG. 13 shows the flow of the present invention.
- FIG. 14 shows another example of the influence degree according to the present invention.
- FIG. 15 illustrates one method of the subspace method of the present invention.
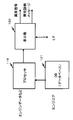
- FIG. 16 is a block diagram of the periphery of a processor that executes the present invention.
- FIG. 17 shows the overall configuration of the present invention.
- FIG. 18 shows a network between sensor signals according to the present invention.
- FIG. 19 shows the structure of abnormality detection and cause diagnosis according to the present invention.
- FIG. 20 shows an example of component information according to the present invention.
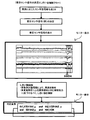
- FIG. 21 shows an example of a graphic user interface GUI according to the present invention.
- FIG. 22 is an explanatory diagram of (a) a technique for calculating the similarity of a deviation time series pattern and (b) a deviation signal of observation data corresponding to (a) of the technique for predicting the occurrence of an abnormality using a deviation time series pattern.
- FIG. 2 shows a method of detecting an abnormality using a multidimensional time series sensor signal as an input.
- the sensor signal is processed from various viewpoints based on the knowledge of what is abnormal with respect to the multidimensional time series sensor signal. For example, the sensor signal is differentiated at the filter processing in FIG. Alternatively, signals for a certain period may be added by integration processing. Furthermore, focusing on the frequency of the signal, it may be a process such as Fourier transform or Wavelet transform.
- the filtering process may be different or the same for each sensor signal.
- sensor signal normalization canonicalization
- the threshold is set based on design knowledge. That is, the threshold value is set in consideration of what is desired as the physical quantity represented by the sensor signal, what should be, the operating state of the facility, the environment, and the history. In other words, design-based anomaly detection. This design-based anomaly detection is easy to understand for designers or service personnel.
- the threshold value is visual and easy to set because it is based on a physical phenomenon. In other words, it is easy to apply design standards, such as the number of revolutions or pressure, and there is little entanglement with other sensor signals, and in many cases it can be considered independently and understand the phenomenon. Easy to set the signal range, upper and lower limits based on design criteria. On the other hand, an abnormality over a plurality of sensor signals has a demerit that it is difficult to identify the abnormality.
- FIG. 3 shows a method for detecting an anomaly based on a case base.
- outliers are extracted from the normal data by multivariate analysis.
- event data alarm information or the like
- learning data completeness evaluation
- FIG. 4 shows an example of feature conversion for reducing the dimension of the multidimensional time series signal used in FIG.
- principal component analysis several methods such as independent component analysis, non-negative matrix factorization, latent structure projection, and canonical correlation analysis are applicable.
- FIG. 4 shows the scheme and functions together.
- Principal component analysis is called PCA, and linearly transforms an M-dimensional multidimensional time-series signal into an r-dimensional multidimensional time-series signal having the number of dimensions r to generate an axis that maximizes variation.
- KL conversion may be used.
- the number of dimensions r is determined based on a value that is a cumulative contribution ratio obtained by arranging eigenvalues obtained by principal component analysis in descending order and dividing the eigenvalue added from the larger one by the sum of all eigenvalues.
- ICA Independent component analysis
- NMF Non-negative matrix factorization
- the method without the teacher is an effective conversion method when there are few abnormal cases and it cannot be used as in this embodiment.
- an example of linear transformation is shown. Nonlinear transformation is also applicable.
- the above-mentioned feature conversion is performed simultaneously with learning data and observation data arranged, including canonicalization normalized by standard deviation. In this way, learning data and observation data can be handled in the same row. Since sensor signals are converted by such feature conversion, it is difficult for designers or service personnel to understand abnormality detection based on case bases. The phenomenon is difficult to understand because it is entangled with other sensor signals and is not independent or individual. On the other hand, since outliers are extracted from normal data, there is a great merit that sensitivity is good.
- FIG. 5 shows the abnormality detection method of the present invention.
- the upper part is the design-based abnormality detection for the individual sensor signal shown in FIG. 2, and the lower part is the abnormality detection based on the case base by the multivariate analysis of the multidimensional sensor signal shown in FIG.
- Anomaly detection based on the case base is configured to control the anomaly detection based on the design.
- Anomaly detection based on case base by multivariate analysis also inputs event data.
- Abnormality detection based on a case base by multivariate analysis of a multidimensional sensor signal selects a sensor signal and sets a threshold value according to various abnormalities. Specifically, abnormality detection (feature conversion), evaluation of the influence degree of each signal, construction of a determination condition (rule) for each type of abnormality, and selection and display of a sensor signal corresponding to the abnormality are performed.
- the design-based abnormality detection for the individual sensor signal receives the above and performs abnormality detection. Specifically, threshold setting and control, threshold display, abnormality detection and display are performed.
- FIG. 6 summarizes the basic idea of the present invention. Hereinafter, these ideas and operations will be further described.
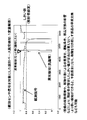
- Fig. 7 shows an example of a sensor signal for design-based abnormality detection, a set threshold value, and an abnormality detection result.
- the threshold value is given by the designer. Since the sensor signal and the threshold value are one-to-one, it is easy to understand. It seems that the timing of abnormality detection is a little late. If it can be detected a little earlier, it will be preventive maintenance, and it will be possible to replace parts that cause failure early. The reason why the threshold value is not appropriate is that, for example, the operating environment of the equipment, the state change due to the operating years, the operating conditions, the influence of parts replacement, etc. are outside the range assumed by the designer.
- FIG. 8 shows an anomaly detection method based on a case base.
- 11 is a multidimensional time series signal acquisition unit
- 12 is a feature extraction / selection / conversion unit
- 13 is a classifier
- 14 is integrated (global anomaly measure)
- 15 is learning data mainly composed of normal cases. Show.
- the multidimensional time series signal input from the multidimensional time series signal acquisition unit 11 is reduced in dimension by the feature extraction / selection / conversion unit 12, identified by a plurality of classifiers 13, and integrated (global anomaly measure) 14.
- a global anomaly measure is determined.
- the learning data 15 mainly consisting of normal cases is also identified by the plurality of discriminators 13 and used for the determination of the global abnormality measure, and the learning data 15 consisting mainly of normal cases is also selected and stored and updated. As a result, the accuracy is improved.
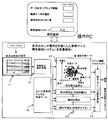
- FIG. 8 also shows an operation PC on which a user inputs parameters.
- the user input parameters include data sampling intervals, observation data selection, abnormality determination threshold values, and the like.
- the data sampling interval indicates, for example, how many seconds the data is acquired.
- the selection of the observation data indicates which sensor signal is mainly used.
- the threshold value for abnormality determination is a threshold value for binarizing the value of abnormality expressed as a deviation / deviation from the model, an outlier value, a deviation degree, an abnormality measure, and the like.
- the plurality of discriminators 13 shown in FIG. 8 can prepare several discriminators (h1, h2,%) And take a majority vote (integration 14). That is, ensemble (group) learning using different classifier groups (h1, h2,...) Can be applied.
- the first classifier is a projection distance method
- the second classifier is a local subspace method
- the third classifier is a linear regression method. Any classifier can be applied as long as it is based on case data.
- FIG. 9 shows an example of the result of abnormality detection based on the case base.
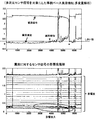
- the sensor signal is the same as that shown in FIG. 7, but the anomaly measure calculated by multivariate analysis for the multidimensional time series sensor signal is displayed.
- the abnormality measure is obtained in FIG. 15 described later. According to this example, the abnormality detection time is considerably earlier than the design-based abnormality detection time.
- FIG. 10 is an example in which abnormality detection is accelerated by controlling the threshold value in FIG. In this case, it can be said that an appropriate abnormality was detected.
- the threshold setting is manual, artificial, and the basis for setting is unclear.
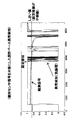
- FIG. 11 shows an example in which an abnormality is detected by using a result of anomaly detection based on a case base, selecting a sensor signal by using the degree of influence on the anomaly in the sensor signal, and then controlling a threshold value. It is. It reflects the operating environment of the equipment, changes in the status depending on the years of operation, operating conditions, effects of parts replacement, etc., and a basis for setting the threshold is also given. The visibility of abnormalities is also improved.
- the degree of divergence (similarity) between observation data and learning data is first calculated using the observation data, learning data, and event analysis results.
- Event data (such as alarm information) is used for selection of learning data, for example.
- the presence / absence of abnormality is determined based on the degree of difference (similarity) between the observation data and the learning data (threshold is set from the outside).
- the influence level of the abnormality is calculated.
- the observation data is identified using the average of the k-nearest neighbor data in each class and the distance of the observation data (referred to as LAC method). Thereby, the lower graph of FIG. 9 is obtained.
- the corresponding sensor signal is selected based on various abnormalities and the degree of influence of the abnormalities. In some cases, it is necessary to accumulate various abnormalities and the degree of influence of the abnormalities as a database.
- the abnormality detection result is used to control the threshold value for each original sensor signal. That is, the threshold value is controlled so that the sensitivity is almost the same.
- the graph shown in FIG. 11 is obtained. If the sensitivity is set so that it is not overlooked, there is a risk of false detection, but here this is OK.
- the same threshold value is set for the selected plurality of sensor signals. At this time, the threshold value is determined so as not to cause erroneous detection as much as possible by the majority decision or logical product of the abnormality detection of the plurality of selected sensor signals. These are displayed, and the abnormality detection result is also displayed.
- a logic such as majority decision or logical product of abnormality detection of a plurality of selected sensor signals becomes a determination condition (rule).
- Judgment condition Conditions such as majority or logical product of threshold processing result of selected sensor signal
- Each sensor signal represents a specific physical quantity such as cooling water temperature, pressure, generated current, generated voltage, etc. If thresholds can be set for each sensor signal, it is easy for designers to understand the physical limits that lead to abnormalities, and it is easy to visually understand abnormal phenomena, so that the operating principles of the equipment and physical phenomena can be handled. There is a big merit that it is easy to take. Determination conditions (rules) obtained for individual sensor signals are externally displayed or output.
- the abnormality detection result shown in FIG. 11 is displayed on a monitor or the like.
- case-based abnormality detection by multivariate analysis is often expressed by linear combination of a plurality of sensor signals. In this case, if it is a linear combination of the cooling water temperature and the generated current, the interpretation is difficult.
- the connection between sensor signals can be understood and a network can be constructed, but it is also a fact that there is a difference from the direct understanding of maintenance engineers and customers. Therefore, the derivation and clarification of the above judgment conditions are important in terms of how the event can be easily grasped as fluctuations in individual sensor signals, or whether the event can be explained with a small number of sensor signals. It becomes.
- Case-based anomaly detection by multivariate analysis for multidimensional sensor signals can be performed asynchronously with data sampling without having to be always linked (synchronized).
- a complex abnormality detection method that requires a large load and requires an abnormality detection processing time compared to the data sampling time can be installed and applied, and the sensitivity of abnormality detection can be further improved.
- fast sampling such as 1 ms cycle
- desynchronization is important.
- a deterioration type abnormality that does not require a processing speed only by detecting an abnormality on a daily basis, there is no problem even if synchronization is performed.
- FIG. 13 shows an example of the selected sensor signal.
- threshold values th1_l, th1_u, th2_l, th2_u, th3_u, th4_l, etc. are set for the selected sensor signals S1, S2, S3, S4 and the like.
- an abnormality is detected by a logical product of threshold processing results (binary logic) of each selected sensor signal. These are the determination conditions (rules) for abnormality detection.
- the thresholds th1_l, th1_u, th2_l, th2_u, th3_u, and th4_l are close to the same detection capability as that of abnormality detection by multivariate analysis.
- the sensitivity of abnormality detection improves the visibility, and facilitate the interpretation, but dealing with the type of abnormality becomes an issue. That is, the plurality of selected sensor signals are likely to be different depending on the type of abnormality. Therefore, based on past cases, for each type of abnormality, the sensor signal selection and the set threshold value are stored in the database and may be used. In this case, multiple selections and multiple thresholds are indicated.
- a database including such anomaly cases, sensor signal influence levels, selection results, and the like is used as an effective judgment material even in anomaly diagnosis.
- FIG. 14 shows another example of the evaluation of the influence level.
- the signal A is fluctuated, and a sign of abnormality has occurred.
- other sensor signals such as B, also show fluctuations.
- the influence of the signal B was determined to be large.
- the difference in the scale of the signal even if the canonicalization normalized by the standard deviation is applied, the scale of the signal is unlikely to be exactly the same. Normalization has become difficult.
- the influence degree of the signal B is not really large.
- the sensor signal can be selected in consideration of design information. Specifically, the design information is also used, a correction coefficient is set, a signal is selected by multiplying the degree of influence by the correction coefficient.
- FIG. 15 illustrates a general CLAFIC method for a selected sensor signal network. The deviation from the model is obtained. The case of 2 classes and 2D patterns is shown. A subspace of each class, that is, a subspace represented here as a one-dimensional straight line is obtained.
- eigenvalue decomposition is performed on the autocorrelation matrix of each class of data, and an eigenvector is obtained as a basis.
- the eigenvectors corresponding to the upper eigenvalues having a large value are used.
- the unknown pattern q (latest observation pattern) is classified into class A.
- class A is assumed to be a normal part, and an unknown pattern q (latest observed pattern) is changed to a class.
- the distance to A is determined and this is taken as the deviation. If the deviation is large, it is determined as an outlier.
- the influence is mitigated when the dimension is reduced and the subspace is made. This is an advantage of applying the subspace method.
- the center of gravity of each class is used as the origin.
- the eigenvector obtained by applying KL expansion to the covariance matrix of each class is used as a basis.
- Various subspace methods have been proposed, but if there is a distance scale, the degree of deviation can be calculated. In the case of the density, the degree of deviation can be determined based on the magnitude.
- the CLAFIC method is a similarity measure because the length of the orthogonal projection is obtained.
- Subspace methods such as the projection distance method are discriminators based on distance, and as a learning method when abnormal data can be used, vector quantization that updates dictionary patterns and metric learning that learns distance functions can be used. .
- k multidimensional time series signals close to an unknown pattern q (latest observation pattern), called a local subspace method, are obtained, and a linear manifold is generated such that the nearest neighbor pattern of each class is the origin, A method of classifying an unknown pattern into a class having a minimum projection distance to the linear manifold can also be applied (see the frame of the local subspace method in FIG. 8).
- Local subspace method is also a kind of subspace method.
- K is a parameter.
- the class A to which the majority of data belongs is regarded as a normal part, and the distance from the unknown pattern q (latest observation pattern) to the class A is obtained, This is the deviation.
- an orthogonal projection point from an unknown pattern q (latest observation pattern) to a partial space formed using k multidimensional time series signals can be calculated as an estimated value ( (The estimated value data described in the frame of the local subspace method in FIG. 8). It is also possible to rearrange the k multi-dimensional time series signals in the order closer to the unknown pattern q (latest observation pattern) and perform weighting inversely proportional to the distance to calculate the estimated value of each signal.
- the estimated value can be calculated in the same manner by the projection distance method or the like.
- the parameter k is usually set to one type, but if the parameter k is changed and executed several times, the target data will be selected according to the similarity, and it will be a comprehensive judgment from those results, so it will be more effective. It is. Furthermore, because the normal part is in various states including transitional periods such as equipment ON / OFF, for each observation data input, we decided to select learning data similar to the observation data based on the distance from the observation data. . Alternatively, the learning data may be sequentially increased from the minimum number to the selected number to select the one that minimizes the projection distance. This can also be applied to the projection distance method. In this case, the clustering shown in FIG. 8 becomes unnecessary. In the local subspace method, even if anomalous values are mixed slightly, the influence is greatly reduced when the local subspace is used.
- a classifier such as a one-class support vector machine is also applicable if it is simply considered as a problem of one-class identification.
- kernelization such as radial ⁇ basis function that maps to higher-order space can be used.
- the side close to the origin is an outlier, that is, an abnormality.
- the support vector machine can cope with a large dimension of the feature amount, there is a drawback that the calculation amount becomes enormous as the number of learning data increases.
- FIG. 16 shows a hardware configuration of the abnormality detection system of the present invention.
- Sensor data such as a target engine is input to the processor 119 that performs abnormality detection, and the missing value is repaired and stored in the database DB 121.
- the processor 119 performs abnormality detection using the DB data including the acquired observation sensor data and learning data.
- the display unit 120 performs various displays and outputs the presence / absence of an abnormality signal and a message for explaining an abnormality described later. It is also possible to display a trend. The interpretation result of the event can also be displayed.
- the program installed therein can also be provided to the customer through a media medium or an online service.
- the database DB 121 can be operated by skilled engineers. In particular, abnormal cases and countermeasure cases can be taught and stored. (1) Learning data (normal), (2) abnormal data, (3) countermeasure contents are stored. By making the database DB a structure that can be manipulated by skilled engineers, a sophisticated and useful database can be created. Further, the data operation is performed by automatically moving learning data (individual data, the position of the center of gravity, etc.) with the occurrence of an alarm or part replacement. It is also possible to automatically add acquired data. If there is abnormal data, a method such as generalized vector quantization can be applied to the movement of the data.
- FIG. 17 shows abnormality detection and diagnosis after abnormality detection.
- an abnormality is detected from the time-series signal from the facility by the feature extraction / classification 24 of the time-series signal.
- the equipment is not limited to one. Multiple facilities may be targeted.
- maintenance events such as alarms and work results for each equipment. Specifically, equipment start / stop, operating condition setting, various fault information, various warning information, periodic inspection information, operating environment such as installation temperature, operation, etc. Accompanying information such as accumulated time, parts replacement information, adjustment information, cleaning information, etc.) is captured, and abnormalities are detected with high sensitivity.
- Predictive detection is performed using the subspace method, etc., and event sequence matching is also used to determine whether or not it is a general predictor. Based on this predictor, abnormality diagnosis is performed to identify faulty candidate parts and when the relevant parts stop malfunctioning. Guess what will happen. Then, necessary parts are arranged at a necessary timing.
- the abnormality diagnosis 26 can be easily divided into a phenomenon diagnosis that identifies a sensor that contains a sign and a cause diagnosis that identifies a part that may cause a failure.
- the abnormality detection unit outputs information regarding the feature amount in addition to a signal indicating the presence / absence of abnormality to the abnormality diagnosis unit.
- the abnormality diagnosis unit makes a diagnosis based on this information.
- FIG. 19 shows the configuration of the abnormality detection and cause diagnosis part.
- a sensor data acquisition unit that acquires data from a plurality of sensors, learning data that is substantially normal data, a model generation unit that models learning data, and the similarity between observation data and modeled learning data
- Abnormality detection unit that detects presence / absence of abnormality
- influence degree evaluation unit of sensor signal that evaluates the degree of influence of each signal
- sensor signal network generation unit that creates a network diagram showing the relevance of each sensor signal, abnormal cases, each sensor It consists of a related database consisting of signal influence levels, selection results, etc., a design information database if it is equipment design information, a cause diagnosis unit, a related database for storing diagnosis results, and input / output.
- the design information database also includes information other than design information. Taking the engine as an example, the model, model, components shown in FIG. 21, parts table (BOM), past maintenance information (on-call contents, error occurrences) Sensor signal data, adjustment date / time, captured image data, abnormal sound information, replacement part information, etc.), cause diagnosis tree (simple tree created by the designer. Branch by case to identify units and parts that need replacement), Includes operational status information, inspection data during transportation and installation.
- the component shown in FIG. 20 is information related to a block of electrical parts.
- the feature of this configuration is that it uses a network representing the relevance of each sensor signal to link this with component information to support cause diagnosis.
- a network representing the relevance of each sensor signal generated from the degree of influence of the sensor signal serves as knowledge material for cause diagnosis.
- diagnosis based on connectivity between elements (ambiguous expressions) representing phenomena, parts, and treatments in a plurality of cases, a list of possible countermeasures is presented when a phenomenon occurs. Specifically, for example, in the case of a medical device, for a phenomenon such as a ghost occurring in an image, a cable representing a relevance of each sensor signal is connected to a cable that is a component element, and cable shielding processing is performed. Presented as one of the list of possible countermeasures.
- FIG. 21 shows an example of a graphical user interface (GUI).
- GUI graphical user interface
- FIG. 22 is an explanatory diagram of an anomaly sign detection technique based on a deviation time series pattern.
- 22A shows a method for calculating the similarity of the deviation time series pattern
- FIG. 22B shows a deviation signal of observation data corresponding to FIG. 22A.
- the “0” point in the space of FIG. 22A corresponds to the normal center of gravity of each observation data obtained by the local subspace method shown in FIG. 8, and the sensor signal A, sensor signal B, and sensor signal at each time point. Deviation from the normal center of gravity of C is expressed as a trajectory in space.
- a deviation series of observation data that has passed time t-1, time t, and time t + 1 is indicated by a dotted line with an arrow.
- the similarity between observed data and abnormal cases can be estimated by calculating the inner product (A / B) of each deviation. It is also possible to divide the inner product (A ⁇ B) by the size (norm) and estimate the similarity by the angle ⁇ .
- FIG. 22A shows the deviation of the abnormal case A, the deviation of the abnormal case B, and the deviation of the abnormal case C. Looking at the deviation series pattern of the observation data indicated by the dotted line with the arrow, it is close to the abnormal case B at the time t, but from the trajectory, predict the occurrence of the abnormal case A, not the abnormal case B Can do.
- FIG. 22 shows a temporal transition of deviation signals of a plurality of observation data corresponding to the sensor signals A, B, C, etc. in (a) of FIG.
- an abnormal situation occurs in which the jacket water pressure decreases.
- t ⁇ 1, t, t + 1 a deviation signal of the observation data is detected, and the trajectory database.
- the degree of similarity of the time-series pattern of the trajectory data stored in can be calculated to detect a sign of occurrence of a specific abnormality.
- Anomalies can be detected from normal data. (2) Even if data collection is incomplete, highly accurate abnormality detection is possible. (3) Even if abnormal data is included, this effect can be tolerated. In addition to direct effects such as (4) It is easy for the user to visually grasp the abnormal phenomenon and to understand the phenomenon. (5) For designers, it is easy to visually grasp abnormal phenomena and easily deal with physical phenomena. (6) Engineer's knowledge can be utilized (7) Physical model can be used together, (8) There is a secondary effect that an abnormality detection method that requires a large calculation load and requires processing time can be applied.
- the present invention can be used for detecting abnormalities in plants and equipment.
- Multidimensional time series signal acquisition unit 12 Feature extraction / selection / conversion unit 13
- Discriminator 14 Integration (global anomaly measure) 15
- Learning data database mainly composed of normal cases 24 Feature extraction / classification of time series signal 25
- Predictive detection 26 Abnormal diagnosis 119
- Processor 120 Display unit 121 Database (DB)
Landscapes
- Engineering & Computer Science (AREA)
- Physics & Mathematics (AREA)
- General Physics & Mathematics (AREA)
- Computer Vision & Pattern Recognition (AREA)
- Data Mining & Analysis (AREA)
- Theoretical Computer Science (AREA)
- Automation & Control Theory (AREA)
- Artificial Intelligence (AREA)
- Evolutionary Computation (AREA)
- Evolutionary Biology (AREA)
- General Engineering & Computer Science (AREA)
- Bioinformatics & Computational Biology (AREA)
- Bioinformatics & Cheminformatics (AREA)
- Life Sciences & Earth Sciences (AREA)
- Testing And Monitoring For Control Systems (AREA)
- Management, Administration, Business Operations System, And Electronic Commerce (AREA)
Abstract
多次元センサ信号の多変量解析による事例ベースの異常検知から異常検知の判定条件ルールを構築し、個別センサ信号の設計ベースの異常検知に適用し、更にしきい値の設定及び制御も適切に実行可能として、異常を高感度、早期に、かつ視認性よく検知異常検知方法及びシステムを提供する。 多変量解析による事例ベースに基づく異常検知が、設計ベースの異常検知を制御する。すなわち、(1)事例ベースに基づく異常検知が、各種異常に応じて、センサ信号の選択と異常検知を行う。具体的には、異常検知(特徴変換)、各信号の影響度の評価、判定条件(ルール)の構築、異常に応じたセンサ信号の選択と表示を行う。(2)個別センサ信号に対する設計ベースの異常検知は、上記を受けて、異常検知を行う。具体的には、しきい値の設定と制御、しきい値表示、異常検知と表示を行う。
Description
本発明は、プラントや設備などの異常を早期に検知する異常検知・診断方法及び異常検知・診断システムに関する。
電力会社では、ガスタービンの廃熱などを利用して地域暖房用温水を供給したり、工場向けに高圧蒸気や低圧蒸気を供給したりしている。石油化学会社では、ガスタービンなどを電源設備として運転している。このようにガスタービンなどを用いた各種プラントや設備において、その異常を早期に発見することは、社会へのダメージを最小限に抑えることができ、極めて重要である。
ガスタービンや蒸気タービンのみならず、水力発電所での水車、原子力発電所の原子炉、風力発電所の風車、航空機や重機のエンジン、鉄道車両や軌道、エスカレータ、エレベータ、MRIなどの医療機器、半導体やフラットパネルディスプレイ向けの製造・検査装置、機器・部品レベルでも、搭載電池の劣化・寿命など、早期に異常を発見しなければならない設備は枚挙に暇がない。最近では、健康管理のため、脳波測定・診断に見られるように、人体に対する異常(各種症状)の検知も重要になりつつある。
このため、例えば米国のSmart
Signal社では、特許文献1や特許文献2に記載のように、おもにエンジンを対象に、異常検知の業務をサービスしている。そこでは、過去のデータをデータベース(DB)としてもっておき、観測データと過去の学習データとの類似度を独自の方法で計算し、類似度の高いデータの線形結合により推定値を算出して、推定値と観測データのはずれ度合いを出力する。General Electric社のように、特許文献3の内容を見ると、異常検知をk-meansクラスタリングにより検出している例もある。
Signal社では、特許文献1や特許文献2に記載のように、おもにエンジンを対象に、異常検知の業務をサービスしている。そこでは、過去のデータをデータベース(DB)としてもっておき、観測データと過去の学習データとの類似度を独自の方法で計算し、類似度の高いデータの線形結合により推定値を算出して、推定値と観測データのはずれ度合いを出力する。General Electric社のように、特許文献3の内容を見ると、異常検知をk-meansクラスタリングにより検出している例もある。
StephanW. Wegerich;Nonparametric modeling of vibration sign al features for equipmenthealthmonitoring、Aerospace Conference, 2003. Proceedings.2003 IEEE, Volume 7, Issue,2003 Page(s):3113-3121
一般には、観測データをモニタし、設定したしきい値と比較して、異常を検知するシステムがよく用いられている。この場合は、各観測データであるところの測定対象の物理量などに着目してしきい値を設定するため、設計ベースの異常検知であると言える。この方法では、設計が意図しない異常は検知が困難であり、見逃しが発生し得る。例えば、設備の稼動環境や、稼動年数による状態変化、運転条件、部品交換の影響などにより、設定したしきい値が妥当とは言えなくなる。
一方、Smart
Signal社が用いている、事例ベースの異常検知に基づく手法では、学習データを対象に、観測データと類似度の高いデータの線形結合により推定値を算出し、推定値と観測データのはずれ度合いを出力するため、学習データの準備次第で、設備の稼動環境や、稼動年数による状態変化、運転条件、部品交換の影響などを考慮できる。しかし、観測データになぜ異常が含まれるのかは、説明が必要である。General Electric社のk-meansクラスタリングのような、物理的意味が希薄な特徴空間内での異常検知では、さらに異常の説明は困難である。説明が困難な場合は、誤検出として扱われることになる。従来、設計ベースの異常検知と事例ベースの異常検知は、互いに連動することなく、独立に動く場合が多い。
Signal社が用いている、事例ベースの異常検知に基づく手法では、学習データを対象に、観測データと類似度の高いデータの線形結合により推定値を算出し、推定値と観測データのはずれ度合いを出力するため、学習データの準備次第で、設備の稼動環境や、稼動年数による状態変化、運転条件、部品交換の影響などを考慮できる。しかし、観測データになぜ異常が含まれるのかは、説明が必要である。General Electric社のk-meansクラスタリングのような、物理的意味が希薄な特徴空間内での異常検知では、さらに異常の説明は困難である。説明が困難な場合は、誤検出として扱われることになる。従来、設計ベースの異常検知と事例ベースの異常検知は、互いに連動することなく、独立に動く場合が多い。
そこで、本発明の目的は、上記課題を解決し、設計ベースの異常検知と事例ベースの異常検知を連動させる方法を与えるものである。これにより、多変量解析による事例ベースの異常検知から、異常検知の判定条件とも言えるルールを構築し、これを設計ベースの異常検知に適用する。さらに、しきい値の設定および制御も適切に実行できるようにする。これらにより、異常を高感度、早期に、かつ視認性よく検知することが可能な異常検知方法およびシステムを提供する。
上記目的を達成するために、本発明は、多次元センサ信号を対象にした多変量解析による事例ベースに基づく異常検知が、個別センサ信号を対象にした設計ベースの異常検知を制御する。すなわち、(1)事例ベースに基づく異常検知が、各種異常に応じて、センサ信号の選択としきい値設定を行う。具体的には、異常検知(特徴変換)、各信号の影響度の評価、判定条件(ルール)の構築、異常に応じたセンサ信号の選択と表示を行う。(2)個別センサ信号に対する設計ベースの異常検知は、上記を受けて、異常検知を行う。具体的には、しきい値の設定と制御
、しきい値表示、異常検知と表示を行う。なお、事例ベースの異常検知は、学習データを部分空間法でモデル化し、観測データと部分空間の距離関係に基づき、異常候補を検知する。
、しきい値表示、異常検知と表示を行う。なお、事例ベースの異常検知は、学習データを部分空間法でモデル化し、観測データと部分空間の距離関係に基づき、異常候補を検知する。
また、観測データごとに、学習データに含まれる個々のデータに対し、類似度の高い上位k個のデータを求め、これにより部分空間を生成する。上記kは固定値でなく、観測データごとに適切な値とすべく、観測データからの距離が所定範囲内にある学習データを選択し、しかも学習データを最低個数から選択個数まで順次増やして投影距離が最小になるものを選ぶ。顧客へのサービス形態としては、異常検知を行う手法をプログラムとして実現し、これを、メディア媒体やオンラインサービスにより顧客に提供する。
本発明によれば、観測データに対する着眼点が明瞭になり、異常の説明性が格段に向上する。具体的には、個別センサ信号を対象に表示、しきい値設定を行うため、物理量を表す個別センサ信号と対応がつき、物理的意味が理解しやすい。演算負荷の大きい多変量解析手法も実装でき、高感度な異常予兆検知を可能とできる。これにより、微弱な異常を早期に検知できる。
これらによって、ガスタービンや蒸気タービンなどの設備のみならず、水力発電所での水車、原子力発電所の原子炉、風力発電所の風車、航空機や重機のエンジン、鉄道車両や軌道、エスカレータ、エレベータ、そして機器・部品レベルでは、搭載電池の劣化・寿命など、種々の設備・部品において異常の早期・高精度な発見が可能となる。
以下、本発明の実施の形態について、図面を参照して説明する。
図1は本発明の異常検知システムが対象とするセンサ信号の一例である。センサ信号の種類は、数十から数万個存在する。設備の規模、設備が故障したときの社会的ダメージなどにより、センサ信号の種類が決まる。対象は,多次元・時系列のセンサ信号であり,発電電圧、排ガス温度、冷却水温度、冷却水圧力、運転時間などである。設置環境のたぐいもモニタされる。センサのサンプリングタイミングも、同様に、数十msから数十秒程度まで、いろいろなものがある。
図2は、多次元時系列センサ信号を入力として、異常を検知する方法を示したものである。多次元時系列センサ信号に対して、何を異常とするかの知識に基づき、種々の視点でセンサ信号を加工する。例えば、同図のフィルタ処理のところで、センサ信号を微分し、信号の時間変化を捉える。あるいは、積分処理により、一定期間の信号を加算することもある。さらには、信号の周波数に着目し、フーリエ変換やWavelet変換のような処理であることもある。
このような加工を施した後に、同図に示すしきい値処理(例えば、上限と下限のしきい値をそれぞれ設定)において、しきい値を設定して、異常の有無を判定する。フィルタ処理は、センサ信号ごとに、異なるものでもよいし、同じでもよい。また、図示していないが、センサ信号の正規化(正準化)をほどこしてもよい。
上記方法の場合、しきい値は、設計の知識に基づき、設定される。すなわち、センサ信号が表す物理量として、何が望ましいか、どうあるべきか、設備の動作状態、環境、履歴も踏まえ、これらが考慮されて、しきい値が設定される。言わば、設計ベースの異常検知である。この設計ベースの異常検知は、設計者にとって、あるいはサービス要員にとって分かりやすい。しきい値は、物理現象に基づくため、視覚的であり設定しやすい。すなわち、対象が回転数であったり、圧力であったりするなど、設計基準を適用しやすく、かつ他のセンサ信号との絡みも少なく、独立・個別に考えてよい場合が多く、現象を理解しやすく、信号の取り得るレンジ、上限や下限などを設計基準に基づき設定しやすい。一方で、複数のセンサ信号にまたがる異常は、これを識別しがたいというデメリットがある。
また、重要な点は、設計者が意図しない異常は、これを検知できないことである。実際の異常は、設計者が意図しないものも多く、その点で設計ベースの異常検知方法は問題がある。勿論、センサ信号を蓄積し、統計的に扱うことも可能である。しかし、この方法では、他の信号の振舞いを考慮できず、検知限界が低いと考えられる。
図3は、事例ベースに基づいて異常を検知する方法を示したものである。多次元時系列センサ信号に対して、多変量解析により、正常データから見て、はずれ値を抽出する。センサデータ以外に、イベントデータ(アラーム情報など)を用いて、学習データの選択(完備性評価)や異常診断を行うこともある。さらには、複数の識別器を用いた識別による、よりロバストな異常検知も実現できる。
図4は、図3にて使われる多次元時系列信号の次元を削減する特徴変換の例を示したものである。主成分分析以外にも、独立成分分析、非負行列因子分解、潜在構造射影、正準相関分析など、いくつかの手法が適用可能である。図4に、方式図と機能を併せて示した。主成分分析は、PCAと呼ばれ、M次元の多次元時系列信号を、次元数rのr次元多次元時系列信号に線形変換し、ばらつき最大となる軸を生成するものである。KL変換でも構わない。次元数rは、主成分分析により求めた固有値を降順に並べ、大きい方から加算した固有値を全固有値の和で割り算した累積寄与率なる値に基づいて決める。
独立成分分析は、ICAと呼ばれ、非ガウス分布を顕在化する手法として効果がある。非負行列因子分解は、NMFと呼ばれ、行列で与えられるセンサ信号を、非負の成分に分解する。教師なしとしたものは、本実施例のように、異常事例が少なく、活用できない場合に、有効な変換手法である。ここでは、線形変換の例を示した。非線形の変換も適用可能である。
上述した特徴変換は、標準偏差で正規化する正準化なども含め、学習データと観測データを並べて同時に実施する。このようにすれば、学習データと観測データを同列に扱うことができる。このような特徴変換により、センサ信号を変換するため、事例ベースに基づく異常検知では、設計者にとって、あるいはサービス要員にとって分かりづらい。他のセンサ信号との絡みがあり、独立・個別でないため、現象を理解しづらいのである。一方で、正常データから見て、はずれ値を抽出するため、感度が良いという大きなメリットがある。
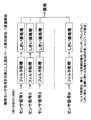
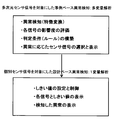
図5は、本発明の異常検知方法を示す。上段が、図2に示した、個別センサ信号に対する設計ベースの異常検知であり、下段が図3に示した、多次元センサ信号の多変量解析による事例ベースに基づく異常検知である。事例ベースに基づく異常検知が、設計ベースの異常検知を制御する構成になっている。多変量解析による事例ベースに基づく異常検知は、イベントデータも入力している。センサ信号のモード分解などを行っている。クラスタリングは、センサデータのクラスタへの分解である。ポイントは、下記である。
1)多次元センサ信号の多変量解析による事例ベースに基づく異常検知が、各種異常に応じて、センサ信号の選択としきい値設定を行う。具体的には、異常検知(特徴変換)、各信号の影響度の評価、異常の種類毎の判定条件(ルール)の構築、異常に応じたセンサ信号の選択と表示を行う。
2)個別センサ信号に対する設計ベースの異常検知は、上記を受けて、異常検知を行う。具体的には、しきい値の設定と制御、しきい値表示、異常検知と表示を行う。
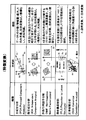
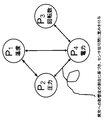
図6に、本発明の基本となる考え方をまとめる。以下、これらの考え方と動作をさらに説明する。
図7に、設計ベースの異常検知のセンサ信号の一例と、設定しきい値、異常検知結果を示す。しきい値は、設計者が与えている。センサ信号としきい値が1対1なので、理解しやすいことが分かる。異常検知の時期としては、若干遅いようである。もう少し早い検知ができると、予防保全になり、故障を引き起こす部品の早期交換なども可能となる。しきい値が適切でない理由は、例えば、設備の稼動環境や、稼動年数による状態変化、運転条件、部品交換の影響などが設計者の想定範囲外にあることによる。
次に、事例ベースに基づく異常検知を説明する。図8に事例ベースに基づく異常検知手法を示す。この異常検知において、11は多次元時系列信号取得部、12は特徴抽出/選択/変換部、13は識別器、14は統合(グローバル異常測度)、15は主に正常事例からなる学習データを示している。
多次元時系列信号取得部11から入力された多次元時系列信号は、特徴抽出/選択/変換部12で次元が削減され、複数の識別器13により識別され、統合(グローバル異常測度)14によりグローバル異常測度が判定される。主に正常事例からなる学習データ15も複数の識別器13により識別されて、グローバル異常測度の判定に用いられると共に、主に正常事例からなる学習データ15自体も取捨選択され、蓄積・更新が行われて精度の向上が図られる。
図8には、ユーザがパラメータを入力する操作PCも図示している。ユーザ入力のパラメータは、データのサンプリング間隔、観測データの選択、異常判定のしきい値などである。データのサンプリング間隔は、例えば、何秒おきにデータを取得するかを指示するものである。観測データの選択は、センサ信号のどれをおもに使うかを指示するものである。異常判定のしきい値は、算出した、モデルからの偏差・逸脱、はずれ値、乖離度、異常測度などと表現した、異常らしさの値を2値化するしきい値である。
図8に示される複数の識別器13はいくつかの識別器(h1、h2、・・・)を準備し、それらの多数決をとる(統合14)ことが可能である。即ち、異なる識別器群(h1、h2、・・・)を用いたアンサンブル(集団)学習が適用できる。例えば、第一の識別器は投影距離法、第二の識別器は局所部分空間法、第三の識別器は線形回帰法と言ったものである。事例データに基づくものならば、任意の識別器が適用可能である。
図9が、事例ベースに基づく異常検知の結果の一例を示す。センサ信号は、図7に示したものと同一であるが、多次元時系列センサ信号を対象にした多変量解析により算出した異常測度を表示している。異常測度は、後で説明する図15にて求められる。この例によれば、異常の検知時期は、設計ベースの異常検知時期より、かなり早い。
しかしながら、異常発報の根拠は不明瞭である。このため、図9では、センサ信号における異常への影響度を表している。平均的な値よりはずれていれば、その信号が異常をあらわしていることになる。同図では、下から三番目の信号が、異常をあらわしていることになる。このように個別に見れば、どのセンサが異常と関係があるかが分かる。ただし、複数のセンサ信号が異常を表すことの方が多いため、解析には多少負荷がかかることがある。
図10は、図8において、しきい値を制御して、異常検知を早めた例である。この場合、適切な異常検知になったと言える。しかし、しきい値の設定が、マニュアルであり、人為的であり、設定根拠が不明瞭である。
図11は、事例ベースに基づく異常検知の結果を利用し、センサ信号における異常への影響度を使って、センサ信号を選択し、次に、しきい値を制御して、異常を検知したものである。設備の稼動環境や、稼動年数による状態変化、運転条件、部品交換の影響なども反映されており、しきい値の設定根拠も与えられた。異常の視認性も向上している。
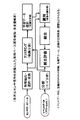
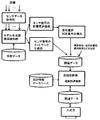
図12、図13に、上記動作のフローを示す。図12において、観測データ、学習データ、イベント解析の結果を用いて、まず観測データと学習データの乖離度(類似度)を算出する。イベントデータ(アラーム情報など)は、例えば、学習データの選択に用いる。次に、観測データと学習データの乖離度(類似度)に基づき、異常の有無を判定する(しきい値は外部~設定する)。同時に、異常の影響度を算出する。
ここでは、各クラスにおけるk近傍データの平均と観測データの距離を用いて観測データの識別を行う(LAC法と呼ばれる)。これにより、図9の下段のグラフが得られる。つぎに、各種異常と異常の影響度に基づき、該当するセンサ信号の選択を行う。場合によっては、各種異常と異常の影響度をデータベースとして蓄積することが必要になる。そして、異常の検知結果は、もとの各センサ信号に対するしきい値の制御に使われる。すなわち、ほぼ同じ感度になるように、しきい値が制御される。
これにより、図11に示したグラフが得られる。見逃しがないように感度を設定すると、誤検出が発生する恐れがあるが、ここではこれをOKとする。選択された複数のセンサ信号に対して、同様のしきい値設定を行う。このとき、選択された複数のセンサ信号の異常検知の多数決や論理積により、極力、誤検出が発生しないよう、しきい値を決める。そして、これらを表示し、異常検知結果も表示する。選択された複数のセンサ信号の異常検知の多数決や論理積などの論理が、判定条件(ルール)になる。
判定条件;選択されたセンサ信号のしきい値処理結果の多数決や論理積などの条件
各センサ信号は、冷却水の温度や圧力、発電電流、発電電圧など具体的な物理量を表しているため、各センサ信号に対してしきい値が設定できると、異常に至る物理限界などが、設計者にとって理解しやすく、また異常現象も視覚的に捉えやすく、設備の動作原理や物理現象との対応をとりやすいという大きなメリットがある。個別センサ信号に対して得られた判定条件(ルール)は、外部表示、または出力される。
各センサ信号は、冷却水の温度や圧力、発電電流、発電電圧など具体的な物理量を表しているため、各センサ信号に対してしきい値が設定できると、異常に至る物理限界などが、設計者にとって理解しやすく、また異常現象も視覚的に捉えやすく、設備の動作原理や物理現象との対応をとりやすいという大きなメリットがある。個別センサ信号に対して得られた判定条件(ルール)は、外部表示、または出力される。
また、図11に示した異常検知結果もモニタなどに表示される。なお、多変量解析による事例ベースの異常検知では、複数のセンサ信号の線形結合などによって表されることが多い。この場合、冷却水温度と発電電流の線形結合であったりすると、その解釈が難しい。もちろん、後で述べるように、センサ信号間のつながりが分かり、ネットワークを構成できるという大きなメリットがあるが、保守エンジニアや顧客の直接理解とは隔たりがあるのも事実である。従って、いかに個別センサ信号の変動として、簡単に事象をとらえることができるか、あるいは、少ないセンサ信号の組み合わせで、事象を説明できるかという点で、上記判定条件の導出、明確化は重要なものとなる。
多次元センサ信号を対象とした多変量解析による事例ベースの異常検知は、常時連動(同期)させる必要もなく、データサンプリングと非同期で行うことができ、逆に言うと、データ量に対し、演算負荷が大きく、データサンプリング時間に比べ、異常検知の処理時間を要する、複雑な異常検知手法も搭載適用できることになり、異常検知の感度がさらに向上できる。1ms周期といった速いサンプリングの場合、非同期化が重要となる。逆に、1日単位の異常検知でよく処理速度を要求しない劣化形の異常の場合は、同期化しても問題ない。
図13には、選択されたセンサ信号の例を示す。さらに、選択された各センサ信号S1,S2,S3,S4などに対し、しきい値th1_l, th1_u, th2_l, th2_u, th3_u, th4_lなどを設定する。この例では、選択された各センサ信号のしきい値処理結果(2値論理)の論理積により、異常を検知している。これらが、異常検知の判定条件(ルール)になる。しきい値th1_l, th1_u, th2_l, th2_u, th3_u, th4_lは、多変量解析による異常検知と同じ検知能力に近づける。完全には一致しないが、見逃しをしないように設定することが可能である。
th1_l<S1<th1_u and th2_l<S2<th2_u and S3<th3_u and th4_l<S4
th1_l<S1<th1_u and th2_l<S2<th2_u and S3<th3_u and th4_l<S4
以上説明したように、異常検知の高感度化、視認性向上、解釈容易化などが図られるが、異常の種類に応じた対応が課題になる。すなわち、異常の種類に応じて、選択された複数のセンサ信号は異なるものになる可能性が高い。従って、過去事例に基づき、異常の種類ごとに、センサ信号の選択と設定したしきい値を、データベースに蓄え、これらを使うこともあり得る。この場合、複数の選択と複数のしきい値が指示される。このような異常事例、センサ信号の影響度、選択結果などからなるデータベースは、異常診断においても有効な判断材料として使われることになる。
図14に、影響度の評価の別の例を示す。図14においては、信号Aに変動があり、異常の予兆が発生している。しかし、他のセンサ信号、例えばBにも変動が見られる。多変量解析によれば、信号Bの影響度も大きいと判断されたのである。しかし、信号のスケールの違い(標準偏差で正規化する正準化を施しても信号のスケールがきちっと一致することは少ない。なぜなら、ON状態とOFF状態が混在し、これによりON状態の変動の正規化などは困難になっている。
最低でもON状態とOFF状態を区別する必要があるが、過渡期の扱いは依然として不明瞭である)、学習データがすべてのケースを網羅している訳でもないという網羅性の問題があり、図14の場合は、信号Bの影響度は実は大きくない。このような場合、設計情報をもとにすれば、信号Bは変動が大きくても問題ないなどの判断が可能である。したがって、センサ信号の選択を設計情報も加味して実施できる。具体的には、設計情報も活用し、補正係数を設定し、影響度に補正係数をかけて、信号を選択する。
係数も加味して選択されたセンサ信号は、異常発生時に結びつきが強いことを表しており、有用な情報である。これらを事例ごとに集めれば、対象設備のモデル化ができる。図18に、得られた、各センサ信号の異常への影響度の情報から、各センサ信号のネットワークを作成した例を示す。基本的な温度、圧力、電力などのセンサ信号に関して、異常への影響度の割合に基づき、センサ信号間に重みを付与できる。こういった関連性ネットワークができると、設計者が意図しない信号間の連動性、共起性、相関性などが明示でき、異常の診断時にも有用である。ネットワークの生成は、各センサ信号の異常への影響度のほか、相関、類似度、距離、因果関係、位相の進み/遅れなどの尺度で、これを生成することができる。
対象設備のモデル;選択されたセンサ信号のネットワークについて、図15に一般的なCLAFIC法を図解して示す。モデルからの偏差を求めるものである。2クラス、2次元パターンの場合を示す。各クラスの部分空間、即ち、ここでは1次元の直線として表される部分空間を求める。
一般的には、各クラスのデータの自己相関行列を固有値分解して、固有ベクトルを基底として求める。値が大きい、上位何個かの固有値に対応する固有ベクトルを用いる。未知パターンq(最新の観測パターン)が入力されると、部分空間への正射影の長さ、或いは部分空間への投影距離を求める。そして、正射影の長さが最大、或いは投影距離が短いクラスに、未知パターン(最新の観測パターン)qを分類する。
図15では未知パターンq(最新の観測パターン)は、クラスAに分類される。図1に
示した多次元時系列信号では、基本的に正常部を対象とするため、1クラス識別の問題になるので、クラスAを正常部とし、未知パターンq(最新の観測パターン)からクラスAまでの距離を求めて、これを偏差とする。そして、偏差が大きいと、はずれ値と判断する。このような部分空間法では、異常値が若干混ざっていても、次元削減し、部分空間にした時点で、その影響が緩和される。部分空間法適用のメリットである。
示した多次元時系列信号では、基本的に正常部を対象とするため、1クラス識別の問題になるので、クラスAを正常部とし、未知パターンq(最新の観測パターン)からクラスAまでの距離を求めて、これを偏差とする。そして、偏差が大きいと、はずれ値と判断する。このような部分空間法では、異常値が若干混ざっていても、次元削減し、部分空間にした時点で、その影響が緩和される。部分空間法適用のメリットである。
なお、投影距離法では、各クラスの重心を原点とする。各クラスの共分散行列にKL展開を適用して得られた固有ベクトルを基底として用いる。いろいろな部分空間法が立案されているが、距離尺度を有するものならば、はずれ度合いが算出可能である。なお、密度の場合も、その大小により、はずれ度合いを判断可能である。CLAFIC法は、正射影の長さを求めることから、類似度尺度である。
このように、部分空間にて距離や類似度を計算し、はずれ度合いを評価することになる。投影距離法などの部分空間法は、距離に基づく識別器のため、異常データが利用できる場合の学習法として、辞書パターンを更新するベクトル量子化や距離関数を学習するメトリック学習を使うことができる。
また、局所部分空間法と呼ぶ、未知パターンq(最新の観測パターン)に近いk個の多次元時系列信号を求め、各クラスの最近傍パターンが原点となるような線形多様体を生成し、その線形多様体への投影距離が最小となるクラスに未知パターンを分類する方法も適用できる(図8の局所部分空間法の枠内参照)。局所部分空間法も部分空間法の一種である。
kは、パラメータである。異常検知では、先ほどと同様に、1クラス識別の問題になるので、大多数のデータが属するクラスAを正常部とし、未知パターンq(最新の観測パターン)からクラスAまでの距離を求めて、これを偏差とする。
この手法では、例えば、k個の多次元時系列信号を用いて形成される部分空間への、未知パターンq(最新の観測パターン)からの正射影した点を推定値として算出することもできる(図8の局所部分空間法の枠内に説明した推定値なるデータ)。また、k個の多次元時系列信号を、未知パターンq(最新の観測パターン)に近い順に並べ替え、その距離に反比例した重み付けを行って、各信号の推定値を算出することもできる。投影距離法などでも、同様に推定値を算出できる。
パラメータkは通常は1種類に定めるが、パラメータkをいくつか変えて実行すると、類似度に応じて対象データを選択することになり、それらの結果から総合的な判断となるため、一層効果的である。さらには、正常部は設備のON/OFFなどの過渡期を含む多様な状態なため、観測データ入力ごとに、観測データからの距離に基づき観測データと類似する学習データを逐次選択することにした。また、学習データを最低個数から選択個数まで順次増やして投影距離が最小になるものを選んでもよい。これは、投影距離法にも適用できる。この場合は、図8に示したクラスタリングが不要になる。
局所部分空間法では、異常値が若干混ざっていても、局所部分空間にした時点で、その影響が大きく緩和される。
局所部分空間法では、異常値が若干混ざっていても、局所部分空間にした時点で、その影響が大きく緩和される。
未知パターンq(最新の観測パターン)に近いk個の多次元時系列信号を求め、k個のうち最も多くが属すクラスタが、未知パターンqが属すクラスタであると判定し、このクラスタが属す学習データを対象に、再度、未知パターンqに近いL個の多次元時系列信号を求め、これを用いて局所部分空間法を適用することもできる。
なお、単に、1クラス識別の問題と考えれば、1クラスサポートベクターマシンなどの識別器も適用可能である。この場合、高次空間に写像する、radial basis functionなどのカーネル化が使えることになる。1クラスサポートベクターマシンでは、原点に近い側が、はずれ値、即ち異常になる。ただし、サポートベクターマシンは、特徴量の次元は大きくても対応できるが、学習データ数が増えると計算量が膨大となるという欠点もある。
このため、MIRU2007(画像の認識・理解シンポジウム、Meeting on Image Recognition and Understanding 2007)にて発表されている、「IS-2-10 加藤丈和,野口真身,和田俊和(和歌山大),酒井薫,前田俊二(日立);パターンの近接性に基づく1クラス識別器」などの手法も適用可能であり、この場合、学習データ数が増えても、計算量は膨大なものとならないというメリットがある。
このように、低次元モデルで多次元時系列信号を表現することにより、複雑な状態を分解でき、簡単なモデルで表現できるため、現象を理解しやすいという利点がある。また、モデルを設定するため、SmartSignal社の方法のように完全に、データを完備する必要はない。データの欠落があっても良いというメリットがある。
図16に、本発明の異常検知システムのハードウェア構成を示す。異常検知を実行するプロセッサ119に、対象とするエンジンなどのセンサデータを入力し、欠損値の修復などを行って、データベースDB121に格納する。プロセッサ119は、取得した観測センサデータ、学習データからなるDBデータを用いて、異常検知を行う。表示部120では、各種表示を行い、異常信号の有無や、後述する異常説明のメッセージを出力する。トレンドを表示することも可能とする。イベントの解釈結果も表示可能とする。
上記ハードウェアとは別に、これに搭載するプログラムを、メディア媒体やオンラインサービスにより顧客に提供することもできる。
上記ハードウェアとは別に、これに搭載するプログラムを、メディア媒体やオンラインサービスにより顧客に提供することもできる。
データベースDB121は、熟練エンジニアらがDBを操作できる。特に、異常事例や対策事例を教示でき、格納できる。(1)学習データ(正常)、(2)異常データ、(3)対策内容が、格納される。データベースDBを、熟練エンジニアらが手を加えられる構造にすることにより、洗練された、有用なデータベースができあがることになる。また、データ操作は、学習データ(個々のデータや重心位置など)を、アラームの発生や部品交換に伴い、自動的に移動させることにより行う。また、取得データを自動的に追加することも可能である。異常データがあれば、データの移動に、一般化ベクトル量子化などの手法も適用できる。
図17に、異常検知、及び異常検知後の診断を示す。図17において、設備からの時系列信号から、時系列信号の特徴抽出・分類24により、異常を検知する。設備は、1台のみとは限らない。複数台の設備を対象にしてもよい。同時に、各設備の保守のイベント(アラームや作業実績など。具体的には、設備の起動、停止、運転条件設定、各種故障情報、各種警告情報、定期点検情報、設置温度などの運転環境、運転累積時間、部品交換情報、調整情報、清掃情報など)などの付帯情報を取り込み、異常を高感度に検知する。
同図に示すように、予兆検知25により早期に予兆として発見できれば、故障となって稼動停止となる前に、何らかの対策がうてることになる。そして、部分空間法などにより予兆検知し、イベント列照合なども加えて総合的に予兆かどうか判断し、この予兆に基づき、異常診断を行い、故障候補の部品の特定やいつ当該部品が故障停止に至るかなどを推測する。そして、必要な部品の手配を、必要なタイミングで行う。
異常診断26は、予兆を内包しているセンサを特定する現象診断と、故障を引き起こす可能性のあるパーツを特定する原因診断に分けると考えやすい。異常検知部では、異常診断部に対して、異常の有無という信号のほか、特徴量に関する情報を出力する。異常診断部は、これらの情報をもとに診断を行う。
図19に異常検知、原因診断の部分に関して、さらにその構成を示す。図19において、複数のセンサからデータを取得するセンサデータ取得部、ほぼ正常データからなる学習データ、学習データをモデル化するモデル生成部、観測データとモデル化した学習データの類似度により観測データの異常の有無を検知する異常検知部、各信号の影響度を評価するセンサ信号の影響度評価部、各センサ信号の関連性を表すネットワーク図を作成するセンサ信号ネットワーク生成部、異常事例、各センサ信号の影響度、選択結果などからなる関連データベース、設備の設計情報からなら設計情報データベース、原因診断部、診断結果を格納する関連データベース、および入出力からなる。
設計情報データベースには、設計情報以外の情報も含み、エンジンを例にとると、年式、モデル、図21に示すコンポーネント、部品表(BOM)、過去の保守情報(オンコール内容、異常発生時のセンサ信号データ、調整日時、撮像画像データ、異音情報、交換部品情報など)、原因診断ツリー(設計者が作成した簡易ツリー。症例により枝分かれして、交換を要するユニットや部品を特定する)、稼動状況情報、輸送・据付時の検査データなどを含む。図20に示したコンポーネントは、電気部品のブロックに関する情報である。
この構成の特徴は、各センサ信号の関連性を表すネットワークを用いて、これとコンポーネント情報を結びつけ、原因診断支援を図るものである。センサ信号の影響度から生成される各センサ信号の関連性を表すネットワークが、原因診断の知識材料となる。診断では、複数の事例の中の現象、部位、処置を表す要素(曖昧な表現)間の連結性に基づき、現象が発生した時、対策処置の可能性リストを提示する。具体的には、例えば、医療用機器の例では、画像にゴーストが発生するといった現象に対し、各センサ信号の関連性を表すネットワークを用いて、コンポーネント要素であるケーブルと結びつけ、ケーブルシールド処理を対策処置の可能性リストのひとつとして提示する。
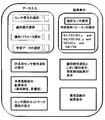
図21に、グラフィカルユーザインターフェース(GUI)の一例を示す。単調に変化するセンサ信号や分散の小さいセンサ信号を除くためのセンサ信号の選択、多変量解析に用いる識別器の選択(局所部分空間法や投影距離法など)、識別器の識別パラメータの選択、季節変動などに応じて季節ごとに準備した複数学習データの選択などに関して、ユーザが必要な項目を入力する。実行後に、多変量解析の結果である異常測度や各センサ信号の影響度の評価結果などが表示される。また同時に、各センサ信号のネットワーク関係が図示される(図18に示した一例が表示される)。
多変量解析の結果から、異常に応じて、着目し選択すべきセンサ信号を選び、その選択結果を表示する。また、個別センサ信号に対する判定条件(ルール)を表示する。この判定条件に基づき、個別信号波形としきい値の表示、選択した信号波形に対する異常検知結果の表示を行う。最後に、異常の診断結果も表示する。
図22は偏差時系列パターンによる異常発生の予兆検知技術の説明図である。図22の(a)は、偏差時系列パターンの類似度算出の手法を示しており、図22の(b)は、図22の(a)に対応した観測データの偏差信号を示している。
図22の(a)の空間の「0」点は、図8に示す局所部分空間法により求めた各観測データの正常重心に対応し、各時点でのセンサ信号Aとセンサ信号Bとセンサ信号Cの正常重心からの偏差が空間内の軌跡として表現されている。図22の(a)では、時刻t-1、時刻t、時刻t+1を経過する観測データの偏差系列が矢印のついた点線で示されている。
観測データ及び異常事例それぞれの類似度は、それぞれの偏差の内積(A・B)を算出して推定することができる。また、内積(A・B)を大きさ(ノルム)で割って、角度θで類似度を推定することも可能である。
観測データの偏差時系列パターンに対して類似度を求め、その軌跡により、発生すると予測される異常を推測する。具体的には、図22の(a)には、異常事例Aの偏差、異常事例Bの偏差、異常事例Cの偏差が示されている。矢印のついた点線で示されている観測データの偏差系列パターンを見ると、時刻tでは異常事例Bに近いが、その軌跡からは、異常事例Bではなく、異常事例Aの発生を予測することができる。
異常事例を予測するために、異常事例が発生するまでの偏差時系列の軌跡データをデータベース化しておき、観測データの偏差時系列パターンと軌跡データベースに蓄積された軌跡データの時系列パターンの類似度を算出して異常発生の予兆を検知することができる。
また、複合事象の異常事例の場合には、複合事象の各事象毎のベクトル加算演算を行うことにより、複合事象の異常発生の予兆を検知することができる(未発生複合事象の模擬)。
図22の(b)は、図22の(a)のセンサ信号A、B,C等に対応した複数の観測データの偏差信号の時間的推移を示している。図22の(b)上部の11/17の時刻で、例えば、ジャケット水圧が低下するといった異常事態が発生するが、時刻t-1,t,t+1において観測データの偏差信号を検出し、軌跡データベースに蓄積された軌跡データの時系列パターンの類似度を算出して、特定の異常発生の予兆を検知することができる。
上述したいくつかの実施例に関する総合的効果をさらに補足する。たとえば、発電設備を所有している会社では、機器の保守費用削減を希望しており、保証期間中に機器を点検、部品交換を実施している。これは時間ベースの設備保全と言われている。
しかし、最近は機器の状態を見て、部品交換を実施する状態ベースの保全に移行しつつある。状態保全を実施するには、機器の正常・異常データを収集する必要があり、このデータの量、質が状態保全の品質を決めてしまう。しかし、異常データの収集は、まれなケースも多く、大型の設備になるほど、異常データを収集することは困難である。従って、正常データから、はずれ値を検出することが重要となる。上述したいくつかの実施例によれば、
(1)正常データから、異常を検知できる、
(2)データ収集が不完全でも精度の高い異常検知が可能となる、
(3)異常データが包含されていても、この影響を許容できる、
といった直接的効果に加え、
(4)ユーザにとって、異常現象を視覚的に捉えやすく、現象を理解しやすい、
(5)設計者にとって、異常現象を視覚的に捉えやすく、物理現象との対応をとりやすい、
(6)エンジニアの知識を活用できる
(7)物理モデルも併用できる、
(8)演算負荷が大きく、処理時間を要する異常検知手法も搭載適用できる
と言った副次的な効果がある。
(2)データ収集が不完全でも精度の高い異常検知が可能となる、
(3)異常データが包含されていても、この影響を許容できる、
といった直接的効果に加え、
(4)ユーザにとって、異常現象を視覚的に捉えやすく、現象を理解しやすい、
(5)設計者にとって、異常現象を視覚的に捉えやすく、物理現象との対応をとりやすい、
(6)エンジニアの知識を活用できる
(7)物理モデルも併用できる、
(8)演算負荷が大きく、処理時間を要する異常検知手法も搭載適用できる
と言った副次的な効果がある。
本発明は、プラント、設備の異常検知として利用することが出来る。
11 多次元時系列信号取得部
12 特徴抽出/選択/変換部
13 識別器
14 統合(グローバル異常測度)
15 主に正常事例からなる学習データデータベース
24 時系列信号の特徴抽出・分類
25 予兆検知
26 異常診断
119 プロセッサ
120 表示部
121 データベース(DB)
12 特徴抽出/選択/変換部
13 識別器
14 統合(グローバル異常測度)
15 主に正常事例からなる学習データデータベース
24 時系列信号の特徴抽出・分類
25 予兆検知
26 異常診断
119 プロセッサ
120 表示部
121 データベース(DB)
Claims (23)
- プラントまたは設備の異常を早期に検知する異常検知方法であって、
複数のセンサから観測データを取得し、正常データからなる学習データをモデル化し、
前記観測データとモデル化した前記学習データとの類似度により観測データの異常の有無を検知し、
各センサ信号の影響度の評価、判定条件ルールの構築、異常に応じたセンサ信号の選択と表示を行うことを特徴とする異常検知方法。 - プラントまたは設備の異常を早期に検知する異常検知方法であって、
複数のセンサから観測データを取得し、正常データからなる学習データをモデル化し、
前記観測データとモデル化した前記学習データとの類似度により観測データの異常の有無を検知し、
各センサ信号の影響度の評価結果を、異常事例と共に蓄積し、この蓄積データに基づいて、個別センサ信号に対して、判定条件ルールの構築、異常に応じたセンサ信号の選択と表示を行い、しきい値の設定を行って、これに基づき異常検知を行うことを特徴とする異常検知方法。 - プラントまたは設備の異常を早期に検知する異常検知方法であって、
複数のセンサから観測データを取得し、
学習データを部分空間法でモデル化し、
観測データと部分空間の距離関係に基づき、異常を検知することを特徴とする請求項1乃至請求項2記載の異常検知方法。 - 請求項3記載の異常検知方法において、
前記部分空間法は、投影距離法、CLAFIC法、観測データの近傍を対象とする局所部分空間法であることを特徴とする異常検知方法。 - 請求項2記載の異常検知方法において、観測データと学習データの類似度により観測データの異常の有無を検知する頻度は、データ収集とは非同期に行うことを特徴とする異常検知方法。
- 請求項2記載の異常検知方法において、個別センサ信号に対して得られた判定条件(ルール)を外部表示、または出力することを特徴とする異常検知方法。
- プラントまたは設備の異常を早期に検知する異常検知方法であって、
複数のセンサから観測データを取得し、正常データからなる学習データをモデル化し、
前記観測データとモデル化した前記学習データとの類似度により観測データの異常の有無を検知し、各センサ信号の影響度を評価することにより、各センサ信号の関連性ネットワーク図を作成し、対象設備のモデル化を行うことを特徴とする異常検知方法。 - 請求項7記載の異常検知方法において、各センサ信号の関連性ネットワーク図を異常の原因診断に使うことを特徴とする異常検知方法。
- プラントまたは設備の異常を早期に検知する異常検知方法であって、
複数のセンサから観測データを取得し、正常データからなる学習データをモデル化し、
前記観測データとモデル化した前記学習データとの類似度により観測データの異常の有無を検知し、異常事例、各センサ信号の影響度、選択結果などからなるデータを記憶するデータベースを備え、前記データを異常診断に使うことを特徴とする異常検知方法。 - プラントまたは設備の異常を早期に検知し、診断する異常検知・診断方法であって、
複数のセンサから観測データを取得し、正常データからなる学習データをモデル化し、
前記観測データとモデル化した前記学習データとの類似度により観測データの異常の有無を検知し、異常事例、各センサ信号の影響度、選択結果などからなるデータを記憶積するデータベースを備え、複数の事例の中の現象、部位、処置を表す要素間の連結性に基づき、新たな異常に関する現象が発生した時、対策処置の可能性リストを提示することを特徴とする異常検知・診断方法。 - プラントまたは設備の異常を早期に検知する異常検知システムであって、
複数のセンサから観測データを取得するセンサデータ取得部と、正常データからなる学習データをモデル化するモデル生成部と、前記観測データとモデル化した前記学習データとの類似度により観測データの異常の有無を検知する異常検知部と、各センサ信号の影響度の評価、判定条件ルールの構築、異常に応じたセンサ信号の選択と表示を行う判定条件生成部とからなり、
前記複数のセンサから観測データを取得し、正常データからなる学習データをモデル化し、前記観測データとモデル化した前記学習データの類似度により観測データの異常の有無を検知し、各センサ信号の影響度の評価、判定条件ルールの構築、異常に応じたセンサ信号の選択と表示を行うことを特徴とする異常検知システム。 - プラントまたは設備の異常を早期に検知する異常検知システムであって、
複数のセンサから観測データを取得するセンサデータ取得部と、正常データからなる学習データをモデル化するモデル生成部と、前記観測データとモデル化した前記学習データとの類似度により観測データの異常の有無を検知する異常検知部と、各センサ信号の影響度の評価結果と異常事例を記憶するデータ蓄積部と、判定条件ルールの構築、異常に応じたセンサ信号の選択と表示を行う判定条件生成部とからなり、
前記複数のセンサからデータを取得し、正常データからなる前記学習データをモデル化し、前記観測データとモデル化した前記学習データとの類似度により観測データの異常の有無を検知し、各センサ信号の影響度の評価結果を、異常事例とともに蓄積し、この蓄積データに基づいて、個別センサ信号に対して、判定条件ルールの構築、異常に応じたセンサ信号の選択と表示を行い、しきい値の設定を行って、これに基づき異常検知を行うことを特徴とする異常検知システム。 - プラントまたは設備の異常を早期に検知する異常検知システムであって、
複数のセンサから観測データを取得するセンサデータ取得部と、学習データを部分空間法でモデル化するモデル生成部、観測データと部分空間の距離関係に基づき、異常を検知する異常検知部とからなり、
複数のセンサから観測データを取得し、
学習データを部分空間法でモデル化し、
観測データと部分空間の距離関係に基づき、異常を検知することを特徴とする請求項11乃至請求項12記載の異常検知システム。 - 請求項13記載の異常検知システムにおいて、
前記部分空間法は、投影距離法、CLAFIC法、観測データの近傍を対象とする局所部分空間法であることを特徴とする異常検知システム。 - 請求項12記載の異常検知システムにおいて、観測データと学習データの類似度により観測データの異常の有無を検知する頻度は、データ収集とは非同期に行うことを特徴とする異常検知システム。
- 請求項12記載の異常検知システムにおいて、個別センサ信号に対して得られた判定条件ルールを外部表示、または出力することを特徴とする異常検知システム。
- プラントまたは設備の異常を早期に検知する異常検知システムであって、
複数のセンサから観測データを取得するセンサデータ取得部と、正常データからなる学習データをモデル化するモデル生成部と、前記観測データとモデル化した前記学習データの類似度により観測データの異常の有無を検知する異常検知部と、各センサ信号の影響度を評価する影響度評価部、各センサ信号の関連性ネットワーク図を作成するネットワーク生成部とからなり、
前記複数のセンサから観測データを取得し、正常データからなる学習データをモデル化し、前記観測データとモデル化した前記学習データとの類似度により観測データの異常の有無を検知し、各センサ信号の影響度の評価することにより、各センサ信号の関連性ネットワーク図を作成し、対象設備のモデル化を行うことを特徴とする異常検知システム。 - 請求項17記載の異常検知システムにおいて、各センサ信号の関連性ネットワーク図を異常の原因診断に使うことを特徴とする異常検知システム。
- プラントまたは設備の異常を早期に検知する異常検知システムであって、
複数のセンサから観測データを取得するセンサデータ取得部と、正常データからなる学習データをモデル化するモデル生成部と、前記観測データとモデル化した前記学習データとの類似度により観測データの異常の有無を検知する異常検知部と、各センサ信号の影響度を評価する影響度評価部と、各センサ信号の関連性ネットワーク図を作成するネットワーク生成部と、異常事例、各センサ信号の影響度、選択結果などからなるデータを蓄積するデータベースとを備え、
複数のセンサから観測データを取得し、正常データからなる学習データをモデル化し、前記観測データとモデル化した前記学習データとの類似度により観測データの異常の有無を検知し、これらを、異常事例、各センサ信号の影響度、選択結果などからなるデータをデータベースに記憶し、このデータを異常診断に使うことを特徴とする異常検知システム。 - プラントまたは設備の異常を早期に検知・診断する異常検知・診断システムであって、
複数のセンサから観測データを取得するセンサデータ取得部と、正常データからなる学習データをモデル化するモデル生成部と、前記観測データとモデル化した前記学習データとの類似度により観測データの異常の有無を検知する異常検知部と、各センサ信号の影響度を評価する影響度評価部と、各センサ信号の関連性ネットワーク図を作成するネットワーク生成部と、異常事例、各センサ信号の影響度、選択結果などからなるデータを記憶するデータベースと、複数の事例の中の現象、部位、処置を表す要素間の連結性を評価する連結性評価部とを備え、
複数のセンサから観測データを取得し、正常データからなる学習データをモデル化し、前記観測データとモデル化した前記学習データとの類似度により観測データの異常の有無を検知し、
これらを、異常事例、各センサ信号の影響度、選択結果などからなるデータを前記データベースに記憶し、
複数の事例の中の現象、部位、処置などを表す要素間の連結性に基づき、新たな異常に関する現象が発生した時、対策処置の可能性リストを提示することを特徴とする異常検知・診断システム。 - プラントまたは設備の異常を早期に検知する異常検知プログラムであって、
複数のセンサから取得した、ほぼ正常データからなる学習データを対象にモデル化し、観測データとモデル化した学習データの類似度を算出することにより観測データの異常の有無を検知し、各信号の影響度の評価結果を、異常事例とともに蓄積し、この蓄積データに基づいて、個別センサ信号に対して、判定条件ルールの構築、異常に応じたセンサ信号の選択と表示を行い、しきい値の設定を行って、これに基づき異常検知を行う手順をコンピュータに実行させることを特徴とする異常検知プログラム。 - プラントまたは設備の異常を早期に検知する異常検知プログラムであって、
複数のセンサから取得した、ほぼ正常データからなる学習データを対象にモデル化し、観測データとモデル化した学習データの類似度を算出することにより観測データの異常の有無を検知し、各信号の影響度の評価結果を、異常事例とともに蓄積し、この蓄積データに基づいて、個別センサ信号に対して、判定条件(ルール)の構築、異常に応じたセンサ信号の選択と表示を行い、しきい値の設定を行って、これに基づき異常検知を行うプログラムを、メディア媒体やオンラインサービスにより提供する手順をコンピュータに実行させることを特徴とする異常検知プログラム。 - プラントまたは設備の異常を早期に検知する異常検知方法であって、
複数のセンサから取得した、ほぼ正常データからなる学習データと、観測データを並べて同時に特徴変換することを特徴とする請求項2記載の異常検知方法。
Priority Applications (2)
| Application Number | Priority Date | Filing Date | Title |
|---|---|---|---|
| EP10813558.3A EP2477086A4 (en) | 2009-09-07 | 2010-06-16 | METHOD FOR ANOMALY IDENTIFICATION AND DIAGNOSIS, APPARATUS FOR ANOMALY IDENTIFICATION AND DIAGNOSIS, AND ANOMALIC DETECTION AND DIAGNOSTIC PROGRAM |
| US13/384,463 US9483049B2 (en) | 2009-09-07 | 2010-06-16 | Anomaly detection and diagnosis/prognosis method, anomaly detection and diagnosis/prognosis system, and anomaly detection and diagnosis/prognosis program |
Applications Claiming Priority (2)
| Application Number | Priority Date | Filing Date | Title |
|---|---|---|---|
| JP2009206103A JP5363927B2 (ja) | 2009-09-07 | 2009-09-07 | 異常検知・診断方法、異常検知・診断システム、及び異常検知・診断プログラム |
| JP2009-206103 | 2009-09-07 |
Publications (1)
| Publication Number | Publication Date |
|---|---|
| WO2011027607A1 true WO2011027607A1 (ja) | 2011-03-10 |
Family
ID=43649157
Family Applications (1)
| Application Number | Title | Priority Date | Filing Date |
|---|---|---|---|
| PCT/JP2010/060232 Ceased WO2011027607A1 (ja) | 2009-09-07 | 2010-06-16 | 異常検知・診断方法、異常検知・診断システム、及び異常検知・診断プログラム |
Country Status (4)
| Country | Link |
|---|---|
| US (1) | US9483049B2 (ja) |
| EP (1) | EP2477086A4 (ja) |
| JP (1) | JP5363927B2 (ja) |
| WO (1) | WO2011027607A1 (ja) |
Cited By (11)
| Publication number | Priority date | Publication date | Assignee | Title |
|---|---|---|---|---|
| US20120283991A1 (en) * | 2011-05-06 | 2012-11-08 | The Board of Trustees of the Leland Stanford, Junior, University | Method and System for Online Detection of Multi-Component Interactions in Computing Systems |
| CN110046562A (zh) * | 2019-04-01 | 2019-07-23 | 湖南大学 | 一种风电系统健康监测方法及装置 |
| CN110291476A (zh) * | 2017-02-17 | 2019-09-27 | 三菱日立电力系统株式会社 | 成套设备的诊断装置以及诊断方法 |
| CN110647837A (zh) * | 2019-09-19 | 2020-01-03 | 重庆工业职业技术学院 | 电梯曳引机特征数据收集分析方法和电梯曳引机 |
| CN110836786A (zh) * | 2019-11-19 | 2020-02-25 | 北京瑞莱智慧科技有限公司 | 机械故障监测方法、装置、系统、介质和计算设备 |
| CN112098850A (zh) * | 2020-09-21 | 2020-12-18 | 山东工商学院 | 基于sdo算法的锂离子电池电压故障诊断方法及系统 |
| CN114328075A (zh) * | 2021-09-09 | 2022-04-12 | 广东电网有限责任公司广州供电局 | 一种智能配电房传感器多维数据融合异常事件检测方法、系统及计算机可读存储介质 |
| CN116032668A (zh) * | 2023-03-29 | 2023-04-28 | 广东维信智联科技有限公司 | 一种计算机网络数据安全保密系统 |
| CN116798150A (zh) * | 2023-06-26 | 2023-09-22 | 深圳市每开创新科技有限公司 | 无源电子锁的硬件维护方法、装置及存储介质 |
| WO2024177748A1 (en) * | 2023-02-21 | 2024-08-29 | Caterpillar Inc. | Systems and methods for detecting machines engaged in anomalous activity |
| CN119022856A (zh) * | 2024-10-25 | 2024-11-26 | 济南三越测试仪器有限公司 | 一种二维位移传感器数据有效性检测方法及系统 |
Families Citing this family (143)
| Publication number | Priority date | Publication date | Assignee | Title |
|---|---|---|---|---|
| JP5431235B2 (ja) | 2009-08-28 | 2014-03-05 | 株式会社日立製作所 | 設備状態監視方法およびその装置 |
| US8924162B2 (en) * | 2010-05-13 | 2014-12-30 | University Of Cincinnati | Turbine-to-turbine prognostics technique for wind farms |
| JP5547124B2 (ja) * | 2011-03-31 | 2014-07-09 | 公益財団法人鉄道総合技術研究所 | プログラム及び計測データ管理装置 |
| JP5553058B2 (ja) * | 2011-05-20 | 2014-07-16 | 日本電気株式会社 | 異常電波検出装置、異常電波検出方法および異常電波検出プログラム |
| JP5808605B2 (ja) * | 2011-08-17 | 2015-11-10 | 株式会社日立製作所 | 異常検知・診断方法、および異常検知・診断システム |
| US9659250B2 (en) | 2011-08-31 | 2017-05-23 | Hitachi Power Solutions Co., Ltd. | Facility state monitoring method and device for same |
| WO2013076927A1 (ja) * | 2011-11-24 | 2013-05-30 | パナソニック株式会社 | 診断支援装置および診断支援方法 |
| JP5648157B2 (ja) | 2011-12-28 | 2015-01-07 | 株式会社日立ハイテクノロジーズ | 半導体製造装置 |
| JP5885563B2 (ja) * | 2012-03-30 | 2016-03-15 | 三菱電機株式会社 | プラント機器の経年劣化進行度合判定システム |
| CN102662390B (zh) * | 2012-04-26 | 2014-04-02 | 杭州电子科技大学 | 一种随机模糊故障特征融合的旋转机械设备故障诊断方法 |
| CN104487998B (zh) * | 2012-07-11 | 2018-04-27 | 株式会社日立制作所 | 类似故障事例检索装置以及检索方法 |
| JP5964450B2 (ja) * | 2012-11-29 | 2016-08-03 | 株式会社日立製作所 | ネットワークグラフ生成方法及び意思決定支援システム |
| JP6239230B2 (ja) * | 2012-12-05 | 2017-11-29 | 三菱日立パワーシステムズ株式会社 | タービンロータの製造方法 |
| JP6139149B2 (ja) * | 2013-01-29 | 2017-05-31 | 三菱重工業株式会社 | 解析方法および解析装置 |
| KR101554216B1 (ko) * | 2013-06-18 | 2015-09-18 | 삼성에스디에스 주식회사 | 시계열 형태의 센싱 데이터 배드 패턴 검증 방법 및 그 장치 |
| JP5530020B1 (ja) * | 2013-11-01 | 2014-06-25 | 株式会社日立パワーソリューションズ | 異常診断システム及び異常診断方法 |
| CN103617350B (zh) * | 2013-11-15 | 2016-09-28 | 杭州电子科技大学 | 一种基于诊断证据平滑更新的旋转机械设备故障诊断方法 |
| JP6216242B2 (ja) | 2013-12-13 | 2017-10-18 | 株式会社日立ハイテクノロジーズ | 異常検知方法およびその装置 |
| JP6364800B2 (ja) | 2014-02-10 | 2018-08-01 | オムロン株式会社 | 監視装置及び監視方法 |
| JP2015184942A (ja) | 2014-03-25 | 2015-10-22 | 株式会社日立ハイテクノロジーズ | 故障原因分類装置 |
| JP5751731B1 (ja) | 2014-05-23 | 2015-07-22 | 株式会社テイエルブイ | 蒸気使用設備の監視システム |
| US9984334B2 (en) | 2014-06-16 | 2018-05-29 | Mitsubishi Electric Research Laboratories, Inc. | Method for anomaly detection in time series data based on spectral partitioning |
| JP5943357B2 (ja) | 2014-09-17 | 2016-07-05 | インターナショナル・ビジネス・マシーンズ・コーポレーションInternational Business Machines Corporation | 検出装置、検出方法、およびプログラム |
| JP6547275B2 (ja) * | 2014-10-29 | 2019-07-24 | 株式会社リコー | 情報処理システム、情報処理装置、情報処理方法、及びプログラム |
| US20160291552A1 (en) * | 2014-11-18 | 2016-10-06 | Prophecy Sensors, Llc | System for rule management, predictive maintenance and quality assurance of a process and machine using reconfigurable sensor networks and big data machine learning |
| US10613046B2 (en) | 2015-02-23 | 2020-04-07 | Machinesense, Llc | Method for accurately measuring real-time dew-point value and total moisture content of a material |
| US20160313216A1 (en) | 2015-04-25 | 2016-10-27 | Prophecy Sensors, Llc | Fuel gauge visualization of iot based predictive maintenance system using multi-classification based machine learning |
| US10599982B2 (en) | 2015-02-23 | 2020-03-24 | Machinesense, Llc | Internet of things based determination of machine reliability and automated maintainenace, repair and operation (MRO) logs |
| US20160245279A1 (en) | 2015-02-23 | 2016-08-25 | Biplab Pal | Real time machine learning based predictive and preventive maintenance of vacuum pump |
| US10638295B2 (en) | 2015-01-17 | 2020-04-28 | Machinesense, Llc | System and method for turbomachinery preventive maintenance and root cause failure determination |
| US10648735B2 (en) | 2015-08-23 | 2020-05-12 | Machinesense, Llc | Machine learning based predictive maintenance of a dryer |
| US10481195B2 (en) | 2015-12-02 | 2019-11-19 | Machinesense, Llc | Distributed IoT based sensor analytics for power line diagnosis |
| US20160245686A1 (en) | 2015-02-23 | 2016-08-25 | Biplab Pal | Fault detection in rotor driven equipment using rotational invariant transform of sub-sampled 3-axis vibrational data |
| US10509695B1 (en) * | 2015-03-30 | 2019-12-17 | ThetaRay Ltd. | System and method for anomaly detection in dynamically evolving data using low rank matrix decomposition |
| JP6328071B2 (ja) * | 2015-03-31 | 2018-05-23 | 東芝メモリ株式会社 | 異常予兆検知システム及び半導体デバイスの製造方法 |
| JP5818337B1 (ja) * | 2015-04-13 | 2015-11-18 | 株式会社テイエルブイ | 蒸気使用設備の監視システム |
| JP6853617B2 (ja) * | 2015-07-14 | 2021-03-31 | 中国電力株式会社 | 故障予兆監視方法 |
| JP5845374B1 (ja) * | 2015-08-05 | 2016-01-20 | 株式会社日立パワーソリューションズ | 異常予兆診断システム及び異常予兆診断方法 |
| US11162912B2 (en) | 2015-09-11 | 2021-11-02 | KABUSHI Kl KAISHA TOSHIBA | Electronic apparatus, index calculating method, and computer program product |
| US20170090866A1 (en) * | 2015-09-25 | 2017-03-30 | Robert L. Vaughn | Universal sensor and/or sensor cluster to provide a detection pattern |
| JP6655926B2 (ja) * | 2015-09-25 | 2020-03-04 | 三菱重工業株式会社 | 異常診断システム |
| US11023284B2 (en) * | 2015-10-28 | 2021-06-01 | Qomplx, Inc. | System and method for optimization and load balancing of computer clusters |
| JP6588814B2 (ja) | 2015-12-17 | 2019-10-09 | 株式会社東芝 | 異常診断装置及び方法 |
| JP2017117089A (ja) * | 2015-12-22 | 2017-06-29 | ローム株式会社 | センサノード、センサネットワークシステム、および監視方法 |
| WO2017111072A1 (en) | 2015-12-25 | 2017-06-29 | Ricoh Company, Ltd. | Diagnostic device, computer program, and diagnostic system |
| JP6156566B2 (ja) * | 2015-12-25 | 2017-07-05 | 株式会社リコー | 診断装置、診断方法、プログラムおよび診断システム |
| JP6597453B2 (ja) * | 2016-03-30 | 2019-10-30 | 株式会社Ihi | 異常診断方法、異常診断装置、及び異常診断プログラム |
| US20170284903A1 (en) * | 2016-03-30 | 2017-10-05 | Sas Institute Inc. | Monitoring machine health using multiple sensors |
| JP6840953B2 (ja) | 2016-08-09 | 2021-03-10 | 株式会社リコー | 診断装置、学習装置および診断システム |
| KR101863781B1 (ko) * | 2016-09-08 | 2018-06-01 | 두산중공업 주식회사 | 로터 진동 이상 감지 장치 및 방법 |
| WO2018073960A1 (ja) * | 2016-10-21 | 2018-04-26 | 日本電気株式会社 | 表示方法、表示装置、および、プログラム |
| KR101720327B1 (ko) * | 2016-10-28 | 2017-03-28 | 한국지질자원연구원 | 수중 이상체의 위치 측정 장치 및 방법 |
| CN106569487B (zh) * | 2016-11-16 | 2019-02-26 | 北京理工大学 | 一种基于观测器的伺服系统的故障检测方法 |
| JP6675297B2 (ja) * | 2016-12-09 | 2020-04-01 | Dmg森精機株式会社 | 情報処理方法、情報処理システム、および情報処理装置 |
| JP6621395B2 (ja) * | 2016-12-12 | 2019-12-18 | 三菱重工業株式会社 | 評価装置、評価方法、コンピュータプログラム、及び記録媒体 |
| FR3061324B1 (fr) * | 2016-12-22 | 2019-05-31 | Electricite De France | Procede de caracterisation d'une ou plusieurs defaillances d'un systeme |
| JP6616791B2 (ja) * | 2017-01-04 | 2019-12-04 | 株式会社東芝 | 情報処理装置、情報処理方法およびコンピュータプログラム |
| JP6648747B2 (ja) * | 2017-01-13 | 2020-02-14 | Jfeスチール株式会社 | 異常原因特定方法および異常原因特定装置 |
| WO2018178082A1 (en) | 2017-03-28 | 2018-10-04 | Shell Internationale Research Maatschappij B.V. | Method, computer device and system for providing a visualization of sensor measurements |
| US10908983B2 (en) * | 2017-03-31 | 2021-02-02 | Cae Inc. | Method and system for preventing an anomaly in a simulator |
| KR101926257B1 (ko) | 2017-05-15 | 2018-12-06 | 두산중공업 주식회사 | 이상 신호 복원 시스템 및 방법 |
| US11549491B2 (en) | 2017-06-14 | 2023-01-10 | Kk Wind Solutions A/S | Independent monitoring system for a wind turbine |
| US10737904B2 (en) | 2017-08-07 | 2020-08-11 | Otis Elevator Company | Elevator condition monitoring using heterogeneous sources |
| EP3699708B1 (en) | 2017-10-16 | 2021-07-28 | Fujitsu Limited | Production facility monitoring device, production facility monitoring method, and production facility monitoring program |
| US11232371B2 (en) | 2017-10-19 | 2022-01-25 | Uptake Technologies, Inc. | Computer system and method for detecting anomalies in multivariate data |
| US10503144B2 (en) * | 2017-10-24 | 2019-12-10 | Applied Materials, Inc. | Anomaly detection with correlation coeffiecients |
| JP6721563B2 (ja) | 2017-11-28 | 2020-07-15 | ファナック株式会社 | 数値制御装置 |
| CN108089126A (zh) * | 2017-12-04 | 2018-05-29 | 国网湖南省电力公司 | 调相机故障诊断方法、装置和设备 |
| US10921792B2 (en) | 2017-12-21 | 2021-02-16 | Machinesense Llc | Edge cloud-based resin material drying system and method |
| US11036715B2 (en) * | 2018-01-29 | 2021-06-15 | Microsoft Technology Licensing, Llc | Combination of techniques to detect anomalies in multi-dimensional time series |
| US11075925B2 (en) | 2018-01-31 | 2021-07-27 | EMC IP Holding Company LLC | System and method to enable component inventory and compliance in the platform |
| EP4708233A3 (en) | 2018-02-08 | 2026-05-06 | GEOTAB Inc. | Telematically monitoring a condition of an operational vehicle component |
| US11182987B2 (en) * | 2018-02-08 | 2021-11-23 | Geotab Inc. | Telematically providing remaining effective life indications for operational vehicle components |
| US10311703B1 (en) | 2018-02-09 | 2019-06-04 | Computational Systems, Inc. | Detection of spikes and faults in vibration trend data |
| US20190272209A1 (en) * | 2018-03-05 | 2019-09-05 | Kabushiki Kaisha Toshiba | System and method of resolution prediction for multifunction peripheral failures |
| US10754708B2 (en) | 2018-03-28 | 2020-08-25 | EMC IP Holding Company LLC | Orchestrator and console agnostic method to deploy infrastructure through self-describing deployment templates |
| US10795756B2 (en) | 2018-04-24 | 2020-10-06 | EMC IP Holding Company LLC | System and method to predictively service and support the solution |
| US11086738B2 (en) * | 2018-04-24 | 2021-08-10 | EMC IP Holding Company LLC | System and method to automate solution level contextual support |
| US11113395B2 (en) | 2018-05-24 | 2021-09-07 | General Electric Company | System and method for anomaly and cyber-threat detection in a wind turbine |
| CN109063886B (zh) * | 2018-06-12 | 2022-05-31 | 创新先进技术有限公司 | 一种异常检测方法、装置以及设备 |
| JP6456580B1 (ja) | 2018-06-14 | 2019-01-23 | 三菱電機株式会社 | 異常検知装置、異常検知方法及び異常検知プログラム |
| JP6636214B1 (ja) | 2018-06-18 | 2020-01-29 | 三菱電機株式会社 | 診断装置、診断方法及びプログラム |
| US10685283B2 (en) | 2018-06-26 | 2020-06-16 | Sas Institute Inc. | Demand classification based pipeline system for time-series data forecasting |
| US10560313B2 (en) | 2018-06-26 | 2020-02-11 | Sas Institute Inc. | Pipeline system for time-series data forecasting |
| US11216743B2 (en) | 2018-08-14 | 2022-01-04 | International Business Machines Corporation | Learning sparsity-constrained gaussian graphical models in anomaly detection |
| JP7040668B2 (ja) * | 2018-08-30 | 2022-03-23 | 日本電気株式会社 | 異常検出装置、方法、プログラム |
| US11599422B2 (en) | 2018-10-16 | 2023-03-07 | EMC IP Holding Company LLC | System and method for device independent backup in distributed system |
| JP6950670B2 (ja) * | 2018-12-12 | 2021-10-13 | 横河電機株式会社 | 検出装置、検出方法、および、検出プログラム |
| WO2020122287A1 (ko) * | 2018-12-13 | 2020-06-18 | 주식회사 알고리고 | 미세 분포 변화를 이용한 비정상 데이터 구분 장치 및 방법 |
| JP7229018B2 (ja) * | 2018-12-28 | 2023-02-27 | Pacraft株式会社 | 不健全性予見装置、不健全性予見方法、プログラム、及びコンピュータ読み取り可能な記録媒体 |
| FR3093493B1 (fr) * | 2019-03-04 | 2021-04-09 | Commissariat Energie Atomique | Procédé de détection d’anomalie de matériel roulant exploitant un signal de déformation d’un support de rail |
| CN109948503B (zh) * | 2019-03-13 | 2023-05-23 | 东北大学 | 基于共享子空间多视角非负矩阵分解的工业故障检测方法 |
| US10862761B2 (en) | 2019-04-29 | 2020-12-08 | EMC IP Holding Company LLC | System and method for management of distributed systems |
| JP7397276B2 (ja) * | 2019-05-21 | 2023-12-13 | ダイキン工業株式会社 | 機器管理システム |
| US11301557B2 (en) | 2019-07-19 | 2022-04-12 | Dell Products L.P. | System and method for data processing device management |
| GB2586659B (en) * | 2019-09-02 | 2021-09-08 | Imrandd Ltd | Inspection related systems and methods |
| WO2021059302A2 (en) * | 2019-09-27 | 2021-04-01 | Tata Consultancy Services Limited | Method and system for diagnosing anomaly in a manufacturing plant |
| US11526790B2 (en) | 2019-09-27 | 2022-12-13 | Oracle International Corporation | Univariate anomaly detection in a sensor network |
| CN110673578B (zh) * | 2019-09-29 | 2022-07-08 | 华北电力大学(保定) | 故障劣化程度确定方法、装置、计算机设备及存储介质 |
| US11060885B2 (en) | 2019-09-30 | 2021-07-13 | Oracle International Corporation | Univariate anomaly detection in a sensor network |
| US10954919B1 (en) * | 2019-10-02 | 2021-03-23 | General Electric Company | Machine-learning model-based analytic for monitoring wind farm power performance |
| US20220341393A1 (en) * | 2019-10-02 | 2022-10-27 | General Electric Company | System and method for fusing multiple analytics of a wind turbine for improved efficiency |
| JP7350601B2 (ja) * | 2019-10-04 | 2023-09-26 | エヌ・ティ・ティ・コミュニケーションズ株式会社 | 情報処理装置、情報処理方法及び情報処理プログラム |
| US12088473B2 (en) | 2019-10-23 | 2024-09-10 | Aryaka Networks, Inc. | Method, device and system for enhancing predictive classification of anomalous events in a cloud-based application acceleration as a service environment |
| US11455554B2 (en) | 2019-11-25 | 2022-09-27 | International Business Machines Corporation | Trustworthiness of artificial intelligence models in presence of anomalous data |
| JP7493930B2 (ja) * | 2019-12-10 | 2024-06-03 | キヤノン株式会社 | 情報処理方法、情報処理装置、生産システム、プログラム、記録媒体 |
| JP7541660B2 (ja) * | 2020-01-06 | 2024-08-29 | 日本電気通信システム株式会社 | 自律移動装置、学習装置、異常検知方法、及びプログラム |
| US11221934B2 (en) | 2020-01-10 | 2022-01-11 | International Business Machines Corporation | Identifying anomalies in data during data outage |
| JP7434917B2 (ja) * | 2020-01-21 | 2024-02-21 | 日本電気株式会社 | 信号検出装置、センサネットワークシステム、信号検出方法、及び信号検出プログラム |
| DE102020201239A1 (de) | 2020-01-31 | 2021-08-05 | Rolls-Royce Deutschland Ltd & Co Kg | Sensorsystem und Verfahren zum Erkennen eines Zustands zumindest einer Maschine |
| DE102020201599A1 (de) | 2020-02-10 | 2021-08-12 | Robert Bosch Gesellschaft mit beschränkter Haftung | Verfahren und Einrichtung zum Bestimmen einer Performanceeigenschaft eines Produkts |
| US11216247B2 (en) | 2020-03-02 | 2022-01-04 | Oracle International Corporation | Automatic asset anomaly detection in a multi-sensor network |
| WO2021176460A1 (en) * | 2020-03-03 | 2021-09-10 | Telefonaktiebolaget Lm Ericsson (Publ) | Adaptive thresholding heuristic for anomaly detection |
| JP7443832B2 (ja) * | 2020-03-05 | 2024-03-06 | 株式会社デンソー | セキュリティ管理装置 |
| DE102020202869A1 (de) | 2020-03-06 | 2021-09-09 | Robert Bosch Gesellschaft mit beschränkter Haftung | Vorverarbeitungsverfahren zur Bereitstellung homogener Datenblöcke |
| JP7452171B2 (ja) * | 2020-03-26 | 2024-03-19 | トヨタ自動車株式会社 | 異音の発生箇所特定方法 |
| JP7395409B2 (ja) * | 2020-04-03 | 2023-12-11 | 日立造船株式会社 | 異常検出装置、水門システムおよび異常検出方法 |
| JP7466652B2 (ja) * | 2020-07-28 | 2024-04-12 | 川崎重工業株式会社 | 状態監視装置、状態異常判別方法及び状態異常判別プログラム |
| US20220035334A1 (en) * | 2020-07-29 | 2022-02-03 | Abb Schweiz Ag | Technologies for producing training data for identifying degradation of physical components |
| CN111859815B (zh) * | 2020-07-31 | 2023-05-23 | 中国汽车工程研究院股份有限公司 | 一种电池报警特征数据的模式聚类方法与事故特征识别技术 |
| US11748568B1 (en) | 2020-08-07 | 2023-09-05 | Amazon Technologies, Inc. | Machine learning-based selection of metrics for anomaly detection |
| JP7541182B2 (ja) * | 2020-08-21 | 2024-08-27 | リアルタイムテック カンパニー,リミテッド | ディープラーニングベースのリアルタイム工程監視システム及びその方法 |
| EP4137901A4 (en) * | 2020-08-21 | 2024-04-24 | Realtimetech Co., Ltd. | DEEP LEARNING-BASED REAL-TIME PROCESS MONITORING SYSTEM AND METHOD THEREFOR |
| JP7395443B2 (ja) * | 2020-08-25 | 2023-12-11 | 日立造船株式会社 | 異常検出装置、水門システムおよび異常検出方法 |
| US12265446B1 (en) | 2020-09-24 | 2025-04-01 | Amazon Technologies, Inc. | Multi-factor anomaly detection for application execution environments |
| US11762956B2 (en) | 2021-02-05 | 2023-09-19 | Oracle International Corporation | Adaptive pattern recognition for a sensor network |
| JP7811936B2 (ja) * | 2021-03-29 | 2026-02-06 | 川崎重工業株式会社 | ロボット故障予兆検出装置及びロボット故障予兆検出方法 |
| US11943242B2 (en) | 2021-03-31 | 2024-03-26 | Honda Motor Co. Ltd. | Deep automation anomaly detection |
| JP7641538B2 (ja) * | 2021-04-05 | 2025-03-07 | 千代田化工建設株式会社 | 異常検知装置、異常検知プログラム、及び学習装置 |
| US11790081B2 (en) | 2021-04-14 | 2023-10-17 | General Electric Company | Systems and methods for controlling an industrial asset in the presence of a cyber-attack |
| US12034741B2 (en) | 2021-04-21 | 2024-07-09 | Ge Infrastructure Technology Llc | System and method for cyberattack detection in a wind turbine control system |
| US11649804B2 (en) | 2021-06-07 | 2023-05-16 | General Electric Renovables Espana, S.L. | Systems and methods for controlling a wind turbine |
| US12180936B2 (en) | 2021-07-28 | 2024-12-31 | General Electric Renovables Espana, S.L. | Systems and methods for operating a wind farm |
| JP7717549B2 (ja) * | 2021-09-15 | 2025-08-04 | 株式会社東芝 | 監視装置、方法およびプログラム |
| US12560150B2 (en) | 2021-10-07 | 2026-02-24 | GE Vernova Renovables Espana, S.L. | Systems and methods for controlling a wind turbine |
| CN114004263B (zh) * | 2021-12-29 | 2022-05-03 | 四川大学 | 一种特征融合转换的大型设备工况诊断预测方法 |
| JP2024047171A (ja) * | 2022-09-26 | 2024-04-05 | 川崎重工業株式会社 | 要因分析装置及び要因分析方法 |
| CN115687976B (zh) * | 2022-10-31 | 2025-09-02 | 中南大学 | 一种故障诊断方法、系统及存储介质 |
| JP7731940B2 (ja) * | 2023-07-11 | 2025-09-01 | 株式会社Screenホールディングス | 吐出圧力監視装置、吐出圧力監視方法、コンピュータプログラム、および塗布装置 |
| US12510052B1 (en) | 2024-06-27 | 2025-12-30 | GE Vernova Renovables Espana, S.L. | System and method for optimizing control of a wind turbine |
| CN118673447B (zh) * | 2024-08-22 | 2024-12-27 | 西安尔吉环保科技有限公司 | 一种基于水土保持监督检查大数据的水土流失评估方法 |
| CN119831398A (zh) * | 2024-12-02 | 2025-04-15 | 广州继善建筑技术有限公司 | 一种基于多传感器融合的建筑质量检测方法 |
| DE102025106898B3 (de) | 2025-02-24 | 2026-04-23 | Sew-Eurodrive Gmbh & Co Kg | Verfahren und System zur Bewertung einer technischen Anlage |
Citations (13)
| Publication number | Priority date | Publication date | Assignee | Title |
|---|---|---|---|---|
| JPH0545186A (ja) * | 1991-08-16 | 1993-02-23 | Mitsubishi Electric Corp | 事例に基づく設備故障診断装置 |
| JPH06295271A (ja) * | 1993-04-07 | 1994-10-21 | Fuji Photo Film Co Ltd | 画像合成出力装置 |
| JPH07160327A (ja) * | 1993-12-06 | 1995-06-23 | Komatsu Ltd | 計測値判定方法 |
| US6216066B1 (en) | 1998-07-01 | 2001-04-10 | General Electric Company | System and method for generating alerts through multi-variate data assessment |
| JP2002099323A (ja) * | 2000-09-22 | 2002-04-05 | Hitachi Ltd | 半導体製造装置のリモート診断システム及びリモート診断方法 |
| JP2002139377A (ja) * | 2000-10-30 | 2002-05-17 | Hitachi Eng Co Ltd | 機器異常診断装置 |
| US6952662B2 (en) | 2000-03-30 | 2005-10-04 | Smartsignal Corporation | Signal differentiation system using improved non-linear operator |
| US6975962B2 (en) | 2001-06-11 | 2005-12-13 | Smartsignal Corporation | Residual signal alert generation for condition monitoring using approximated SPRT distribution |
| JP2006053818A (ja) * | 2004-08-13 | 2006-02-23 | Kagawa Univ | データ処理方法及びデータ処理装置、並びに診断方法及び診断装置 |
| JP2006106870A (ja) * | 2004-09-30 | 2006-04-20 | Toshiba Corp | プロセス管理装置 |
| JP2007334756A (ja) * | 2006-06-16 | 2007-12-27 | National Institute Of Advanced Industrial & Technology | 異常動作検出装置および異常動作検出方法 |
| JP2008256981A (ja) * | 2007-04-05 | 2008-10-23 | Fuji Xerox Co Ltd | 故障診断システム |
| JP2009070071A (ja) * | 2007-09-12 | 2009-04-02 | Toshiba Corp | 学習型プロセス異常診断装置、およびオペレータ判断推測結果収集装置 |
Family Cites Families (7)
| Publication number | Priority date | Publication date | Assignee | Title |
|---|---|---|---|---|
| KR960016138B1 (ko) * | 1988-06-17 | 1996-12-04 | 가부시기가이샤 히다찌세이꾸쇼 | 지식정보생성 시스템 |
| JP3221184B2 (ja) * | 1993-10-13 | 2001-10-22 | 株式会社日立製作所 | 故障診断装置および方法 |
| JP2953613B2 (ja) * | 1997-04-04 | 1999-09-27 | 川崎重工業株式会社 | 各種プラントの監視・診断方法 |
| JP4046309B2 (ja) * | 1999-03-12 | 2008-02-13 | 株式会社東芝 | プラント監視装置 |
| US6618692B2 (en) | 2000-09-20 | 2003-09-09 | Hitachi, Ltd. | Remote diagnostic system and method for semiconductor manufacturing equipment |
| JP2006343063A (ja) * | 2005-06-10 | 2006-12-21 | Daikin Ind Ltd | 設備機器の異常予知システム、設備機器の異常予知装置および設備機器の異常予知方法 |
| US8051021B2 (en) * | 2006-09-12 | 2011-11-01 | International Business Machines Corporation | System and method for resource adaptive classification of data streams |
-
2009
- 2009-09-07 JP JP2009206103A patent/JP5363927B2/ja not_active Expired - Fee Related
-
2010
- 2010-06-16 US US13/384,463 patent/US9483049B2/en not_active Expired - Fee Related
- 2010-06-16 EP EP10813558.3A patent/EP2477086A4/en not_active Withdrawn
- 2010-06-16 WO PCT/JP2010/060232 patent/WO2011027607A1/ja not_active Ceased
Patent Citations (13)
| Publication number | Priority date | Publication date | Assignee | Title |
|---|---|---|---|---|
| JPH0545186A (ja) * | 1991-08-16 | 1993-02-23 | Mitsubishi Electric Corp | 事例に基づく設備故障診断装置 |
| JPH06295271A (ja) * | 1993-04-07 | 1994-10-21 | Fuji Photo Film Co Ltd | 画像合成出力装置 |
| JPH07160327A (ja) * | 1993-12-06 | 1995-06-23 | Komatsu Ltd | 計測値判定方法 |
| US6216066B1 (en) | 1998-07-01 | 2001-04-10 | General Electric Company | System and method for generating alerts through multi-variate data assessment |
| US6952662B2 (en) | 2000-03-30 | 2005-10-04 | Smartsignal Corporation | Signal differentiation system using improved non-linear operator |
| JP2002099323A (ja) * | 2000-09-22 | 2002-04-05 | Hitachi Ltd | 半導体製造装置のリモート診断システム及びリモート診断方法 |
| JP2002139377A (ja) * | 2000-10-30 | 2002-05-17 | Hitachi Eng Co Ltd | 機器異常診断装置 |
| US6975962B2 (en) | 2001-06-11 | 2005-12-13 | Smartsignal Corporation | Residual signal alert generation for condition monitoring using approximated SPRT distribution |
| JP2006053818A (ja) * | 2004-08-13 | 2006-02-23 | Kagawa Univ | データ処理方法及びデータ処理装置、並びに診断方法及び診断装置 |
| JP2006106870A (ja) * | 2004-09-30 | 2006-04-20 | Toshiba Corp | プロセス管理装置 |
| JP2007334756A (ja) * | 2006-06-16 | 2007-12-27 | National Institute Of Advanced Industrial & Technology | 異常動作検出装置および異常動作検出方法 |
| JP2008256981A (ja) * | 2007-04-05 | 2008-10-23 | Fuji Xerox Co Ltd | 故障診断システム |
| JP2009070071A (ja) * | 2007-09-12 | 2009-04-02 | Toshiba Corp | 学習型プロセス異常診断装置、およびオペレータ判断推測結果収集装置 |
Non-Patent Citations (3)
| Title |
|---|
| See also references of EP2477086A4 |
| STEPHAN W. WEGERICH: "Nonparametric modeling of vibration signal features for equipment health monitoring", AEROSPACE CONFERENCE, 2003. PROCEEDINGS. 2003 IEEE, vol. 7, 2003, pages 3113 - 3121, XP055231408, DOI: doi:10.1109/AERO.2003.1234154 |
| YOSHITERU ISHIDA: "Sensor Diagnosis of Process Plants by an Immune-Based Model", SYSTEMS, CONTROL AND INFORMATION, vol. 38, no. 1, 15 January 1994 (1994-01-15), pages 4 - 7, XP008150083 * |
Cited By (16)
| Publication number | Priority date | Publication date | Assignee | Title |
|---|---|---|---|---|
| US20120283991A1 (en) * | 2011-05-06 | 2012-11-08 | The Board of Trustees of the Leland Stanford, Junior, University | Method and System for Online Detection of Multi-Component Interactions in Computing Systems |
| CN110291476A (zh) * | 2017-02-17 | 2019-09-27 | 三菱日立电力系统株式会社 | 成套设备的诊断装置以及诊断方法 |
| CN110046562B (zh) * | 2019-04-01 | 2021-01-26 | 湖南大学 | 一种风电系统健康监测方法及装置 |
| CN110046562A (zh) * | 2019-04-01 | 2019-07-23 | 湖南大学 | 一种风电系统健康监测方法及装置 |
| CN110647837A (zh) * | 2019-09-19 | 2020-01-03 | 重庆工业职业技术学院 | 电梯曳引机特征数据收集分析方法和电梯曳引机 |
| CN110647837B (zh) * | 2019-09-19 | 2022-03-15 | 重庆工业职业技术学院 | 电梯曳引机特征数据收集分析方法和电梯曳引机 |
| CN110836786A (zh) * | 2019-11-19 | 2020-02-25 | 北京瑞莱智慧科技有限公司 | 机械故障监测方法、装置、系统、介质和计算设备 |
| CN110836786B (zh) * | 2019-11-19 | 2020-10-23 | 北京瑞莱智慧科技有限公司 | 机械故障监测方法、装置、系统、介质和计算设备 |
| CN112098850A (zh) * | 2020-09-21 | 2020-12-18 | 山东工商学院 | 基于sdo算法的锂离子电池电压故障诊断方法及系统 |
| CN112098850B (zh) * | 2020-09-21 | 2024-03-08 | 山东工商学院 | 基于sdo算法的锂离子电池电压故障诊断方法及系统 |
| CN114328075A (zh) * | 2021-09-09 | 2022-04-12 | 广东电网有限责任公司广州供电局 | 一种智能配电房传感器多维数据融合异常事件检测方法、系统及计算机可读存储介质 |
| WO2024177748A1 (en) * | 2023-02-21 | 2024-08-29 | Caterpillar Inc. | Systems and methods for detecting machines engaged in anomalous activity |
| CN116032668A (zh) * | 2023-03-29 | 2023-04-28 | 广东维信智联科技有限公司 | 一种计算机网络数据安全保密系统 |
| CN116032668B (zh) * | 2023-03-29 | 2023-09-15 | 广东维信智联科技有限公司 | 一种计算机网络数据安全保密系统 |
| CN116798150A (zh) * | 2023-06-26 | 2023-09-22 | 深圳市每开创新科技有限公司 | 无源电子锁的硬件维护方法、装置及存储介质 |
| CN119022856A (zh) * | 2024-10-25 | 2024-11-26 | 济南三越测试仪器有限公司 | 一种二维位移传感器数据有效性检测方法及系统 |
Also Published As
| Publication number | Publication date |
|---|---|
| US20120166142A1 (en) | 2012-06-28 |
| EP2477086A4 (en) | 2016-05-04 |
| EP2477086A1 (en) | 2012-07-18 |
| JP2011059790A (ja) | 2011-03-24 |
| US9483049B2 (en) | 2016-11-01 |
| JP5363927B2 (ja) | 2013-12-11 |
Similar Documents
| Publication | Publication Date | Title |
|---|---|---|
| JP5363927B2 (ja) | 異常検知・診断方法、異常検知・診断システム、及び異常検知・診断プログラム | |
| JP5538597B2 (ja) | 異常検知方法及び異常検知システム | |
| JP5301310B2 (ja) | 異常検知方法及び異常検知システム | |
| JP5048625B2 (ja) | 異常検知方法及びシステム | |
| JP5501903B2 (ja) | 異常検知方法及びそのシステム | |
| Jiang et al. | Performance supervised plant-wide process monitoring in industry 4.0: A roadmap | |
| JP2011145846A (ja) | 異常検知方法、異常検知システム、及び異常検知プログラム | |
| Khelif et al. | Direct remaining useful life estimation based on support vector regression | |
| JP5439265B2 (ja) | 異常検知・診断方法、異常検知・診断システム、及び異常検知・診断プログラム | |
| JP5778305B2 (ja) | 異常検知方法及びそのシステム | |
| JP5498540B2 (ja) | 異常検知方法及びシステム | |
| JP5431235B2 (ja) | 設備状態監視方法およびその装置 | |
| JP5808605B2 (ja) | 異常検知・診断方法、および異常検知・診断システム | |
| JP2015172945A (ja) | 設備状態監視方法およびその装置 | |
| JP2012137934A (ja) | 異常検知・診断方法、異常検知・診断システム、及び異常検知・診断プログラム並びに企業資産管理・設備資産管理システム | |
| JP2014056598A (ja) | 異常検知方法及びそのシステム | |
| Cohen et al. | Fault diagnosis of timed event systems: An exploration of machine learning methods | |
| CN121559309A (zh) | 电网资产全寿命断路器机械特性迁移学习诊断系统 | |
| Medon | A Framework for a Predictive Manitenance Tool Articulated with a Manufacturing Execution System |
Legal Events
| Date | Code | Title | Description |
|---|---|---|---|
| 121 | Ep: the epo has been informed by wipo that ep was designated in this application |
Ref document number: 10813558 Country of ref document: EP Kind code of ref document: A1 |
|
| WWE | Wipo information: entry into national phase |
Ref document number: 13384463 Country of ref document: US Ref document number: 2010813558 Country of ref document: EP |
|
| NENP | Non-entry into the national phase |
Ref country code: DE |