WO2011027607A1 - Procédé de diagnostic et de détection d'anomalie, système de diagnostic et de détection d'anomalie et programme de diagnostic et de détection d'anomalie - Google Patents
Procédé de diagnostic et de détection d'anomalie, système de diagnostic et de détection d'anomalie et programme de diagnostic et de détection d'anomalie Download PDFInfo
- Publication number
- WO2011027607A1 WO2011027607A1 PCT/JP2010/060232 JP2010060232W WO2011027607A1 WO 2011027607 A1 WO2011027607 A1 WO 2011027607A1 JP 2010060232 W JP2010060232 W JP 2010060232W WO 2011027607 A1 WO2011027607 A1 WO 2011027607A1
- Authority
- WO
- WIPO (PCT)
- Prior art keywords
- data
- abnormality
- observation data
- sensor signal
- abnormality detection
- Prior art date
- Legal status (The legal status is an assumption and is not a legal conclusion. Google has not performed a legal analysis and makes no representation as to the accuracy of the status listed.)
- Ceased
Links
Images




Classifications
-
- G—PHYSICS
- G05—CONTROLLING; REGULATING
- G05B—CONTROL OR REGULATING SYSTEMS IN GENERAL; FUNCTIONAL ELEMENTS OF SUCH SYSTEMS; MONITORING OR TESTING ARRANGEMENTS FOR SUCH SYSTEMS OR ELEMENTS
- G05B23/00—Testing or monitoring of control systems or parts thereof
- G05B23/02—Electric testing or monitoring
- G05B23/0205—Electric testing or monitoring by means of a monitoring system capable of detecting and responding to faults
- G05B23/0218—Electric testing or monitoring by means of a monitoring system capable of detecting and responding to faults characterised by the fault detection method dealing with either existing or incipient faults
- G05B23/0224—Process history based detection method, e.g. whereby history implies the availability of large amounts of data
- G05B23/0227—Qualitative history assessment, whereby the type of data acted upon, e.g. waveforms, images or patterns, is not relevant, e.g. rule based assessment; if-then decisions
-
- G—PHYSICS
- G06—COMPUTING OR CALCULATING; COUNTING
- G06F—ELECTRIC DIGITAL DATA PROCESSING
- G06F18/00—Pattern recognition
- G06F18/20—Analysing
- G06F18/21—Design or setup of recognition systems or techniques; Extraction of features in feature space; Blind source separation
- G06F18/213—Feature extraction, e.g. by transforming the feature space; Summarisation; Mappings, e.g. subspace methods
- G06F18/2137—Feature extraction, e.g. by transforming the feature space; Summarisation; Mappings, e.g. subspace methods based on criteria of topology preservation, e.g. multidimensional scaling or self-organising maps
-
- G—PHYSICS
- G06—COMPUTING OR CALCULATING; COUNTING
- G06F—ELECTRIC DIGITAL DATA PROCESSING
- G06F2218/00—Aspects of pattern recognition specially adapted for signal processing
- G06F2218/12—Classification; Matching
Definitions
- the present invention relates to an abnormality detection / diagnosis method and an abnormality detection / diagnosis system for early detection of an abnormality in a plant or equipment.
- Electric power companies use waste heat from gas turbines to supply hot water for district heating and supply high-pressure steam and low-pressure steam to factories.
- Petrochemical companies operate gas turbines and other power sources.
- it is extremely important to detect the abnormality at an early stage because damage to society can be minimized.
- a system that monitors observation data and compares it with a set threshold value to detect an abnormality is often used.
- the threshold value is set by paying attention to the physical quantity of the measurement object as each observation data, it can be said that it is design-based abnormality detection.
- the set threshold value cannot be considered appropriate due to the operating environment of the equipment, the state change due to the operating years, the operating conditions, the influence of parts replacement, and the like.
- the estimated value is calculated by linear combination of observation data and data with high similarity, and the degree of deviation between the estimated value and observation data is calculated. Because the data is output, depending on the preparation of the learning data, it is possible to consider the operating environment of the equipment, the state change depending on the operating years, the operating conditions, the influence of parts replacement, and the like. However, it is necessary to explain why the observation data contains anomalies. In the case of anomaly detection in a feature space with a weak physical meaning, such as General Electric's k-means clustering, it is difficult to explain the anomaly. If the explanation is difficult, it will be treated as a false detection. Conventionally, design-based abnormality detection and case-based abnormality detection often move independently without being linked to each other.
- an object of the present invention is to solve the above problems and to provide a method for interlocking design-based abnormality detection with case-based abnormality detection.
- a rule that can also be a determination condition for abnormality detection is constructed from case-based abnormality detection by multivariate analysis, and this is applied to design-based abnormality detection.
- the threshold value can be set and controlled appropriately.
- anomaly detection based on a case base by multivariate analysis for multidimensional sensor signals controls design based anomaly detection for individual sensor signals. That is, (1) abnormality detection based on the case base selects sensor signals and sets threshold values according to various abnormalities. Specifically, abnormality detection (feature conversion), evaluation of the influence level of each signal, construction of determination conditions (rules), and selection and display of sensor signals corresponding to the abnormality are performed. (2) The design-based abnormality detection for the individual sensor signal receives the above and performs abnormality detection. Specifically, threshold setting and control, threshold display, abnormality detection and display are performed. In case-based abnormality detection, learning data is modeled by the subspace method, and abnormality candidates are detected based on the distance relationship between the observation data and the subspace.
- the top k pieces of data with high similarity are obtained for each piece of data included in the learning data, thereby generating a subspace.
- the above k is not a fixed value, but learning data with a distance from the observation data within a specified range is selected so that it is appropriate for each observation data, and the learning data is sequentially increased from the minimum number to the selected number and projected. Choose the one with the smallest distance.
- a method of detecting an abnormality is realized as a program, and this is provided to the customer by a media medium or an online service.
- the focus on the observation data becomes clear, and the explanation of the abnormality is greatly improved.
- individual sensor signals are displayed and threshold values are set, correspondence with individual sensor signals representing physical quantities is easy and the physical meaning is easy to understand.
- a multivariate analysis method with a large computational load can also be implemented, enabling highly sensitive abnormality sign detection. Thereby, a weak abnormality can be detected at an early stage.
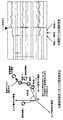
- FIG. 1 is an example of a multidimensional time series signal targeted by the anomaly detection system of the present invention.
- FIG. 2 is an example of an individual detection technique for performing abnormality detection by threshold processing of a multidimensional time series signal.
- FIG. 3 is a representative example of case-based abnormality detection.
- FIG. 4 is a diagram for explaining various feature conversions used for case-based abnormality detection.
- FIG. 5 is a block diagram of the abnormality detection system of the present invention.
- FIG. 6 is an explanatory diagram of role assignment.
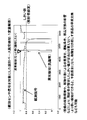
- FIG. 7 is an example of an observation signal, and is a diagram showing a result of detecting an abnormality with a certain threshold in the individual detection method.
- FIG. 8 is an explanatory diagram of a case-based abnormality detection technique using a plurality of classifiers.
- FIG. 1 is an example of a multidimensional time series signal targeted by the anomaly detection system of the present invention.
- FIG. 2 is an example of an individual detection technique for performing abnormality detection by threshold processing of
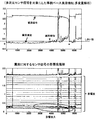
- FIG. 9 is a diagram showing a result of case-based abnormality detection.
- FIG. 10 shows an example in which threshold control is performed in the individual detection method so as to be the same as the result of case-based abnormality detection.
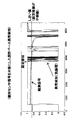
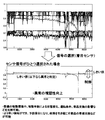
- FIG. 11 shows an example in which the observation signal is selected and the threshold value is controlled based on the result of the case-based abnormality detection.
- FIG. 12 shows the flow of the present invention.
- FIG. 13 shows the flow of the present invention.
- FIG. 14 shows another example of the influence degree according to the present invention.
- FIG. 15 illustrates one method of the subspace method of the present invention.
- FIG. 16 is a block diagram of the periphery of a processor that executes the present invention.
- FIG. 17 shows the overall configuration of the present invention.
- FIG. 18 shows a network between sensor signals according to the present invention.
- FIG. 19 shows the structure of abnormality detection and cause diagnosis according to the present invention.
- FIG. 20 shows an example of component information according to the present invention.
- FIG. 21 shows an example of a graphic user interface GUI according to the present invention.
- FIG. 22 is an explanatory diagram of (a) a technique for calculating the similarity of a deviation time series pattern and (b) a deviation signal of observation data corresponding to (a) of the technique for predicting the occurrence of an abnormality using a deviation time series pattern.
- FIG. 2 shows a method of detecting an abnormality using a multidimensional time series sensor signal as an input.
- the sensor signal is processed from various viewpoints based on the knowledge of what is abnormal with respect to the multidimensional time series sensor signal. For example, the sensor signal is differentiated at the filter processing in FIG. Alternatively, signals for a certain period may be added by integration processing. Furthermore, focusing on the frequency of the signal, it may be a process such as Fourier transform or Wavelet transform.
- the filtering process may be different or the same for each sensor signal.
- sensor signal normalization canonicalization
- the threshold is set based on design knowledge. That is, the threshold value is set in consideration of what is desired as the physical quantity represented by the sensor signal, what should be, the operating state of the facility, the environment, and the history. In other words, design-based anomaly detection. This design-based anomaly detection is easy to understand for designers or service personnel.
- the threshold value is visual and easy to set because it is based on a physical phenomenon. In other words, it is easy to apply design standards, such as the number of revolutions or pressure, and there is little entanglement with other sensor signals, and in many cases it can be considered independently and understand the phenomenon. Easy to set the signal range, upper and lower limits based on design criteria. On the other hand, an abnormality over a plurality of sensor signals has a demerit that it is difficult to identify the abnormality.
- FIG. 3 shows a method for detecting an anomaly based on a case base.
- outliers are extracted from the normal data by multivariate analysis.
- event data alarm information or the like
- learning data completeness evaluation
- FIG. 4 shows an example of feature conversion for reducing the dimension of the multidimensional time series signal used in FIG.
- principal component analysis several methods such as independent component analysis, non-negative matrix factorization, latent structure projection, and canonical correlation analysis are applicable.
- FIG. 4 shows the scheme and functions together.
- Principal component analysis is called PCA, and linearly transforms an M-dimensional multidimensional time-series signal into an r-dimensional multidimensional time-series signal having the number of dimensions r to generate an axis that maximizes variation.
- KL conversion may be used.
- the number of dimensions r is determined based on a value that is a cumulative contribution ratio obtained by arranging eigenvalues obtained by principal component analysis in descending order and dividing the eigenvalue added from the larger one by the sum of all eigenvalues.
- ICA Independent component analysis
- NMF Non-negative matrix factorization
- the method without the teacher is an effective conversion method when there are few abnormal cases and it cannot be used as in this embodiment.
- an example of linear transformation is shown. Nonlinear transformation is also applicable.
- the above-mentioned feature conversion is performed simultaneously with learning data and observation data arranged, including canonicalization normalized by standard deviation. In this way, learning data and observation data can be handled in the same row. Since sensor signals are converted by such feature conversion, it is difficult for designers or service personnel to understand abnormality detection based on case bases. The phenomenon is difficult to understand because it is entangled with other sensor signals and is not independent or individual. On the other hand, since outliers are extracted from normal data, there is a great merit that sensitivity is good.
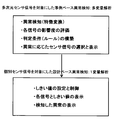
- FIG. 5 shows the abnormality detection method of the present invention.
- the upper part is the design-based abnormality detection for the individual sensor signal shown in FIG. 2, and the lower part is the abnormality detection based on the case base by the multivariate analysis of the multidimensional sensor signal shown in FIG.
- Anomaly detection based on the case base is configured to control the anomaly detection based on the design.
- Anomaly detection based on case base by multivariate analysis also inputs event data.
- Abnormality detection based on a case base by multivariate analysis of a multidimensional sensor signal selects a sensor signal and sets a threshold value according to various abnormalities. Specifically, abnormality detection (feature conversion), evaluation of the influence degree of each signal, construction of a determination condition (rule) for each type of abnormality, and selection and display of a sensor signal corresponding to the abnormality are performed.
- the design-based abnormality detection for the individual sensor signal receives the above and performs abnormality detection. Specifically, threshold setting and control, threshold display, abnormality detection and display are performed.
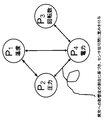
- FIG. 6 summarizes the basic idea of the present invention. Hereinafter, these ideas and operations will be further described.
- Fig. 7 shows an example of a sensor signal for design-based abnormality detection, a set threshold value, and an abnormality detection result.
- the threshold value is given by the designer. Since the sensor signal and the threshold value are one-to-one, it is easy to understand. It seems that the timing of abnormality detection is a little late. If it can be detected a little earlier, it will be preventive maintenance, and it will be possible to replace parts that cause failure early. The reason why the threshold value is not appropriate is that, for example, the operating environment of the equipment, the state change due to the operating years, the operating conditions, the influence of parts replacement, etc. are outside the range assumed by the designer.
- FIG. 8 shows an anomaly detection method based on a case base.
- 11 is a multidimensional time series signal acquisition unit
- 12 is a feature extraction / selection / conversion unit
- 13 is a classifier
- 14 is integrated (global anomaly measure)
- 15 is learning data mainly composed of normal cases. Show.
- the multidimensional time series signal input from the multidimensional time series signal acquisition unit 11 is reduced in dimension by the feature extraction / selection / conversion unit 12, identified by a plurality of classifiers 13, and integrated (global anomaly measure) 14.
- a global anomaly measure is determined.
- the learning data 15 mainly consisting of normal cases is also identified by the plurality of discriminators 13 and used for the determination of the global abnormality measure, and the learning data 15 consisting mainly of normal cases is also selected and stored and updated. As a result, the accuracy is improved.
- FIG. 8 also shows an operation PC on which a user inputs parameters.
- the user input parameters include data sampling intervals, observation data selection, abnormality determination threshold values, and the like.
- the data sampling interval indicates, for example, how many seconds the data is acquired.
- the selection of the observation data indicates which sensor signal is mainly used.
- the threshold value for abnormality determination is a threshold value for binarizing the value of abnormality expressed as a deviation / deviation from the model, an outlier value, a deviation degree, an abnormality measure, and the like.
- the plurality of discriminators 13 shown in FIG. 8 can prepare several discriminators (h1, h2,%) And take a majority vote (integration 14). That is, ensemble (group) learning using different classifier groups (h1, h2,...) Can be applied.
- the first classifier is a projection distance method
- the second classifier is a local subspace method
- the third classifier is a linear regression method. Any classifier can be applied as long as it is based on case data.
- FIG. 9 shows an example of the result of abnormality detection based on the case base.
- the sensor signal is the same as that shown in FIG. 7, but the anomaly measure calculated by multivariate analysis for the multidimensional time series sensor signal is displayed.
- the abnormality measure is obtained in FIG. 15 described later. According to this example, the abnormality detection time is considerably earlier than the design-based abnormality detection time.
- FIG. 10 is an example in which abnormality detection is accelerated by controlling the threshold value in FIG. In this case, it can be said that an appropriate abnormality was detected.
- the threshold setting is manual, artificial, and the basis for setting is unclear.
- FIG. 11 shows an example in which an abnormality is detected by using a result of anomaly detection based on a case base, selecting a sensor signal by using the degree of influence on the anomaly in the sensor signal, and then controlling a threshold value. It is. It reflects the operating environment of the equipment, changes in the status depending on the years of operation, operating conditions, effects of parts replacement, etc., and a basis for setting the threshold is also given. The visibility of abnormalities is also improved.
- the degree of divergence (similarity) between observation data and learning data is first calculated using the observation data, learning data, and event analysis results.
- Event data (such as alarm information) is used for selection of learning data, for example.
- the presence / absence of abnormality is determined based on the degree of difference (similarity) between the observation data and the learning data (threshold is set from the outside).
- the influence level of the abnormality is calculated.
- the observation data is identified using the average of the k-nearest neighbor data in each class and the distance of the observation data (referred to as LAC method). Thereby, the lower graph of FIG. 9 is obtained.
- the corresponding sensor signal is selected based on various abnormalities and the degree of influence of the abnormalities. In some cases, it is necessary to accumulate various abnormalities and the degree of influence of the abnormalities as a database.
- the abnormality detection result is used to control the threshold value for each original sensor signal. That is, the threshold value is controlled so that the sensitivity is almost the same.
- the graph shown in FIG. 11 is obtained. If the sensitivity is set so that it is not overlooked, there is a risk of false detection, but here this is OK.
- the same threshold value is set for the selected plurality of sensor signals. At this time, the threshold value is determined so as not to cause erroneous detection as much as possible by the majority decision or logical product of the abnormality detection of the plurality of selected sensor signals. These are displayed, and the abnormality detection result is also displayed.
- a logic such as majority decision or logical product of abnormality detection of a plurality of selected sensor signals becomes a determination condition (rule).
- Judgment condition Conditions such as majority or logical product of threshold processing result of selected sensor signal
- Each sensor signal represents a specific physical quantity such as cooling water temperature, pressure, generated current, generated voltage, etc. If thresholds can be set for each sensor signal, it is easy for designers to understand the physical limits that lead to abnormalities, and it is easy to visually understand abnormal phenomena, so that the operating principles of the equipment and physical phenomena can be handled. There is a big merit that it is easy to take. Determination conditions (rules) obtained for individual sensor signals are externally displayed or output.
- the abnormality detection result shown in FIG. 11 is displayed on a monitor or the like.
- case-based abnormality detection by multivariate analysis is often expressed by linear combination of a plurality of sensor signals. In this case, if it is a linear combination of the cooling water temperature and the generated current, the interpretation is difficult.
- the connection between sensor signals can be understood and a network can be constructed, but it is also a fact that there is a difference from the direct understanding of maintenance engineers and customers. Therefore, the derivation and clarification of the above judgment conditions are important in terms of how the event can be easily grasped as fluctuations in individual sensor signals, or whether the event can be explained with a small number of sensor signals. It becomes.
- Case-based anomaly detection by multivariate analysis for multidimensional sensor signals can be performed asynchronously with data sampling without having to be always linked (synchronized).
- a complex abnormality detection method that requires a large load and requires an abnormality detection processing time compared to the data sampling time can be installed and applied, and the sensitivity of abnormality detection can be further improved.
- fast sampling such as 1 ms cycle
- desynchronization is important.
- a deterioration type abnormality that does not require a processing speed only by detecting an abnormality on a daily basis, there is no problem even if synchronization is performed.
- FIG. 13 shows an example of the selected sensor signal.
- threshold values th1_l, th1_u, th2_l, th2_u, th3_u, th4_l, etc. are set for the selected sensor signals S1, S2, S3, S4 and the like.
- an abnormality is detected by a logical product of threshold processing results (binary logic) of each selected sensor signal. These are the determination conditions (rules) for abnormality detection.
- the thresholds th1_l, th1_u, th2_l, th2_u, th3_u, and th4_l are close to the same detection capability as that of abnormality detection by multivariate analysis.
- the sensitivity of abnormality detection improves the visibility, and facilitate the interpretation, but dealing with the type of abnormality becomes an issue. That is, the plurality of selected sensor signals are likely to be different depending on the type of abnormality. Therefore, based on past cases, for each type of abnormality, the sensor signal selection and the set threshold value are stored in the database and may be used. In this case, multiple selections and multiple thresholds are indicated.
- a database including such anomaly cases, sensor signal influence levels, selection results, and the like is used as an effective judgment material even in anomaly diagnosis.
- FIG. 14 shows another example of the evaluation of the influence level.
- the signal A is fluctuated, and a sign of abnormality has occurred.
- other sensor signals such as B, also show fluctuations.
- the influence of the signal B was determined to be large.
- the difference in the scale of the signal even if the canonicalization normalized by the standard deviation is applied, the scale of the signal is unlikely to be exactly the same. Normalization has become difficult.
- the influence degree of the signal B is not really large.
- the sensor signal can be selected in consideration of design information. Specifically, the design information is also used, a correction coefficient is set, a signal is selected by multiplying the degree of influence by the correction coefficient.
- FIG. 15 illustrates a general CLAFIC method for a selected sensor signal network. The deviation from the model is obtained. The case of 2 classes and 2D patterns is shown. A subspace of each class, that is, a subspace represented here as a one-dimensional straight line is obtained.
- eigenvalue decomposition is performed on the autocorrelation matrix of each class of data, and an eigenvector is obtained as a basis.
- the eigenvectors corresponding to the upper eigenvalues having a large value are used.
- the unknown pattern q (latest observation pattern) is classified into class A.
- class A is assumed to be a normal part, and an unknown pattern q (latest observed pattern) is changed to a class.
- the distance to A is determined and this is taken as the deviation. If the deviation is large, it is determined as an outlier.
- the influence is mitigated when the dimension is reduced and the subspace is made. This is an advantage of applying the subspace method.
- the center of gravity of each class is used as the origin.
- the eigenvector obtained by applying KL expansion to the covariance matrix of each class is used as a basis.
- Various subspace methods have been proposed, but if there is a distance scale, the degree of deviation can be calculated. In the case of the density, the degree of deviation can be determined based on the magnitude.
- the CLAFIC method is a similarity measure because the length of the orthogonal projection is obtained.
- Subspace methods such as the projection distance method are discriminators based on distance, and as a learning method when abnormal data can be used, vector quantization that updates dictionary patterns and metric learning that learns distance functions can be used. .
- k multidimensional time series signals close to an unknown pattern q (latest observation pattern), called a local subspace method, are obtained, and a linear manifold is generated such that the nearest neighbor pattern of each class is the origin, A method of classifying an unknown pattern into a class having a minimum projection distance to the linear manifold can also be applied (see the frame of the local subspace method in FIG. 8).
- Local subspace method is also a kind of subspace method.
- K is a parameter.
- the class A to which the majority of data belongs is regarded as a normal part, and the distance from the unknown pattern q (latest observation pattern) to the class A is obtained, This is the deviation.
- an orthogonal projection point from an unknown pattern q (latest observation pattern) to a partial space formed using k multidimensional time series signals can be calculated as an estimated value ( (The estimated value data described in the frame of the local subspace method in FIG. 8). It is also possible to rearrange the k multi-dimensional time series signals in the order closer to the unknown pattern q (latest observation pattern) and perform weighting inversely proportional to the distance to calculate the estimated value of each signal.
- the estimated value can be calculated in the same manner by the projection distance method or the like.
- the parameter k is usually set to one type, but if the parameter k is changed and executed several times, the target data will be selected according to the similarity, and it will be a comprehensive judgment from those results, so it will be more effective. It is. Furthermore, because the normal part is in various states including transitional periods such as equipment ON / OFF, for each observation data input, we decided to select learning data similar to the observation data based on the distance from the observation data. . Alternatively, the learning data may be sequentially increased from the minimum number to the selected number to select the one that minimizes the projection distance. This can also be applied to the projection distance method. In this case, the clustering shown in FIG. 8 becomes unnecessary. In the local subspace method, even if anomalous values are mixed slightly, the influence is greatly reduced when the local subspace is used.
- a classifier such as a one-class support vector machine is also applicable if it is simply considered as a problem of one-class identification.
- kernelization such as radial ⁇ basis function that maps to higher-order space can be used.
- the side close to the origin is an outlier, that is, an abnormality.
- the support vector machine can cope with a large dimension of the feature amount, there is a drawback that the calculation amount becomes enormous as the number of learning data increases.
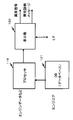
- FIG. 16 shows a hardware configuration of the abnormality detection system of the present invention.
- Sensor data such as a target engine is input to the processor 119 that performs abnormality detection, and the missing value is repaired and stored in the database DB 121.
- the processor 119 performs abnormality detection using the DB data including the acquired observation sensor data and learning data.
- the display unit 120 performs various displays and outputs the presence / absence of an abnormality signal and a message for explaining an abnormality described later. It is also possible to display a trend. The interpretation result of the event can also be displayed.
- the program installed therein can also be provided to the customer through a media medium or an online service.
- the database DB 121 can be operated by skilled engineers. In particular, abnormal cases and countermeasure cases can be taught and stored. (1) Learning data (normal), (2) abnormal data, (3) countermeasure contents are stored. By making the database DB a structure that can be manipulated by skilled engineers, a sophisticated and useful database can be created. Further, the data operation is performed by automatically moving learning data (individual data, the position of the center of gravity, etc.) with the occurrence of an alarm or part replacement. It is also possible to automatically add acquired data. If there is abnormal data, a method such as generalized vector quantization can be applied to the movement of the data.
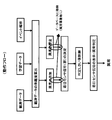
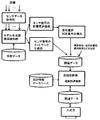
- FIG. 17 shows abnormality detection and diagnosis after abnormality detection.
- an abnormality is detected from the time-series signal from the facility by the feature extraction / classification 24 of the time-series signal.
- the equipment is not limited to one. Multiple facilities may be targeted.
- maintenance events such as alarms and work results for each equipment. Specifically, equipment start / stop, operating condition setting, various fault information, various warning information, periodic inspection information, operating environment such as installation temperature, operation, etc. Accompanying information such as accumulated time, parts replacement information, adjustment information, cleaning information, etc.) is captured, and abnormalities are detected with high sensitivity.
- Predictive detection is performed using the subspace method, etc., and event sequence matching is also used to determine whether or not it is a general predictor. Based on this predictor, abnormality diagnosis is performed to identify faulty candidate parts and when the relevant parts stop malfunctioning. Guess what will happen. Then, necessary parts are arranged at a necessary timing.
- the abnormality diagnosis 26 can be easily divided into a phenomenon diagnosis that identifies a sensor that contains a sign and a cause diagnosis that identifies a part that may cause a failure.
- the abnormality detection unit outputs information regarding the feature amount in addition to a signal indicating the presence / absence of abnormality to the abnormality diagnosis unit.
- the abnormality diagnosis unit makes a diagnosis based on this information.
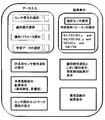
- FIG. 19 shows the configuration of the abnormality detection and cause diagnosis part.
- a sensor data acquisition unit that acquires data from a plurality of sensors, learning data that is substantially normal data, a model generation unit that models learning data, and the similarity between observation data and modeled learning data
- Abnormality detection unit that detects presence / absence of abnormality
- influence degree evaluation unit of sensor signal that evaluates the degree of influence of each signal
- sensor signal network generation unit that creates a network diagram showing the relevance of each sensor signal, abnormal cases, each sensor It consists of a related database consisting of signal influence levels, selection results, etc., a design information database if it is equipment design information, a cause diagnosis unit, a related database for storing diagnosis results, and input / output.
- the design information database also includes information other than design information. Taking the engine as an example, the model, model, components shown in FIG. 21, parts table (BOM), past maintenance information (on-call contents, error occurrences) Sensor signal data, adjustment date / time, captured image data, abnormal sound information, replacement part information, etc.), cause diagnosis tree (simple tree created by the designer. Branch by case to identify units and parts that need replacement), Includes operational status information, inspection data during transportation and installation.
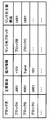
- the component shown in FIG. 20 is information related to a block of electrical parts.
- the feature of this configuration is that it uses a network representing the relevance of each sensor signal to link this with component information to support cause diagnosis.
- a network representing the relevance of each sensor signal generated from the degree of influence of the sensor signal serves as knowledge material for cause diagnosis.
- diagnosis based on connectivity between elements (ambiguous expressions) representing phenomena, parts, and treatments in a plurality of cases, a list of possible countermeasures is presented when a phenomenon occurs. Specifically, for example, in the case of a medical device, for a phenomenon such as a ghost occurring in an image, a cable representing a relevance of each sensor signal is connected to a cable that is a component element, and cable shielding processing is performed. Presented as one of the list of possible countermeasures.
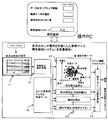
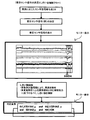
- FIG. 21 shows an example of a graphical user interface (GUI).
- GUI graphical user interface
- FIG. 22 is an explanatory diagram of an anomaly sign detection technique based on a deviation time series pattern.
- 22A shows a method for calculating the similarity of the deviation time series pattern
- FIG. 22B shows a deviation signal of observation data corresponding to FIG. 22A.
- the “0” point in the space of FIG. 22A corresponds to the normal center of gravity of each observation data obtained by the local subspace method shown in FIG. 8, and the sensor signal A, sensor signal B, and sensor signal at each time point. Deviation from the normal center of gravity of C is expressed as a trajectory in space.
- a deviation series of observation data that has passed time t-1, time t, and time t + 1 is indicated by a dotted line with an arrow.
- the similarity between observed data and abnormal cases can be estimated by calculating the inner product (A / B) of each deviation. It is also possible to divide the inner product (A ⁇ B) by the size (norm) and estimate the similarity by the angle ⁇ .
- FIG. 22A shows the deviation of the abnormal case A, the deviation of the abnormal case B, and the deviation of the abnormal case C. Looking at the deviation series pattern of the observation data indicated by the dotted line with the arrow, it is close to the abnormal case B at the time t, but from the trajectory, predict the occurrence of the abnormal case A, not the abnormal case B Can do.
- FIG. 22 shows a temporal transition of deviation signals of a plurality of observation data corresponding to the sensor signals A, B, C, etc. in (a) of FIG.
- an abnormal situation occurs in which the jacket water pressure decreases.
- t ⁇ 1, t, t + 1 a deviation signal of the observation data is detected, and the trajectory database.
- the degree of similarity of the time-series pattern of the trajectory data stored in can be calculated to detect a sign of occurrence of a specific abnormality.
- Anomalies can be detected from normal data. (2) Even if data collection is incomplete, highly accurate abnormality detection is possible. (3) Even if abnormal data is included, this effect can be tolerated. In addition to direct effects such as (4) It is easy for the user to visually grasp the abnormal phenomenon and to understand the phenomenon. (5) For designers, it is easy to visually grasp abnormal phenomena and easily deal with physical phenomena. (6) Engineer's knowledge can be utilized (7) Physical model can be used together, (8) There is a secondary effect that an abnormality detection method that requires a large calculation load and requires processing time can be applied.
- the present invention can be used for detecting abnormalities in plants and equipment.
- Multidimensional time series signal acquisition unit 12 Feature extraction / selection / conversion unit 13
- Discriminator 14 Integration (global anomaly measure) 15
- Learning data database mainly composed of normal cases 24 Feature extraction / classification of time series signal 25
- Predictive detection 26 Abnormal diagnosis 119
- Processor 120 Display unit 121 Database (DB)
Landscapes
- Engineering & Computer Science (AREA)
- Physics & Mathematics (AREA)
- General Physics & Mathematics (AREA)
- Computer Vision & Pattern Recognition (AREA)
- Data Mining & Analysis (AREA)
- Theoretical Computer Science (AREA)
- Automation & Control Theory (AREA)
- Artificial Intelligence (AREA)
- Evolutionary Computation (AREA)
- Evolutionary Biology (AREA)
- General Engineering & Computer Science (AREA)
- Bioinformatics & Computational Biology (AREA)
- Bioinformatics & Cheminformatics (AREA)
- Life Sciences & Earth Sciences (AREA)
- Testing And Monitoring For Control Systems (AREA)
- Management, Administration, Business Operations System, And Electronic Commerce (AREA)
Abstract
La présente invention se rapporte à un procédé et à un système de diagnostic et de détection d'anomalie qui peuvent construire des règles de condition de détermination d'une détection d'anomalie par rapport à une détection d'anomalie basée sur des cas au moyen d'une analyse à plusieurs variables d'un signal de capteur multidimensionnel, appliquer les règles pour une détection d'anomalie basée sur la conception de signaux de capteur individuels et exécuter de manière appropriée une définition et un contrôle des valeurs seuil pour une détection extrêmement sensible, précoce et bien visible des anomalies. La détection des anomalies basée sur des cas au moyen d'une analyse à plusieurs variables prime sur la détection des anomalies basée sur la conception. C'est-à-dire que (1) la détection des anomalies basée sur des cas effectue une sélection de signaux de capteur et une détection des anomalies selon les divers types d'anomalies. De façon précise, on effectue une détection d'anomalie (conversion de caractéristique), une évaluation du niveau d'effet de chaque signal, une construction des conditions de détermination (règles) et un affichage ainsi qu'une sélection des signaux de capteur correspondant à l'anomalie. (2) La détection des anomalies basée sur la conception pour des signaux de capteur individuel effectue une détection des anomalies après que la précédente détection a été effectuée. De façon précise, on effectue la définition et le contrôle des seuils, l'affichage des seuils ainsi que la détection et l'affichage des anomalies.
Priority Applications (2)
| Application Number | Priority Date | Filing Date | Title |
|---|---|---|---|
| EP10813558.3A EP2477086A4 (fr) | 2009-09-07 | 2010-06-16 | Procédé de diagnostic et de détection d'anomalie, système de diagnostic et de détection d'anomalie et programme de diagnostic et de détection d'anomalie |
| US13/384,463 US9483049B2 (en) | 2009-09-07 | 2010-06-16 | Anomaly detection and diagnosis/prognosis method, anomaly detection and diagnosis/prognosis system, and anomaly detection and diagnosis/prognosis program |
Applications Claiming Priority (2)
| Application Number | Priority Date | Filing Date | Title |
|---|---|---|---|
| JP2009206103A JP5363927B2 (ja) | 2009-09-07 | 2009-09-07 | 異常検知・診断方法、異常検知・診断システム、及び異常検知・診断プログラム |
| JP2009-206103 | 2009-09-07 |
Publications (1)
| Publication Number | Publication Date |
|---|---|
| WO2011027607A1 true WO2011027607A1 (fr) | 2011-03-10 |
Family
ID=43649157
Family Applications (1)
| Application Number | Title | Priority Date | Filing Date |
|---|---|---|---|
| PCT/JP2010/060232 Ceased WO2011027607A1 (fr) | 2009-09-07 | 2010-06-16 | Procédé de diagnostic et de détection d'anomalie, système de diagnostic et de détection d'anomalie et programme de diagnostic et de détection d'anomalie |
Country Status (4)
| Country | Link |
|---|---|
| US (1) | US9483049B2 (fr) |
| EP (1) | EP2477086A4 (fr) |
| JP (1) | JP5363927B2 (fr) |
| WO (1) | WO2011027607A1 (fr) |
Cited By (11)
| Publication number | Priority date | Publication date | Assignee | Title |
|---|---|---|---|---|
| US20120283991A1 (en) * | 2011-05-06 | 2012-11-08 | The Board of Trustees of the Leland Stanford, Junior, University | Method and System for Online Detection of Multi-Component Interactions in Computing Systems |
| CN110046562A (zh) * | 2019-04-01 | 2019-07-23 | 湖南大学 | 一种风电系统健康监测方法及装置 |
| CN110291476A (zh) * | 2017-02-17 | 2019-09-27 | 三菱日立电力系统株式会社 | 成套设备的诊断装置以及诊断方法 |
| CN110647837A (zh) * | 2019-09-19 | 2020-01-03 | 重庆工业职业技术学院 | 电梯曳引机特征数据收集分析方法和电梯曳引机 |
| CN110836786A (zh) * | 2019-11-19 | 2020-02-25 | 北京瑞莱智慧科技有限公司 | 机械故障监测方法、装置、系统、介质和计算设备 |
| CN112098850A (zh) * | 2020-09-21 | 2020-12-18 | 山东工商学院 | 基于sdo算法的锂离子电池电压故障诊断方法及系统 |
| CN114328075A (zh) * | 2021-09-09 | 2022-04-12 | 广东电网有限责任公司广州供电局 | 一种智能配电房传感器多维数据融合异常事件检测方法、系统及计算机可读存储介质 |
| CN116032668A (zh) * | 2023-03-29 | 2023-04-28 | 广东维信智联科技有限公司 | 一种计算机网络数据安全保密系统 |
| CN116798150A (zh) * | 2023-06-26 | 2023-09-22 | 深圳市每开创新科技有限公司 | 无源电子锁的硬件维护方法、装置及存储介质 |
| WO2024177748A1 (fr) * | 2023-02-21 | 2024-08-29 | Caterpillar Inc. | Systèmes et procédés de détection de machines engagées dans une activité anormale |
| CN119022856A (zh) * | 2024-10-25 | 2024-11-26 | 济南三越测试仪器有限公司 | 一种二维位移传感器数据有效性检测方法及系统 |
Families Citing this family (143)
| Publication number | Priority date | Publication date | Assignee | Title |
|---|---|---|---|---|
| JP5431235B2 (ja) | 2009-08-28 | 2014-03-05 | 株式会社日立製作所 | 設備状態監視方法およびその装置 |
| US8924162B2 (en) * | 2010-05-13 | 2014-12-30 | University Of Cincinnati | Turbine-to-turbine prognostics technique for wind farms |
| JP5547124B2 (ja) * | 2011-03-31 | 2014-07-09 | 公益財団法人鉄道総合技術研究所 | プログラム及び計測データ管理装置 |
| JP5553058B2 (ja) * | 2011-05-20 | 2014-07-16 | 日本電気株式会社 | 異常電波検出装置、異常電波検出方法および異常電波検出プログラム |
| JP5808605B2 (ja) * | 2011-08-17 | 2015-11-10 | 株式会社日立製作所 | 異常検知・診断方法、および異常検知・診断システム |
| US9659250B2 (en) | 2011-08-31 | 2017-05-23 | Hitachi Power Solutions Co., Ltd. | Facility state monitoring method and device for same |
| WO2013076927A1 (fr) * | 2011-11-24 | 2013-05-30 | パナソニック株式会社 | Appareil d'aide au diagnostic et procédé d'aide au diagnostic |
| JP5648157B2 (ja) | 2011-12-28 | 2015-01-07 | 株式会社日立ハイテクノロジーズ | 半導体製造装置 |
| JP5885563B2 (ja) * | 2012-03-30 | 2016-03-15 | 三菱電機株式会社 | プラント機器の経年劣化進行度合判定システム |
| CN102662390B (zh) * | 2012-04-26 | 2014-04-02 | 杭州电子科技大学 | 一种随机模糊故障特征融合的旋转机械设备故障诊断方法 |
| CN104487998B (zh) * | 2012-07-11 | 2018-04-27 | 株式会社日立制作所 | 类似故障事例检索装置以及检索方法 |
| JP5964450B2 (ja) * | 2012-11-29 | 2016-08-03 | 株式会社日立製作所 | ネットワークグラフ生成方法及び意思決定支援システム |
| JP6239230B2 (ja) * | 2012-12-05 | 2017-11-29 | 三菱日立パワーシステムズ株式会社 | タービンロータの製造方法 |
| JP6139149B2 (ja) * | 2013-01-29 | 2017-05-31 | 三菱重工業株式会社 | 解析方法および解析装置 |
| KR101554216B1 (ko) * | 2013-06-18 | 2015-09-18 | 삼성에스디에스 주식회사 | 시계열 형태의 센싱 데이터 배드 패턴 검증 방법 및 그 장치 |
| JP5530020B1 (ja) * | 2013-11-01 | 2014-06-25 | 株式会社日立パワーソリューションズ | 異常診断システム及び異常診断方法 |
| CN103617350B (zh) * | 2013-11-15 | 2016-09-28 | 杭州电子科技大学 | 一种基于诊断证据平滑更新的旋转机械设备故障诊断方法 |
| JP6216242B2 (ja) | 2013-12-13 | 2017-10-18 | 株式会社日立ハイテクノロジーズ | 異常検知方法およびその装置 |
| JP6364800B2 (ja) | 2014-02-10 | 2018-08-01 | オムロン株式会社 | 監視装置及び監視方法 |
| JP2015184942A (ja) | 2014-03-25 | 2015-10-22 | 株式会社日立ハイテクノロジーズ | 故障原因分類装置 |
| JP5751731B1 (ja) | 2014-05-23 | 2015-07-22 | 株式会社テイエルブイ | 蒸気使用設備の監視システム |
| US9984334B2 (en) | 2014-06-16 | 2018-05-29 | Mitsubishi Electric Research Laboratories, Inc. | Method for anomaly detection in time series data based on spectral partitioning |
| JP5943357B2 (ja) | 2014-09-17 | 2016-07-05 | インターナショナル・ビジネス・マシーンズ・コーポレーションInternational Business Machines Corporation | 検出装置、検出方法、およびプログラム |
| JP6547275B2 (ja) * | 2014-10-29 | 2019-07-24 | 株式会社リコー | 情報処理システム、情報処理装置、情報処理方法、及びプログラム |
| US20160291552A1 (en) * | 2014-11-18 | 2016-10-06 | Prophecy Sensors, Llc | System for rule management, predictive maintenance and quality assurance of a process and machine using reconfigurable sensor networks and big data machine learning |
| US10613046B2 (en) | 2015-02-23 | 2020-04-07 | Machinesense, Llc | Method for accurately measuring real-time dew-point value and total moisture content of a material |
| US20160313216A1 (en) | 2015-04-25 | 2016-10-27 | Prophecy Sensors, Llc | Fuel gauge visualization of iot based predictive maintenance system using multi-classification based machine learning |
| US10599982B2 (en) | 2015-02-23 | 2020-03-24 | Machinesense, Llc | Internet of things based determination of machine reliability and automated maintainenace, repair and operation (MRO) logs |
| US20160245279A1 (en) | 2015-02-23 | 2016-08-25 | Biplab Pal | Real time machine learning based predictive and preventive maintenance of vacuum pump |
| US10638295B2 (en) | 2015-01-17 | 2020-04-28 | Machinesense, Llc | System and method for turbomachinery preventive maintenance and root cause failure determination |
| US10648735B2 (en) | 2015-08-23 | 2020-05-12 | Machinesense, Llc | Machine learning based predictive maintenance of a dryer |
| US10481195B2 (en) | 2015-12-02 | 2019-11-19 | Machinesense, Llc | Distributed IoT based sensor analytics for power line diagnosis |
| US20160245686A1 (en) | 2015-02-23 | 2016-08-25 | Biplab Pal | Fault detection in rotor driven equipment using rotational invariant transform of sub-sampled 3-axis vibrational data |
| US10509695B1 (en) * | 2015-03-30 | 2019-12-17 | ThetaRay Ltd. | System and method for anomaly detection in dynamically evolving data using low rank matrix decomposition |
| JP6328071B2 (ja) * | 2015-03-31 | 2018-05-23 | 東芝メモリ株式会社 | 異常予兆検知システム及び半導体デバイスの製造方法 |
| JP5818337B1 (ja) * | 2015-04-13 | 2015-11-18 | 株式会社テイエルブイ | 蒸気使用設備の監視システム |
| JP6853617B2 (ja) * | 2015-07-14 | 2021-03-31 | 中国電力株式会社 | 故障予兆監視方法 |
| JP5845374B1 (ja) * | 2015-08-05 | 2016-01-20 | 株式会社日立パワーソリューションズ | 異常予兆診断システム及び異常予兆診断方法 |
| US11162912B2 (en) | 2015-09-11 | 2021-11-02 | KABUSHI Kl KAISHA TOSHIBA | Electronic apparatus, index calculating method, and computer program product |
| US20170090866A1 (en) * | 2015-09-25 | 2017-03-30 | Robert L. Vaughn | Universal sensor and/or sensor cluster to provide a detection pattern |
| JP6655926B2 (ja) * | 2015-09-25 | 2020-03-04 | 三菱重工業株式会社 | 異常診断システム |
| US11023284B2 (en) * | 2015-10-28 | 2021-06-01 | Qomplx, Inc. | System and method for optimization and load balancing of computer clusters |
| JP6588814B2 (ja) | 2015-12-17 | 2019-10-09 | 株式会社東芝 | 異常診断装置及び方法 |
| JP2017117089A (ja) * | 2015-12-22 | 2017-06-29 | ローム株式会社 | センサノード、センサネットワークシステム、および監視方法 |
| WO2017111072A1 (fr) | 2015-12-25 | 2017-06-29 | Ricoh Company, Ltd. | Dispositif de diagnostic, programme informatique et système de diagnostic |
| JP6156566B2 (ja) * | 2015-12-25 | 2017-07-05 | 株式会社リコー | 診断装置、診断方法、プログラムおよび診断システム |
| JP6597453B2 (ja) * | 2016-03-30 | 2019-10-30 | 株式会社Ihi | 異常診断方法、異常診断装置、及び異常診断プログラム |
| US20170284903A1 (en) * | 2016-03-30 | 2017-10-05 | Sas Institute Inc. | Monitoring machine health using multiple sensors |
| JP6840953B2 (ja) | 2016-08-09 | 2021-03-10 | 株式会社リコー | 診断装置、学習装置および診断システム |
| KR101863781B1 (ko) * | 2016-09-08 | 2018-06-01 | 두산중공업 주식회사 | 로터 진동 이상 감지 장치 및 방법 |
| WO2018073960A1 (fr) * | 2016-10-21 | 2018-04-26 | 日本電気株式会社 | Procédé d'affichage, dispositif d'affichage et programme |
| KR101720327B1 (ko) * | 2016-10-28 | 2017-03-28 | 한국지질자원연구원 | 수중 이상체의 위치 측정 장치 및 방법 |
| CN106569487B (zh) * | 2016-11-16 | 2019-02-26 | 北京理工大学 | 一种基于观测器的伺服系统的故障检测方法 |
| JP6675297B2 (ja) * | 2016-12-09 | 2020-04-01 | Dmg森精機株式会社 | 情報処理方法、情報処理システム、および情報処理装置 |
| JP6621395B2 (ja) * | 2016-12-12 | 2019-12-18 | 三菱重工業株式会社 | 評価装置、評価方法、コンピュータプログラム、及び記録媒体 |
| FR3061324B1 (fr) * | 2016-12-22 | 2019-05-31 | Electricite De France | Procede de caracterisation d'une ou plusieurs defaillances d'un systeme |
| JP6616791B2 (ja) * | 2017-01-04 | 2019-12-04 | 株式会社東芝 | 情報処理装置、情報処理方法およびコンピュータプログラム |
| JP6648747B2 (ja) * | 2017-01-13 | 2020-02-14 | Jfeスチール株式会社 | 異常原因特定方法および異常原因特定装置 |
| WO2018178082A1 (fr) | 2017-03-28 | 2018-10-04 | Shell Internationale Research Maatschappij B.V. | Procédé, dispositif informatique et système permettant de fournir une visualisation de mesures de capteur |
| US10908983B2 (en) * | 2017-03-31 | 2021-02-02 | Cae Inc. | Method and system for preventing an anomaly in a simulator |
| KR101926257B1 (ko) | 2017-05-15 | 2018-12-06 | 두산중공업 주식회사 | 이상 신호 복원 시스템 및 방법 |
| US11549491B2 (en) | 2017-06-14 | 2023-01-10 | Kk Wind Solutions A/S | Independent monitoring system for a wind turbine |
| US10737904B2 (en) | 2017-08-07 | 2020-08-11 | Otis Elevator Company | Elevator condition monitoring using heterogeneous sources |
| EP3699708B1 (fr) | 2017-10-16 | 2021-07-28 | Fujitsu Limited | Dispositif, procédé et programme de surveillance d'installations de production |
| US11232371B2 (en) | 2017-10-19 | 2022-01-25 | Uptake Technologies, Inc. | Computer system and method for detecting anomalies in multivariate data |
| US10503144B2 (en) * | 2017-10-24 | 2019-12-10 | Applied Materials, Inc. | Anomaly detection with correlation coeffiecients |
| JP6721563B2 (ja) | 2017-11-28 | 2020-07-15 | ファナック株式会社 | 数値制御装置 |
| CN108089126A (zh) * | 2017-12-04 | 2018-05-29 | 国网湖南省电力公司 | 调相机故障诊断方法、装置和设备 |
| US10921792B2 (en) | 2017-12-21 | 2021-02-16 | Machinesense Llc | Edge cloud-based resin material drying system and method |
| US11036715B2 (en) * | 2018-01-29 | 2021-06-15 | Microsoft Technology Licensing, Llc | Combination of techniques to detect anomalies in multi-dimensional time series |
| US11075925B2 (en) | 2018-01-31 | 2021-07-27 | EMC IP Holding Company LLC | System and method to enable component inventory and compliance in the platform |
| EP4708233A3 (fr) | 2018-02-08 | 2026-05-06 | GEOTAB Inc. | Surveillance télématique d'un état d'un composant de véhicule opérationnel |
| US11182987B2 (en) * | 2018-02-08 | 2021-11-23 | Geotab Inc. | Telematically providing remaining effective life indications for operational vehicle components |
| US10311703B1 (en) | 2018-02-09 | 2019-06-04 | Computational Systems, Inc. | Detection of spikes and faults in vibration trend data |
| US20190272209A1 (en) * | 2018-03-05 | 2019-09-05 | Kabushiki Kaisha Toshiba | System and method of resolution prediction for multifunction peripheral failures |
| US10754708B2 (en) | 2018-03-28 | 2020-08-25 | EMC IP Holding Company LLC | Orchestrator and console agnostic method to deploy infrastructure through self-describing deployment templates |
| US10795756B2 (en) | 2018-04-24 | 2020-10-06 | EMC IP Holding Company LLC | System and method to predictively service and support the solution |
| US11086738B2 (en) * | 2018-04-24 | 2021-08-10 | EMC IP Holding Company LLC | System and method to automate solution level contextual support |
| US11113395B2 (en) | 2018-05-24 | 2021-09-07 | General Electric Company | System and method for anomaly and cyber-threat detection in a wind turbine |
| CN109063886B (zh) * | 2018-06-12 | 2022-05-31 | 创新先进技术有限公司 | 一种异常检测方法、装置以及设备 |
| JP6456580B1 (ja) | 2018-06-14 | 2019-01-23 | 三菱電機株式会社 | 異常検知装置、異常検知方法及び異常検知プログラム |
| JP6636214B1 (ja) | 2018-06-18 | 2020-01-29 | 三菱電機株式会社 | 診断装置、診断方法及びプログラム |
| US10685283B2 (en) | 2018-06-26 | 2020-06-16 | Sas Institute Inc. | Demand classification based pipeline system for time-series data forecasting |
| US10560313B2 (en) | 2018-06-26 | 2020-02-11 | Sas Institute Inc. | Pipeline system for time-series data forecasting |
| US11216743B2 (en) | 2018-08-14 | 2022-01-04 | International Business Machines Corporation | Learning sparsity-constrained gaussian graphical models in anomaly detection |
| JP7040668B2 (ja) * | 2018-08-30 | 2022-03-23 | 日本電気株式会社 | 異常検出装置、方法、プログラム |
| US11599422B2 (en) | 2018-10-16 | 2023-03-07 | EMC IP Holding Company LLC | System and method for device independent backup in distributed system |
| JP6950670B2 (ja) * | 2018-12-12 | 2021-10-13 | 横河電機株式会社 | 検出装置、検出方法、および、検出プログラム |
| WO2020122287A1 (fr) * | 2018-12-13 | 2020-06-18 | 주식회사 알고리고 | Appareil et procédé d'identification de données anormales à l'aide d'un changement de distribution minuscule |
| JP7229018B2 (ja) * | 2018-12-28 | 2023-02-27 | Pacraft株式会社 | 不健全性予見装置、不健全性予見方法、プログラム、及びコンピュータ読み取り可能な記録媒体 |
| FR3093493B1 (fr) * | 2019-03-04 | 2021-04-09 | Commissariat Energie Atomique | Procédé de détection d’anomalie de matériel roulant exploitant un signal de déformation d’un support de rail |
| CN109948503B (zh) * | 2019-03-13 | 2023-05-23 | 东北大学 | 基于共享子空间多视角非负矩阵分解的工业故障检测方法 |
| US10862761B2 (en) | 2019-04-29 | 2020-12-08 | EMC IP Holding Company LLC | System and method for management of distributed systems |
| JP7397276B2 (ja) * | 2019-05-21 | 2023-12-13 | ダイキン工業株式会社 | 機器管理システム |
| US11301557B2 (en) | 2019-07-19 | 2022-04-12 | Dell Products L.P. | System and method for data processing device management |
| GB2586659B (en) * | 2019-09-02 | 2021-09-08 | Imrandd Ltd | Inspection related systems and methods |
| WO2021059302A2 (fr) * | 2019-09-27 | 2021-04-01 | Tata Consultancy Services Limited | Procédé et système pour diagnostiquer une anomalie dans une installation de fabrication |
| US11526790B2 (en) | 2019-09-27 | 2022-12-13 | Oracle International Corporation | Univariate anomaly detection in a sensor network |
| CN110673578B (zh) * | 2019-09-29 | 2022-07-08 | 华北电力大学(保定) | 故障劣化程度确定方法、装置、计算机设备及存储介质 |
| US11060885B2 (en) | 2019-09-30 | 2021-07-13 | Oracle International Corporation | Univariate anomaly detection in a sensor network |
| US10954919B1 (en) * | 2019-10-02 | 2021-03-23 | General Electric Company | Machine-learning model-based analytic for monitoring wind farm power performance |
| US20220341393A1 (en) * | 2019-10-02 | 2022-10-27 | General Electric Company | System and method for fusing multiple analytics of a wind turbine for improved efficiency |
| JP7350601B2 (ja) * | 2019-10-04 | 2023-09-26 | エヌ・ティ・ティ・コミュニケーションズ株式会社 | 情報処理装置、情報処理方法及び情報処理プログラム |
| US12088473B2 (en) | 2019-10-23 | 2024-09-10 | Aryaka Networks, Inc. | Method, device and system for enhancing predictive classification of anomalous events in a cloud-based application acceleration as a service environment |
| US11455554B2 (en) | 2019-11-25 | 2022-09-27 | International Business Machines Corporation | Trustworthiness of artificial intelligence models in presence of anomalous data |
| JP7493930B2 (ja) * | 2019-12-10 | 2024-06-03 | キヤノン株式会社 | 情報処理方法、情報処理装置、生産システム、プログラム、記録媒体 |
| JP7541660B2 (ja) * | 2020-01-06 | 2024-08-29 | 日本電気通信システム株式会社 | 自律移動装置、学習装置、異常検知方法、及びプログラム |
| US11221934B2 (en) | 2020-01-10 | 2022-01-11 | International Business Machines Corporation | Identifying anomalies in data during data outage |
| JP7434917B2 (ja) * | 2020-01-21 | 2024-02-21 | 日本電気株式会社 | 信号検出装置、センサネットワークシステム、信号検出方法、及び信号検出プログラム |
| DE102020201239A1 (de) | 2020-01-31 | 2021-08-05 | Rolls-Royce Deutschland Ltd & Co Kg | Sensorsystem und Verfahren zum Erkennen eines Zustands zumindest einer Maschine |
| DE102020201599A1 (de) | 2020-02-10 | 2021-08-12 | Robert Bosch Gesellschaft mit beschränkter Haftung | Verfahren und Einrichtung zum Bestimmen einer Performanceeigenschaft eines Produkts |
| US11216247B2 (en) | 2020-03-02 | 2022-01-04 | Oracle International Corporation | Automatic asset anomaly detection in a multi-sensor network |
| WO2021176460A1 (fr) * | 2020-03-03 | 2021-09-10 | Telefonaktiebolaget Lm Ericsson (Publ) | Heuristique de seuillage adaptatif pour détection d'anomalie |
| JP7443832B2 (ja) * | 2020-03-05 | 2024-03-06 | 株式会社デンソー | セキュリティ管理装置 |
| DE102020202869A1 (de) | 2020-03-06 | 2021-09-09 | Robert Bosch Gesellschaft mit beschränkter Haftung | Vorverarbeitungsverfahren zur Bereitstellung homogener Datenblöcke |
| JP7452171B2 (ja) * | 2020-03-26 | 2024-03-19 | トヨタ自動車株式会社 | 異音の発生箇所特定方法 |
| JP7395409B2 (ja) * | 2020-04-03 | 2023-12-11 | 日立造船株式会社 | 異常検出装置、水門システムおよび異常検出方法 |
| JP7466652B2 (ja) * | 2020-07-28 | 2024-04-12 | 川崎重工業株式会社 | 状態監視装置、状態異常判別方法及び状態異常判別プログラム |
| US20220035334A1 (en) * | 2020-07-29 | 2022-02-03 | Abb Schweiz Ag | Technologies for producing training data for identifying degradation of physical components |
| CN111859815B (zh) * | 2020-07-31 | 2023-05-23 | 中国汽车工程研究院股份有限公司 | 一种电池报警特征数据的模式聚类方法与事故特征识别技术 |
| US11748568B1 (en) | 2020-08-07 | 2023-09-05 | Amazon Technologies, Inc. | Machine learning-based selection of metrics for anomaly detection |
| JP7541182B2 (ja) * | 2020-08-21 | 2024-08-27 | リアルタイムテック カンパニー,リミテッド | ディープラーニングベースのリアルタイム工程監視システム及びその方法 |
| EP4137901A4 (fr) * | 2020-08-21 | 2024-04-24 | Realtimetech Co., Ltd. | Système de surveillance de processus en temps réel à base d'apprentissage profond et procédé associé |
| JP7395443B2 (ja) * | 2020-08-25 | 2023-12-11 | 日立造船株式会社 | 異常検出装置、水門システムおよび異常検出方法 |
| US12265446B1 (en) | 2020-09-24 | 2025-04-01 | Amazon Technologies, Inc. | Multi-factor anomaly detection for application execution environments |
| US11762956B2 (en) | 2021-02-05 | 2023-09-19 | Oracle International Corporation | Adaptive pattern recognition for a sensor network |
| JP7811936B2 (ja) * | 2021-03-29 | 2026-02-06 | 川崎重工業株式会社 | ロボット故障予兆検出装置及びロボット故障予兆検出方法 |
| US11943242B2 (en) | 2021-03-31 | 2024-03-26 | Honda Motor Co. Ltd. | Deep automation anomaly detection |
| JP7641538B2 (ja) * | 2021-04-05 | 2025-03-07 | 千代田化工建設株式会社 | 異常検知装置、異常検知プログラム、及び学習装置 |
| US11790081B2 (en) | 2021-04-14 | 2023-10-17 | General Electric Company | Systems and methods for controlling an industrial asset in the presence of a cyber-attack |
| US12034741B2 (en) | 2021-04-21 | 2024-07-09 | Ge Infrastructure Technology Llc | System and method for cyberattack detection in a wind turbine control system |
| US11649804B2 (en) | 2021-06-07 | 2023-05-16 | General Electric Renovables Espana, S.L. | Systems and methods for controlling a wind turbine |
| US12180936B2 (en) | 2021-07-28 | 2024-12-31 | General Electric Renovables Espana, S.L. | Systems and methods for operating a wind farm |
| JP7717549B2 (ja) * | 2021-09-15 | 2025-08-04 | 株式会社東芝 | 監視装置、方法およびプログラム |
| US12560150B2 (en) | 2021-10-07 | 2026-02-24 | GE Vernova Renovables Espana, S.L. | Systems and methods for controlling a wind turbine |
| CN114004263B (zh) * | 2021-12-29 | 2022-05-03 | 四川大学 | 一种特征融合转换的大型设备工况诊断预测方法 |
| JP2024047171A (ja) * | 2022-09-26 | 2024-04-05 | 川崎重工業株式会社 | 要因分析装置及び要因分析方法 |
| CN115687976B (zh) * | 2022-10-31 | 2025-09-02 | 中南大学 | 一种故障诊断方法、系统及存储介质 |
| JP7731940B2 (ja) * | 2023-07-11 | 2025-09-01 | 株式会社Screenホールディングス | 吐出圧力監視装置、吐出圧力監視方法、コンピュータプログラム、および塗布装置 |
| US12510052B1 (en) | 2024-06-27 | 2025-12-30 | GE Vernova Renovables Espana, S.L. | System and method for optimizing control of a wind turbine |
| CN118673447B (zh) * | 2024-08-22 | 2024-12-27 | 西安尔吉环保科技有限公司 | 一种基于水土保持监督检查大数据的水土流失评估方法 |
| CN119831398A (zh) * | 2024-12-02 | 2025-04-15 | 广州继善建筑技术有限公司 | 一种基于多传感器融合的建筑质量检测方法 |
| DE102025106898B3 (de) | 2025-02-24 | 2026-04-23 | Sew-Eurodrive Gmbh & Co Kg | Verfahren und System zur Bewertung einer technischen Anlage |
Citations (13)
| Publication number | Priority date | Publication date | Assignee | Title |
|---|---|---|---|---|
| JPH0545186A (ja) * | 1991-08-16 | 1993-02-23 | Mitsubishi Electric Corp | 事例に基づく設備故障診断装置 |
| JPH06295271A (ja) * | 1993-04-07 | 1994-10-21 | Fuji Photo Film Co Ltd | 画像合成出力装置 |
| JPH07160327A (ja) * | 1993-12-06 | 1995-06-23 | Komatsu Ltd | 計測値判定方法 |
| US6216066B1 (en) | 1998-07-01 | 2001-04-10 | General Electric Company | System and method for generating alerts through multi-variate data assessment |
| JP2002099323A (ja) * | 2000-09-22 | 2002-04-05 | Hitachi Ltd | 半導体製造装置のリモート診断システム及びリモート診断方法 |
| JP2002139377A (ja) * | 2000-10-30 | 2002-05-17 | Hitachi Eng Co Ltd | 機器異常診断装置 |
| US6952662B2 (en) | 2000-03-30 | 2005-10-04 | Smartsignal Corporation | Signal differentiation system using improved non-linear operator |
| US6975962B2 (en) | 2001-06-11 | 2005-12-13 | Smartsignal Corporation | Residual signal alert generation for condition monitoring using approximated SPRT distribution |
| JP2006053818A (ja) * | 2004-08-13 | 2006-02-23 | Kagawa Univ | データ処理方法及びデータ処理装置、並びに診断方法及び診断装置 |
| JP2006106870A (ja) * | 2004-09-30 | 2006-04-20 | Toshiba Corp | プロセス管理装置 |
| JP2007334756A (ja) * | 2006-06-16 | 2007-12-27 | National Institute Of Advanced Industrial & Technology | 異常動作検出装置および異常動作検出方法 |
| JP2008256981A (ja) * | 2007-04-05 | 2008-10-23 | Fuji Xerox Co Ltd | 故障診断システム |
| JP2009070071A (ja) * | 2007-09-12 | 2009-04-02 | Toshiba Corp | 学習型プロセス異常診断装置、およびオペレータ判断推測結果収集装置 |
Family Cites Families (7)
| Publication number | Priority date | Publication date | Assignee | Title |
|---|---|---|---|---|
| KR960016138B1 (ko) * | 1988-06-17 | 1996-12-04 | 가부시기가이샤 히다찌세이꾸쇼 | 지식정보생성 시스템 |
| JP3221184B2 (ja) * | 1993-10-13 | 2001-10-22 | 株式会社日立製作所 | 故障診断装置および方法 |
| JP2953613B2 (ja) * | 1997-04-04 | 1999-09-27 | 川崎重工業株式会社 | 各種プラントの監視・診断方法 |
| JP4046309B2 (ja) * | 1999-03-12 | 2008-02-13 | 株式会社東芝 | プラント監視装置 |
| US6618692B2 (en) | 2000-09-20 | 2003-09-09 | Hitachi, Ltd. | Remote diagnostic system and method for semiconductor manufacturing equipment |
| JP2006343063A (ja) * | 2005-06-10 | 2006-12-21 | Daikin Ind Ltd | 設備機器の異常予知システム、設備機器の異常予知装置および設備機器の異常予知方法 |
| US8051021B2 (en) * | 2006-09-12 | 2011-11-01 | International Business Machines Corporation | System and method for resource adaptive classification of data streams |
-
2009
- 2009-09-07 JP JP2009206103A patent/JP5363927B2/ja not_active Expired - Fee Related
-
2010
- 2010-06-16 US US13/384,463 patent/US9483049B2/en not_active Expired - Fee Related
- 2010-06-16 EP EP10813558.3A patent/EP2477086A4/fr not_active Withdrawn
- 2010-06-16 WO PCT/JP2010/060232 patent/WO2011027607A1/fr not_active Ceased
Patent Citations (13)
| Publication number | Priority date | Publication date | Assignee | Title |
|---|---|---|---|---|
| JPH0545186A (ja) * | 1991-08-16 | 1993-02-23 | Mitsubishi Electric Corp | 事例に基づく設備故障診断装置 |
| JPH06295271A (ja) * | 1993-04-07 | 1994-10-21 | Fuji Photo Film Co Ltd | 画像合成出力装置 |
| JPH07160327A (ja) * | 1993-12-06 | 1995-06-23 | Komatsu Ltd | 計測値判定方法 |
| US6216066B1 (en) | 1998-07-01 | 2001-04-10 | General Electric Company | System and method for generating alerts through multi-variate data assessment |
| US6952662B2 (en) | 2000-03-30 | 2005-10-04 | Smartsignal Corporation | Signal differentiation system using improved non-linear operator |
| JP2002099323A (ja) * | 2000-09-22 | 2002-04-05 | Hitachi Ltd | 半導体製造装置のリモート診断システム及びリモート診断方法 |
| JP2002139377A (ja) * | 2000-10-30 | 2002-05-17 | Hitachi Eng Co Ltd | 機器異常診断装置 |
| US6975962B2 (en) | 2001-06-11 | 2005-12-13 | Smartsignal Corporation | Residual signal alert generation for condition monitoring using approximated SPRT distribution |
| JP2006053818A (ja) * | 2004-08-13 | 2006-02-23 | Kagawa Univ | データ処理方法及びデータ処理装置、並びに診断方法及び診断装置 |
| JP2006106870A (ja) * | 2004-09-30 | 2006-04-20 | Toshiba Corp | プロセス管理装置 |
| JP2007334756A (ja) * | 2006-06-16 | 2007-12-27 | National Institute Of Advanced Industrial & Technology | 異常動作検出装置および異常動作検出方法 |
| JP2008256981A (ja) * | 2007-04-05 | 2008-10-23 | Fuji Xerox Co Ltd | 故障診断システム |
| JP2009070071A (ja) * | 2007-09-12 | 2009-04-02 | Toshiba Corp | 学習型プロセス異常診断装置、およびオペレータ判断推測結果収集装置 |
Non-Patent Citations (3)
| Title |
|---|
| See also references of EP2477086A4 |
| STEPHAN W. WEGERICH: "Nonparametric modeling of vibration signal features for equipment health monitoring", AEROSPACE CONFERENCE, 2003. PROCEEDINGS. 2003 IEEE, vol. 7, 2003, pages 3113 - 3121, XP055231408, DOI: doi:10.1109/AERO.2003.1234154 |
| YOSHITERU ISHIDA: "Sensor Diagnosis of Process Plants by an Immune-Based Model", SYSTEMS, CONTROL AND INFORMATION, vol. 38, no. 1, 15 January 1994 (1994-01-15), pages 4 - 7, XP008150083 * |
Cited By (16)
| Publication number | Priority date | Publication date | Assignee | Title |
|---|---|---|---|---|
| US20120283991A1 (en) * | 2011-05-06 | 2012-11-08 | The Board of Trustees of the Leland Stanford, Junior, University | Method and System for Online Detection of Multi-Component Interactions in Computing Systems |
| CN110291476A (zh) * | 2017-02-17 | 2019-09-27 | 三菱日立电力系统株式会社 | 成套设备的诊断装置以及诊断方法 |
| CN110046562B (zh) * | 2019-04-01 | 2021-01-26 | 湖南大学 | 一种风电系统健康监测方法及装置 |
| CN110046562A (zh) * | 2019-04-01 | 2019-07-23 | 湖南大学 | 一种风电系统健康监测方法及装置 |
| CN110647837A (zh) * | 2019-09-19 | 2020-01-03 | 重庆工业职业技术学院 | 电梯曳引机特征数据收集分析方法和电梯曳引机 |
| CN110647837B (zh) * | 2019-09-19 | 2022-03-15 | 重庆工业职业技术学院 | 电梯曳引机特征数据收集分析方法和电梯曳引机 |
| CN110836786A (zh) * | 2019-11-19 | 2020-02-25 | 北京瑞莱智慧科技有限公司 | 机械故障监测方法、装置、系统、介质和计算设备 |
| CN110836786B (zh) * | 2019-11-19 | 2020-10-23 | 北京瑞莱智慧科技有限公司 | 机械故障监测方法、装置、系统、介质和计算设备 |
| CN112098850A (zh) * | 2020-09-21 | 2020-12-18 | 山东工商学院 | 基于sdo算法的锂离子电池电压故障诊断方法及系统 |
| CN112098850B (zh) * | 2020-09-21 | 2024-03-08 | 山东工商学院 | 基于sdo算法的锂离子电池电压故障诊断方法及系统 |
| CN114328075A (zh) * | 2021-09-09 | 2022-04-12 | 广东电网有限责任公司广州供电局 | 一种智能配电房传感器多维数据融合异常事件检测方法、系统及计算机可读存储介质 |
| WO2024177748A1 (fr) * | 2023-02-21 | 2024-08-29 | Caterpillar Inc. | Systèmes et procédés de détection de machines engagées dans une activité anormale |
| CN116032668A (zh) * | 2023-03-29 | 2023-04-28 | 广东维信智联科技有限公司 | 一种计算机网络数据安全保密系统 |
| CN116032668B (zh) * | 2023-03-29 | 2023-09-15 | 广东维信智联科技有限公司 | 一种计算机网络数据安全保密系统 |
| CN116798150A (zh) * | 2023-06-26 | 2023-09-22 | 深圳市每开创新科技有限公司 | 无源电子锁的硬件维护方法、装置及存储介质 |
| CN119022856A (zh) * | 2024-10-25 | 2024-11-26 | 济南三越测试仪器有限公司 | 一种二维位移传感器数据有效性检测方法及系统 |
Also Published As
| Publication number | Publication date |
|---|---|
| US20120166142A1 (en) | 2012-06-28 |
| EP2477086A4 (fr) | 2016-05-04 |
| EP2477086A1 (fr) | 2012-07-18 |
| JP2011059790A (ja) | 2011-03-24 |
| US9483049B2 (en) | 2016-11-01 |
| JP5363927B2 (ja) | 2013-12-11 |
Similar Documents
| Publication | Publication Date | Title |
|---|---|---|
| JP5363927B2 (ja) | 異常検知・診断方法、異常検知・診断システム、及び異常検知・診断プログラム | |
| JP5538597B2 (ja) | 異常検知方法及び異常検知システム | |
| JP5301310B2 (ja) | 異常検知方法及び異常検知システム | |
| JP5048625B2 (ja) | 異常検知方法及びシステム | |
| JP5501903B2 (ja) | 異常検知方法及びそのシステム | |
| Jiang et al. | Performance supervised plant-wide process monitoring in industry 4.0: A roadmap | |
| JP2011145846A (ja) | 異常検知方法、異常検知システム、及び異常検知プログラム | |
| Khelif et al. | Direct remaining useful life estimation based on support vector regression | |
| JP5439265B2 (ja) | 異常検知・診断方法、異常検知・診断システム、及び異常検知・診断プログラム | |
| JP5778305B2 (ja) | 異常検知方法及びそのシステム | |
| JP5498540B2 (ja) | 異常検知方法及びシステム | |
| JP5431235B2 (ja) | 設備状態監視方法およびその装置 | |
| JP5808605B2 (ja) | 異常検知・診断方法、および異常検知・診断システム | |
| JP2015172945A (ja) | 設備状態監視方法およびその装置 | |
| JP2012137934A (ja) | 異常検知・診断方法、異常検知・診断システム、及び異常検知・診断プログラム並びに企業資産管理・設備資産管理システム | |
| JP2014056598A (ja) | 異常検知方法及びそのシステム | |
| Cohen et al. | Fault diagnosis of timed event systems: An exploration of machine learning methods | |
| CN121559309A (zh) | 电网资产全寿命断路器机械特性迁移学习诊断系统 | |
| Medon | A Framework for a Predictive Manitenance Tool Articulated with a Manufacturing Execution System |
Legal Events
| Date | Code | Title | Description |
|---|---|---|---|
| 121 | Ep: the epo has been informed by wipo that ep was designated in this application |
Ref document number: 10813558 Country of ref document: EP Kind code of ref document: A1 |
|
| WWE | Wipo information: entry into national phase |
Ref document number: 13384463 Country of ref document: US Ref document number: 2010813558 Country of ref document: EP |
|
| NENP | Non-entry into the national phase |
Ref country code: DE |