WO2015152307A1 - Système et procédé d'inspection - Google Patents
Système et procédé d'inspection Download PDFInfo
- Publication number
- WO2015152307A1 WO2015152307A1 PCT/JP2015/060277 JP2015060277W WO2015152307A1 WO 2015152307 A1 WO2015152307 A1 WO 2015152307A1 JP 2015060277 W JP2015060277 W JP 2015060277W WO 2015152307 A1 WO2015152307 A1 WO 2015152307A1
- Authority
- WO
- WIPO (PCT)
- Prior art keywords
- image data
- inspected
- time correlation
- stripe
- inspection
- Prior art date
- Legal status (The legal status is an assumption and is not a legal conclusion. Google has not performed a legal analysis and makes no representation as to the accuracy of the status listed.)
- Ceased
Links
Images










Classifications
-
- G—PHYSICS
- G01—MEASURING; TESTING
- G01N—INVESTIGATING OR ANALYSING MATERIALS BY DETERMINING THEIR CHEMICAL OR PHYSICAL PROPERTIES
- G01N21/00—Investigating or analysing materials by the use of optical means, i.e. using sub-millimetre waves, infrared, visible or ultraviolet light
- G01N21/84—Systems specially adapted for particular applications
- G01N21/88—Investigating the presence of flaws or contamination
- G01N21/8806—Specially adapted optical and illumination features
-
- G—PHYSICS
- G01—MEASURING; TESTING
- G01N—INVESTIGATING OR ANALYSING MATERIALS BY DETERMINING THEIR CHEMICAL OR PHYSICAL PROPERTIES
- G01N21/00—Investigating or analysing materials by the use of optical means, i.e. using sub-millimetre waves, infrared, visible or ultraviolet light
- G01N21/84—Systems specially adapted for particular applications
- G01N21/88—Investigating the presence of flaws or contamination
- G01N21/8851—Scan or image signal processing specially adapted therefor, e.g. for scan signal adjustment, for detecting different kinds of defects, for compensating for structures, markings, edges
-
- G—PHYSICS
- G01—MEASURING; TESTING
- G01N—INVESTIGATING OR ANALYSING MATERIALS BY DETERMINING THEIR CHEMICAL OR PHYSICAL PROPERTIES
- G01N21/00—Investigating or analysing materials by the use of optical means, i.e. using sub-millimetre waves, infrared, visible or ultraviolet light
- G01N21/84—Systems specially adapted for particular applications
- G01N21/88—Investigating the presence of flaws or contamination
- G01N21/8806—Specially adapted optical and illumination features
- G01N2021/8829—Shadow projection or structured background, e.g. for deflectometry
-
- G—PHYSICS
- G01—MEASURING; TESTING
- G01N—INVESTIGATING OR ANALYSING MATERIALS BY DETERMINING THEIR CHEMICAL OR PHYSICAL PROPERTIES
- G01N2201/00—Features of devices classified in G01N21/00
- G01N2201/06—Illumination; Optics
- G01N2201/062—LED's
- G01N2201/0625—Modulated LED
-
- G—PHYSICS
- G01—MEASURING; TESTING
- G01N—INVESTIGATING OR ANALYSING MATERIALS BY DETERMINING THEIR CHEMICAL OR PHYSICAL PROPERTIES
- G01N2201/00—Features of devices classified in G01N21/00
- G01N2201/06—Illumination; Optics
- G01N2201/063—Illuminating optical parts
- G01N2201/0634—Diffuse illumination
Definitions
- Embodiments described herein relate generally to an inspection system and an inspection method.
- the imaged image data does not include information regarding the time transition when the light intensity is changed. For this reason, when detecting an abnormality of the object to be inspected with the captured image data, the detection accuracy may be lowered.
- the inspection system includes a planar illumination unit that gives a periodic temporal change in light intensity by spatial movement of a stripe pattern of light intensity, and a time correlation camera or an imaging system that performs an equivalent operation.
- a time correlation image generating unit that generates a time correlation image, and a feature corresponding to the distribution of the normal vector of the inspection target surface from the time correlation image, depending on at least one of a difference from the surroundings and a difference from the reference surface
- an arithmetic processing unit for calculating a feature for detecting an abnormality.
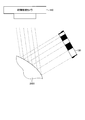
- FIG. 1 is a diagram illustrating a configuration example of an inspection system according to the first embodiment.
- FIG. 2 is a block diagram showing the configuration of the time correlation camera of the first embodiment.
- FIG. 3 is a conceptual diagram showing frames accumulated in time series in the time correlation camera of the first embodiment.
- FIG. 4 is a diagram illustrating an example of a fringe pattern irradiated by the illumination device of the first embodiment.
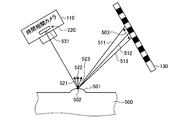
- FIG. 5 is a diagram illustrating a first detection example of abnormality of an object to be inspected by the time correlation camera according to the first embodiment.
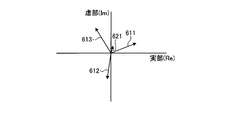
- FIG. 6 is a diagram showing an example of the amplitude of light that changes in accordance with the abnormality when the abnormality shown in FIG. FIG.
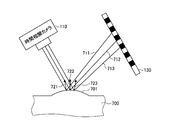
- FIG. 7 is a diagram illustrating a second example of detection of abnormality of the inspected object by the time correlation camera according to the first embodiment.
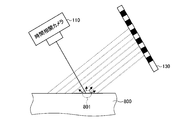
- FIG. 8 is a diagram illustrating a third example of detection of abnormality of an object to be inspected by the time correlation camera of the first embodiment.
- FIG. 9 is a diagram illustrating an example of a fringe pattern output from the illumination control unit according to the first embodiment to the illumination device.
- FIG. 10 is a diagram illustrating an example of a wave shape representing a stripe pattern after passing through the screen of the first embodiment.
- FIG. 11 is a flowchart illustrating a procedure of abnormality detection processing based on amplitude in the abnormality detection processing unit of the first embodiment.
- FIG. 12 is a flowchart illustrating a procedure of an abnormality detection process based on a phase in the abnormality detection processing unit of the first embodiment.
- FIG. 13 is a flowchart illustrating a procedure of abnormality detection processing based on amplitude and intensity in the abnormality detection processing unit of the first embodiment.
- FIG. 14 is a flowchart illustrating a procedure of an inspection process for an object to be inspected in the inspection system of the first embodiment.
- FIG. 15 is a diagram illustrating a switching example of a fringe pattern output from the illumination control unit according to the second modification.
- FIG. 16 is a diagram illustrating an example in which the illumination control unit of Modification 2 irradiates the surface including the abnormality (defect) with a stripe pattern.
- FIG. 17 is a diagram showing the relationship between the abnormality (defect) and the stripe pattern on the screen when the stripe pattern is changed in the y direction.
- FIG. 18 is a diagram illustrating an example of a fringe pattern output from the illumination control unit of Modification 3 to the illumination device.
- FIG. 19 is a diagram illustrating an example of a fringe pattern output from the illumination control unit according to the second embodiment to the illumination device.
- FIG. 20 is a diagram illustrating a correspondence relationship among the image sensor, the screen, and the surface shape of the object to be inspected in the inspection system of the second embodiment.
- FIG. 21 is a diagram illustrating an example of the surface shape of the object to be inspected when the second-order differential f xx ⁇ 0, which is an inspection target of the inspection system according to the second embodiment.
- FIG. 22 is a diagram illustrating an example of the surface shape of an object to be inspected when f xx > 0, which is an inspection target of the inspection system according to the second embodiment.
- FIG. 23 is a graph showing g / p when the stripe width in the stripe pattern is variously changed.
- FIG. 24 is a diagram illustrating an example of an amplitude ratio correspondence table used by the inspection system of the second embodiment.
- FIG. 25 is a diagram illustrating an example in which a fringe pattern according to the surface shape of the object to be inspected is irradiated from the screen by the inspection system of the third embodiment.
- FIG. 26 is a flowchart illustrating a procedure of an inspection process for an object to be inspected in the inspection system of the third embodiment.
- FIG. 27 is a diagram illustrating an example of a fringe pattern displayed on the screen by the illumination device of the third embodiment.
- FIG. 28 is a diagram showing an example in which the initial phase distribution (spatial phase distribution) on the surface of the object to be inspected or the screen for generating the stripe pattern of FIG.
- FIG. 29 shows an example of a fringe pattern projected on a spherical object to be inspected, and as shown in FIG. 25, the fringe pattern is a parallel fringe that moves in the line of sight from the time correlation camera.
- FIG. 28 is a diagram showing an example in which the initial phase distribution (spatial phase distribution) on the surface of the object to be inspected or the screen for generating the stripe pattern of FIG.
- FIG. 29 shows an example of a fringe pattern projected on a spherical object to be inspected, and as shown in FIG. 25, the fringe pattern is a parallel fringe that moves in the line of sight from the time correlation camera.
- FIG. 1 is a diagram illustrating a configuration example of an inspection system according to the present embodiment.
- the inspection system of this embodiment includes a PC 100, a time correlation camera 110, a lighting device 120, a screen 130, and an arm 140.
- the arm 140 is used to fix the object 150 to be inspected, and changes the position and orientation of the surface of the object 150 to be imaged by the time correlation camera 110 according to control from the PC 100.
- the illumination device 120 is a device that irradiates light to the object 150 to be inspected, and can control the intensity of irradiated light in units of regions in accordance with a stripe pattern from the PC 100. Furthermore, the illuminating device 120 can control the intensity
- the screen 130 diffuses the light output from the lighting device 120 and then irradiates the object 150 with light on a surface.
- the screen 130 according to the present embodiment irradiates the object 150 in a surface with the light input from the illumination device 120 and subjected to periodic time change and space change.
- An optical system component such as a condensing Fresnel lens may be provided between the illumination device 120 and the screen 130.
- the illumination unit may be configured by arranging LEDs in a plane.
- the time correlation camera 110 includes an optical system 210, an image sensor 220, a data buffer 230, a control unit 240, and a reference signal output unit 250.
- FIG. 2 is a block diagram showing the configuration of the time correlation camera 110 of the present embodiment.
- the optical system 210 includes a photographic lens and the like, transmits a light beam from a subject (including an object to be inspected) outside the time correlation camera 110, and forms an optical image of the subject formed by the light beam.
- the image sensor 220 is a sensor that can output the intensity of light incident through the optical system 210 as a light intensity signal at high speed for each pixel.
- the light intensity signal of the present embodiment is a signal obtained by the illumination device 120 of the inspection system irradiating light on the subject (including the object to be inspected) and the image sensor 220 receiving the reflected light from the subject.
- the image sensor 220 is, for example, a sensor that can be read out at a higher speed than a conventional sensor, and has a two-dimensional planar shape in which pixels are arranged in two kinds of directions: a row direction (x direction) and a column direction (y direction). It shall be configured.
- Each pixel of the image sensor 220 is defined as a pixel P (1,1),..., P (i, j),..., P (X, Y) (Note that the image size in this embodiment is X X Y). Note that the reading speed of the image sensor 220 is not limited and may be the same as the conventional one.
- the image sensor 220 receives a light beam from a subject (including an object to be inspected) transmitted by the optical system 210 and photoelectrically converts the light intensity signal (photographing) indicating the intensity of light reflected from the subject. Signal) is generated and output to the control unit 240.
- the image sensor 220 according to the present embodiment outputs the frame for each readable unit time.
- the control unit 240 includes, for example, a CPU, a ROM, a RAM, and the like. By executing an inspection program stored in the ROM, the transfer unit 241, the reading unit 242, and the intensity image superimposing unit 243. And a first multiplier 244, a first correlation image superimposing unit 245, a second multiplier 246, a second correlation image superimposing unit 247, and an image output unit 248. Note that the present invention is not limited to implementation with a CPU or the like, and may be implemented with an FPGA or an ASIC.
- the transfer unit 241 stores the frames composed of the light intensity signals output from the image sensor 220 in the data buffer 230 in chronological order.
- the data buffer 230 accumulates the frames composed of the light intensity signals output from the image sensor 220 in chronological order.
- FIG. 3 is a conceptual diagram showing frames accumulated in time series by the time correlation camera 110 of the present embodiment.
- Each pixel P (1,1),..., P (i, j),..., P (X, Y) constituting k 1, 2,.
- the frame output from the image sensor 220 includes only a light intensity signal, in other words, it can be considered as monochrome image data.
- a light intensity signal in other words, it can be considered as monochrome image data.
- the image sensor 220 generates monochrome image data in consideration of resolution, sensitivity, cost, and the like will be described.
- the image sensor 220 is not limited to a monochrome image sensor. Alternatively, a color image sensor may be used.
- the reading unit 242 of the present embodiment receives the light intensity signals G (1,1, t),..., G (i, j, t),. Y, t) are read out in frame-by-frame order and output to the first multiplier 244, the second multiplier 246, and the intensity image superimposing unit 243.
- the time correlation camera 110 of the present embodiment generates image data for each output destination of the reading unit 242. In other words, the time phase camera 110 creates three types of image data.
- the time correlation camera 110 of this embodiment generates intensity image data and two types of time correlation image data as three types of image data. Note that the present embodiment is not limited to generating three types of image data, and it may be possible to generate no intensity image data or to generate one or more types of time-correlated image data. .
- the image sensor 220 of the present embodiment outputs a frame composed of a light intensity signal for each unit time as described above.
- a light intensity signal corresponding to the exposure time necessary for photographing is required. Therefore, in the present embodiment, the intensity image superimposing unit 243 generates intensity image data by superimposing a plurality of frames for an exposure time necessary for photographing.
- each pixel value (value representing the intensity of light) G (x, y) of the intensity image data can be derived from the following equation (1).
- the exposure time is the time difference between t0 and tn.
- intensity image data in which a subject (including an object to be inspected) is photographed is generated in the same manner as with conventional camera photographing. Then, the intensity image superimposing unit 243 outputs the generated intensity image data to the image output unit 248.
- the time correlation image data is image data indicating changes in light intensity according to the time transition. That is, in the present embodiment, for each frame in time series order, the light intensity signal included in the frame is multiplied by the reference signal indicating the time transition, and the reference signal, the light intensity signal, and the time that is the multiplication result
- Temporal correlation image data is generated by generating a temporal correlation value frame composed of correlation values and superimposing a plurality of temporal correlation value frames.
- the illumination device 120 performs planar light irradiation that periodically gives temporal changes and spatial movement of the stripes via the screen 130.
- the reference signal may be a signal representing a time transition, but in the present embodiment, a complex sine wave e ⁇ j ⁇ t is used. It is assumed that the angular frequency is ⁇ and the time is t. The angular frequency ⁇ is such that the complex sine wave e ⁇ j ⁇ t representing the reference signal correlates with one period of the above-described exposure time (in other words, the time required to generate the intensity image data and the time correlation image). It shall be set.
- the planar and dynamic light formed by the illumination unit 120 and the illumination unit such as the screen 130 is in a first period (time period) at each position on the surface (reflection surface) of the inspection object 150.
- a distribution of increase or decrease in spatial irradiation intensity in a second period (spatial period) along at least one direction along the surface When this planar light is reflected by the surface, it is complex-modulated according to the specifications of the surface (normal vector distribution, etc.).
- the time correlation camera 110 receives the light complex-modulated on the surface and performs quadrature detection (orthogonal demodulation) using the reference signal of the first period, thereby obtaining time correlation image data as a complex signal.
- quadrature detection orthogonal demodulation
- each pixel value C (x, y) of the time correlation image data can be derived from the following equation (2).
- two types of time correlation image data are divided into a pixel value C1 (x, y) representing the real part and a pixel value C2 (x, y) representing the imaginary part.
- the reference signal output unit 250 generates and outputs different reference signals for the first multiplier 244 and the second multiplier 246, respectively.
- Reference signal output section 250 of this embodiment outputs the first reference signal cos ⁇ t corresponding to the real part of the complex sine wave e -Jeiomegati the first multiplier 244, the imaginary part of the complex sine wave e -Jeiomegati
- the corresponding second reference signal sin ⁇ t is output to the second multiplier 246.
- the reference signal output unit 250 according to the present embodiment describes an example in which two types of reference signals expressed as time functions of a sine wave and a cosine wave that form a Hilbert transform pair are described. Any reference signal that changes with time transition such as a function may be used.
- the first multiplier 244 calculates the real part cos ⁇ t of the complex sine wave e ⁇ j ⁇ t input from the reference signal output unit 250 for each light intensity signal of the frame in units of frames input from the reading unit 242. Multiply.
- the first correlation image superimposing unit 245 performs a process of superimposing the multiplication result of the first multiplier 244 on a pixel-by-pixel basis for a plurality of frames corresponding to the exposure time necessary for photographing.
- each pixel value C1 (x, y) of the first time correlation image data is derived from the following equation (3).
- the second multiplier 246 multiplies the light intensity signal of the frame input from the reading unit 242 by the imaginary part sin ⁇ t of the complex sine wave e ⁇ j ⁇ t input from the reference signal output unit 250.
- the second correlation image superimposing unit 247 performs a process of superimposing the multiplication result of the second multiplier 246 on a pixel-by-pixel basis for a plurality of frames corresponding to the exposure time necessary for photographing.
- each pixel value C2 (x, y) of the second time correlation image data is derived from the following equation (4).
- time correlation image data having two degrees of freedom can be generated.
- the present embodiment does not limit the type of reference signal.
- two types of time-correlated image data of the real part and the imaginary part of the complex sine wave e ⁇ j ⁇ t are created, but two types of image data based on the light amplitude and the light phase are generated. May be.
- the time correlation camera 110 of the present embodiment can create a plurality of systems as time correlation image data.
- the time correlation camera 110 includes a combination of two multipliers and two correlation image superimposing units for a plurality of systems, and the reference signal output unit 250 has an angular frequency suitable for each system.
- the reference signal by ⁇ can be output.
- the image output unit 248 outputs two types of time correlation image data and intensity image data to the PC 100.
- the PC 100 detects an abnormality of the object to be inspected using the two types of time correlation image data and the intensity image data. For that purpose, it is necessary to irradiate the subject with light.
- FIG. 4 is a diagram illustrating an example of a fringe pattern irradiated by the illumination device 120 of the present embodiment.
- the stripe pattern is scrolled (moved) in the x direction.
- a white area is a bright area corresponding to the stripe
- a black area is an interval area (dark area) corresponding to the stripe.
- the fringe pattern irradiated by the illumination device 120 is moved by one cycle with the exposure time when the time correlation camera 110 captures the intensity image data and the time correlation image data.
- the illuminating device 120 gives the time change of the light intensity periodically by the spatial movement of the stripe pattern of the light intensity.
- the time during which the fringe pattern in FIG. 4 moves by one period corresponds to the exposure time, so that each pixel of the time-correlated image data relates to at least the light intensity signal for one period of the fringe pattern. Information is embedded.
- the illumination device 120 irradiates a stripe pattern based on a rectangular wave
- the illumination device 120 is irradiated through the screen 130, so that the bright and dark boundary region of the rectangular wave can be blurred.
- the stripe pattern irradiated by the illumination device 120 is represented as A (1 + cos ( ⁇ t + kx), that is, the stripe pattern includes a plurality of stripes repeatedly (periodically).
- the intensity of the light applied to the light beam can be adjusted between 0 and 2 A, and is the light phase kx, where k is the wave number of the stripes, and x is the direction in which the phase changes.
- the fundamental frequency component of the light intensity signal f (x, y, t) of each pixel of the frame can be expressed as the following equation (5). As shown in Expression (5), the brightness of the stripe changes in the x direction.
- the intensity signal of the fringe pattern irradiated by the illumination device 120 can be considered as a complex number.
- the light from the illumination device 120 is reflected and input to the image sensor 220 from the subject (including the object to be inspected).
- the light intensity signal G (x, y, t) input to the image sensor 220 can be used as the light intensity signal f (x, y, t) of each pixel of the frame when the illumination device 120 is irradiated. Therefore, when Expression (5) is substituted into Expression (1) for deriving intensity image data, Expression (6) can be derived.
- the phase is kx.
- the time correlation image data represented by the complex number represented by the equation (7) can be replaced with the two types of time correlation image data described above. That is, the above-described time correlation image data composed of the real part and the imaginary part includes a phase change and an amplitude change due to a change in light intensity irradiated on the test object.
- the PC 100 according to the present embodiment can detect the phase change of the light emitted from the illumination device 120 and the light amplitude change based on the two types of time correlation image data. Therefore, the PC 100 according to the present embodiment, based on the time correlation image data and the intensity image data, amplitude image data representing the amplitude of light entering each pixel and phase image data representing the phase change of light entering each pixel. And generate.
- the PC 100 detects an abnormality of the object to be inspected based on the generated amplitude image data and phase image data.
- the distribution corresponding to the abnormality occurs in the distribution of normal vectors on the surface of the object to be inspected.
- the intensity of the reflected light changes.
- a change in the normal vector distribution is detected as at least one of a phase change and an amplitude change of light.
- FIG. 5 is a diagram illustrating a first detection example of an abnormality of the inspected object by the time correlation camera 110 according to the first embodiment.
- the inspected object 500 has a projecting shape abnormality 501.
- the normal vectors 521, 522, and 523 are in different directions in the region near the point 502 of the abnormality 501.
- the normal vectors 521, 522, 523 are directed in different directions, so that diffusion (for example, light 511, 512, 513) is generated in the light reflected from the abnormality 501, and the image sensor 220 of the time correlation camera 110.
- the width 503 of the fringe pattern entering the arbitrary pixel 531 is increased.
- FIG. 6 is a diagram showing an example of the amplitude of light that changes in accordance with the abnormality 501 shown in FIG.
- the amplitude of light is divided into a real part (Re) and an imaginary part (Im) and is represented on a two-dimensional plane.
- the light amplitudes 611, 612, and 613 corresponding to the lights 511, 512, and 513 in FIG.
- the light amplitudes 611, 612, and 613 cancel each other, and light having an amplitude 621 is incident on the arbitrary pixel 531 of the image sensor 220.
- FIG. 7 is a diagram illustrating a second example of detection of abnormality of an object to be inspected by the time correlation camera 110 according to the first embodiment.
- the surface of the object to be inspected is flat (in other words, the normal line is parallel) in the normal state, but a gentle gradient 701 is generated on the object 700 to be inspected.
- the normal vectors 721, 722, and 723 on the gradient 701 also change gently. Accordingly, the light beams 711, 712, and 713 input to the image sensor 220 are also shifted little by little.
- FIG. 7 is a diagram illustrating a second example of detection of abnormality of an object to be inspected by the time correlation camera 110 according to the first embodiment.
- the surface of the object to be inspected is flat (in other words, the normal line is parallel) in the normal state, but a gentle gradient 701 is generated on the object 700 to be inspected.
- the normal vectors 721, 722, and 723 on the gradient 701 also change gently. Accordingly, the light beams 711
- FIG. 8 is a diagram illustrating a third example of detection of abnormality of an object to be inspected by the time correlation camera 110 according to the first embodiment.
- the dirt 801 since the dirt 801 is attached to the object 800, the light irradiated from the illumination device 120 is absorbed or diffusely reflected, and the dirt 801 of the time correlation camera 110 is photographed.
- the present embodiment it is possible to estimate that the inspected object is abnormal by detecting the change in the amplitude of the light and the change in the phase of the light based on the time correlation image data.
- the PC 100 controls the entire detection system.
- the PC 100 includes an arm control unit 101, an illumination control unit 102, and a control unit 103.
- the arm control unit 101 controls the arm 140 in order to change the surface of the object 150 to be imaged by the time correlation camera 110.
- the arm control unit 101 can photograph the surface on which the time correlation camera 110 is set according to the setting. Move 150.
- the present embodiment is not limited to repeating the movement of the arm each time shooting is completed and stopping the shooting before the shooting is started, and the arm 140 may be continuously driven.
- the arm 140 may also be referred to as a transport unit, a moving unit, a position changing unit, a posture changing unit, or the like.
- the illumination control unit 102 outputs a fringe pattern irradiated by the illumination device 120 in order to inspect the inspection object 150.
- the illumination control unit 102 of this embodiment transfers at least three or more stripe patterns to the illumination device 120 and instructs the illumination device 120 to switch and display the stripe patterns during the exposure time.
- FIG. 9 is a diagram illustrating an example of a fringe pattern output from the illumination control unit 102 to the illumination device 120.
- the illumination control unit 102 performs control so that the stripe pattern in which the black region and the white region shown in FIG. 9A are set is output.
- the stripe interval for each stripe pattern irradiated in the present embodiment is set according to the size of the abnormality (defect) to be detected, and a detailed description thereof is omitted here.
- the angular frequency ⁇ of the rectangular wave for outputting the stripe pattern is the same value as the angular frequency ⁇ of the reference signal.
- the fringe pattern output from the illumination control unit 102 can be shown as a rectangular wave, but the border area of the fringe pattern is blurred through the screen 130, that is, the bright area in the fringe pattern.
- the intensity change of light at the boundary between the (stripe region) and the dark region (interval region) gentle (dull) it can be approximated to a sine wave.
- FIG. 10 is a diagram illustrating an example of a wave shape representing a stripe pattern after passing through the screen 130. As shown in FIG. 10, the measurement accuracy can be improved by the wave shape approaching a sine wave. Further, a gray region in which the brightness changes in multiple steps may be added to the stripe, or a gradation may be given. Further, a stripe pattern including color stripes may be used.
- control unit 103 includes an amplitude-phase image generation unit 104 and an abnormality detection processing unit 105, and by intensity image data input from the time correlation camera 110 and time correlation image data, Processing is performed to calculate a feature corresponding to the distribution of the normal vector on the surface to be inspected of the inspected object 150 and detecting an abnormality based on the difference from the surroundings.
- two types of real number and imaginary part of complex number correlation image data are used instead of time correlation image data (referred to as complex time correlation image data) indicated by complex numbers. Are received from the time correlation camera 110.
- the amplitude-phase image generation unit 104 generates amplitude image data and phase image data based on the intensity image data input from the time correlation camera 110 and the time correlation image data.
- the amplitude image data is image data representing the amplitude of light entering each pixel.
- the phase image data is image data representing the phase of light entering each pixel.
- the amplitude-phase image generation unit 104 has pixel values C1 (x, y) and C2 (x, From y), each pixel value F (x, y) of the amplitude image data can be derived using Equation (8).
- an abnormality occurs in a region where the value obtained by dividing the pixel value (AT) of the intensity image data by 2 and the amplitude of the amplitude image data (which is AT / 2 when cancellation does not occur) to some extent I can guess that it is not.
- AT pixel value
- the amplitude cancellation occurs in the non-matching region. A specific method will be described later.
- the amplitude-phase image generation unit 104 uses the pixel values C1 (x, y) and C2 (x, y) to calculate each pixel value P (x, y) of the phase image data using Equation (9). Can be derived.
- the abnormality detection processing unit 105 is a feature corresponding to the distribution of normal vectors on the inspection symmetry plane based on the amplitude image data and the phase image data generated by the amplitude-phase image generation unit 104, and depending on the difference from the surroundings. Then, a feature related to the abnormality of the inspection object 150 is detected.
- the amplitude distribution of the complex time correlation image is used as the feature corresponding to the distribution of the normal vector.
- the amplitude distribution of the complex time correlation image is data indicating the amplitude distribution of each pixel of the complex time correlation image, and corresponds to amplitude image data.
- FIG. 11 is a flowchart showing a procedure of the processing in the abnormality detection processing unit 105 of the present embodiment.
- the abnormality detection processing unit 105 determines the average amplitude of the N ⁇ N region from the light amplitude value (representing pixel value) stored in each pixel of the amplitude image data, with the pixel as a reference (for example, the center). The value is subtracted (step S1101), and average difference image data of amplitude is generated. The average difference image data of the amplitude corresponds to the gradient of the amplitude.
- the integer N is set to an appropriate value depending on the embodiment.
- the abnormality detection processing unit 105 performs a mask process using a predetermined amplitude threshold value on the average difference image data of the amplitude generated by the subtraction (step S1102).
- the abnormality detection processing unit 105 calculates a standard deviation for each pixel within the mask area of the average difference image data (step S1103).
- a method based on the standard deviation will be described.
- the method is not limited to the case where the standard deviation is used. For example, an average value or the like may be used.
- the abnormality detection processing unit 105 detects a pixel having an average pixel value smaller than ⁇ 4.5 ⁇ ( ⁇ : standard deviation) as a region having an abnormality (defect) (step S1104).
- the present embodiment is not limited to detecting an abnormality from the amplitude distribution of the complex time correlation image.
- the gradient of the phase distribution may be used as a feature corresponding to the distribution of normal vectors on the inspection symmetry plane. An example using the gradient of the phase distribution will be described next.
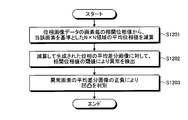
- FIG. 12 is a flowchart showing a procedure of the processing in the abnormality detection processing unit 105 of the present embodiment.
- the abnormality detection processing unit 105 subtracts the average phase value of the N ⁇ N region from the phase value of the light of each pixel of the phase image data (a pixel value representing the pixel value) using the pixel as a reference (for example, the center). (Step S1201), phase average difference image data is generated.
- the phase average difference image data corresponds to the phase gradient.
- the abnormality detection processing unit 105 compares the magnitude (absolute value) of the average difference image data of the phase generated by the subtraction with a threshold value, and determines pixels whose average difference image data size is equal to or greater than the threshold value. Then, it is detected as an abnormal (defect) pixel (step S1202).
- the abnormality detection processing unit 105 can determine the unevenness based on the sign of the average difference image data, that is, the magnitude relationship between the phase value of the pixel and the average phase value (Step S1203). Which of the pixel phase value and the average phase value is convex depends on the setting of each part, but the unevenness differs if the magnitude relationship is different.
- an abnormality can be detected from the gradient of the phase distribution obtained by another method.
- the abnormality detection processing unit 105 determines whether the difference between the average vector of the N ⁇ N region of the normalized time correlation image data and the normalized vector of each pixel is a threshold value. If it is larger than that, it can be detected as a pixel having an abnormality (defect). Further, the abnormality of the object to be inspected may be detected based on information corresponding to the phase distribution, not limited to the gradient of the phase distribution.
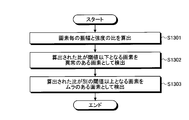
- FIG. 13 is a flowchart showing a procedure of the processing in the abnormality detection processing unit 105 of the present embodiment.
- the abnormality detection processing unit 105 uses the following equation (100) for each pixel from the time correlation image data and the intensity image data, and uses the following equation (100) to represent the amplitude (representing pixel value) C (x, y) (equation ( 7)) and intensity (a pixel value representing) G (x, y) (see equation (6)) R (x, y) is calculated (step S1301).
- R (x, y) C (x, y) / G (x, y) (100)
- the abnormality detection processing unit 105 compares the ratio R (x, y) with a threshold value, and sets a pixel having a ratio R (x, y) value equal to or less than the corresponding threshold value to a pixel having an abnormality (defect). (Step S1302). In addition, the abnormality detection processing unit 105 compares the ratio R (x, y) with a threshold value, and determines that a pixel whose ratio R (x, y) is equal to or greater than another corresponding threshold value is uneven (dirt or the like). A pixel is detected (step S1303). When the cancellation of the amplitude (attenuation) becomes significant due to an abnormality in the distribution of the normal vector, the amplitude decreases more than the strength.
- the abnormality detection processing unit 105 can detect the abnormality type in steps S1302 and S1303.
- FIG. 14 is a flowchart showing a procedure of the above-described processing in the inspection system of the present embodiment. It is assumed that the device under test 150 is already fixed to the arm 140 and arranged at the initial position of the inspection.
- the PC 100 of the present embodiment outputs a fringe pattern for inspecting the object to be inspected to the illumination device 120 (step S1401).
- the lighting device 120 stores the fringe pattern input from the PC 100 (step S1421). And the illuminating device 120 displays the stored fringe pattern so that it may change according to a time transition (step S1422).
- the conditions under which the illuminating device 120 starts display are not limited when the fringe pattern is stored, and may be, for example, when the inspector performs a start operation on the illuminating device 120.
- control part 103 of PC100 transmits the start instruction
- the time correlation camera 110 starts imaging in the area including the inspected object 150 in accordance with the transmitted imaging instruction (step S1411).
- the control unit 240 of the time correlation camera 110 generates intensity image data and time correlation image data (step S1412).
- the control unit 240 of the time correlation camera 110 outputs the intensity image data and the time correlation image data to the PC 100 (step S1413).
- the control unit 103 of the PC 100 receives the intensity image data and the time correlation image data (step S1403). Then, the amplitude-phase image generation unit 104 generates amplitude image data and phase image data from the received intensity image data and time correlation image data (step S1404).
- the abnormality detection processing unit 105 performs abnormality detection control of the inspected object based on the amplitude image data and the phase image data (step S1405). Then, the abnormality detection processing unit 105 outputs the abnormality detection result to a display device (not shown) included in the PC 100 (step S1406).
- the intensity image data is displayed, and an area of the intensity image data corresponding to the area where the abnormality is detected based on the amplitude image data and the phase image data is displayed.
- the output is not limited to visual output, and it may be output that an abnormality has been detected by voice or the like.
- the control unit 103 determines whether or not the inspection of the inspected object has been completed (step S1407). When it is determined that the inspection has not been completed (step S1407: No), the arm control unit 101 can photograph the surface of the inspection object to be inspected with the time correlation camera 110 according to a predetermined setting. In this manner, arm movement control is performed (step S1408). After the arm movement control is completed, the control unit 103 transmits an imaging start instruction to the time correlation camera 110 again (step S1402).
- step S1407 when it is determined that the inspection of the object to be inspected is completed (step S1407: Yes), the control unit 103 outputs an end instruction to the time correlation camera 110 (step S1409) and ends the process.
- step S1414 determines whether an end instruction has been received. If an end instruction has not been received (step S1414: NO), the processing is performed again from step S1411. On the other hand, if an end instruction has been received (step S1414: YES), the process ends.
- the termination process of the lighting device 120 may be performed by an inspector or may be terminated according to an instruction from another configuration.
- the present invention is not limited to the use of the time correlation camera 110 for generating the intensity image data and the time correlation image data, and a time correlation camera that can be realized by analog processing or an operation equivalent thereto.
- An imaging system may be used. For example, image data generated by a normal digital still camera is output, and the information processing apparatus superimposes a reference signal using the image data generated by the digital still camera as frame image data, thereby generating time-correlated image data.
- the time correlation image data may be generated by using a digital camera that superimposes a reference signal on a light intensity signal in the image sensor.
- Modification 1 In this embodiment, an example in which a feature related to an abnormality is detected based on a difference from the surroundings has been described, but the present invention is not limited to detecting the feature based on a difference from the surroundings.
- the feature may be detected based on a difference from data (reference data such as time correlation data, amplitude image data, phase image data, etc.). In this case, it is necessary to align and synchronize the spatial phase modulation illumination (stripe pattern) with the reference data.
- the abnormality detection processing unit 105 stores the amplitude image data and phase image data obtained from the reference surface and the amplitude image data and phase image of the inspected object 150, which are stored in advance in a storage unit (not shown). The data is compared, and it is determined whether or not there is a difference greater than a predetermined standard for any one or more of the light amplitude and the light phase between the surface of the inspected object 150 and the reference surface. To do.
- This modification is an example in which the inspection system having the same configuration as that of the first embodiment is used and the surface of a normal inspection object is used as the reference surface.
- the time correlation camera 110 images the surface of a normal object to be inspected and generates time correlation image data. Then, the PC 100 inputs the time correlation image data generated by the time correlation camera 110, generates amplitude image data and phase image data, and stores the amplitude image data and phase image data in a storage unit (not shown) of the PC 100. deep. Then, the time correlation camera 110 captures an object to be inspected for determining whether or not an abnormality has occurred, and generates time correlation image data.
- the PC 100 generates the amplitude image data and the phase image data from the time correlation image data, and then compares the amplitude image data and the phase image data with the amplitude image data and the phase image data of the normal inspection object stored in the storage unit.
- the comparison result of the amplitude image data and phase image data of a normal inspection object and the amplitude image data and phase image data of the inspection object to be inspected is data indicating characteristics for detecting an abnormality. Output.
- the feature for detecting an abnormality is equal to or greater than the predetermined reference, it can be estimated that the inspection object 150 is abnormal.
- Modification 2 In the first embodiment, the example in which the fringe pattern is moved in the x direction to detect an abnormality (defect) of the inspection object has been described. However, when an abnormality (defect) in which the normal distribution changes sharply in the y direction perpendicular to the x direction is generated in the inspection object, the fringe pattern is moved in the y direction rather than in the x direction. It may be easier to detect defects. Therefore, in the modification, an example will be described in which a fringe pattern moving in the x direction and a fringe pattern moving in the y direction are alternately switched.
- the illumination control unit 102 of this modification switches the fringe pattern output to the illumination device 120 at every predetermined time interval. Thereby, the illuminating device 120 outputs the some fringe pattern extended in the different direction with respect to one test object surface.
- FIG. 15 is a diagram illustrating a switching example of the fringe pattern output from the illumination control unit 102 of the present modification.
- the illumination control unit 102 changes the stripe pattern displayed by the illumination device 120 in the x direction.
- the illumination control unit 102 causes the stripe pattern displayed by the illumination device 120 to transition in the y direction.
- control part 103 of PC100 performed abnormality detection based on the time correlation image data obtained from the stripe pattern irradiation of FIG. 15 (A), and obtained from the stripe pattern irradiation of FIG. 15 (B). Abnormality detection is performed based on the time correlation image data.
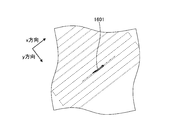
- FIG. 16 is a diagram showing an example in which the illumination control unit 102 of the present modification irradiates the surface including the abnormality (defect) 1601 with a stripe pattern.
- an abnormality (defect) 1601 extends in the x direction.
- the illumination control unit 102 sets the fringe pattern to move in the y direction that intersects the x direction, in other words, in the direction that intersects the longitudinal direction of the abnormality (defect) 1601. With this setting, detection accuracy can be improved.
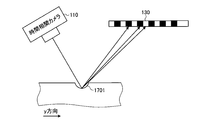
- FIG. 17 is a diagram showing the relationship between the abnormality (defect) 1701 and the stripe pattern on the screen 130 when the stripe pattern is changed in the y direction, in other words, in the direction orthogonal to the longitudinal direction of the defect 1601.
- the PC 100 can detect the abnormality (defect) from the amplitude image data corresponding to the stripe pattern moved in the y direction.
- the fringe pattern is displayed in a plurality of directions (for example, the x direction and the y direction crossing the x direction).
- the defect can be detected regardless of the shape of the defect, and the detection accuracy of the abnormality (defect) can be improved.
- the abnormality detection accuracy can be improved.
- Modification 3 the second modification described above is not limited to the method of switching the fringe pattern when performing abnormality detection in the x direction and abnormality detection in the y direction. Therefore, in Modification 3, an example in which the stripe pattern output from the illumination control unit 102 to the illumination device 120 is moved simultaneously in the x direction and the y direction will be described.
- FIG. 18 is a diagram illustrating an example of a fringe pattern output to the lighting device 120 by the lighting control unit 102 according to the present modification.
- the illumination control unit 102 moves the fringe pattern in the direction 1801.
- the stripe pattern shown in FIG. 18 includes a stripe pattern with one period 1802 in the x direction and a stripe pattern with one period 1803 in the y direction. That is, the stripe pattern shown in FIG. 18 has a plurality of stripes extending in crossing directions having different widths. It is necessary to make the width of the stripe pattern in the x direction different from the width of the stripe pattern in the y direction. Thereby, when generating the time correlation image data corresponding to the x direction and the time correlation image data corresponding to the y direction, the corresponding reference signals can be made different. In addition, since the period (frequency) of the light intensity change by the stripe pattern only needs to be changed, the moving speed of the stripe pattern (stripe) may be changed instead of changing the width of the stripe.
- the time correlation camera 110 generates time correlation image data corresponding to the stripe pattern in the x direction based on the reference signal corresponding to the stripe pattern in the x direction, and based on the reference signal corresponding to the stripe pattern in the y direction.
- time correlation image data corresponding to the stripe pattern in the y direction is generated.
- the control unit 103 of the PC 100 detects an abnormality based on the time correlation image data corresponding to the stripe pattern in the x direction, and then detects an abnormality based on the time correlation image data corresponding to the stripe pattern in the y direction. I do.
- this modification it becomes possible to detect regardless of the direction in which the defect occurs, and the detection accuracy of the abnormality (defect) can be improved.
- the illuminating device 120 demonstrated the example which displays the stripe pattern with the width
- the embodiment described above does not limit the width of the stripe in the x direction to one type, and the width of the stripe in the x direction may be a plurality of types. Therefore, in the present embodiment, an example in which a plurality of types of stripe widths in the x direction are used will be described.
- This embodiment uses a plurality of stripe widths in the x direction for one inspection target surface of the object to be inspected, in other words, using a plurality of stripe patterns having different stripes, An example of determining whether or not the shape is a protrusion is shown.
- the inspection system of the second embodiment has the same configuration as the inspection system of the first embodiment, the description thereof is omitted.
- the fringe pattern output by the illumination control unit 102 of the second embodiment will be described.
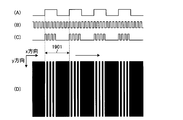
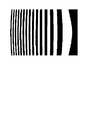
- FIG. 19 is a diagram illustrating an example of a fringe pattern output from the illumination control unit 102 of the second embodiment to the illumination device 120. As illustrated in FIG. 19, the illumination control unit 102 controls to output a stripe pattern having a plurality of stripes extending in the same direction and having different widths.
- a stripe pattern (D) corresponding to a rectangular wave (C) obtained by superimposing the rectangular wave (A) and the rectangular wave (B) in FIG. 19 is output by the illumination control unit 102.
- the rectangular wave (B) makes eight rounds while the rectangular wave (A) makes one round.
- the number of stripes represented by the rectangular wave (B) is set to be an even multiple of the number of stripes represented by the rectangular wave (A). This is based on the fact that the odd-numbered harmonic component is superimposed on the rectangular wave, and interference with the harmonic component can be suppressed by increasing the even-numbered factor.
- the width of the other stripe is set to be 8 times the width of the other stripe.
- the present invention is not limited to such an example.
- the frequency (cycle) of A) and the rectangular wave (B) may be different.
- the illuminating device 120 irradiates the to-be-inspected object 150 with the striped pattern as shown in FIG. 19 output from the illumination control unit 102 through the screen 130. Accordingly, the time correlation camera 110 captures the reflected light from the object to be inspected in the stripe pattern shown in FIG.
- the time correlation camera 110 of the present embodiment generates time correlation image data for two systems as a photographing result.
- the time correlation camera 110 generates time correlation image data corresponding to the fringe pattern of the rectangular wave (A) based on the reference signal corresponding to the fringe pattern of the rectangular wave (A). Based on the reference signal corresponding to the fringe pattern of B), time correlation image data corresponding to the fringe pattern of the rectangular wave (B) is generated.
- the two types (two systems) of output time correlation image data and intensity image data are output to the PC 100.
- Each type of time correlation image data includes time correlation image data of a real part and an imaginary part as shown in the first embodiment.
- control unit 103 of the PC 100 determines the object to be inspected based on the time correlation image data corresponding to the stripe pattern of the rectangular wave (A) and the time correlation image data corresponding to the stripe pattern of the rectangular wave (B). Anomaly detection is performed.
- the PC 100 of the present embodiment receives the time correlation image data corresponding to the stripe pattern of the rectangular wave (A) and the time correlation image data corresponding to the stripe pattern of the rectangular wave (B), thereby performing the first implementation.
- the abnormality based on the phase difference and the abnormality based on the amplitude difference as shown in the form it becomes easy to confirm the shape of the surface of the object to be inspected.
- the method of using a plurality of types of stripe widths is not limited to the method of superimposing, and one inspection object is used. Any method may be used as long as a plurality of fringe patterns having different widths can be output on the surface, and for example, control may be performed so as to switch and display a plurality of fringe patterns having different widths.
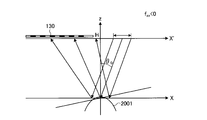
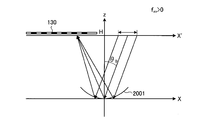
- FIG. 20 is a diagram illustrating a correspondence relationship among the image sensor 220, the screen 130, and the surface shape of the object to be inspected in the inspection system of the present embodiment.
- the fringe pattern irradiated through the screen 130 moves in the x direction, and the light irradiated from the screen 130 is reflected by the surface shape 2001 of the object to be inspected to the image sensor 220.
- the width p of the pixel 2011 of the image sensor 220 is assumed.
- x is a moving direction (phase change direction) of the spatial phase modulation illumination (stripe pattern), and x ′ is a direction parallel to x that is a distance H away from x. It is assumed that the screen 130 and the image sensor 220 are positioned along this x ′.
- the z direction is a direction orthogonal to the x direction and the x ′ direction.
- n is the normal vector
- ⁇ is the gradient (angle) of the measurement target position in the x direction
- ⁇ 0 is the angle formed by the screen 130 and the z direction. .
- the surface shape of the inspection object in the x direction is defined as f (x).
- f (x) the initial position of the surface shape of the object to be inspected, and the curvature of the surface shape of the object to be inspected.
- R the initial position of the surface shape of the object to be inspected
- f xx the second derivative of f (x). Note that the f x, f xxx etc., can be omitted because it considered only reflections from the screen position corresponding to the shift amount.
- f (x) f 0 + 1 / 2f xx x 2 (10)
- FIG. 21 is a diagram showing an example of the surface shape of the object to be inspected when the second order differential f xx ⁇ 0.
- the surface shape 2001 of the object to be inspected has a protruding shape.
- the width of the screen 130 that irradiates light entering the pixel is wider than the width of each pixel of the image sensor 220.
- FIG. 22 is a diagram showing an example of the surface shape of the object to be inspected when f xx > 0.
- the surface shape 2001 of the object to be inspected is a hollow shape.
- the width of the screen 130 that irradiates light entering the pixel is narrower than the width of each pixel of the image sensor 220. That is, from FIG. 21, if deriving the sign of the second derivative f xx, without viewing, it can be seen that recognize the surface shape of the inspection object.
- the reflection angle of the line of sight can be calculated from the following equation (12).
- ⁇ is tan ⁇ 0 .
- f xx x included in the right side of Expression (12) is tan ⁇ according to Expression (11). Therefore, although it can be said that it is clear from FIG. 20, this equation (12) shows that the angle ⁇ characterizing the normal vector n corresponds to the phase of the spatial phase modulation illumination (stripe pattern).
- the complex correlation pixel value g entering the pixel 2011 is obtained by integrating the phase ejkx ′ output from the screen 130 with the width p of the pixel 2011. That is, the complex correlation pixel value g can be derived from Expression (14).
- the wave number k of the stripe is set to 2 ⁇ / ⁇ , and ⁇ is the width of the stripe.
- the time correlation camera 110 has two types of time correlation images corresponding to two types of stripe widths. Data is generated by dividing it into a real part and an imaginary part. Then, the amplitude-phase image generation unit 104 of the PC 100 generates amplitude image data and phase image data for each stripe width from the input time correlation image data.
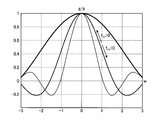
- FIG. 23 is a graph showing g / p when the stripe width in the stripe pattern is variously changed.
- the horizontal axis of FIG. 23 is w
- the vertical axis is g / p.
- the value of the variable w is a value corresponding to the inspection position if there is no change in the distribution of normal vectors on the surface of the inspection object 150 and the positional relationship of the inspection system (FIG. 20). Therefore, from FIG.
- equation (16) derived from equation (14) is used.
- Variable ⁇ is complex correlation pixel values of the width of the stripe is wide of the formula (14) and (amplitude value) g 1, complex correlation pixel values of the width of the stripe is narrow (amplitude) and g 2, the ratio of g equivalent to 2 / g 1.
- the wave numbers k 1 and k 2 are set to k 1 ⁇ k 2 .
- FIG. 24 is a diagram showing an example of an amplitude ratio correspondence table.
- the amplitude ratio correspondence table shown in FIG. 24 shows Expression (16).
- the horizontal axis in FIG. 24 is w, and the vertical axis is ⁇ .
- This amplitude ratio correspondence table is stored in advance in a storage unit (not shown) in the control unit 103.
- the stripe width (that is, the period length in the phase change direction of the spatial phase modulation illumination) may be set so as to satisfy the above.
- the shape of the inspection object to be inspected is not limited, various shapes can be considered as the surface shape of the inspection object.
- PC100 of the inspection system of this embodiment controls arm 140, and sets the position of a to-be-inspected object so that the surface of a to-be-inspected object can be inspected appropriately, when imaging a to-be-inspected object. At that time, the PC 100 delivers a fringe pattern suitable for the surface of the object to be inspected to the illumination device 120.
- FIG. 25 is a diagram showing an example in which a stripe pattern matching the surface shape of the inspection object 2501 is irradiated from the screen 130.
- the fringe patterns input to the time correlation camera 110 are equally spaced in order for the inspection system to detect an abnormality of the inspection object 2501.
- the illumination device 120 irradiates the screen 130 with the fringe pattern so that the fringe pattern after reflecting the object 2501 is equally spaced.
- the storage unit of the PC 100 stores a corresponding fringe pattern (equal intervals after reflection) for each surface to be imaged of the inspection object 2501.
- the stripe pattern is a stripe pattern set according to the inclination of the surface to be inspected of the inspection object 2501. For example, a stripe pattern is formed so that the widths of the stripes are substantially uniform when being input to the time correlation camera 110 after being reflected by the surface.
- the PC 100 outputs a fringe pattern set according to the inclination of the surface to the illumination device 120. And the illumination device 120 starts irradiation of the input fringe pattern. Thereby, the irradiation of the fringe pattern suitable for the surface shape of the inspection object 2501 can be realized.
- FIG. 26 is a flowchart showing a procedure of the above-described processing in the inspection system of the present embodiment. It is assumed that the device under test 150 is already fixed to the arm 140 and arranged at the initial position of the inspection.
- the PC 100 of the present embodiment outputs a fringe pattern corresponding to the position of the arm to the illumination device 120 (step S2601). That is, in the present embodiment, the stripe pattern associated with the position of the arm is a stripe pattern suitable for the surface shape to be imaged of the object to be inspected fixed to the arm.
- the lighting device 120 stores the fringe pattern input from the PC 100 (step S2621). And the illuminating device 120 displays the fringe pattern corresponding to the initial position of a test object so that it may change according to a time transition (step S2622).
- steps S1402 to S1406 and steps S1411 to S1413 shown in FIG. 14 the process from imaging to output of the abnormality detection result of the object to be inspected is performed (steps S2602 to S2606, steps S2611 to S2613).
- step S2607 determines whether or not the inspection of the object to be inspected is completed.
- step S2607: No the arm control unit 101 can capture the surface of the inspection object to be inspected next with the time correlation camera 110 according to a predetermined setting. In this manner, arm movement control is performed (step S2608).
- step S2608 After the arm movement control in step S2608 is completed, the control unit 103 again outputs a stripe pattern corresponding to the position of the arm to the illumination device 120 (step S2601). Thereby, whenever the surface used as imaging
- control unit 103 determines that the inspection of the object to be inspected has ended (step S2607: Yes)
- the control unit 103 outputs an end instruction to the time correlation camera 110 (step S2609), and ends the process.
- step S2614 determines whether or not an end instruction has been received. If an end instruction has not been received (step S2614: NO), the processing is performed again from step S2611. On the other hand, if an end instruction has been received (step S2614: YES), the process ends.
- the termination process of the lighting device 120 may be performed by an inspector or may be terminated according to an instruction from another configuration.
- FIG. 27 is a diagram showing an example of a stripe pattern displayed on the screen 130 by the illumination device 120 of the present embodiment.
- the fringe pattern generated at the occurrence points 2701 and 2702 (boiling points) is displayed so as to converge at the convergence point 2703 (suction point).
- an abnormality (defect) in the inspection object can be detected.
- a method for generating a fringe pattern will be described.
- FIG. 28 is an example in which the initial phase distribution ⁇ 0 (x, y) (spatial phase distribution) on the surface of the inspection object 150 or the screen 130 for generating the stripe pattern of FIG. FIG.
- the white point (light point) has a value of ⁇
- the black point (dark point) has a value of ⁇ .
- the value at the point 2701 is ⁇
- the value at the point 2702 is ⁇ / 2
- the initial value at the point 2703 (bottom point) is ⁇
- these points are set as constraints
- each point is a vertex.
- the initial phase distribution ⁇ 0 (x, y) is set so that, for example, a bell-shaped distribution corresponding to the distance from each point is generated as a bottom point.
- the fringe pattern in FIG. 27 is generated.
- the number of stripes between the top and bottom can be adjusted by the wave number k.
- the wave number k is the number of stripes between the vertex and the bottom point.
- binarization may be performed according to the value of ⁇ (x, y). Specifically, for example, a region where the phase ⁇ (x, y) is from ⁇ to 0 may be a dark region, and a region from 0 to ⁇ may be a bright region.
- a stationary stripe pattern as shown in FIG. 27 is obtained.
- a stationary stripe pattern can be expressed as R [e j ⁇ (x, y )].
- R [] is an operation that takes a real part of a complex number.
- the moving fringe pattern can be expressed as R [e j ⁇ t ⁇ e j ⁇ (x, y) ] by multiplying the modulation term e j ⁇ t .
- the moving fringe pattern can be generated based on e j ⁇ t ⁇ e j ⁇ (x, y) .
- the phase distribution ⁇ (x, y) and the fringe pattern exemplified here are examples.
- An arbitrary stripe pattern can be obtained by appropriately setting the initial phase distribution according to the shape of the inspection object 150. It is assumed that the wave number k is set to an appropriate value according to the size of the defect to be detected.
- arbitrary points on the surface of the object to be inspected are set as points 2801 and 2802 where the light intensity is high and a point 2803 where the light intensity is low.
- it may be set according to the point where the light intensity is strong, the point where the light intensity is weak, and the surface shape of the object to be inspected.
- FIG. 29 shows an example of a fringe pattern projected onto the spherical object 150, and as shown in FIG. 25, the fringe pattern is a parallel fringe that moves in the line of sight from the time correlation camera 110.
- the slope (gradient) is larger toward the left side in the left-right direction, and the slope (gradient) is greater toward the upper side and the lower side than the center in the vertical direction.
- the phase distribution ⁇ (x, y) can also be set based on CAD data.
- a screen is obtained by setting a fringe pattern on the surface of the object to be inspected 150 from the phase distribution ⁇ (x, y) in consideration of the three-dimensional shape of the object to be inspected 150, and performing coordinate conversion on the fringe pattern on the surface.
- the fringe pattern in the illumination unit such as 130 can be calculated.
- the inspection program executed by the PC 100 of the above-described embodiment is a file in an installable format or an executable format, and is a computer such as a CD-ROM, flexible disk (FD), CD-R, DVD (Digital Versatile Disk). It is recorded on a readable recording medium and provided.
- the inspection program executed by the PC 100 of the above-described embodiment may be provided by being stored on a computer connected to a network such as the Internet and downloaded via the network. Further, the inspection program executed on the PC 100 according to the above-described embodiment may be provided or distributed via a network such as the Internet.
Landscapes
- Biochemistry (AREA)
- General Health & Medical Sciences (AREA)
- Pathology (AREA)
- Physics & Mathematics (AREA)
- Health & Medical Sciences (AREA)
- Life Sciences & Earth Sciences (AREA)
- Immunology (AREA)
- Chemical & Material Sciences (AREA)
- General Physics & Mathematics (AREA)
- Analytical Chemistry (AREA)
- Engineering & Computer Science (AREA)
- Computer Vision & Pattern Recognition (AREA)
- Signal Processing (AREA)
- Investigating Materials By The Use Of Optical Means Adapted For Particular Applications (AREA)
- Length Measuring Devices By Optical Means (AREA)
- Image Processing (AREA)
Abstract
L'invention concerne, selon un mode de réalisation, un système d'inspection doté des éléments suivants : une unité d'éclairage plane qui modifie temporairement l'intensité de lumière de façon périodique en déplaçant dans l'espace un motif d'intensité de lumière en bandes ; une unité de génération d'image de corrélation temporelle, qui génère une image de corrélation temporelle à l'aide d'une caméra de corrélation temporelle ou d'un système d'imagerie qui fonctionne de manière équivalente à une caméra de corrélation temporelle ; et une unité de traitement arithmétique qui utilise l'image de corrélation temporelle afin de calculer une caractéristique qui correspond à la distribution de vecteurs normaux sur une surface sous inspection et détecte des aberrations en détectant des différences par rapport aux alentours et/ou des différences par rapport à une surface de référence.
Priority Applications (3)
| Application Number | Priority Date | Filing Date | Title |
|---|---|---|---|
| DE112015001561.2T DE112015001561T5 (de) | 2014-03-31 | 2015-03-31 | Prüfsystem und Prüfverfahren |
| US15/129,273 US10724960B2 (en) | 2014-03-31 | 2015-03-31 | Inspection system and inspection method |
| CN201580017619.6A CN106164653B (zh) | 2014-03-31 | 2015-03-31 | 检查系统和检查方法 |
Applications Claiming Priority (2)
| Application Number | Priority Date | Filing Date | Title |
|---|---|---|---|
| JP2014074880A JP6316068B2 (ja) | 2014-03-31 | 2014-03-31 | 検査システムおよび検査方法 |
| JP2014-074880 | 2014-03-31 |
Publications (1)
| Publication Number | Publication Date |
|---|---|
| WO2015152307A1 true WO2015152307A1 (fr) | 2015-10-08 |
Family
ID=54240625
Family Applications (1)
| Application Number | Title | Priority Date | Filing Date |
|---|---|---|---|
| PCT/JP2015/060277 Ceased WO2015152307A1 (fr) | 2014-03-31 | 2015-03-31 | Système et procédé d'inspection |
Country Status (5)
| Country | Link |
|---|---|
| US (1) | US10724960B2 (fr) |
| JP (1) | JP6316068B2 (fr) |
| CN (1) | CN106164653B (fr) |
| DE (1) | DE112015001561T5 (fr) |
| WO (1) | WO2015152307A1 (fr) |
Cited By (1)
| Publication number | Priority date | Publication date | Assignee | Title |
|---|---|---|---|---|
| US20200011810A1 (en) * | 2017-03-03 | 2020-01-09 | Ricoh Elemex Corporation | Inspection system and inspection method |
Families Citing this family (27)
| Publication number | Priority date | Publication date | Assignee | Title |
|---|---|---|---|---|
| JP6316068B2 (ja) | 2014-03-31 | 2018-04-25 | 国立大学法人 東京大学 | 検査システムおよび検査方法 |
| JP6433268B2 (ja) * | 2014-03-31 | 2018-12-05 | 国立大学法人 東京大学 | 検査システムおよび検査方法 |
| JP6424020B2 (ja) | 2014-06-09 | 2018-11-14 | 株式会社キーエンス | 画像検査装置、画像検査方法、画像検査プログラム及びコンピュータで読み取り可能な記録媒体並びに記録した機器 |
| JP2017101979A (ja) * | 2015-11-30 | 2017-06-08 | リコーエレメックス株式会社 | 検査システム |
| JP6682251B2 (ja) * | 2015-11-30 | 2020-04-15 | リコーエレメックス株式会社 | 検査システム、及び検査方法 |
| WO2017168711A1 (fr) * | 2016-03-31 | 2017-10-05 | 株式会社ニコン | Élément d'imagerie, système d'imagerie, et procédé d'imagerie |
| JP6677060B2 (ja) | 2016-04-21 | 2020-04-08 | アイシン精機株式会社 | 検査装置、記憶媒体、及びプログラム |
| JP2018009849A (ja) * | 2016-07-12 | 2018-01-18 | リコーエレメックス株式会社 | 検査システムおよび検査方法 |
| CN106706664A (zh) | 2016-12-28 | 2017-05-24 | 武汉华星光电技术有限公司 | 一种柔性衬底的检测方法、检测系统及检测装置 |
| JP2018112470A (ja) * | 2017-01-11 | 2018-07-19 | リコーエレメックス株式会社 | 検査システムおよび検査方法 |
| JP6945106B2 (ja) * | 2017-07-11 | 2021-10-06 | 高知県公立大学法人 | 検査システム |
| JP2019061484A (ja) * | 2017-09-26 | 2019-04-18 | キヤノン株式会社 | 画像処理装置及びその制御方法及びプログラム |
| JP6867932B2 (ja) * | 2017-11-14 | 2021-05-12 | 株式会社豊田中央研究所 | 表面検査装置 |
| JP2019105458A (ja) * | 2017-12-08 | 2019-06-27 | 株式会社日立ハイテクファインシステムズ | 欠陥検査装置及び欠陥検査方法 |
| DE102018202559A1 (de) * | 2018-02-20 | 2019-08-22 | Fraunhofer-Gesellschaft zur Förderung der angewandten Forschung e.V. | Vorrichtungen und verfahren zur vibrationsanalyse |
| JP2019178941A (ja) * | 2018-03-30 | 2019-10-17 | リコーエレメックス株式会社 | 検査システムおよび検査方法 |
| JP7131118B2 (ja) * | 2018-06-22 | 2022-09-06 | 富士通株式会社 | 認証装置、認証プログラム、認証方法 |
| JP6482710B1 (ja) * | 2018-09-06 | 2019-03-13 | 五洋商事株式会社 | 外観検査装置及び検査システム |
| CN109521028B (zh) * | 2018-12-04 | 2021-06-25 | 燕山大学 | 一种金属三维多层点阵结构内部宏观缺陷检测方法 |
| JP7242418B2 (ja) * | 2019-05-15 | 2023-03-20 | 興和株式会社 | 表面検査方法とその装置 |
| CN110243831B (zh) * | 2019-06-06 | 2022-02-15 | 锐捷网络股份有限公司 | 表面缺陷采集系统、表面缺陷检测方法、装置及存储介质 |
| US20220292665A1 (en) * | 2019-10-02 | 2022-09-15 | Konica Minolta, Inc. | Workpiece surface defect detection device and detection method, workpiece surface inspection system, and program |
| CN110736751B (zh) * | 2019-11-06 | 2022-04-19 | 合肥御微半导体技术有限公司 | 一种表面缺陷检测方法及装置 |
| JP2021131365A (ja) * | 2020-02-21 | 2021-09-09 | オムロン株式会社 | 画像検査装置 |
| JP2021139816A (ja) * | 2020-03-06 | 2021-09-16 | コニカミノルタ株式会社 | ワークの表面検査装置、表面検査システム、表面検査方法及びプログラム |
| JP7392582B2 (ja) * | 2020-06-12 | 2023-12-06 | オムロン株式会社 | 検査システムおよび検査方法 |
| EP4231001A1 (fr) * | 2022-02-16 | 2023-08-23 | Carl Zeiss Vision International GmbH | Dispositif et procédé d'essai |
Citations (4)
| Publication number | Priority date | Publication date | Assignee | Title |
|---|---|---|---|---|
| JP2000127353A (ja) * | 1998-10-27 | 2000-05-09 | Dainippon Screen Mfg Co Ltd | 版ズレ検出装置およびそれを備えた印刷装置 |
| JP2007305061A (ja) * | 2006-05-15 | 2007-11-22 | Univ Of Tokyo | 移動体情報取得装置および画像取得装置 |
| JP2013239934A (ja) * | 2012-05-16 | 2013-11-28 | Univ Of Tokyo | 時間相関演算システムおよび時間相関カメラ |
| JP2014002125A (ja) * | 2012-06-21 | 2014-01-09 | Fujitsu Ltd | 検査方法及び検査装置 |
Family Cites Families (21)
| Publication number | Priority date | Publication date | Assignee | Title |
|---|---|---|---|---|
| JP2002107309A (ja) | 2000-09-28 | 2002-04-10 | Toshiba Corp | 欠陥検査装置及び欠陥検査方法 |
| JP4633245B2 (ja) | 2000-11-06 | 2011-02-16 | 住友化学株式会社 | 表面検査装置及び表面検査方法 |
| US7164810B2 (en) * | 2001-11-21 | 2007-01-16 | Metrologic Instruments, Inc. | Planar light illumination and linear imaging (PLILIM) device with image-based velocity detection and aspect ratio compensation |
| JP2002323454A (ja) | 2001-04-26 | 2002-11-08 | Asahi Glass Co Ltd | 被検物の欠点検査方法および検査装置 |
| JP4235046B2 (ja) | 2003-07-08 | 2009-03-04 | 新日本製鐵株式会社 | 鋼板表面の検査方法、システム、画像処理装置、及びコンピュータプログラム |
| JP4140619B2 (ja) | 2005-06-14 | 2008-08-27 | 松下電器産業株式会社 | 画像合成装置およびそれを用いた画像照合装置ならびに画像合成方法 |
| US7612502B2 (en) * | 2006-06-01 | 2009-11-03 | Chunghwa Picture Tubes, Ltd. | Planar light source |
| JPWO2008105460A1 (ja) * | 2007-02-28 | 2010-06-03 | 株式会社ニコン | 観察方法、検査装置および検査方法 |
| US8629981B2 (en) * | 2008-02-01 | 2014-01-14 | Palo Alto Research Center Incorporated | Analyzers with time variation based on color-coded spatial modulation |
| WO2009149103A1 (fr) | 2008-06-03 | 2009-12-10 | Jeong Hwan J | Détection et classification par interférométrie de défauts |
| JP5560628B2 (ja) | 2009-09-04 | 2014-07-30 | ソニー株式会社 | 検査装置および検査方法 |
| JP4685971B2 (ja) | 2009-09-24 | 2011-05-18 | 株式会社ケー・デー・イー | 検査システム及び検査方法 |
| JP5333143B2 (ja) | 2009-10-13 | 2013-11-06 | 新日鐵住金株式会社 | 形状測定装置、形状測定方法およびプログラム |
| CN102564302A (zh) * | 2010-12-10 | 2012-07-11 | 通用电气公司 | 测量系统和方法 |
| JP5895733B2 (ja) | 2012-06-22 | 2016-03-30 | 富士通株式会社 | 表面欠陥検査装置および表面欠陥検査方法 |
| BR112015000983A2 (pt) * | 2012-07-17 | 2017-06-27 | Nissan Motor | sistema de assistência de condução e método de assistência de condução |
| JP5958779B2 (ja) * | 2012-10-12 | 2016-08-02 | 株式会社ニコン | 顕微鏡及び観察方法 |
| US20140103929A1 (en) | 2012-10-13 | 2014-04-17 | Chunlei Liu | Systems and methods for susceptibility tensor imaging in the p-space |
| CN103487441B (zh) | 2013-09-24 | 2015-09-30 | 电子科技大学 | 一种用于硅晶片缺陷检测和面形测量的方法 |
| JP6433268B2 (ja) * | 2014-03-31 | 2018-12-05 | 国立大学法人 東京大学 | 検査システムおよび検査方法 |
| JP6316068B2 (ja) | 2014-03-31 | 2018-04-25 | 国立大学法人 東京大学 | 検査システムおよび検査方法 |
-
2014
- 2014-03-31 JP JP2014074880A patent/JP6316068B2/ja not_active Expired - Fee Related
-
2015
- 2015-03-31 WO PCT/JP2015/060277 patent/WO2015152307A1/fr not_active Ceased
- 2015-03-31 DE DE112015001561.2T patent/DE112015001561T5/de not_active Withdrawn
- 2015-03-31 US US15/129,273 patent/US10724960B2/en not_active Expired - Fee Related
- 2015-03-31 CN CN201580017619.6A patent/CN106164653B/zh not_active Expired - Fee Related
Patent Citations (4)
| Publication number | Priority date | Publication date | Assignee | Title |
|---|---|---|---|---|
| JP2000127353A (ja) * | 1998-10-27 | 2000-05-09 | Dainippon Screen Mfg Co Ltd | 版ズレ検出装置およびそれを備えた印刷装置 |
| JP2007305061A (ja) * | 2006-05-15 | 2007-11-22 | Univ Of Tokyo | 移動体情報取得装置および画像取得装置 |
| JP2013239934A (ja) * | 2012-05-16 | 2013-11-28 | Univ Of Tokyo | 時間相関演算システムおよび時間相関カメラ |
| JP2014002125A (ja) * | 2012-06-21 | 2014-01-09 | Fujitsu Ltd | 検査方法及び検査装置 |
Cited By (2)
| Publication number | Priority date | Publication date | Assignee | Title |
|---|---|---|---|---|
| US20200011810A1 (en) * | 2017-03-03 | 2020-01-09 | Ricoh Elemex Corporation | Inspection system and inspection method |
| US10775316B2 (en) * | 2017-03-03 | 2020-09-15 | Ricoh Elemex Corporation | Inspection system and inspection method |
Also Published As
| Publication number | Publication date |
|---|---|
| US20170115230A1 (en) | 2017-04-27 |
| US10724960B2 (en) | 2020-07-28 |
| JP2015197345A (ja) | 2015-11-09 |
| DE112015001561T5 (de) | 2017-02-23 |
| JP6316068B2 (ja) | 2018-04-25 |
| CN106164653A (zh) | 2016-11-23 |
| CN106164653B (zh) | 2019-10-29 |
Similar Documents
| Publication | Publication Date | Title |
|---|---|---|
| JP6316068B2 (ja) | 検査システムおよび検査方法 | |
| JP6433268B2 (ja) | 検査システムおよび検査方法 | |
| JP6542586B2 (ja) | 検査システム | |
| JP6553412B2 (ja) | 検査システム | |
| WO2018159825A1 (fr) | Système d'inspection et procédé d'inspection | |
| JP6276092B2 (ja) | 検査システムおよび検査方法 | |
| JP6529248B2 (ja) | 検査システムおよびフレキシブル照明装置 | |
| JP6682251B2 (ja) | 検査システム、及び検査方法 | |
| JP6420131B2 (ja) | 検査システム、及び検査方法 | |
| JP6781430B2 (ja) | 検査システム | |
| JP2017101979A (ja) | 検査システム | |
| JP2018028527A (ja) | 検査システム | |
| JP2020012816A (ja) | 検査システムおよび検査方法 | |
| JP6909378B2 (ja) | 検査システム | |
| JP6909377B2 (ja) | 検査システムおよび検査方法 | |
| JP6703415B2 (ja) | 検査装置及び検査方法 | |
| JP6902684B2 (ja) | 画像処理装置および検査システム | |
| JP2018205039A (ja) | 画像処理装置および検査システム | |
| JP2018116026A (ja) | 照明装置および透過部材 | |
| JP6826813B2 (ja) | 検査装置及び検査方法 | |
| JP6529247B2 (ja) | 較正システムおよび検査システム | |
| JP2019178941A (ja) | 検査システムおよび検査方法 | |
| JP2024017231A (ja) | 検査システムおよび検査方法 | |
| JP2019002873A (ja) | 検査システムおよび検査方法 | |
| JP2019039685A (ja) | 検査システムおよび検査方法 |
Legal Events
| Date | Code | Title | Description |
|---|---|---|---|
| 121 | Ep: the epo has been informed by wipo that ep was designated in this application |
Ref document number: 15773701 Country of ref document: EP Kind code of ref document: A1 |
|
| WWE | Wipo information: entry into national phase |
Ref document number: 15129273 Country of ref document: US |
|
| WWE | Wipo information: entry into national phase |
Ref document number: 112015001561 Country of ref document: DE |
|
| 122 | Ep: pct application non-entry in european phase |
Ref document number: 15773701 Country of ref document: EP Kind code of ref document: A1 |