WO2015163211A1 - Procédé de quantification de substance biologique, dispositif de traitement d'image, système d'aide au diagnostic pathologique, et programme de traitement d'image - Google Patents
Procédé de quantification de substance biologique, dispositif de traitement d'image, système d'aide au diagnostic pathologique, et programme de traitement d'image Download PDFInfo
- Publication number
- WO2015163211A1 WO2015163211A1 PCT/JP2015/061578 JP2015061578W WO2015163211A1 WO 2015163211 A1 WO2015163211 A1 WO 2015163211A1 JP 2015061578 W JP2015061578 W JP 2015061578W WO 2015163211 A1 WO2015163211 A1 WO 2015163211A1
- Authority
- WO
- WIPO (PCT)
- Prior art keywords
- image
- fluorescent
- bright spot
- biological material
- profile
- Prior art date
- Legal status (The legal status is an assumption and is not a legal conclusion. Google has not performed a legal analysis and makes no representation as to the accuracy of the status listed.)
- Ceased
Links
Images








Classifications
-
- G—PHYSICS
- G01—MEASURING; TESTING
- G01N—INVESTIGATING OR ANALYSING MATERIALS BY DETERMINING THEIR CHEMICAL OR PHYSICAL PROPERTIES
- G01N21/00—Investigating or analysing materials by the use of optical means, i.e. using sub-millimetre waves, infrared, visible or ultraviolet light
- G01N21/62—Systems in which the material investigated is excited whereby it emits light or causes a change in wavelength of the incident light
- G01N21/63—Systems in which the material investigated is excited whereby it emits light or causes a change in wavelength of the incident light optically excited
- G01N21/64—Fluorescence; Phosphorescence
-
- G—PHYSICS
- G01—MEASURING; TESTING
- G01N—INVESTIGATING OR ANALYSING MATERIALS BY DETERMINING THEIR CHEMICAL OR PHYSICAL PROPERTIES
- G01N33/00—Investigating or analysing materials by specific methods not covered by groups G01N1/00 - G01N31/00
- G01N33/48—Biological material, e.g. blood, urine; Haemocytometers
-
- G—PHYSICS
- G01—MEASURING; TESTING
- G01N—INVESTIGATING OR ANALYSING MATERIALS BY DETERMINING THEIR CHEMICAL OR PHYSICAL PROPERTIES
- G01N33/00—Investigating or analysing materials by specific methods not covered by groups G01N1/00 - G01N31/00
- G01N33/48—Biological material, e.g. blood, urine; Haemocytometers
- G01N33/483—Physical analysis of biological material
-
- G—PHYSICS
- G01—MEASURING; TESTING
- G01N—INVESTIGATING OR ANALYSING MATERIALS BY DETERMINING THEIR CHEMICAL OR PHYSICAL PROPERTIES
- G01N33/00—Investigating or analysing materials by specific methods not covered by groups G01N1/00 - G01N31/00
- G01N33/48—Biological material, e.g. blood, urine; Haemocytometers
- G01N33/50—Chemical analysis of biological material, e.g. blood, urine; Testing involving biospecific ligand binding methods; Immunological testing
- G01N33/53—Immunoassay; Biospecific binding assay; Materials therefor
-
- G—PHYSICS
- G01—MEASURING; TESTING
- G01N—INVESTIGATING OR ANALYSING MATERIALS BY DETERMINING THEIR CHEMICAL OR PHYSICAL PROPERTIES
- G01N33/00—Investigating or analysing materials by specific methods not covered by groups G01N1/00 - G01N31/00
- G01N33/48—Biological material, e.g. blood, urine; Haemocytometers
- G01N33/50—Chemical analysis of biological material, e.g. blood, urine; Testing involving biospecific ligand binding methods; Immunological testing
- G01N33/53—Immunoassay; Biospecific binding assay; Materials therefor
- G01N33/531—Production of immunochemical test materials
- G01N33/532—Production of labelled immunochemicals
- G01N33/533—Production of labelled immunochemicals with fluorescent label
Definitions
- the present invention relates to a biological material quantification method, an image processing device, a pathological diagnosis support system, and an image processing program.
- Patent Document 1 describes a method in which a biological material is stained with a fluorescent material such as an organic fluorescent dye or a quantum dot and measured using a three-dimensional image analysis apparatus. According to the method described in Patent Document 1, by reconstructing and analyzing a fluorescence image in three dimensions, a plurality of fluorescence signals that appear to overlap in two dimensions can be separated and counted one by one. .
- a fluorescent material such as an organic fluorescent dye or a quantum dot
- Patent Document 2 an average luminance value per particle is obtained by staining a tissue section using fluorescent dye-integrated particles to which a biological substance recognition site is bound, and analyzing the luminance distribution of fluorescent emission points.
- a method for calculating the number of particles in each bright spot has been proposed.
- fluorescent dye-aggregated particles have high luminance per particle. Therefore, even when the fluorescently stained biological material is a protein, the fluorescent signal is observed in the form of dots and the number of particles is calculated. can do.
- the main object of the present invention is to provide a biological material quantification method for accurately quantifying the amount of a specific biological material in a specimen using a simple microscope.
- a biological material quantification method for quantifying the biological material from a specimen stained with a specific biological material using fluorescent particles in which a plurality of fluorescent materials are accumulated as a staining reagent An input step of continuously changing a depth of focus at a predetermined interval, and inputting a fluorescence image representing the expression of the biological material in the specimen as a fluorescent luminescent spot at each depth of focus; A profile creation step of creating a bright spot image in which a bright spot region is extracted from the fluorescent image at each focal depth, and creating a brightness profile for each bright spot image; The brightness profile of the fluorescent particles measured in advance as a reference profile is created, and the brightness profile of the bright spot image at each focal depth is analyzed based on the reference profile, whereby the number of fluorescent particles included in the fluorescence image is determined.
- a calculation step to calculate, A method for quantifying a biological material is provided.
- the reference profile includes information on a relative distance from a fluorescent particle serving as a fluorescent bright spot source and luminance information.
- the position of the fluorescent particles included in the fluorescent image is specified,
- a method for quantifying a biological material is provided.
- a biological material quantification method in the biological material quantification method according to any one of claims 1 to 3, is provided, wherein the fluorescent particles have an average particle size of 20 to 200 nm.
- a biological material quantification method is provided, wherein the coefficient of variation of the particle size of the fluorescent particles is 15% or less.
- a biological material quantification method is provided, wherein the biological material is a protein.
- a biological material quantification method for quantifying the biological material from a specimen stained with a specific biological material using fluorescent particles in which a plurality of fluorescent materials are accumulated as a staining reagent
- Input means for continuously changing the depth of focus at a predetermined interval, and inputting a fluorescence image representing the expression of the biological material in the specimen as a fluorescence bright spot at each depth of focus
- a profile creating means for generating a bright spot image in which a bright spot region is extracted from the fluorescent image at each focal depth and creating a brightness profile for each bright spot image;
- the brightness profile of the fluorescent particles measured in advance as a reference profile is created, and the brightness profile of the bright spot image at each focal depth is analyzed based on the reference profile, whereby the number of fluorescent particles included in the fluorescence image is determined.
- An image processing apparatus is provided.
- An image processing apparatus according to claim 7; An image acquisition device for acquiring the fluorescent image used in the image processing device; A pathological diagnosis support system is provided.
- a computer for quantifying the biological material from a specimen stained with a specific biological material using fluorescent particles in which a plurality of fluorescent materials are accumulated as a staining reagent, Input means for continuously changing a focal depth at a predetermined interval, and inputting a fluorescence image representing the expression of the biological material in the specimen as a fluorescent luminescent spot at each focal depth; Profile creation means for generating a bright spot image from which a bright spot region is extracted from the fluorescent image at each focal depth, and creating a brightness profile for each bright spot image, The brightness profile of the fluorescent particles measured in advance as a reference profile is created, and the brightness profile of the bright spot image at each focal depth is analyzed based on the reference profile, whereby the number of fluorescent particles included in the fluorescence image is determined.
- a sample stained with fluorescent particles in which a plurality of fluorescent substances are accumulated is analyzed using images of fluorescence intensities using images obtained at a plurality of focal depths, and a simple microscope is used.
- the amount of a specific biological substance in the observation target cell can be accurately quantified.
- FIG. 5 S4 It is a figure which shows the system configuration
- FIG. 10B is an enlarged view of one bright spot region surrounded by a square in FIG. 10A. It is a fluorescence image of the site
- FIG. 10B is a second fluorescence image generated by masking the image of FIG. 10C with FIG. 10B. It is an example of the brightness
- luminance profile which shows the brightness
- FIG. 1 shows an example of the overall configuration of a pathological diagnosis support system 100 using the biological material quantification method of the present invention.
- the pathological diagnosis support system 100 acquires a microscopic image of a human tissue sample stained with a predetermined staining reagent, and analyzes the acquired microscopic image, thereby expressing the expression of a specific biological material in the tissue sample to be observed. This is a system that outputs feature quantities quantitatively.
- the pathological diagnosis support system 100 is configured by connecting a microscope image acquisition device 1A and an image processing device 2A through a cable 3A or the like so as to be able to transmit and receive data.
- the connection method between the microscope image acquisition device 1A and the image processing device 2A is not particularly limited.
- the microscope image acquisition device 1A and the image processing device 2A may be connected via a LAN (Local Area Network) or may be configured to be connected wirelessly.
- LAN Local Area Network
- the microscope image acquisition apparatus 1A is a known optical microscope with a camera, and acquires a microscope image of a tissue specimen on a slide placed on a slide fixing stage, and transmits the microscope image to the image processing apparatus 2A.
- the microscope image acquisition apparatus 1A includes an irradiation unit, an imaging unit, an imaging unit, a communication I / F, and the like.
- the irradiation means includes a light source, a filter, and the like, and irradiates the tissue specimen on the slide placed on the slide fixing stage with light.
- the imaging means is composed of an eyepiece lens, an objective lens, and the like, and forms an image of transmitted light, reflected light, or fluorescence emitted from the tissue specimen on the slide by the irradiated light.
- the imaging means is a microscope-installed camera that includes a CCD (Charge Coupled Device) sensor and the like, captures an image formed on the imaging surface by the imaging means, and generates digital image data of the microscope image.
- the communication I / F transmits image data of the generated microscope image to the image processing apparatus 2A.
- the microscope image acquisition apparatus 1A includes a bright field unit that combines an irradiation unit and an imaging unit suitable for bright field observation, and a fluorescence unit that combines an irradiation unit and an imaging unit suitable for fluorescence observation. It is possible to switch between bright field / fluorescence by switching units.
- a light source for fluorescence observation any lamp such as a mercury lamp, a xenon lamp, an LED, or a laser beam can be used.
- the microscope image acquisition apparatus 1A is not limited to a microscope with a camera.
- a virtual microscope slide creation apparatus for example, a special microscope microscope
- Table 2002-514319 may be used.
- the virtual microscope slide creation device it is possible to acquire image data that allows the entire tissue specimen image on the slide to be viewed on the display unit at a time.
- the image processing apparatus 2A calculates the expression distribution of a specific biological substance in the tissue specimen to be observed by analyzing the microscope image transmitted from the microscope image acquisition apparatus 1A.
- FIG. 2 shows a functional configuration example of the image processing apparatus 2A.
- the image processing apparatus 2 ⁇ / b> A includes a control unit 21, an operation unit 22, a display unit 23, a communication I / F 24, a storage unit 25, and the like, and each unit is connected via a bus 26. ing.
- the control unit 21 includes a CPU (Central Processing Unit), a RAM (Random Access Memory), and the like.
- the control unit 21 executes various processes in cooperation with various programs stored in the storage unit 25, and performs image processing 2A. Overall control of the operation.
- the control unit 21 executes an image analysis process (see FIG. 5) in cooperation with a program stored in the storage unit 25, and executes a profile creation process, a calculation process, an extraction process, and a generation process.
- the function as a means is realized.
- the operation unit 22 includes a keyboard having character input keys, numeric input keys, various function keys, and the like, and a pointing device such as a mouse, and a key pressing signal pressed by the keyboard and an operation signal by the mouse. Are output to the control unit 21 as an input signal.
- the display unit 23 includes, for example, a monitor such as a CRT (Cathode Ray Tube) or an LCD (Liquid Crystal Display), and displays various screens in accordance with display signal instructions input from the control unit 21.
- the display unit 23 functions as an output unit for outputting an image analysis result.
- the communication I / F 24 is an interface for transmitting and receiving data to and from external devices such as the microscope image acquisition device 1A.
- the communication I / F 24 functions as a means for executing a bright-field image and fluorescent image input process.
- the storage unit 25 includes, for example, an HDD (Hard Disk Drive), a semiconductor nonvolatile memory, or the like. As described above, the storage unit 25 stores various programs, various data, and the like.
- the image processing apparatus 2A may include a LAN adapter, a router, and the like and be connected to an external device via a communication network such as a LAN.
- the image processing apparatus 2A in the present embodiment preferably performs analysis using the bright field image and the fluorescence image transmitted from the microscope image acquisition apparatus 1A.
- the bright field image is obtained by enlarging and photographing a tissue specimen stained with H (hematoxylin) staining reagent and HE (hematoxylin-eosin) staining reagent in a bright field in the microscope image acquisition apparatus 1A. It is an image and is a cell form image showing the form of the cell in the tissue specimen.
- Hematoxylin is a blue-violet pigment that stains cell nuclei, bone tissue, part of cartilage tissue, serous components, etc. (basophilic tissue, etc.).
- Eosin is a red to pink pigment that stains the cytoplasm, connective tissue of soft tissues, red blood cells, fibrin, endocrine granules, etc. (eosinophilic tissues, etc.).
- FIG. 3 shows an example of a bright field image obtained by photographing a tissue specimen subjected to HE staining.
- a fluorescent image includes a staining reagent including nanoparticles encapsulating a fluorescent substance bound with a biological substance recognition site that specifically binds and / or reacts with a specific biological substance (hereinafter referred to as a fluorescent substance-encapsulated nanoparticle or fluorescent particle).
- the fluorescence appearing in the fluorescence image indicates the expression of a specific biological material corresponding to the biological material recognition site in the tissue specimen.
- FIG. 4 shows an example of the fluorescence image.
- a method for acquiring a fluorescent image including a staining reagent (fluorescent substance-containing nanoparticles) used when acquiring the fluorescent image, a method of staining a tissue specimen with the staining reagent, and the like.
- a staining reagent fluorescent substance-containing nanoparticles
- fluorescent substance examples include fluorescent organic dyes and quantum dots (semiconductor particles). When excited by ultraviolet to near infrared light having a wavelength in the range of 200 to 700 nm, it preferably emits visible to near infrared light having a wavelength in the range of 400 to 1100 nm.
- fluorescent organic dyes examples include fluorescein dye molecules, rhodamine dye molecules, Alexa Fluor (Invitrogen) dye molecules, BODIPY (Invitrogen) dye molecules, cascade dye molecules, coumarin dye molecules, and eosin dyes. And a molecule, an NBD dye molecule, a pyrene dye molecule, a cyanine dye molecule, and an aromatic hydrocarbon molecule.
- quantum dots containing II-VI group compounds, III-V group compounds, or group IV elements as components ("II-VI group quantum dots”, "III-V group quantum dots”, " Or “Group IV quantum dots”). You may use individually or what mixed multiple types.
- CdSe CdS, CdS, CdTe, ZnSe, ZnS, ZnTe, InP, InN, InAs, InGaP, GaP, GaAs, Si, and Ge, but are not limited thereto.
- a quantum dot having the above quantum dot as a core and a shell provided thereon.
- CdSe / ZnS when the core is CdSe and the shell is ZnS, it is expressed as CdSe / ZnS.
- CdSe / ZnS, CdS / ZnS, InP / ZnS, InGaP / ZnS, Si / SiO 2 , Si / ZnS, Ge / GeO 2 , Ge / ZnS, and the like can be used, but are not limited thereto.
- the quantum dots those subjected to surface treatment with an organic polymer or the like may be used as necessary. Examples thereof include CdSe / ZnS having a surface carboxy group (manufactured by Invitrogen), CdSe / ZnS having a surface amino group (manufactured by Invitrogen), and the like.
- the fluorescent substance-encapsulating nanoparticles are those in which the fluorescent substance is dispersed inside the nanoparticles, whether the fluorescent substance and the nanoparticles themselves are chemically bonded or not. Good.
- the material constituting the nanoparticles is not particularly limited, and examples thereof include polystyrene, polylactic acid, silica, and melamine.
- Fluorescent substance-containing nanoparticles used in the present embodiment can be produced by a known method.
- silica nanoparticles encapsulating a fluorescent organic dye can be synthesized with reference to the synthesis of FITC-encapsulated silica particles described in Langmuir 8, Vol. 2921 (1992).
- Various fluorescent organic dye-containing silica nanoparticles can be synthesized by using a desired fluorescent organic dye in place of FITC.
- Silica nanoparticles encapsulating quantum dots can be synthesized with reference to the synthesis of CdTe-encapsulated silica nanoparticles described in New Journal of Chemistry, Vol. 33, p. 561 (2009).
- Polystyrene nanoparticles encapsulating a fluorescent organic dye may be copolymerized using an organic dye having a polymerizable functional group described in US Pat. No. 4,326,008 (1982) or polystyrene described in US Pat. No. 5,326,692 (1992). It can be produced using a method of impregnating nanoparticles with a fluorescent organic dye.
- Polymer nanoparticles encapsulating quantum dots can be prepared using the method of impregnating polystyrene nanoparticles with quantum dots described in Nature Biotechnology, Vol. 19, page 631 (2001).
- the average particle size of the fluorescent substance-containing nanoparticles used in this embodiment is not particularly limited, but those having a large particle size are difficult to access the antigen, and those having a small particle size and low luminance are signals of the fluorescent substance-containing nanoparticles. Are buried in the background noise (camera noise and cell autofluorescence), and those of about 20 to 200 nm are preferable.
- the average particle diameter is obtained by taking an electron micrograph using a scanning electron microscope (SEM), measuring the cross-sectional area of a sufficient number of particles, and taking each measured value as the area of the circle. As sought.
- SEM scanning electron microscope
- the arithmetic average of the particle sizes of 1000 particles is defined as the average particle size.
- the coefficient of variation was calculated from the particle size of 1000 particles in the same manner as the average particle size.
- the biological material recognition site is a site that specifically binds and / or reacts with the target biological material.
- the target biological substance is not particularly limited as long as a substance that specifically binds to the target biological substance exists, but typically, protein (peptide), nucleic acid (oligonucleotide, polynucleotide), antibody, etc. Is mentioned. Accordingly, substances that bind to the target biological substance include antibodies that recognize the protein as an antigen, other proteins that specifically bind to the protein, and nucleic acids having a base sequence that hybridizes to the nucleic acid. Is mentioned.
- an anti-HER2 antibody that specifically binds to HER2 which is a protein present on the cell surface
- an anti-ER antibody that specifically binds to an estrogen receptor (ER) present in the cell nucleus and actin that forms a cytoskeleton
- an anti-actin antibody that specifically binds to are preferable.
- antigens examples include M. actin, MS actin, SM actin, ACTH, Alk-1, ⁇ 1-antichymotrypsin, ⁇ 1-antitrypsin, AFP, bcl-2, bcl-6, ⁇ -catenin, BCA 225, CA19-9, CA125 , Calcitonin, calretinin, CD1a, CD3, CD4, CD5, CD8, CD10, CD15, CD20, CD21, CD23, CD30, CD31, CD34, CD43, CD45, CD45R, CD56, CD57, CD61, CD68, CD79a, "CD99, MIC2 ", CD138, chromogranin, c-KIT, c-MET, collagen type IV, Cox-2, cyclin D1, keratin, cytokeratin (high molecular weight), pankeratin, pankeratin
- examples of the specific nucleic acid gene that has been pointed out to be associated with a disease can include the following, and probes that recognize each specific nucleic acid gene are available as BAC probes: Can be created based on general knowledge. Specific examples of specific nucleic acid genes are as follows. HER2, TOP2A, HER3, EGFR, P53, MET, etc. are mentioned as genes related to cancer growth and molecular target drug response. Furthermore, the following genes are known as various cancer-related genes. Can be mentioned.
- Tyrosine kinase-related genes include ALK, FLT3, AXL, FLT4 (VEGFR3, DDR1, FMS (CSF1R), DDR2, EGFR (ERBB1), HER4 (ERBB4), EML4-ALK, IGF1R, EPHA1, INSR, EPHA2, IRR (INSRR) ), EPHA3, KIT, EPHA4, LTK, EPHA5, MER (MERTK), EPHA6, MET, EPHA7, MUSK, EPHA8, NPM1-ALK, EPHB1, PDGFR ⁇ (PDGFRA), EPHB2, PDGFR ⁇ (PDGFRB), EPHEP3, T RON (MST1R), FGFR1, ROS (ROS1), FGFR2, TIE2 (TEK), FGFR3, TRKA (NTRK1), FGFR4, TRKB (NT RK2), FLT1 (VEGFR1), TRKC (NTRK3), and breast cancer-related genes are ATM, BRCA1, BRCA2, BRCA3, CC
- Cancer-related genes include APC, MSH6, AXIN2, MYH, BMPR1A, p53, DCC, PMS2, KRAS2 (or Ki-ras), PTEN, MLH1, and SMA.
- MSH2, STK11, MSH6 Lung cancer-related genes include ALK, PTEN, CCND1, RASSF1A, CDKN2A, RB1, EGFR, RET, EML4, ROS1, KRAS2, TP53, MYC.
- genes include Axin1, MALAT1, b-catenin, p16 INK4A, c-ERBB-2, p53, CTNNB1, RB1, Cyclin D1, SMAD2, EGFR, SMAD4, IGFR2, TCF1, and KRAS.
- Related genes include Alpha, PRCC, ASPSCR1, PSF, CLTC, TFE3, p54nrb / NONO, and TFEB As thyroid cancer-related genes, AKAP10, NTRK1, and AKA 9, RET, BRAF, TFG, ELE1, TPM3, H4 / D10S170, TPR and the like.
- Examples of ovarian cancer-related genes include AKT2, MDM2, BCL2, MYC, BRCA1, NCOA4, CDKN2A, p53, ERBB2, PIK3CA, GATA4, RB, HRAS, RET, KRAS, and RNASET2.
- Examples of prostate cancer-related genes include AR, KLK3, BRCA2, MYC, CDKN1B, NKX3.1, EZH2, p53, GSTP1, and PTEN.
- Examples of bone tumor-related genes include CDH11, COL12A1, CNBP, OMD, COL1A1, THRAP3, COL4A5, and USP6.
- the mode of binding between the biological substance recognition site and the fluorescent substance-encapsulating nanoparticles is not particularly limited, and examples thereof include covalent bonding, ionic bonding, hydrogen bonding, coordination bonding, physical adsorption, and chemical adsorption.
- a bond having a strong bonding force such as a covalent bond is preferred from the viewpoint of bond stability.
- an organic molecule that connects between the biological substance recognition site and the fluorescent substance-containing nanoparticle.
- a polyethylene glycol chain can be used, and SM (PEG) 12 manufactured by Thermo Scientific can be used.
- a silane coupling agent that is a compound widely used for bonding an inorganic substance and an organic substance can be used.
- This silane coupling agent is a compound having an alkoxysilyl group that gives a silanol group by hydrolysis at one end of the molecule and a functional group such as a carboxyl group, an amino group, an epoxy group, an aldehyde group at the other end, Bonding with an inorganic substance through an oxygen atom of the silanol group.
- silane coupling agent having a polyethylene glycol chain (for example, PEG-silane no. SIM6492.7 manufactured by Gelest), etc. Is mentioned.
- silane coupling agent you may use 2 or more types together.
- a publicly known method can be used for the reaction procedure of the fluorescent organic dye-encapsulated silica nanoparticles and the silane coupling agent.
- the obtained fluorescent organic dye-encapsulated silica nanoparticles are dispersed in pure water, aminopropyltriethoxysilane is added, and the mixture is reacted at room temperature for 12 hours.
- fluorescent organic dye-encapsulated silica nanoparticles whose surface is modified with an aminopropyl group can be obtained by centrifugation or filtration.
- the antibody can be bound to the fluorescent organic dye-encapsulated silica nanoparticles via an amide bond.
- a condensing agent such as EDC (1-Ethyl-3- [3-Dimethylaminopropyl] carbodiimide Hydrochloride: manufactured by Pierce) can also be used.
- a linker compound having a site that can be directly bonded to the fluorescent organic dye-encapsulated silica nanoparticles modified with organic molecules and a site that can be bonded to the molecular target substance can be used.
- sulfo-SMCC Sulfosuccinimidyl 4 [N-maleimidomethyl] -cyclohexane-1-carboxylate: manufactured by Pierce
- sulfo-SMCC Sulfosuccinimidyl 4 [N-maleimidomethyl] -cyclohexane-1-carboxylate: manufactured by Pierce
- the same procedure can be applied regardless of whether the fluorescent substance is a fluorescent organic dye or a quantum dot. That is, by impregnating a polystyrene nanoparticle having a functional group such as an amino group with a fluorescent organic dye or a quantum dot, a fluorescent substance-containing polystyrene nanoparticle having a functional group can be obtained, and thereafter EDC or sulfo-SMCC is used. Thus, antibody-bound fluorescent substance-encapsulated polystyrene nanoparticles can be produced.
- the same procedure as that for the fluorescent substance-encapsulated silica nanoparticles can be applied.
- the number of surface amino groups may be increased by reacting melamine nanoparticles with a polyfunctional amine compound in advance.
- the operator immerses the tissue specimen in a container containing xylene to remove paraffin.
- the temperature is not particularly limited, but can be performed at room temperature.
- the immersion time is preferably 3 minutes or longer and 30 minutes or shorter. If necessary, xylene may be exchanged during the immersion.
- the tissue specimen is immersed in a container containing ethanol to remove xylene.
- the temperature is not particularly limited, but can be performed at room temperature.
- the immersion time is preferably 3 minutes or longer and 30 minutes or shorter. Further, if necessary, ethanol may be exchanged during the immersion.
- the tissue specimen is immersed in a container containing water to remove ethanol.
- the temperature is not particularly limited, but can be performed at room temperature.
- the immersion time is preferably 3 minutes or longer and 30 minutes or shorter. Moreover, you may exchange water in the middle of immersion as needed.
- the activation conditions are not particularly defined, but as the activation liquid, 0.01 M citrate buffer (pH 6.0), 1 mM EDTA solution (pH 8.0), 5% urea, 0.1 M Tris-HCl buffer, etc. Can be used.
- the heating device an autoclave, a microwave, a pressure cooker, a water bath, or the like can be used.
- the temperature is not particularly limited, but can be performed at room temperature. The temperature can be 50 to 130 ° C. and the time can be 5 to 30 minutes.
- the tissue specimen after the activation treatment is immersed in a container containing PBS (Phosphate Buffered Saline) and washed.
- PBS Phosphate Buffered Saline
- the temperature is not particularly limited, but can be performed at room temperature.
- the immersion time is preferably 3 minutes or longer and 30 minutes or shorter. If necessary, the PBS may be replaced during the immersion.
- each fluorescent substance-encapsulated nanoparticle PBS dispersion may be mixed in advance or separately placed on a tissue specimen separately. Also good.
- the temperature is not particularly limited, but can be performed at room temperature.
- the reaction time is preferably 30 minutes or more and 24 hours or less.
- a known blocking agent such as BSA-containing PBS
- the stained tissue specimen is immersed in a container containing PBS to remove unreacted fluorescent substance-containing nanoparticles.
- the temperature is not particularly limited, but can be performed at room temperature.
- the immersion time is preferably 3 minutes or longer and 30 minutes or shorter. If necessary, the PBS may be replaced during the immersion. Place the cover glass on the tissue specimen and enclose it. A commercially available encapsulant may be used as necessary.
- staining using a HE dyeing reagent HE dyeing is performed before enclosure with a cover glass.
- a microscope image (fluorescence image) with a wide field of view is acquired from the stained tissue specimen using the microscope image acquisition device 1A.
- an excitation light source and a fluorescence detection optical filter corresponding to the absorption maximum wavelength and fluorescence wavelength of the fluorescent material used for the staining reagent are selected.
- the magnification of the objective lens is preferably 4 to 100 times
- the numerical aperture (NA) is preferably 0.6 or more, more preferably 0.8 or more. It is.
- the sampling pitch of the camera for imaging is preferably 400 nm or less, and more preferably 150 nm or less.
- the operator uses two types of staining reagents, a HE staining reagent and a staining reagent using fluorescent substance-encapsulated nanoparticles bound with a biological substance recognition site that recognizes a specific protein as a fluorescent labeling material. Stain. Thereafter, in the microscope image acquisition apparatus 1A, a bright field image and a fluorescence image are acquired by the following procedures (a1) to (a6). (A1) The operator places the tissue specimen stained with the HE staining reagent and the staining reagent containing the fluorescent substance-containing nanoparticles on the slide, and places the slide on the slide fixing stage of the microscope image acquisition apparatus 1A.
- (A2) Set in the bright field unit, adjust the imaging magnification and focus, place the area to be observed on the tissue specimen in the field of view, and start imaging in the direction of focus depth movement (here, the vertical direction) Set the position, shooting end position, and pitch.
- the slide fixing stage is moved upward or downward to a predetermined photographing start position.
- (A3) Shooting is performed by the imaging unit to generate bright field image data, and the image data is transmitted to the image processing apparatus 2A.
- (A4) Change the unit to a fluorescent unit.
- Photographing is performed by the imaging means without changing the position of the slide fixing stage and the photographing magnification to generate image data of a fluorescent image, and the image data is transmitted to the image processing apparatus 2A.
- FIG. 5 shows a flowchart of image analysis processing in the image processing apparatus 2A.
- the image analysis processing shown in FIG. 5 is executed in cooperation with the control unit 21 and the program stored in the storage unit 25.
- step S1 when a bright field image is input from the microscope image acquisition device 1A through the communication I / F 24 (step S1), the control unit 21 extracts a cell region from the bright field image (step S2).
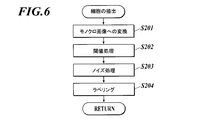
- FIG. 6 shows a detailed flow of the process in step S2. The process of step S2 is executed in cooperation with the control unit 21 and the program stored in the storage unit 25.
- step S2 first, a bright-field image is converted into a monochrome image (step S201).
- FIG. 7A shows an example of a bright field image.
- threshold processing is performed on the monochrome image using a predetermined threshold, and the value of each pixel is binarized (step S202).
- noise processing is performed (step S203).
- the noise process can be performed by performing a closing process on the binary image.
- the closing process is a process in which the contraction process is performed the same number of times after the expansion process is performed.
- the expansion process is a process of replacing a target pixel with white when at least one pixel in the range of n ⁇ n pixels (n is an integer of 2 or more) from the target pixel is white.
- the contraction process is a process of replacing a target pixel with black when at least one pixel in the range of n ⁇ n pixels from the target pixel contains black.
- FIG. 7B shows an example of an image after noise processing. As shown in FIG. 7B, after noise processing, an image (cell image) from which cells are extracted is generated.
- the labeling process is a process for identifying an object in an image by assigning the same label (number) to connected pixels. By the labeling process, each cell can be identified from the image after the noise process and a label can be applied.
- step S3 when a fluorescent image is input from the microscope image acquisition device 1A through the communication I / F 24 (step S3), the control unit 21 extracts fluorescent particles from the fluorescent image (step S4).
- FIG. 8 shows a detailed flow of the process in step S4. The process of step S4 is executed in cooperation with the control unit 21 and the program stored in the storage unit 25.
- step S4 first, a color component corresponding to the wavelength of the fluorescent bright spot is extracted from the fluorescent image (step S401).
- FIG. 9A shows an example of a fluorescence image.
- step S401 for example, when the emission wavelength of the fluorescent particles is 550 nm, only the fluorescent bright spot having the wavelength component is extracted as an image.
- threshold processing is performed on the extracted image to generate a binary image, and a bright spot region is extracted (step S402).
- noise removal processing such as cell autofluorescence and other unnecessary signal components may be performed before the threshold processing, and a low-pass filter such as a Gaussian filter or a high-pass filter such as a second derivative is preferably used.
- FIG. 9B shows an example of an image from which the bright spot region is extracted. As shown in FIG. 9B, a bright spot region centered on the fluorescent bright spot is extracted from such an image.
- step S403 profile creation process
- step S404 the number of fluorescent particles in each bright spot region and the position of each fluorescent particle are calculated.
- the “luminance profile” is luminance value distribution information created based on the image extracted from the fluorescence image using the image from which the luminescent spot region is extracted as a mask. The luminance value in the luminescent spot region and its range (luminance distribution) Spread).
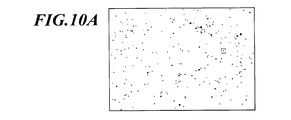
- FIG. 10A is an example of an image in which a bright spot region is extracted from a fluorescence image. Based on the image from which the bright spot area has been extracted, for each bright spot area, the image from which the bright spot area has been extracted (FIG. 10B) and the fluorescence image of the portion corresponding to the bright spot area (FIG. 10C) are superimposed.
- FIG. 10B is an enlarged view of a region surrounded by a square in FIG. 10A and shows one bright spot region.
- FIG. 10C is a fluorescence image of a portion corresponding to the bright spot region of FIG. 10B.
- a bright spot image corresponding to the bright spot area is generated from the fluorescent image (eg, FIG.
- FIG. 10C uses the image from which the bright spot area is extracted (eg, FIG. 10B) as a mask (FIG. 10D).
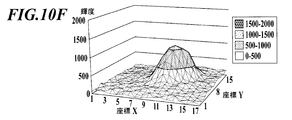
- the brightness value of the bright spot image measured for each pixel and displayed at the X coordinate position and the Y coordinate position is the distribution of brightness values created as a brightness profile in step S403 (FIG. 10E).
- the luminance profile may be one in which the luminance at the X coordinate position and the Y coordinate position is expressed two-dimensionally as shown in FIG. 10E, or as shown in FIG. 10F. ) And the luminance (height) at the Y coordinate position (vertical) may be expressed three-dimensionally.
- one bright spot region includes one or a plurality of fluorescent particles
- the luminance profile includes a luminance value and a range (luminance distribution) corresponding to the number of fluorescent particles and the position of each fluorescent particle.
- a luminance profile of one fluorescent particle is created in advance as a reference profile from an image of a single fluorescent particle taken under the same image capturing conditions as the fluorescent image input in step S3.
- a reference profile created from a fluorescent image in which one fluorescent particle is in focus has a normal distribution shape having one sharp peak at the center as shown in FIG. 11B.
- a reference profile created from a fluorescent image whose focus is shifted downward from the fluorescent particles has a large spread in the vertical and horizontal directions and a low peak as shown in FIG. 11A, for example.
- the reference profile created from the fluorescence image in which the focal point is shifted upward from the fluorescent particles for example, as shown in FIG.
- the center has a slightly low brightness and a concave shape.
- FIGS. 12A to 12C are schematic diagrams showing cross sections of a three-dimensional luminance profile created from the same region of fluorescent images (left diagrams of FIGS. 12A to 12C) acquired at focal depths Z1, Z2, and Z3 at predetermined intervals. It is a figure (each right figure of FIG. 12A-FIG. 12C).
- the luminance profile shown here includes three bright spot regions.
- the leftmost luminance profile shows a normal distribution shape having a sharp peak at the focal depth Z1 (FIG. 12A), but the center is at the focal depth Z2 (FIG. 12B).
- the dent and the spread in the X-axis direction become large. Furthermore, at the focal depth Z3 (FIG.
- the rightmost luminance profile has a concave center at the focal depth Z1 (FIG. 12A) and a very large spread in the X-axis direction, and has a concave center at the focal depth Z2 (FIG. 12B).
- the spread of the direction is slightly narrowed, and a normal distribution shape having a sharp peak at the center is shown at the focal depth Z3 (FIG. 12C).
- the position of the fluorescent particle included in each bright spot region is calculated as a position on the three-dimensional coordinate obtained by adding the focal depth to the position on the two-dimensional coordinate on each fluorescent image.
- the fluorescent image is subjected to a labeling process, and a label is given to the bright spot image at the position of the fluorescent particle calculated in the step S404 (step S405).
- a label for identifying the fluorescent particles in the bright spot image (fluorescent particle image) most focused on the fluorescent particles Will be granted.
- 12A to 12C show an example in which one fluorescent particle is included in each bright spot region. For example, even when a plurality of fluorescent particles are included in one bright spot region, By analyzing a plurality of fluorescent images with different focal depths based on the reference profile, it is possible to separate and measure a plurality of fluorescent particles that appear to overlap on a two-dimensional fluorescent image. Then, for each of the plurality of fluorescent particles, a label is given to the bright spot image (fluorescent particle image) that is most focused.
- the number and position of the fluorescent particles are determined using the luminance profile for one fluorescent particle as a reference profile.
- a luminance profile composed of a plurality of fluorescent particles is prepared in advance as a reference profile. Then, the number and position of the fluorescent particles may be determined.
- the luminance profile itself composed of a plurality of fluorescent particles may be subjected to known arbitrary image processing such as two-dimensional Fourier transform to decompose the waveform to determine the number and position of the fluorescent particles.
- step S2 and step S4 After the process of step S2 and step S4 is completed, the process returns to the process of FIG. 5, the addition process of the cell image (see FIG. 7B) and the fluorescence image is performed (step S5), and one cell given in step S204 is removed. The number of fluorescent particles per cell is calculated from the label shown and the label of the fluorescent particles given in step S405 (calculation step).
- one reconstructed image (focused image) in which a plurality of fluorescent images with different depths of focus are reconstructed is generated (generation process).
- the fluorescent particle image to which the fluorescent particle label is assigned in step S405 is extracted and used for reconstruction of the focused image (extraction process).
- the extracted plurality of fluorescent particle images is, for example, an average value or addition of luminance values for each pixel. Reconstructed into a single image whose value has been calculated. The bright spot image without the label is not used for reconstruction because the focus is shifted from the fluorescent particles.
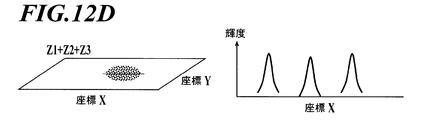
- FIG. 12D is a schematic diagram showing a cross-section of the focused image reconstructed from the three fluorescent images of FIGS. 12A to 12C and the luminance profile of the focused image.
- FIG. 12A A bright spot image with depth Z1 (FIG. 12A), a bright spot image with focal depth Z2 (FIG. 12B) in the central bright spot area, and a bright spot image with focal depth Z3 (FIG. 12C) in the right bright spot area.
- An example extracted and reconstructed as a fluorescent particle image is shown.
- the luminance profile created from the focused image (right diagram in FIG. 12D) has a normal distribution shape having sharp peaks in all the bright spot regions, and an image in which each fluorescent particle is focused is obtained.
- step S6 the reconstructed image and the cell image are superimposed, and an image showing the distribution of the fluorescent particles on the cell is displayed.
- cells are extracted by the processing of steps S1 to S2, the bright spot region is extracted by the processing of steps S3 to S402, and then the fluorescence on the cells is processed by the processing of steps S403 to S404.
- the particle distribution is specifically grasped on the three-dimensional coordinates.
- steps S5 to S6 a bright spot image focused on the fluorescent particles is extracted and reconstructed into a single fluorescent image, and the distribution of the fluorescent particles on the cells is displayed. In this way, it is possible to accurately quantify the expression (number of expression and position of expression) of a specific protein in the observation target cell using a simple microscope, and the bright spot blur focused on each fluorescent particle. No fluorescence image can be obtained.
- the HER2 protein in breast cancer is mentioned as an example of the specific protein, but it is not limited to this.
- the feature quantity that quantitatively indicates the expression level of the specific protein corresponding to the lesion type It can be provided to a doctor.
- each color component is extracted using filter work or the like in step S401, and the processing of steps S402 to S405 is executed for each extracted color component (wavelength component).
- the cell region image is extracted.
- the fluorescent particle image created for each color component may be added.
- the fluorescent particles may be directly bound to a biological substance recognition site that binds to a specific protein as in the above embodiment, but indirectly through another substance, as in a known indirect method in immunostaining. May be combined.
- a secondary antibody having the primary antibody as an antigen may be reacted with a fluorescent particle bound thereto and stained.
- a fluorescent particle modified with streptavidin is reacted with streptavidin. You may dye
- an HDD or a semiconductor non-volatile memory is used as a computer-readable medium of the program according to the present invention, but the present invention is not limited to this example.
- a portable recording medium such as a CD-ROM can be applied.
- a carrier wave carrier wave is also applied as a medium for providing program data according to the present invention via a communication line.
- the mixture was centrifuged at 20000 G for 15 minutes in a centrifuge (Kubota Micro Cooling Centrifuge 3740), and after removing the supernatant, ultrapure water was added and ultrasonically irradiated to redisperse. Centrifugation, supernatant removal, and washing by redispersion in ultrapure water were repeated 5 times.
- the obtained melamine particles were positively charged because the melamine resin itself contains many amino groups in the skeleton. The charge of the particles was evaluated by resin component analysis by NMR, IR, etc. and zeta potential measurement.
- the obtained fluorescent particles were observed with a scanning electron microscope (SEM; Model S-800 manufactured by Hitachi (registered trademark)), and the average particle size and coefficient of variation were calculated.
- fluorescent particles having an average particle diameter of 200, 170, 150, 100, 80, 60, 40, and 20 nm and a variation coefficient of 12% were used.
- Step (1) 1 mg of fluorescent particles was dispersed in 5 mL of pure water. Next, 100 ⁇ L of aminopropyltriethoxysilane aqueous dispersion (LS-3150, manufactured by Shin-Etsu Chemical Co., Ltd.) was added and stirred at room temperature for 12 hours. Step (2): The reaction mixture was centrifuged at 10,000 G for 60 minutes, and the supernatant was removed. Step (3): Ethanol was added to disperse the sediment, followed by centrifugation again. Washing with ethanol and pure water was performed once by the same procedure. When the FT-IR measurement was performed on the resulting amino group-modified fluorescent particles, absorption derived from the amino group could be observed, confirming that the amino group was modified.
- Step (2) The reaction mixture was centrifuged at 10,000 G for 60 minutes, and the supernatant was removed.
- Step (3) Ethanol was added to disperse the sediment, followed by centrifugation again. Washing with ethanol and pure water was performed once by the same procedure
- Step (4) The amino group-modified fluorescent particles obtained in step (3) were adjusted to 3 nM using PBS containing 2 mM of EDTA (ethylenediaminetetraacetic acid).
- Step (6) The reaction mixture was centrifuged at 10,000 G for 60 minutes, and the supernatant was removed.
- Step (7) PBS containing 2 mM of EDTA was added, the precipitate was dispersed, and centrifuged again. The washing
- Step (8) When 100 ⁇ g of the anti-HER2 antibody was dissolved in 100 ⁇ L of PBS, 1 M dithiothreitol (DTT) was added and reacted for 30 minutes.
- Step (11) 4 ⁇ L of 10 mM mercaptoethanol was added to stop the reaction.
- reagent for FISH staining As a probe for FISH staining, a biotinylated HER-2 DNA probe in which biotin was introduced into the HER-2 DNA probe by Nick translation was used.
- the staining reagent b for visualizing the probe includes streptavidin-modified fluorescent particles prepared by using streptavidin instead of anti-HER2 antibody in step (8) of (A1-2), and (A1-3 ) And the same fluorescent dye and quantum dot used in combination with streptavidin.
- B Tissue staining
- IHC Immunohistochemistry
- Step (1) The tissue specimen was immersed in a container containing xylene for 30 minutes. The xylene was changed three times during the process.
- Step (2) The tissue specimen was immersed in a container containing ethanol for 30 minutes. The ethanol was changed three times during the process.
- Step (3) The tissue specimen was immersed in a container containing water for 30 minutes. The water was changed three times along the way.
- Step (4) The tissue specimen was immersed in 10 mM citrate buffer (pH 6.0) for 30 minutes.
- Step (6) The tissue specimen after the autoclave treatment was immersed in a container containing PBS for 30 minutes.
- Step (7) PBS containing 1% BSA was placed on the tissue specimen and allowed to stand for 1 hour.
- Step (11) After adding Aquatex made by Merck Chemicals, a cover glass was placed and sealed.
- B2 Fluorescence in situ hybridization (FISH) method
- FISH Fluorescence in situ hybridization
- HER2 genes are usually present in the cell and may increase to four during cell proliferation.
- the number of genes is 1 to 4.
- C2 Conventional image analysis processing method
- the luminance is obtained by using only one image (single image) in which the outer edge of the cell is in focus among the obtained 20 microscope images.
- the area where the value exceeded a predetermined threshold was measured as a bright spot, and the number of fluorescent particles per cell (the number of bright spots) was calculated.
- Table 1 shows the number of bright spots per cell calculated from the tissue specimen stained with the HER2 protein by the IHC method described in (B1) using the staining reagent a described in (A1).
- Example 1 the number of bright spots was calculated from the tissue specimen stained with the fluorescent particle-derived staining reagent a using the image analysis processing method (C1) of the present invention.
- Comparative Example 1 the number of bright spots was calculated from a tissue specimen stained with a fluorescent particle-derived staining reagent a using a conventional image analysis processing method (C2).
- Comparative Examples 2 and 3 the number of bright spots was calculated from the tissue specimen stained with the fluorescent dye and the staining reagent a derived from quantum dots using the image analysis processing method (C1) of the present invention.
- the IHC method compares the average particle diameter of fluorescent substances and the lot of tissue specimens in the same combination. According to the method (C1) using the reconstructed image and the luminance profile, the number of bright spots was always calculated larger than in the conventional method (C2), and a result close to the true value was obtained.
- the HER2 + tissue sample is always 2.5 times as large as the HER2 ⁇ tissue sample.
- the number of bright spots above (average: about 3.7 times) was calculated.
- the number of bright spots was calculated to be 4.6 to 5.8 times (average: about 5.2 times) that of the HER2 + tissue specimen.
- Comparative Example 1 in the HER2 + tissue sample, 1.3 to 2.3 times (average: about 1.7 times) the number of bright spots were calculated as compared to the HER2 ⁇ tissue sample.
- the number of bright spots was calculated to be 4.6 to 6 times (average: about 5.2 times) that of the HER2 + tissue specimen.
- the fluorescently stained protein can be measured as a fluorescent bright spot. Furthermore, according to the biological material quantification method of the present invention, since analysis is performed using a plurality of fluorescent images with different depths of focus, it is possible to detect fluorescent particles from the whole cell in consideration of the spread in the direction of the depth of focus. it can. Furthermore, since it is possible to separate and measure the adjacent fluorescent particles by the analysis based on the luminance profile, the number of bright spots can be measured more accurately.
- Example 1 and Comparative Example 1 the number of bright spots measured from the tissue specimens with the tissue specimen lots HER2 3+ and HER2 + were compared with the same average particle diameter of the fluorescent particles. The number of bright spots about 2.5 times that of the example was calculated. As described above, according to the present invention, since a large number of bright spots across the depth of focus can be accurately measured, it is easy to detect a slight difference in the expression level, and the difference in the expression level can be detected even when the expression of HER2 is small. It can be clearly distinguished and diagnosed.
- Table 2 shows the number of bright spots per cell calculated from the tissue specimen in which the HER2 gene was stained by the FISH method described in (B2) using the staining reagent b described in (A2).
- Example 2 the number of bright spots was calculated from the tissue specimen stained with the fluorescent particle-derived staining reagent b using the image analysis processing method (C1) of the present invention.
- Comparative Example 4 the number of bright spots was calculated from the tissue specimen stained with the fluorescent particle-derived staining reagent b using the conventional image analysis processing method (C2).
- Comparative Examples 5 and 6 from the tissue specimen stained with the fluorescent dye and the staining reagent b derived from quantum dots, the image analysis processing method (C1) of the present invention and the conventional image analysis processing method (C2) are used. The number of bright spots was calculated.
- the fluorescent dyes and quantum dots have low luminance per molecule, and it has been difficult to obtain a reference luminance profile by changing the depth of focus. Therefore, in Comparative Example 5-1 and Comparative Example 6-1, image analysis processing was performed using the luminance profile of the fluorescent particles.
- Example 2 Focusing on the average particle diameter of fluorescent particles and the relationship between the image analysis method and the number of bright spots, from Example 2 and Comparative Example 4, the average particle diameter of fluorescent particles and the tissue sample in the tissue sample stained with the HER2 gene by the FISH method
- the number of bright spots is always larger than that of the conventional method (Comparative Example 4). Points were calculated (20-55% increase) and results close to true values were obtained.
- the HER2 small amplification tissue specimen calculates the number of bright spots more than about 4 times that of the tissue specimen without HER2 amplification, and HER2 large amplification.
- the number of bright spots about 2.3 times that of the tissue sample with a small HER2 amplification was calculated.
- the degree of increase was not particularly different in any of the particle sizes and the image analysis processing methods shown in Table 2.
- fluorescent particles as the fluorescent material because the number of calculated bright spots is increased even in the case of staining of genes by the FISH method in which fluorescent dyes and quantum dots can be observed as bright spots.
- the change rate of the number of bright spots when the FISH method changes from “no amplification” to “small amplification” is There was almost no difference between the method of the present invention and the conventional method, and all were in the range of 4 to 5 times.
- the change rate of the number of bright spots when “HER2 ⁇ ” is changed to “HER2 +” is the method of the present invention (about 3.7 times) compared to the conventional method (about 1.7 times). Then, it can be said that the rate of change is extremely increased and the sensitivity is improved. From the above results, the method of the present invention is effective for quantification of both genes and proteins, and can calculate the number of bright spots closer to the true value than the conventional method. It has a remarkable effect in protein detection.
- the present invention is characterized in that the number of specific biological substances in a tissue specimen can be accurately quantified, and can be particularly suitably used for generating highly accurate pathological diagnosis information.
Landscapes
- Health & Medical Sciences (AREA)
- Life Sciences & Earth Sciences (AREA)
- Immunology (AREA)
- Engineering & Computer Science (AREA)
- Chemical & Material Sciences (AREA)
- Biomedical Technology (AREA)
- Molecular Biology (AREA)
- Hematology (AREA)
- Urology & Nephrology (AREA)
- Physics & Mathematics (AREA)
- General Health & Medical Sciences (AREA)
- Analytical Chemistry (AREA)
- General Physics & Mathematics (AREA)
- Pathology (AREA)
- Biochemistry (AREA)
- Food Science & Technology (AREA)
- Medicinal Chemistry (AREA)
- Microbiology (AREA)
- Cell Biology (AREA)
- Biotechnology (AREA)
- Biophysics (AREA)
- Nuclear Medicine, Radiotherapy & Molecular Imaging (AREA)
- Investigating, Analyzing Materials By Fluorescence Or Luminescence (AREA)
- Microscoopes, Condenser (AREA)
- Image Processing (AREA)
- Investigating Or Analysing Biological Materials (AREA)
Abstract
La présente invention concerne un procédé de quantification de substance biologique pour quantifier une substance biologique spécifique dans un échantillon dans lequel la substance biologique a été colorée en utilisant, en tant que réactif de coloration, des particules fluorescentes dans lesquelles une pluralité de substances fluorescentes ont été agglomérées, ledit procédé étant caractérisé en ce qu'il comprend une étape d'entrée pour faire varier de façon consécutive une profondeur de champ à un intervalle prescrit et entrér, pour chaque profondeur de champ, une image de fluorescence indiquant la présence de la substance biologique dans l'échantillon sous la forme de points lumineux de fluorescence ; une étape de création de profil pour créer, à partir de l'image de fluorescence à chaque profondeur de champ, une image de point lumineux d'une zone de point lumineux extraite et la création d'un profil de luminosité pour chaque image de point lumineux ; et une étape de calcul pour créer, en tant que profil de référence, un profil de luminosité pour des particules fluorescentes mesurées préalablement, d'analyse du profil de luminosité pour chaque image de point lumineux à chaque profondeur de champ sur la base du profil de référence, et ainsi de calcul du nombre de particules fluorescentes comprises dans la zone de point lumineux.
Priority Applications (1)
| Application Number | Priority Date | Filing Date | Title |
|---|---|---|---|
| JP2016514882A JP6504160B2 (ja) | 2014-04-21 | 2015-04-15 | 生体物質定量方法、画像処理装置、病理診断支援システム及び画像処理プログラム |
Applications Claiming Priority (2)
| Application Number | Priority Date | Filing Date | Title |
|---|---|---|---|
| JP2014-087155 | 2014-04-21 | ||
| JP2014087155 | 2014-04-21 |
Publications (1)
| Publication Number | Publication Date |
|---|---|
| WO2015163211A1 true WO2015163211A1 (fr) | 2015-10-29 |
Family
ID=54332378
Family Applications (1)
| Application Number | Title | Priority Date | Filing Date |
|---|---|---|---|
| PCT/JP2015/061578 Ceased WO2015163211A1 (fr) | 2014-04-21 | 2015-04-15 | Procédé de quantification de substance biologique, dispositif de traitement d'image, système d'aide au diagnostic pathologique, et programme de traitement d'image |
Country Status (2)
| Country | Link |
|---|---|
| JP (1) | JP6504160B2 (fr) |
| WO (1) | WO2015163211A1 (fr) |
Cited By (13)
| Publication number | Priority date | Publication date | Assignee | Title |
|---|---|---|---|---|
| JP2017110986A (ja) * | 2015-12-16 | 2017-06-22 | コニカミノルタ株式会社 | 蛍光画像の合焦位置特定システム、合焦位置特定方法および合焦位置特定プログラム |
| JP2017140006A (ja) * | 2016-02-12 | 2017-08-17 | 大日本印刷株式会社 | 培養状態解析システム及び培養状態解析方法、並びに、プログラム |
| WO2018008309A1 (fr) * | 2016-07-05 | 2018-01-11 | コニカミノルタ株式会社 | Méthode de quantification de substance biologique, dispositif de traitement d'image, système d'aide au diagnostic pathologique, et programme |
| WO2019087853A1 (fr) * | 2017-11-06 | 2019-05-09 | コニカミノルタ株式会社 | Procédé de quantification de matériau biologique, dispositif de traitement d'images, et programme |
| JP2020165765A (ja) * | 2019-03-29 | 2020-10-08 | シスメックス株式会社 | 蛍光画像分析装置及び蛍光画像分析方法 |
| WO2020209217A1 (fr) * | 2019-04-12 | 2020-10-15 | コニカミノルタ株式会社 | Système et procédé de traitement d'image et programme |
| JPWO2019082788A1 (ja) * | 2017-10-26 | 2020-12-17 | コニカミノルタ株式会社 | 画像処理装置、合焦位置特定方法及び合焦位置特定プログラム |
| JPWO2019078230A1 (ja) * | 2017-10-19 | 2020-12-17 | コニカミノルタ株式会社 | 生体物質定量方法、画像処理装置、病理診断支援システム及びプログラム |
| WO2021117153A1 (fr) * | 2019-12-11 | 2021-06-17 | 株式会社日立ハイテク | Dispositif de détection de fluorescence et procédé de détection de fluorescence |
| WO2021124866A1 (fr) * | 2019-12-19 | 2021-06-24 | コニカミノルタ株式会社 | Procédé de traitement d'image, système de traitement d'image, et programme |
| WO2021149356A1 (fr) * | 2020-01-21 | 2021-07-29 | コニカミノルタ株式会社 | Procédé de test du paludisme et dispositif de test du paludisme |
| WO2022059312A1 (fr) * | 2020-09-17 | 2022-03-24 | コニカミノルタ株式会社 | Procédé de sélection d'image focalisée, dispositif de sélection d'image focalisée et programme de sélection d'image focalisée |
| JP2024502171A (ja) * | 2021-01-08 | 2024-01-17 | ライカ マイクロシステムズ シーエムエス ゲゼルシャフト ミット ベシュレンクテル ハフツング | 複数のサンプル用の蛍光顕微鏡 |
Citations (3)
| Publication number | Priority date | Publication date | Assignee | Title |
|---|---|---|---|---|
| JP2008542826A (ja) * | 2005-05-23 | 2008-11-27 | エフ. ヘスス ハラルド | 光変換可能な光学標識を用いる光学顕微鏡法 |
| JP2010540939A (ja) * | 2007-09-26 | 2010-12-24 | マサチューセッツ インスティテュート オブ テクノロジー | 単一半導体ナノクリスタルの高分解能3dイメージング |
| WO2012029342A1 (fr) * | 2010-08-30 | 2012-03-08 | コニカミノルタエムジー株式会社 | Procédé de marquage tissulaire, procédé d'évaluation tissulaire et procédé de détection de biosubstance |
-
2015
- 2015-04-15 WO PCT/JP2015/061578 patent/WO2015163211A1/fr not_active Ceased
- 2015-04-15 JP JP2016514882A patent/JP6504160B2/ja active Active
Patent Citations (3)
| Publication number | Priority date | Publication date | Assignee | Title |
|---|---|---|---|---|
| JP2008542826A (ja) * | 2005-05-23 | 2008-11-27 | エフ. ヘスス ハラルド | 光変換可能な光学標識を用いる光学顕微鏡法 |
| JP2010540939A (ja) * | 2007-09-26 | 2010-12-24 | マサチューセッツ インスティテュート オブ テクノロジー | 単一半導体ナノクリスタルの高分解能3dイメージング |
| WO2012029342A1 (fr) * | 2010-08-30 | 2012-03-08 | コニカミノルタエムジー株式会社 | Procédé de marquage tissulaire, procédé d'évaluation tissulaire et procédé de détection de biosubstance |
Cited By (22)
| Publication number | Priority date | Publication date | Assignee | Title |
|---|---|---|---|---|
| JP2017110986A (ja) * | 2015-12-16 | 2017-06-22 | コニカミノルタ株式会社 | 蛍光画像の合焦位置特定システム、合焦位置特定方法および合焦位置特定プログラム |
| JP2017140006A (ja) * | 2016-02-12 | 2017-08-17 | 大日本印刷株式会社 | 培養状態解析システム及び培養状態解析方法、並びに、プログラム |
| WO2018008309A1 (fr) * | 2016-07-05 | 2018-01-11 | コニカミノルタ株式会社 | Méthode de quantification de substance biologique, dispositif de traitement d'image, système d'aide au diagnostic pathologique, et programme |
| JPWO2018008309A1 (ja) * | 2016-07-05 | 2019-04-25 | コニカミノルタ株式会社 | 生体物質定量方法、画像処理装置、病理診断支援システム及びプログラム |
| US11600020B2 (en) * | 2017-10-19 | 2023-03-07 | Konica Minolta, Inc. | Biological substance quantification method, image processing device, pathological diagnosis support system, and recording medium storing computer readable program |
| JP7184046B2 (ja) | 2017-10-19 | 2022-12-06 | コニカミノルタ株式会社 | 生体物質定量方法、画像処理装置、病理診断支援システム及びプログラム |
| JPWO2019078230A1 (ja) * | 2017-10-19 | 2020-12-17 | コニカミノルタ株式会社 | 生体物質定量方法、画像処理装置、病理診断支援システム及びプログラム |
| EP3702779A4 (fr) * | 2017-10-26 | 2021-01-06 | Konica Minolta, Inc. | Dispositif de traitement d'images, procédé de spécification de position nette, et programme de spécification de position nette |
| JP7173034B2 (ja) | 2017-10-26 | 2022-11-16 | コニカミノルタ株式会社 | 画像処理装置、合焦位置特定方法及び合焦位置特定プログラム |
| JPWO2019082788A1 (ja) * | 2017-10-26 | 2020-12-17 | コニカミノルタ株式会社 | 画像処理装置、合焦位置特定方法及び合焦位置特定プログラム |
| JP7160047B2 (ja) | 2017-11-06 | 2022-10-25 | コニカミノルタ株式会社 | 生体物質定量方法、画像処理装置及びプログラム |
| JPWO2019087853A1 (ja) * | 2017-11-06 | 2020-12-24 | コニカミノルタ株式会社 | 生体物質定量方法、画像処理装置及びプログラム |
| WO2019087853A1 (fr) * | 2017-11-06 | 2019-05-09 | コニカミノルタ株式会社 | Procédé de quantification de matériau biologique, dispositif de traitement d'images, et programme |
| JP2020165765A (ja) * | 2019-03-29 | 2020-10-08 | シスメックス株式会社 | 蛍光画像分析装置及び蛍光画像分析方法 |
| US11781987B2 (en) | 2019-03-29 | 2023-10-10 | Sysmex Corporation | Fluorescence image analyzer and fluorescence image analyzing method |
| JP7403965B2 (ja) | 2019-03-29 | 2023-12-25 | シスメックス株式会社 | 蛍光画像分析装置及び蛍光画像分析方法 |
| WO2020209217A1 (fr) * | 2019-04-12 | 2020-10-15 | コニカミノルタ株式会社 | Système et procédé de traitement d'image et programme |
| WO2021117153A1 (fr) * | 2019-12-11 | 2021-06-17 | 株式会社日立ハイテク | Dispositif de détection de fluorescence et procédé de détection de fluorescence |
| WO2021124866A1 (fr) * | 2019-12-19 | 2021-06-24 | コニカミノルタ株式会社 | Procédé de traitement d'image, système de traitement d'image, et programme |
| WO2021149356A1 (fr) * | 2020-01-21 | 2021-07-29 | コニカミノルタ株式会社 | Procédé de test du paludisme et dispositif de test du paludisme |
| WO2022059312A1 (fr) * | 2020-09-17 | 2022-03-24 | コニカミノルタ株式会社 | Procédé de sélection d'image focalisée, dispositif de sélection d'image focalisée et programme de sélection d'image focalisée |
| JP2024502171A (ja) * | 2021-01-08 | 2024-01-17 | ライカ マイクロシステムズ シーエムエス ゲゼルシャフト ミット ベシュレンクテル ハフツング | 複数のサンプル用の蛍光顕微鏡 |
Also Published As
| Publication number | Publication date |
|---|---|
| JP6504160B2 (ja) | 2019-04-24 |
| JPWO2015163211A1 (ja) | 2017-04-13 |
Similar Documents
| Publication | Publication Date | Title |
|---|---|---|
| JP6504160B2 (ja) | 生体物質定量方法、画像処理装置、病理診断支援システム及び画像処理プログラム | |
| JP5768945B1 (ja) | 生体物質定量方法、画像処理装置、病理診断支援システム及びプログラム | |
| US11035844B2 (en) | Image processing device, pathological diagnosis support system, storage medium for image processing, and image processing method | |
| JP5892238B2 (ja) | 医用画像処理装置及びプログラム | |
| JP6350527B2 (ja) | 画像処理装置、病理診断支援システム、画像処理プログラム及び病理診断支援方法 | |
| US10309900B1 (en) | Biological substance quantitation method, pathological diagnosis support system and recording medium storing computer readable program | |
| JP6717751B2 (ja) | 画像処理方法、画像生成方法、画像処理装置及びプログラム | |
| WO2017126420A1 (fr) | Dispositif et programme de traitement d'image | |
| JPWO2015145644A1 (ja) | 画像処理装置および画像処理プログラム | |
| JP5835536B1 (ja) | 組織評価方法、画像処理装置、病理診断支援システム及びプログラム | |
| JP6493398B2 (ja) | 診断支援情報生成方法、画像処理装置、診断支援情報生成システム及び画像処理プログラム | |
| JP6372370B2 (ja) | 生体物質定量方法、画像処理装置、及びプログラム | |
| JP6337629B2 (ja) | 診断支援情報生成方法、画像処理装置、診断支援情報生成システム及び画像処理プログラム | |
| JP6405985B2 (ja) | 画像処理装置、画像処理システム、画像処理プログラム及び画像処理方法 | |
| JP6375925B2 (ja) | 画像処理装置、画像処理システム、画像処理プログラム及び画像処理方法 |
Legal Events
| Date | Code | Title | Description |
|---|---|---|---|
| 121 | Ep: the epo has been informed by wipo that ep was designated in this application |
Ref document number: 15782524 Country of ref document: EP Kind code of ref document: A1 |
|
| ENP | Entry into the national phase |
Ref document number: 2016514882 Country of ref document: JP Kind code of ref document: A |
|
| NENP | Non-entry into the national phase |
Ref country code: DE |
|
| 122 | Ep: pct application non-entry in european phase |
Ref document number: 15782524 Country of ref document: EP Kind code of ref document: A1 |