WO2016152334A1 - 測色装置および測色方法 - Google Patents
測色装置および測色方法 Download PDFInfo
- Publication number
- WO2016152334A1 WO2016152334A1 PCT/JP2016/054593 JP2016054593W WO2016152334A1 WO 2016152334 A1 WO2016152334 A1 WO 2016152334A1 JP 2016054593 W JP2016054593 W JP 2016054593W WO 2016152334 A1 WO2016152334 A1 WO 2016152334A1
- Authority
- WO
- WIPO (PCT)
- Prior art keywords
- chart
- color
- processing unit
- unit
- image
- Prior art date
- Legal status (The legal status is an assumption and is not a legal conclusion. Google has not performed a legal analysis and makes no representation as to the accuracy of the status listed.)
- Ceased
Links
Images










Classifications
-
- G—PHYSICS
- G01—MEASURING; TESTING
- G01J—MEASUREMENT OF INTENSITY, VELOCITY, SPECTRAL CONTENT, POLARISATION, PHASE OR PULSE CHARACTERISTICS OF INFRARED, VISIBLE OR ULTRAVIOLET LIGHT; COLORIMETRY; RADIATION PYROMETRY
- G01J3/00—Spectrometry; Spectrophotometry; Monochromators; Measuring colours
- G01J3/46—Measurement of colour; Colour measuring devices, e.g. colorimeters
- G01J3/52—Measurement of colour; Colour measuring devices, e.g. colorimeters using colour charts
-
- B—PERFORMING OPERATIONS; TRANSPORTING
- B41—PRINTING; LINING MACHINES; TYPEWRITERS; STAMPS
- B41J—TYPEWRITERS; SELECTIVE PRINTING MECHANISMS, i.e. MECHANISMS PRINTING OTHERWISE THAN FROM A FORME; CORRECTION OF TYPOGRAPHICAL ERRORS
- B41J2/00—Typewriters or selective printing mechanisms characterised by the printing or marking process for which they are designed
- B41J2/525—Arrangement for multi-colour printing, not covered by group B41J2/21, e.g. applicable to two or more kinds of printing or marking process
-
- B—PERFORMING OPERATIONS; TRANSPORTING
- B41—PRINTING; LINING MACHINES; TYPEWRITERS; STAMPS
- B41J—TYPEWRITERS; SELECTIVE PRINTING MECHANISMS, i.e. MECHANISMS PRINTING OTHERWISE THAN FROM A FORME; CORRECTION OF TYPOGRAPHICAL ERRORS
- B41J29/00—Details of, or accessories for, typewriters or selective printing mechanisms not otherwise provided for
- B41J29/46—Applications of alarms, e.g. responsive to approach of end of line
-
- G—PHYSICS
- G01—MEASURING; TESTING
- G01J—MEASUREMENT OF INTENSITY, VELOCITY, SPECTRAL CONTENT, POLARISATION, PHASE OR PULSE CHARACTERISTICS OF INFRARED, VISIBLE OR ULTRAVIOLET LIGHT; COLORIMETRY; RADIATION PYROMETRY
- G01J3/00—Spectrometry; Spectrophotometry; Monochromators; Measuring colours
- G01J3/46—Measurement of colour; Colour measuring devices, e.g. colorimeters
- G01J3/50—Measurement of colour; Colour measuring devices, e.g. colorimeters using electric radiation detectors
-
- G—PHYSICS
- G06—COMPUTING OR CALCULATING; COUNTING
- G06T—IMAGE DATA PROCESSING OR GENERATION, IN GENERAL
- G06T1/00—General purpose image data processing
-
- G—PHYSICS
- G06—COMPUTING OR CALCULATING; COUNTING
- G06T—IMAGE DATA PROCESSING OR GENERATION, IN GENERAL
- G06T7/00—Image analysis
- G06T7/60—Analysis of geometric attributes
-
- H—ELECTRICITY
- H04—ELECTRIC COMMUNICATION TECHNIQUE
- H04N—PICTORIAL COMMUNICATION, e.g. TELEVISION
- H04N1/00—Scanning, transmission or reproduction of documents or the like, e.g. facsimile transmission; Details thereof
- H04N1/00795—Reading arrangements
- H04N1/00798—Circuits or arrangements for the control thereof, e.g. using a programmed control device or according to a measured quantity
- H04N1/00816—Determining the reading area, e.g. eliminating reading of margins
-
- H—ELECTRICITY
- H04—ELECTRIC COMMUNICATION TECHNIQUE
- H04N—PICTORIAL COMMUNICATION, e.g. TELEVISION
- H04N1/00—Scanning, transmission or reproduction of documents or the like, e.g. facsimile transmission; Details thereof
- H04N1/46—Colour picture communication systems
- H04N1/48—Picture signal generators
-
- H—ELECTRICITY
- H04—ELECTRIC COMMUNICATION TECHNIQUE
- H04N—PICTORIAL COMMUNICATION, e.g. TELEVISION
- H04N1/00—Scanning, transmission or reproduction of documents or the like, e.g. facsimile transmission; Details thereof
- H04N1/46—Colour picture communication systems
- H04N1/56—Processing of colour picture signals
- H04N1/60—Colour correction or control
-
- H—ELECTRICITY
- H04—ELECTRIC COMMUNICATION TECHNIQUE
- H04N—PICTORIAL COMMUNICATION, e.g. TELEVISION
- H04N2201/00—Indexing scheme relating to scanning, transmission or reproduction of documents or the like, and to details thereof
- H04N2201/0077—Types of the still picture apparatus
- H04N2201/0081—Image reader
-
- H—ELECTRICITY
- H04—ELECTRIC COMMUNICATION TECHNIQUE
- H04N—PICTORIAL COMMUNICATION, e.g. TELEVISION
- H04N2201/00—Indexing scheme relating to scanning, transmission or reproduction of documents or the like, and to details thereof
- H04N2201/0077—Types of the still picture apparatus
- H04N2201/0089—Image display device
Definitions
- the present invention relates to a color measuring device and a color measuring method for measuring a color, and more particularly, to a color measuring device and a color measuring method capable of appropriately determining a chart area and performing color measurement at an appropriate position in a desired chart area.
- a company that produces a color printed material such as a printing company regularly measures the color of the printed material and adjusts the color of the printing apparatus that printed the printed material in order to maintain the quality of the printed material.
- color adjustment of the printing apparatus for example, original image data called a color chart is printed by the printing apparatus, and each color of each patch in the printed color chart is measured by the color measurement apparatus. Then, the color misregistration amount between the actually measured value of each patch color and the target value of each patch color is evaluated, and the color of the printing apparatus is adjusted according to the evaluation result.
- the color chart includes a plurality of color samples called patches, and each of the plurality of patches is often formed with different colors (hue, brightness, saturation) and arranged in a predetermined manner. Yes.
- color charts There are various types of such color charts. For example, there is a color chart of an aspect configured by arranging a plurality of rectangular patches having various colors vertically and horizontally in a two-dimensional array. In the color chart of this mode, each patch is arranged so that it becomes a random (random) color arrangement according to the content to be evaluated, or the change in shading between adjacent patches like a gradation There are various patterns such as each patch being arranged so that there is less.
- Such a color chart is not only created by the user by using a color chart creation tool provided by the manufacturer of the color measurement device, but also provided by a public institution. As described above, the color chart has a variety of patterns depending on the difference in the shape, arrangement, and color arrangement of the patches.
- Patent Document 1 captures a two-dimensional color image of a color chart to be measured, calculates a patch position by an image processing method using a computer, and performs colorimetry on the determined patch position.
- a method for measuring the color chart by moving the head has been proposed by Gretag-Macbeth.
- the present invention has been made in view of the above circumstances, and an object thereof is to provide a color measuring device and a color measuring method capable of appropriately determining a chart area and performing color measurement at an appropriate position in a desired chart area. It is to be.
- a colorimetric device and a colorimetric method according to the present invention include a plurality of patches obtained based on an image of a color chart for a chart region selected by a user among chart regions extracted based on the color chart image.
- the position of the color measurement unit with respect to the color chart is moved relative to the color chart by the movement unit, and the color of each of the plurality of patches is measured by the color measurement unit. Therefore, the color measurement device and the color measurement method according to the present invention can appropriately determine the chart area and perform color measurement at an appropriate position in the desired chart area.
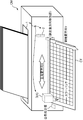
- FIG. 1 is a perspective view illustrating a schematic configuration of a color measurement device according to an embodiment. It is a schematic side view which shows the arrangement
- FIG. 1 is a perspective view illustrating a schematic configuration of a color measuring device according to an embodiment.
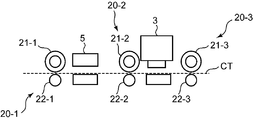
- FIG. 2 is a schematic side view illustrating an arrangement relationship between the imaging unit and the color measurement unit in the color measurement device according to the embodiment.
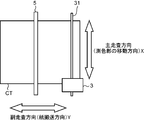
- FIG. 3 is a schematic top view illustrating an arrangement relationship between the imaging unit and the color measurement unit in the color measurement device according to the embodiment.
- FIG. 4 is a block diagram illustrating an electrical configuration of the color measurement device according to the embodiment.
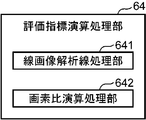
- FIG. 5 is a block diagram illustrating a configuration of an evaluation index calculation processing unit in the color measurement device according to the embodiment.
- the color measurement device CM in the present embodiment is a device that measures the color (hue, lightness, and saturation) of a measurement object that is a color measurement target.
- a sub-scanning direction moving unit (sheet conveying unit) 2 a color measuring unit 3
- a main scanning direction moving unit 4 an imaging unit 5
- a control processing unit 6 an input unit 7, and an output unit 8
- the interface unit (IF unit) 9 and the storage unit 10 are provided.
- the sheet feeding unit 1 is a sheet conveyance mechanism that is connected to the control processing unit 6 and takes in the sheet of the object to be measured set in the color measurement device CM into the color measurement device CM according to the control of the control processing unit 6. .
- the sheet of the object to be measured may be an arbitrary sheet.
- the sheet is a color chart CT including a plurality of patches that are areas of a predetermined color on a predetermined sheet.
- the sheet feeding unit 1 includes, for example, a storage unit that stores a sheet of the object to be measured, and a pickup roller that picks up the sheet of the object to be measured stored in the storage unit and takes it into the color measurement device CM.
- a take-in unit configured to include a feed roller configured to include, for example, a transport roller that transports the sheet of the object to be measured captured by the capture unit to the sub-scanning direction moving unit 2.
- the sub-scanning direction moving unit (sheet conveying unit) 2 is connected to the control processing unit 6, and in accordance with the control of the control processing unit 6, the sheet of the measurement object sent from the paper feeding unit 1 is set in advance as the main scanning direction.
- This is a sheet transport mechanism that transports a predetermined amount by a unit transport command (second unit transport command) in the sub-scanning direction (second direction) orthogonal to the first direction.
- the sub-scanning direction moving unit 2 is configured so that it can be conveyed in the forward and reverse directions along the sub-scanning direction.
- the forward feed is, for example, transporting the sheet of the object to be measured from the upstream side (sheet feeding unit 1 side) to the downstream side (discharge side), and the reverse feed is in the direction opposite to the forward feed direction, that is, This is to convey a sheet of the object to be measured from the downstream side to the upstream side.
- the sub-scanning direction moving unit 2 includes, for example, a plurality of sets of sheet conveying roller units and a driving unit that rotationally drives the sheet conveying rollers.
- Each set of sheet conveying roller units includes a driving roller that is driven to rotate by the driving unit and a driven roller that is driven to rotate in accordance with the rotational driving of the driving roller.
- the drive unit includes, for example, a stepping motor (sub-scanning stepping motor).
- the sub-scanning stepping motor receives a single drive pulse (second drive pulse, an example of the second unit transport command), so that a predetermined pulse is input.
- the drive roller is rotated by a predetermined angle (22nd angle) by the rotation of the sub-scanning stepping motor, and the object to be measured is rotated by the rotation of the drive roller.
- This sheet is conveyed (moved) by a predetermined amount along the sub-scanning direction. More specifically, in the example shown in FIG. 2, the sub-scanning direction moving unit 2 includes three sets of first to third sheet conveying roller units 20-1 to 20-3.
- the first to third sheet conveying roller units 20-1 to 20-3 are sequentially arranged from the upstream side to the downstream side along the sub-scanning direction.
- Each of the first to third sheet conveying roller units 20-1 to 20-3 includes first to third driving rollers 21-1 to 21-3 and first to third driven rollers 22-1 to 22-3.
- the first to third drive rollers 21-1 to 21-3 are rotated by first to third stepping motors (not shown) that rotate in synchronization with each other.
- the sheet of the object to be measured sent from the paper feeding unit 1 is sandwiched between a pair of the first driving roller 21-1 and the first driven roller 22-1 in the forward feeding, and the first driving roller 21-1 Is driven to rotate in the forward direction (for example, counterclockwise) by the driving unit, and is conveyed from the first sheet conveying roller unit 20-1 to the second sheet conveying roller unit 20-2.
- the sheet of the object to be measured conveyed to the second sheet conveying roller unit 20-2 is similarly transferred from the second sheet conveying roller unit 20-2 to the third sheet conveying roller unit 20- by the second sheet conveying roller unit 20-2. 3 is conveyed.
- the sheet of the object to be measured conveyed to the third sheet conveying roller unit 20-3 is similarly conveyed downstream from the third sheet conveying roller unit 20-3 by the third sheet conveying roller unit 20-3.
- these first to third drive rollers 21-1 to 21-3 are rotationally driven in the reverse direction (clockwise in the above example) by the drive unit,
- the sheet of the object to be measured is conveyed from the downstream side to the upstream side.
- the main scanning direction (first direction) is the X direction (horizontal direction)
- the coordinate axis set along the X direction is the X axis
- the sub-scanning direction (second direction) is A Y-axis (vertical direction) is set, and a coordinate axis set along the Y-direction is set as a Y-axis, and these are appropriately used (hereinafter, this two-dimensional coordinate system is referred to as a world coordinate system).
- these X-axis and Y-axis are defined at a predetermined position in an image in which the coordinate origin (world coordinate origin) PO0 is captured by the imaging unit 5, for example, the upper left vertex ( By setting the upper left corner), the X and Y axes of the world coordinate system XY coincide with each other (see FIG. 8).
- the color measuring unit 3 is a device that is connected to the control processing unit 6 and measures the color of the object to be measured in accordance with the control of the control processing unit 6.
- the color measurement unit 3 is, for example, a color measurement sensor that acquires predetermined optical information in the measurement object in order to obtain the color of the measurement object.
- a colorimetric unit 3 includes, for example, a spectroscopic optical element, a photoelectric conversion element, and the like for measuring the reflectance (or transmittance) of each wavelength, and the object color is changed to the reflectance (or transmittance) of each wavelength. ) Based on the spectroscopic colorimeter.
- the colorimetric unit 3 includes an optical filter, a photoelectric conversion element, and the like for measuring RGB tristimulus values, and measures a color of an object based on a color difference of the tristimulus values. It is.
- the color measuring unit 3 measures the white calibration by measuring a so-called white calibration plate (standard white plate) that can reflect the wavelength in the measurement range with a high reflectance (for example, about 90% to about 99%), as indicated by a broken line in FIG. Is done.
- the main scanning direction moving unit 4 is connected to the control processing unit 6, and in accordance with the control of the control processing unit 6, the color measurement unit 3 is moved in the main scanning direction (first direction) by a predetermined unit conveyance command (first unit conveyance command). It is a moving mechanism which moves every predetermined amount.
- the main scanning direction moving unit 4 includes, for example, a guide member that guides the color measuring unit 3, and a feed mechanism such as a rack and pinion (rack and pinion) or a feed screw that is guided by the guide member and moves the color measuring unit 3. And a feed mechanism drive unit such as a stepping motor (main scanning stepping motor) for driving the feed mechanism. For example, as shown in FIG.
- the main scanning direction moving unit 4 is provided in a colorimetric unit 3 and a rack 31 cut into a flat rod extending along the main scanning direction.
- a pinion (not shown) that is rotationally driven by a stepping motor is provided, and the pinion and the rack 31 mesh with each other.
- the main scanning stepping motor receives a single driving pulse (a first driving pulse, an example of the first unit transport command), so that a predetermined driving pulse is input.
- the pinion is also rotated by a predetermined angle (a twelfth angle) by the rotation of the main scanning stepping motor, and the colorimetric unit 3 is rotated by the rotation of the pinion. Then, it is moved along the rack 31 by a predetermined amount in the main scanning direction.
- the imaging unit 5 is an apparatus that is connected to the control processing unit 6 and captures an optical image of an object under the control of the control processing unit 6.
- the imaging unit 5 includes, for example, a line sensor (linear image sensor) in which a plurality of photoelectric conversion elements are arranged along one direction, and as illustrated in FIG. 3, the arrangement direction of the plurality of photoelectric conversion elements.
- the one direction is aligned with the main scanning direction (X direction) so as to extend along the main scanning direction (X direction).
- the image pickup unit 5 is disposed between the first sheet conveyance roller unit 20-1 and the second sheet conveyance roller unit 20-2, and the color measurement unit 3 and the main scanning direction are arranged.
- the moving unit 4 is arranged such that the color measuring unit 3 moves along the main scanning direction between the second sheet conveying roller unit 20-2 and the third sheet conveying roller unit 20-3.
- the imaging unit 5 captures the sheet of the object to be measured for each line along the main scanning direction (X direction) while conveying the sheet of the object to be measured in the sub scanning direction (Y direction) by the sub scanning direction moving unit 2. Thus, an image (image data) of the sheet of the object to be measured is generated.
- the relative position Y between the measurement object sheet and the color measurement unit 3 in the sub-scanning direction can be changed.
- the relative position X between the sheet of the object to be measured and the color measuring unit 3 in the main scanning direction can be changed by moving the color measuring unit 3 itself in the main scanning direction (X direction) by the main scanning direction moving unit 4.
- the color measuring unit 3 can move to an arbitrary position (X, Y) on the sheet of the object to be measured, and can measure the color at the position (X, Y).
- the color measuring unit 3 can move only in the main scanning direction by the main scanning direction moving unit 4 with respect to the sheet of the object to be measured.
- the movement of the sheet to be measured along the sub-scanning direction is executed by the sub-scanning direction moving unit (paper transport unit) 2. Therefore, in the present embodiment, the main scanning direction moving unit 4 and the sub scanning direction moving unit 2 correspond to an example of a moving unit that relatively moves the position of the colorimetric unit with respect to the sheet of the object to be measured.
- the input unit 7 is connected to the control processing unit 6 and, for example, various commands such as a command for instructing colorimetry of the object to be measured, and various types necessary for colorimetry such as input of an identifier in the object to be measured, for example.
- a device that inputs data to the color measurement device CM such as a plurality of input switches, a keyboard, and a mouse assigned with predetermined functions.
- the output unit 8 (display unit) is connected to the control processing unit 6, and commands and data input from the input unit 7 and the object to be measured measured by the color measurement device CM according to the control of the control processing unit 6.
- a device that outputs a color for example, a display device such as a CRT display, a liquid crystal display, and an organic EL display.
- a touch panel may be configured from the input unit 7 and the output unit 8.
- the input unit 7 is a position input device that detects and inputs an operation position such as a resistive film method or a capacitance method
- the output unit 8 is a display device.
- a position input device is provided on the display surface of the display device, one or more input content candidates that can be input to the display device are displayed, and the user touches the display position where the input content to be input is displayed. Then, the position is detected by the position input device, and the display content displayed at the detected position is input to the color measurement device CM as the operation input content of the user.
- the color measurement device CM that is easy for the user to handle is provided.
- the IF unit 9 is a circuit that is connected to the control processing unit 6 and inputs / outputs data to / from an external device according to the control of the control processing unit 6, for example, an interface circuit of RS-232C that is a serial communication system
- the storage unit 10 is a circuit that is connected to the control processing unit 6 and stores various predetermined programs and various predetermined data under the control of the control processing unit 6.
- the various predetermined programs include a color measurement program for measuring the color of the object to be measured and a chart area detection program for obtaining the chart area of the color chart CT when the object to be measured is the color chart CT.
- a control processing program such as a position measurement program for obtaining each position of each patch in the color chart CT is included.
- the various predetermined data includes image data of the color chart CT that is the object to be measured, data indicating each position of each patch in the color chart CT, and the like.
- the storage unit 10 includes, for example, a ROM (Read Only Memory) that is a nonvolatile storage element, an EEPROM (Electrically Erasable Programmable Read Only Memory) that is a rewritable nonvolatile storage element, and the like.
- the storage unit 10 includes a RAM (Random Access Memory) that serves as a working memory of the so-called control processing unit 6 that stores data generated during execution of the predetermined program.
- the control processing unit 6 is a circuit for controlling each unit of the color measurement device CM according to the function of each unit and determining the color of the object to be measured.
- the control processing unit 6 includes, for example, a CPU (Central Processing Unit) and its peripheral circuits.
- a control processing program is executed, whereby a control unit 61, an image acquisition processing unit 62, a chart region candidate extraction processing unit 63, an evaluation index calculation processing unit 64, a chart region determination processing unit 65, a patch A position processing unit 66, a color measurement processing unit 67, a determination criterion setting unit 68, and a chart area selection processing unit 70 are functionally configured.
- the control unit 61 is for controlling each unit of the color measurement device CM according to the function of each unit.
- the image acquisition processing unit 62 acquires an image on a sheet of an object to be measured such as a color chart CT by the imaging unit 5, for example. More specifically, in the present embodiment, since the imaging unit 5 is configured to include a line sensor or the like, the image acquisition processing unit 62, for example, a sheet of an object to be measured such as a color chart CT in the sub-scanning direction. An image of the sheet of the object to be measured is acquired by taking an image with the imaging unit 5 while being conveyed by the moving unit (paper conveying unit) 2.
- the chart area candidate extraction processing unit 63 extracts a chart area candidate that is a chart area candidate in which a plurality of patches exist based on the image of the color chart CT acquired by the image acquisition processing unit 62. More specifically, for example, the chart area candidate extraction processing unit 63 binarizes the image of the color chart CT acquired by the image acquisition processing unit 62, and an image (binarized image) obtained by this binarization. Then, a region having a predetermined patch area or more is extracted as a chart region candidate.
- the evaluation index calculation processing unit 64 obtains an evaluation value indicating the degree to which the chart region candidate is a chart region based on the chart region candidate image for the chart region candidate extracted by the chart region candidate extraction processing unit 63. . More specifically, in this embodiment, the evaluation index calculation processing unit 64 includes a line image analysis line processing unit 641 and a pixel ratio calculation processing unit 642 as shown in FIG.
- the line image analysis line processing unit 641 obtains a chart region candidate line image based on the chart region candidate image, and obtains a straight line included in the obtained line image as an analysis line.
- the pixel ratio calculation processing unit 642 selects the first pixel number that is the total number of pixels constituting the image of the color chart CT acquired by the image acquisition processing unit 62 and the line image obtained by the line image analysis line processing unit 641.
- a ratio with the second pixel number which is the total number of pixels that overlap within a predetermined range, is obtained from the analysis line obtained by the line image analysis processing unit 641, and an evaluation value is obtained based on the obtained ratio.
- the predetermined range is appropriately set in advance. Note that the pixel ratio calculation processing unit 642 may obtain the total number of pixels in the overlapping portion between the line image and the analysis line obtained by the line image analysis line processing unit 641 as the second pixel number.
- the pixel ratio calculation processing unit 642 may be the ratio of the first pixel number and the second pixel number itself as the evaluation value, or the pixel ratio calculation processing unit 642 may be the first pixel number and the second pixel number.
- a result obtained by performing at least one of addition, subtraction, multiplication and division on a predetermined constant (parameter) with respect to the ratio with the number of pixels may be used as the evaluation value.
- the chart region determination processing unit 65 is extracted by the chart region candidate extraction processing unit 63 based on the evaluation value obtained by the evaluation index calculation processing unit 64 corresponding to the chart region candidate extracted by the chart region candidate extraction processing unit 63. It is determined whether or not the chart area candidate is a chart area. More specifically, in this embodiment, the chart area determination processing unit 65 is obtained by the evaluation index calculation processing unit 64 corresponding to the chart area candidate extracted by the chart area candidate extraction processing unit 63 by using the determination criterion. Based on the evaluated value, it is determined whether or not the chart area candidate extracted by the chart area candidate extraction processing unit 63 is a chart area.
- the patch position processing unit 66 obtains the positions of a plurality of patches based on the color chart image acquired by the image acquisition processing unit 62 for the chart region candidate determined by the chart region determination processing unit 65 as a chart region. It is. More specifically, in the present embodiment, the patch position processing unit 66 uses, for example, an edge filter that is used to detect an edge extending in one direction in the image in the chart region, and outputs the image of the color chart CT. By performing binarization processing, binary horizontal edge image data and binarized vertical edge image data are generated in each of the horizontal direction (main scanning direction, X direction) and the vertical direction (sub scanning direction, Y direction). The generated binarized horizontal edge image data and binarized vertical edge image data are further subjected to Hough transform to detect the horizontal edge line and the vertical edge line in the horizontal direction and the vertical direction, respectively. Each intersection is obtained as each position of each patch.
- the color measurement processing unit 67 uses the sub-scanning direction moving unit 2 and the main scanning direction moving unit 4 to relatively position the position of the color measuring unit 3 with respect to the color chart CT at each position of the plurality of patches obtained by the patch position processing unit 66.
- the color measurement unit 3 measures the color of each of the plurality of patches.
- the determination criterion setting unit 68 sets the determination criterion used in the chart area determination processing unit 65. More specifically, in this embodiment, the determination criterion setting unit 68 is a determination criterion setting unit 68a that sets the determination criterion based on the evaluation value obtained by the evaluation index calculation processing unit 64, for example.
- the chart area selection processing unit 70 includes an image (chart area frame) indicating the chart area determined by the chart area determination processing unit 65, and an image (patch mark) indicating each position of the plurality of patches obtained by the patch position processing unit 66.
- image hatch mark
- the chart area selection processing unit 70 includes an image (chart area frame) indicating the chart area determined by the chart area determination processing unit 65, and an image (patch mark) indicating each position of the plurality of patches obtained by the patch position processing unit 66.
- FIG. 7 is a flowchart illustrating the operation of the chart area candidate extraction processing unit in the color measurement device according to the embodiment.
- FIG. 8 is a diagram for explaining the operation of the chart region candidate extraction processing unit in the color measurement device of the embodiment.
- FIG. 9 is a flowchart illustrating the operation of the evaluation index calculation processing unit in the color measurement device according to the embodiment.
- FIG. 10 is a diagram for explaining the operation of the evaluation index calculation processing unit in the color measurement device according to the embodiment.
- FIG. 11 is a flowchart illustrating the operation of the chart area determination processing unit in the color measurement device according to the embodiment.
- FIG. 12 is a diagram illustrating an example of a processing result obtained by processing an image at a certain position in the Y direction with a difference filter at N difference intervals along the horizontal direction with respect to the color chart illustrated in FIG.
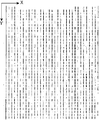
- FIG. 13 is a diagram illustrating a binarized vertical edge image of a color chart as an example.
- FIG. 14 is a diagram illustrating a part of a vertical edge line of a color chart as an example.
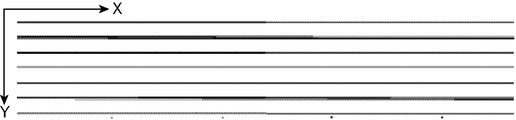
- FIG. 15 is a diagram showing a binarized horizontal edge image of a color chart as an example.
- FIG. 16 is a diagram showing a part of a horizontal edge line of a color chart as an example.
- FIG. 17 is a diagram illustrating a part of the position of each patch obtained from the vertical edge line and the horizontal edge line of the color chart as an example.
- a solid line indicates a vertical edge line or a horizontal edge line
- a broken line indicates an intermediate line between vertical edge lines or an intermediate line between horizontal edge lines
- ⁇ indicates the position of each measured patch (measured patch).
- Position FIG. 18 is a diagram illustrating another example of the color chart.
- FIG. 20 is a diagram illustrating an example of a selection screen displayed on the output unit of the color measurement device according to the embodiment.
- FIG. 21 is a diagram illustrating an example of the configuration and contents of display data of a chart area and patch marks displayed on the selection screen of the color measurement device according to the embodiment.
- FIG. 22 is a flowchart illustrating the operation of the chart area selection processing unit in the color measurement device according to the embodiment.
- the color measurement device CM in the present embodiment operates as follows when measuring each patch of the color chart CT.
- the color chart CT is set in the paper feeding unit 1 and the start of color measurement of the color chart CT is instructed from the input unit 7, the color measurement device CM first, as shown in FIG. Is acquired by the image acquisition processing unit 62 (S1, image acquisition processing step). More specifically, the image acquisition processing unit 62 of the control processing unit 6 sequentially feeds the color chart CT by the sub-scanning direction moving unit 2, and from the one end to the other end of the paper of the color chart CT in the sub-scanning direction (Y direction). ), The color chart CT is imaged by the imaging unit 5 for each line along the main scanning direction (X direction) in synchronization with the conveyance in the sub-scanning direction. To get. The acquired entire image of the color chart CT is stored in the storage unit 10.
- an image IMa of the color chart CTa shown in FIG. 8A is acquired.
- the color chart CTa shown in FIG. 8A not only includes chart areas CA-1 to CA-6 on the left side and the lower part in plan view, but also normal image areas IMA-1, IMA- 2 is included in the upper part in a plan view, and a normal image area IMA-3 of a normal image showing a person is included slightly to the right in the plan view.
- the color measurement device CM extracts a chart area candidate that is a candidate for a chart area in which a plurality of patches exist based on the image of the color chart CT acquired by the image acquisition processing unit 62 (S2, chart area candidate). Extraction process).
- the chart area candidate extraction processing unit 63 of the control processing unit 6 operates as follows.
- the chart area candidate extraction processing unit 63 binarizes the image of the color chart CT acquired by the image acquisition processing unit 62 (S11). More specifically, the pixel value of the brightness of each pixel in the image of the color chart CT is compared with a preset threshold value (first threshold value) th1 by the chart area candidate extraction processing unit 63, respectively.
- first threshold value a preset threshold value
- the chart area candidate extraction processing unit 63 removes noise (S12).
- noise binary image data is generated. For example, when there is only a pixel with a pixel value of 0 around a pixel with a pixel value of 1 (for example, when the pixel values of all the pixels adjacent to the pixel are 0), the pixel value of 1 The pixel is determined to be noise, and the pixel value of the pixel is replaced with 0.
- the chart area candidate extraction processing unit 63 continuously collects a plurality of pixels having a pixel value of 1 (a plurality of pixels having a pixel value of 1 and adjacent to each other) into one pixel value 1.
- Region (significant image region) is generated, and a label (eg, serial number) h of the significant image region is assigned to the generated significant image region as an identifier (ID) for distinguishing and identifying each other (S13). .
- the chart area candidate extraction processing unit 63 determines whether or not the area of the significant image area obtained by the process S13 is equal to or larger than a preset minimum patch area, and thereby significant than the minimum patch area.
- An image area is extracted as a chart area candidate, a rectangle circumscribing the extracted chart area candidate (a circumscribed rectangle) is calculated, and the calculation result is stored in the storage unit 10 (S14).
- the minimum patch area is a value set in advance as the minimum area of the patch. Therefore, the chart area candidate is configured with one patch as well as a plurality of patches. Including the case.
- the coordinate values of the four vertices in the circumscribed rectangle of the chart area candidate are obtained, and the obtained coordinate values are stored in the storage unit 10 in association with the label i of the chart area candidate.
- an XY orthogonal coordinate system (world coordinate system XY) in which the upper left vertex in the image is the coordinate origin (world coordinate origin) PO0 is set in the image.
- the world coordinate system XY has an X axis along the X direction (horizontal direction) in the main scanning direction, and is set to have a Y axis along the Y direction (vertical direction) in the sub scanning direction orthogonal to the X axis. Is done.
- the chart area candidate CCA thus obtained as the chart area CA.
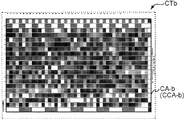
- the chart area candidate CCA-b having the circumscribed rectangle shown in FIG. 18 is detected by each of the processes S11 to S14. Consistent with CA-b.
- the processes shown in FIG. As described above, the areas corresponding to the normal image areas IMA-1 to IMA-3 are also extracted as the chart candidate areas CCA-2 to CCA-4, and the chart area candidate CCA does not coincide with the chart area CA.
- the colorimetric apparatus CM according to the present embodiment further performs the following processes S3 and S4.
- the colorimetry device CM next selects the chart area candidate CCA in the chart area CA based on the image of the chart area candidate CCA for the chart area candidate CCA extracted by the chart area candidate extraction processing unit 63.
- An evaluation value representing a certain degree is obtained (S3, evaluation index calculation processing step).
- the evaluation index calculation processing unit 64 of the control processing unit 6 operates as follows.
- the evaluation index calculation processing unit 64 acquires the chart area candidate CCA-i of the label i from the storage unit 10 from the chart area candidates CCA extracted by the chart area candidate extraction processing unit 63 (S21).
- the label i is initialized to 1 when the evaluation index calculation processing unit 64 starts processing.
- the line image analysis processing unit 641 of the evaluation index calculation processing unit 64 uses the line image of the chart area candidate CCA-i based on the image of the chart area candidate CCA-i for the chart area candidate CCA-i of the label i. (Line drawing image) is obtained, and a straight line included in the obtained line image is obtained as an analysis line (S22). More specifically, the line image analysis processing unit 641 performs differentiation processing and thinning processing on the image of the chart area candidate CCA-i using a known image processing filter to generate a line image of the thinned image. Then, the line image analysis line processing unit 641 performs Hough conversion on the line image to obtain an analysis line.
- the Hough transform is a known digital image processing that detects a straight line.
- an analysis line may be obtained by a least square method.
- the line image analysis line processing unit 641 since the patch is rectangular, the line image analysis line processing unit 641 has an analysis line (horizontal analysis line) extending in the horizontal direction (main scanning direction, X direction) and a vertical direction (sub-scanning). An analysis line (longitudinal analysis line) extending along the direction and the Y direction is obtained.
- the pixel ratio calculation processing unit 642 of the evaluation index calculation processing unit 64 configures the total number of pixels constituting the image IM of the color chart CT acquired by the image acquisition processing unit 62, more preferably the chart area candidate CCA-i.
- a first pixel number Pix (ALL) which is the total number of pixels to be calculated is obtained (S23).
- the pixel ratio calculation processing unit 642 superimposes the line image generated by the line image analysis line processing unit 641 and the analysis line (in this example, the horizontal analysis line and the vertical analysis line, respectively) (S24).
- the pixel ratio calculation processing unit 642 obtains the total number of pixels in the line image that overlap within the predetermined range ⁇ L from the analysis line as the second pixel number Pix (Lines) (S25).
- the pixel ratio calculation processing unit 642 obtains the total number of pixels of the line image that overlap within a predetermined range ⁇ L from the horizontal analysis line as the second horizontal pixel number Pix (Lines Hor), and obtains the line image.
- the total number of pixels that overlap within a predetermined range ⁇ L from the vertical analysis line is obtained as the second vertical pixel number Pix (LinesVer).
- the pixel ratio calculation processing unit 642 may obtain the total number of pixels in the overlapping portion between the line image and the analysis line as the second pixel number.
- the pixel ratio calculation processing unit 642 obtains a ratio between the first pixel number Pix (ALL) and the second pixel number Pix (Lines), and obtains an evaluation value Eva (i) based on the obtained ratio. (S26 to S28). More specifically, in the present embodiment, the pixel ratio calculation processing unit 642 calculates a ratio between the first pixel number Pix (ALL) and the second vertical pixel number Pix (LinesVer), and the calculated ratio is calculated in the vertical direction.
- the pixel ratio calculation processing unit 642 calculates a ratio between the first pixel number Pix (ALL) and the second horizontal pixel number Pix (LinesHor), and uses the calculated ratio as a horizontal evaluation value EvaHor (i).
- (EvaHor (i) Pix (LinesHor) / Pix (ALL)) (S27).
- the pixel ratio calculation processing unit 642 compares the vertical evaluation value EvaVer (i) with the horizontal evaluation value EvaHor (i), and determines the smaller value as the evaluation value Eva. (I) and the obtained evaluation value Eva (i) is stored in the storage unit 10 (S28).
- the vertical evaluation value EvaVer (i) and the horizontal evaluation value EvaHor (i) are simple average values or weighted average values weighted with weights according to the aspect ratio of the color chart CT as evaluation values Eva (i). It may be said.
- the line image and the analysis line in the chart area CA almost represent the outline of the patch, so the line image and the analysis line match with a relatively high probability.
- the line image and the analysis line in the normal image area IMA usually do not match very much.
- the evaluation value Eva (i) obtained as described above is a better evaluation value that represents the degree to which the chart area candidate CCA is the chart area CA.
- the vertical analysis line and the horizontal analysis line are obtained, and the vertical evaluation value EvaVer (i) and the horizontal evaluation value EvaHor (i) are obtained.
- Either one of them may be required. That is, only the vertical analysis line and the vertical evaluation value EvaVer (i) may be obtained and the vertical evaluation value EvaVer (i) may be set as the evaluation value Eva (i).
- the horizontal analysis line and the horizontal evaluation value EvaHor (i) Only the horizontal evaluation value EvaHor (i) may be obtained as the evaluation value Eva (i).
- the evaluation index calculation processing unit 64 determines whether or not evaluation values Eva (i) have been obtained for all the chart area candidates CCA-i (S29). If there is a chart area candidate CCA-i for which the evaluation value Eva (i) has not been calculated as a result of this determination (No), the label i is incremented by 1 and the process returns to the process S21. On the other hand, as a result of the determination, when the calculation of the evaluation value Eva (i) is completed for all the chart area candidates CCA-i (Yes), the evaluation index calculation processing step S3 is ended.
- the color measurement device CM uses the determination criterion to obtain the evaluation value obtained by the evaluation index calculation processing unit 64 corresponding to the chart region candidate CCA extracted by the chart region candidate extraction unit 63. Based on this, it is determined whether the chart area candidate CCA extracted by the chart area candidate extraction unit 63 is the chart area CA (S4, chart area determination processing step).
- the chart area candidate processing unit 65 of the control processing unit 6 operates as follows.
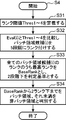
- the chart area determination processing unit 65 defines first to fourth rank thresholds Thres1 to Thres4 in order to sort the evaluation value Eva (i) into five stages (S31).
- the chart area determination processing unit 65 divides the maximum evaluation value Eva (i) into five equal parts, and sets the respective boundary values divided into five as first to fourth rank threshold values Thres1 to Thres4.
- the chart area determination processing unit 65 compares each evaluation value Eva (i) of each chart area candidate CCA-i with each of the first to fourth rank threshold values Thres1 to Thres4, and selects one of the five levels. Ranking crab (S32).
- the chart area determination processing unit 65 sets the highest rank as the reference rank BaseRank, and sets a rank that is two steps below the reference rank BaseRank as a determination reference (S33). Since there is always one chart area CA in the color chart CT, the highest rank is set as the reference rank BaseRank, and the chart area CA until the chart area candidate CCA-i having two ranks below the reference rank BaseRank is provided. It is regarded as.
- the chart area determination processing unit 65 determines the chart area candidate CCA-i having a rank equal to or higher than the determination criterion as the chart area CA, and sets the chart area candidate CCA-i having a rank lower than the determination criterion as the non-chart area. Determination is made (S34), and the chart area determination processing step is terminated.
- the determination criterion is set to 3 by the process S33, and the chart area candidate CCA-i having any one of the ranks 3, 4, and 5 is determined by the process S34 as the chart area. Determined as CA. Further, for example, when the highest rank is 3 by the process S32, the determination criterion is set to 1 by the process S33, and the chart area candidate CCA-i having any one of ranks 1, 2, and 3 by the process S34, that is, All chart area candidates CCA-i are determined to be the chart area CA.
- the color measurement device CM determines the image IM of the color chart CT acquired by the image acquisition processing unit 62 for the chart region candidate CCA determined by the chart region determination processing unit 65 as the chart region CA.
- the positions of the plurality of patches are obtained based on the above, and the obtained positions of the respective patches are stored in the storage unit 10 (S5, patch position processing step).
- the patch position processing unit 66 uses a predetermined edge filter for vertical edge detection based on the entire image of the color chart CT acquired by the image acquisition processing unit 62, so that the vertical position along the vertical direction (Y direction). An edge is detected, and a horizontal edge along the horizontal direction (X direction) is detected by using a predetermined edge filter for horizontal edge detection.
- the patch position processing unit 65 obtains the absolute value of the vertical edge after the edge filter processing, compares the obtained absolute value with a preset threshold value, and binarizes the absolute value.
- Image data is generated.
- image data of a binarized vertical edge image shown in FIG. 13 is generated.
- the patch position processing unit 65 obtains the absolute value of the horizontal edge after the edge filter processing, compares the obtained absolute value with a preset threshold value, and binarizes the absolute value.
- Image data is generated.
- the patch position processing unit 65 performs Hough transform on each of the binarized vertical edge image data and the binarized horizontal edge image data of the color chart CT, and detects each of the vertical edge line and the horizontal edge line. For example, when the image data of the binarized vertical edge of the color chart CTb shown in FIG.
- the patch position processing unit 65 obtains a vertical intermediate line that is an intermediate line between adjacent vertical edge lines in each of the plurality of vertical edge lines, and similarly, adjacent to each other in each of the plurality of horizontal edge lines. A horizontal intermediate line that is an intermediate line between the edge lines is obtained, and the intersections of the obtained vertical intermediate lines and the horizontal intermediate lines are obtained as the positions (X, Y) of the patches.
- each position (X, Y) of each patch is stored in the storage unit 10.
- the colorimetry device CM acquires the chart area CA that the user desires to perform colorimetry through the chart area selection processing unit 70 (S6, chart area selection processing step). More specifically, the chart area selection processing unit 70 displays a selection screen 81 on the output unit 8 and acquires the chart area CA selected by the user.
- the selection screen 81 displayed on the output unit 8 displays a color chart CT image IMc, a chart area selection start / end button 812, and a cancel button 813.
- the chart area selection start / end button 812 is a so-called toggle button. When the chart is not selected, the button 812 displays “Chart area selection start”. When the user presses the button 812 displayed as “Chart area selection start”, the chart is selected, and the button 812 displays “Chart area selection end”. When the user presses the button 812 displayed as “End of chart area selection”, the chart selection state is terminated, the chart is not selected, and the chart area selection process is terminated.
- a cancel button 813 is a button for canceling the chart area selection processing.
- the image IMc of the color chart CT displayed on the selection screen 81 in FIG. 20 includes a chart area CA-101 and a chart area CA-102, and a frame is highlighted on the four sides of each chart area CA. ing.
- the highlighted frame is the chart area CA with a predetermined line attribute (color, thickness, line type, etc.) so that the user can recognize that it is the chart area CA detected by the color measurement device CM. It is a line displayed so as to enclose.
- a patch mark ( ⁇ ) is displayed at the center position of each patch in the chart area CA. Note that the attributes of the four sides (frames) of the chart area CA, the color of the patch mark, and the like may be changed and displayed according to the rank of the chart area CA calculated in the chart area determination processing step of process S4. Also, the figure may be changed.
- the chart area selection processing unit 70 displays a frame so that the user can recognize the chart area CA.
- the chart area selection processing unit 70 may display an image that can recognize the chart area CA.
- an arrow or a circle of a predetermined color may be displayed on the four corners of the rectangle.
- the chart area selection processing unit 70 displays a patch mark in a circle, but it is only necessary to display an image that allows the user to recognize the position of the patch.
- the user moves the cursor 811 with the mouse of the input unit 7 into the chart area CA surrounded by the frame, that is, the chart area CA detected by the color measurement device CM and clicks To do.
- FIG. 22 is a flowchart showing the operation of the chart area selection processing unit 70.
- the chart area selection processing unit 70 reads the image of the color chart CT from the storage unit 10 and displays it on the output unit 8 (S41). At this time, the chart area selection processing unit 70 associates the world coordinate system (coordinate origin PO0) of the image of the color chart CT with the screen coordinate system (coordinate origin SO0), and sets the world coordinates and the screen coordinates to each other. Create a function to convert.
- the image of the color chart CT is not rotated with respect to the screen. That is, it is assumed that the X axis (Y axis) of the world coordinate system and the X axis (Y axis) of the screen coordinates are parallel.
- the chart area selection processing unit 70 displays a frame of the chart area CA on the displayed image of the color chart CT (S42). More specifically, the chart area selection processing unit 70 obtains the world coordinate values (Xn, Yn) of the four vertices of each chart area candidate CCA obtained and stored from the storage unit 10 in the chart area extraction processing step of process S2. ), The world coordinate values (Xn, Yn) of the four vertices of the chart area candidate CCA determined to be the chart area CA in the chart area determination processing step of process S4, and the world coordinate values are stored in association with each other. Read the label i. Then, the chart area selection processing unit 70 creates the chart area frame data 1010 shown in FIG.
- the chart area selection processing unit 70 sets the read label i as the chart area ID 1011 and sets the upper left coordinate value and the lower right coordinate value of the corresponding four vertex world coordinate values (Xn, Yn). A coordinate value is converted into screen coordinates using the above function, and a record in which the converted screen coordinates are set as region coordinates 1012 is created for each label i and registered in the chart region frame data 1010. Then, the chart area selection processing unit 70 uses the screen coordinate values set as the area coordinates 1012 of all records registered in the chart area frame data 1010 to set the frame of each chart area CA on the selection screen 81. Display.
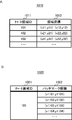
- the chart area selection processing unit 70 displays a patch mark ( ⁇ ), which is an example of an image indicating the position of the patch obtained by the patch position processing unit in step S5, overlaid on the displayed image of the color chart CT. (S43). More specifically, the chart area selection processing unit 70 reads out the world coordinate values (X, Y) of each patch obtained and stored in the patch position processing step of process S5 from the storage unit 10, and the chart area CA Every time, the chart mark data 1020 shown in FIG. 21B is created and stored in the storage unit 10. More specifically, the chart area selection processing unit 70 sets the label i of the chart area CA as the chart area ID 1021, and sets the world coordinate value (X, Y) of the position of the chart included in the chart area CA to the above function.
- ⁇ is an example of an image indicating the position of the patch obtained by the patch position processing unit in step S5, overlaid on the displayed image of the color chart CT.
- the chart area selection processing unit 70 displays each patch mark on the selection screen 81 using the screen coordinate values set as the patch mark coordinates 1022 of all records registered in the chart mark data 1020.
- the chart area selection processing unit 70 acquires the operation from the input unit 7 that has detected the user's operation, and performs processing according to the acquired operation.
- the chart region selection processing unit 70 deletes the selection screen 81 and ends the processing. To do.
- the storage unit 10 stores that the selected chart area CA is 0 (zero).
- the chart area selection processing unit 70 acquires screen coordinates indicating the position where the user clicked the screen (S46: click), the chart area selection processing unit 70 refers to the chart area frame data 1010 stored in the storage unit 10. Then, the chart area CA including the screen coordinates is detected (S47). More specifically, the chart area selection processing unit 70 determines whether or not the screen coordinates are within the rectangle indicated by the coordinate values set as the area coordinates 1012 of each record of the chart area frame data 1010. Then, the label i set as the chart area ID 1011 is read in the record in which the coordinate value determined to be within the rectangle is set, and stored in the storage unit 10 as the ID of the selected chart area CA.
- the chart area selection processing unit 70 changes and displays the attributes of the frame of the selected chart area CA so that the user can recognize that the chart area CA has been selected.
- the chart area selection processing unit 70 displays the chart area CA by changing the frame attribute to the attribute before the change and displays the ID of the chart area CA in the storage unit 10. It is good also as deleting from.
- the chart area selection processing unit 70 uses the acquired two screen coordinates.
- the rectangular area shown is detected as the added chart area CA (S48). More specifically, the chart area selection processing unit 70 displays a frame using the acquired two screen coordinates.
- the chart area selection processing unit 70 creates a new ID (label i) and sets it as the chart area ID 1011, creates a record in which the acquired two screen coordinates are set as area coordinates 1012, and creates the created record as a chart area It is added to the frame data 1010.
- the chart area selection processing unit 70 stores the newly created label i in the storage unit 10 as the ID of the selected chart area CA.
- the chart area selection processing unit 70 acquires one or a plurality of screen coordinates indicating the position where the user clicked in the area designated by WIN.
- the chart area selection processing unit 70 displays a patch mark at the acquired screen coordinates.
- the chart area selection processing unit 70 sets the newly created label i as the chart area ID 1021, creates one or a plurality of records in which the acquired screen coordinates are set as the patch mark coordinates 1022, and stores it as the chart mark data 1020 Add to 10.
- the color measurement device CM reads the label i of the chart area CA selected by the user from the storage unit 10, and performs color measurement of a plurality of patches included in each chart area CA indicated by the label i. At this time, each position of the patch in the added chart area is obtained by converting the screen coordinates set as the patch mark coordinates 1022 into world coordinates. In the case where the plurality of patches are colorimetrically measured at the positions of the plurality of patches thus obtained, the color measurement device CM uses the color measurement processing unit 67 to determine each of the plurality of patches obtained by the patch position processing unit 66.
- the position of the color measuring unit 3 with respect to the color chart CT is moved relative to the position by the sub-scanning direction moving unit 2 and the main scanning direction moving unit 4, and the color of each of the plurality of patches is measured by the color measuring unit 3 and measured.
- the result is stored in the storage unit 10 (S7, colorimetric processing step).
- the chart area selection processing unit 70 stores the label i of the chart area CA selected by the user in the storage unit 10 in the order of selection (chart area acquisition order).
- the color measurement of the chart area CA may be performed in the order of chart area acquisition).
- the colorimetric apparatus CM of the embodiment adds the chart area CA in the process of step S48, the colorimetric position of the chart is acquired by designating by the user, but the added chart The position of the patch may be obtained by performing the processing from processing S3 to processing S5 on the area CA.
- the color measurement device CM may lower the determination criterion by a predetermined value and perform the processing from processing S3 to processing S5, or the user may set the determination criterion as described with reference to FIG.
- the determination criterion may be changed by moving the slider 682.
- the color measurement device CM of the embodiment assumes that the color chart CT image is not rotated with respect to the screen, and the upper left of the chart area. Are converted into screen coordinates and stored (region coordinates 1012 of the chart region frame data 1010).
- the color measurement device CM may convert the world coordinate values (Xn, Yn) of the four vertices of the chart area into screen coordinate values and store them. Good.
- the user inputs four vertices or three vertices of the specified chart area.
- the control unit 61 of the control processing unit 6 outputs each color of each measured color patch to the output unit 8 for processing. Is finished (S8). Note that the control unit 61 of the control processing unit 6 may output the measured colors of the patches to the IF unit 9 as necessary.
- the color measurement device CM and the color measurement method implemented therein according to the present embodiment are charts that are candidates for the chart area CA by the chart area candidate extraction processing unit 63 (chart area candidate extraction process step S2).
- the area candidate CCA is extracted from the image IM of the color chart CT, the evaluation value Eva of the chart area candidate CCA is obtained by the evaluation index calculation processing unit 64 (evaluation index calculation processing step S3), and based on the obtained evaluation value Eva.
- Whether or not the chart area candidate CCA is the chart area CA is determined by the chart area determination processing unit 65 (chart area determination processing step S4). As a result of the determination, the chart area candidate CCA is determined to be the chart area CA.
- the color measurement device CM and the color measurement method implemented therein can appropriately determine the chart area CA and automatically perform color measurement at an appropriate position.
- the color measurement device CM and the color measurement method implemented in the present embodiment are not limited to the color chart CTb including only the chart area CA-b shown in FIG.
- a color chart CTa including normal image areas IMA-1 to IMA-3 in addition to CA-6 can also appropriately determine the chart area CA.
- patches such as stains can be removed from the color measurement by appropriately setting determination criteria, and the regions such as stains of the color chart CT are patched. It is possible to reduce erroneous detection as the position of.
- the color measurement device CM and the color measurement method implemented in the color measurement device CM according to the present embodiment are the number of pixels of the entire image of the color chart CT, more preferably the number of pixels of the entire image of the chart area candidate CCA-i. Since the evaluation value Eva is obtained based on the ratio between the number of pixels Pix (ALL) and the second number of pixels Pix (Lines), which is the number of pixels overlapping in the vicinity of the analysis line or the analysis line, from the line image. A more appropriate evaluation value Eva can be generated.
- the color measurement device CM and the color measurement method implemented in the color measurement apparatus CM include the determination criterion setting unit 68a, a more appropriate determination criterion can be set. By using this determination criterion, the chart area candidate CCA can be determined. Whether or not it is the chart area CA can be determined by a simple process.
- the determination criterion is obtained by the determination criterion setting unit 68a based on the evaluation value, the color measurement device CM according to the present embodiment and the color measurement device CM are implemented therein.
- the determination reference can be automatically set by the determination reference setting unit 68a.
- the determination criterion setting unit 68 uses the determination criterion setting unit 68a that sets the determination criterion based on the evaluation value Eva obtained by the evaluation index calculation processing unit 64. Instead of the setting unit 68a, a determination criterion setting unit 68b that receives the determination criterion from the outside may be used.
- FIG. 19 is a diagram for explaining another determination criterion setting unit in the color measurement device of the embodiment. More specifically, after execution of the above-described evaluation index calculation processing step S3 and before execution of the chart area determination processing step S4, the determination criterion setting unit 68b acquires the color chart CT acquired by the image acquisition processing unit 62. The image IM, the determination criterion setting bar 681 and the determination criterion setting slider 682 are displayed on the output unit 8. For example, as illustrated in FIG. 19, the determination criterion setting unit 68 b displays the image IMa of the color chart CTa in the display area at the substantially center in the output unit 8, and displays the image IMa of the color chart CTa in the output unit 8.
- a determination criterion setting bar 681 and a determination criterion setting slider 682 are displayed in a display area below the display area.
- the determination criterion setting bar 681 is a part for representing the height (large or small) of the determination criterion.
- the determination criterion setting bar 681 is displayed in a bar shape extending in the X direction in plan view. Parts.
- the determination criterion is associated with the determination criterion setting bar 681 so as to increase (increase) sequentially from the left end side to the right end side.
- the determination criterion setting slider 682 is a part that is moved on the determination criterion setting bar 681 by an input from the input unit 7 such as a mouse and inputs a desired determination criterion to the colorimetry device CM.
- the user moves the determination criterion setting slider 682 on the determination criterion setting bar 681 via the input unit 7.
- the determination reference setting unit 68b acquires the position of the determination reference setting slider 682 on the determination reference setting bar 681, and uses the value corresponding to the acquired position as the determination reference. And set the criteria.
- the chart area determination processing unit 65 executes the chart area determination processing step S4 according to the received determination standard.
- the determination criterion setting unit 68b displays a predetermined determination mark Mkc on the output unit 8 so as to overlap the chart region candidate CCA determined to be the chart region CA as a result of the execution of the chart region determination processing step S4. For this reason, the user can set an appropriate determination reference by moving the determination reference setting slider 682 on the determination reference setting bar 681 while referring to the determination mark Mkc displayed on the display unit 8.
- the determination criterion setting slider 682 is positioned by the user via the input unit 7 at the right end position of the determination criterion setting bar 681, and as a result, the determination criterion is set to the highest (for example, 5) with 5 levels.
- the determination mark Mkc ( ⁇ ) is superimposed and displayed only on the chart area candidate CCA-1 located on the left side, and it is determined that only the chart area candidate CCA-1 is the chart area CA-1.
- the determination mark Mkc is displayed in an overlapping manner for each patch in the chart area candidate CCA-1 determined to be the chart area CA-1.
- FIG. 19A the determination criterion setting slider 682 is positioned by the user via the input unit 7 at the right end position of the determination criterion setting bar 681, and as a result, the determination criterion is set to the highest (for example, 5) with 5 levels.
- the determination mark Mkc ( ⁇ ) is superimposed and displayed only on the chart area candidate CCA-1 located on the left side, and
- the determination criterion setting slider 682 is positioned by the user via the input unit 7 at a substantially central position of the determination criterion setting bar 681, and as a result, the determination criterion is set to a medium level. (For example, 3 in 5 stage setting). Under this medium determination criterion, the determination mark Mkc ( ⁇ ) is displayed not only on the left chart area candidate CCA-1 but also on the lower chart area candidates CCA-5 to CCA-9. These chart area candidates CCA-1, CCA-5 to CCA-9 are determined to be the chart areas CA-1, CA-2 to CA-6.
- the determination criterion setting unit 68b accepts the determination criterion from the outside, so that an appropriate determination criterion can be set by the user.
- the color measurement device CM includes the imaging unit 5 including a line sensor in which a plurality of photoelectric conversion elements are arranged along one direction.
- An imaging unit including an area sensor (two-dimensional image sensor) in which a plurality of photoelectric conversion elements are two-dimensionally arranged in two linearly independent directions (for example, two directions orthogonal to each other) may be provided.
- the imaging unit configured with such an area sensor or the like can capture the entire image of the color chart CT without transporting the color chart CT as described above.
- the movement of the position of the color measurement unit 3 relative to the sheet of the object to be measured is realized by the movement of the color measurement unit 3 by the main scanning direction moving unit 4 along the main scanning direction.
- the color measuring device CM of the object to be measured by the sub-scanning direction moving unit 2 along the direction is realized by moving the sheet, it is not limited to this.
- the moving unit that moves the position of the color measurement unit 3 relative to the sheet of the object to be measured is, for example, in the main scanning direction and the sub-scanning direction with respect to the sheet of the object to be measured placed on the stage in a stationary state. It may be a moving mechanism that moves the color measuring unit 3 in two directions.
- a sheet of the object to be measured is placed on the fixed color measuring unit 3 in two directions of the main scanning direction and the sub-scanning direction. It may be an XY stage that moves to.
- the moving unit may be configured to move the color measuring unit 3 in one of the main scanning direction and the sub-scanning direction and move the stage in the other direction.
- the imaging unit including the above-described area sensor or the like is preferable.
- a color measurement device includes a display unit, a color measurement unit that measures a color, an imaging unit that acquires an image, and a moving unit that relatively moves a position of the color measurement unit with respect to a sheet of a measurement object. And an image acquisition processing unit that acquires an image of a color chart including a plurality of patches that are regions of a predetermined color by the imaging unit, and the plurality of images based on the image of the color chart acquired by the image acquisition processing unit.
- the patch position processing unit for obtaining the position of the image and the image of the color chart acquired by the image acquisition processing unit are displayed on the display unit, and the user can be displayed from the displayed chart area.
- the chart area selection processing unit that acquires the chart area selected by the chart area as the color measurement target chart area, and the plurality of patches obtained by the patch position processing unit in the color measurement target chart area acquired by the chart area selection processing unit
- a color measurement processing unit that moves the position of the colorimetric unit relative to the color chart relative to the color chart by the moving unit and measures the color of each of the plurality of patches by the colorimetric unit.
- the chart area selected by the user among the chart areas extracted by the chart area extraction processing unit is subjected to each patch by the colorimetric unit at each position of a plurality of patches in these chart areas. Measure the color. Therefore, since the colorimetric device does not perform colorimetry in a chart area that is not desired by the user, it can efficiently perform colorimetry at an appropriate position. Even if the chart area extraction processing unit extracts an area that is not a chart area, for example, a stain or a character string on a color chart as a chart area, such a chart area is not selected by the user. Measure colors without waste.
- the chart area extraction processing unit is realized by the chart area candidate extraction processing unit, the evaluation index calculation processing unit, and the chart region determination processing unit.
- the chart region selection processing unit is an image of a color chart acquired by the image acquisition processing unit, which is an image showing the chart region extracted by the chart region extraction processing unit.
- the chart area selected by the user from the chart area displayed on the display unit so as to overlap the image indicating the chart area is acquired as a chart area to be measured.
- an image showing the extracted chart area for example, an image of a frame surrounding the chart area, etc. is displayed superimposed on the color chart image, so that the extracted chart area can be easily recognized. it can.
- the color measurement processing unit when the chart region selection processing unit acquires a plurality of chart regions to be measured, in the same order as the acquired order, The color of each of a plurality of patches existing in the chart area to be measured is measured.
- the chart area is measured in the order of selection of the chart area, so that the user can easily specify the desired order.
- the chart region selection processing unit superimposes an image indicating the position of the patch obtained by the patch position processing unit on the color chart image on the display unit. indicate.
- an image showing the position of the patch for example, a circle image at the center position of the patch is displayed superimposed on the image of the color chart, so that the patch can be easily recognized.
- a chart that extracts chart area candidates that are candidates for chart areas in which the plurality of patches exist based on the image of the color chart acquired by the image acquisition processing unit
- An evaluation index calculation for obtaining an evaluation value indicating the degree of the chart region candidate being a chart region based on the image of the chart region candidate for the region candidate extraction processing unit and the chart region candidate extracted by the chart region candidate extraction processing unit
- the chart region candidate extracted by the chart region candidate extraction processing unit is based on an evaluation value obtained by the processing unit and the evaluation index calculation processing unit corresponding to the chart region candidate extracted by the chart region candidate extraction processing unit.
- a chart area determination processing unit for determining whether or not the area is a chart area;
- the processing unit extracts a chart region determined by the chart region determination processing unit to be a chart region, and the chart region selection processing unit determines the position of the patch according to the evaluation value obtained by the evaluation index calculation processing unit. Is displayed on the display unit so as to overlap the image of the color chart.
- the chart area selection processing unit is a chart area existing in the image of the color chart, and is other than the chart area extracted by the chart area extraction processing unit.
- the chart area selected by the user is acquired as a chart area to be measured.
- color measurement can be performed at an appropriate position for all chart areas desired by the user.
- a display unit, a color measurement unit that measures a color, an imaging unit that acquires an image, and a position of the color measurement unit relative to a sheet of an object to be measured are moved relatively.
- a color measurement method of a color measurement device including a moving unit, a color measuring unit, the imaging unit, and a control processing unit that controls the moving unit, wherein the color chart includes a plurality of patches that are regions of a predetermined color.
- the patch position for obtaining the positions of the plurality of patches based on the image of the color chart acquired in the image acquisition processing step A chart region selection process for displaying a color chart image acquired in the processing step and the image acquisition processing step on the display unit, and acquiring a chart region selected by the user from the displayed chart region as a color measurement target chart region;
- the position of the color measurement unit with respect to the color chart is moved to each position of the plurality of patches obtained in the patch position processing step in the chart region of the color measurement target acquired in the step and the chart region selection processing step.
- a color measurement processing step of measuring the color of each of the plurality of patches by the color measurement unit For the chart area extracted in the chart area extraction processing step, the patch position for obtaining the positions of the plurality of patches based on the image of the color
- each patch is set by the color measurement unit at each position of a plurality of patches in these chart areas. Measured color. Therefore, the above colorimetric method does not perform colorimetry in a chart area that is not desired by the user, and therefore can perform colorimetry efficiently at an appropriate position. Even if an area that is not a chart area is extracted as a chart area in the chart area extraction processing step, since such a chart area is not selected by the user, color measurement can be performed without waste.
- a color measuring device and a color measuring method for measuring a color can be provided.
Landscapes
- Physics & Mathematics (AREA)
- Engineering & Computer Science (AREA)
- Spectroscopy & Molecular Physics (AREA)
- General Physics & Mathematics (AREA)
- Signal Processing (AREA)
- Multimedia (AREA)
- Theoretical Computer Science (AREA)
- Geometry (AREA)
- Computer Vision & Pattern Recognition (AREA)
- Spectrometry And Color Measurement (AREA)
- Color Image Communication Systems (AREA)
- Facsimile Image Signal Circuits (AREA)
- Image Analysis (AREA)
Abstract
Description
Claims (7)
- 表示部と、
色を測定する測色部と、
画像を取得する撮像部と、
被測定物のシートに対する前記測色部の位置を相対的に移動させる移動部と、
所定の色の領域であるパッチを複数備えるカラーチャートの画像を前記撮像部によって取得する画像取得処理部と、
前記画像取得処理部が取得した前記カラーチャートの画像に基づいて、前記複数のパッチが存在するチャート領域を抽出するチャート領域抽出処理部と、
前記チャート領域抽出処理部が抽出したチャート領域について、前記画像取得処理部が取得した前記カラーチャートの画像に基づいて、前記複数のパッチの位置を求めるパッチ位置処理部と、
前記画像取得処理部が取得したカラーチャートの画像を前記表示部に表示し、表示したチャート領域からユーザが選択したチャート領域を、測色対象のチャート領域として取得するチャート領域選択処理部と、
前記チャート領域選択処理部が取得した測色対象のチャート領域において、前記パッチ位置処理部が求めた前記複数のパッチの各位置に、前記カラーチャートに対する前記測色部の位置を前記移動部によって相対的に移動させ、前記複数のパッチそれぞれの色を前記測色部によって測定する色測定処理部とを備える、
測色装置。 - 前記チャート領域選択処理部は、前記チャート領域抽出処理部が抽出した前記チャート領域を示す画像を、前記画像取得処理部が取得したカラーチャートの画像に重ねて前記表示部に表示し、前記チャート領域を示す画像を重ねて表示した前記チャート領域からユーザにより選択されたチャート領域を、測色対象のチャート領域として取得する、
請求項1に記載の測色装置。 - 前記色測定処理部は、前記チャート領域選択処理部が複数の測定対象のチャート領域を取得した場合には、取得した順番と同じ順番で、測色対象のチャート領域に存在する複数のパッチそれぞれの色を測定する、
請求項1または請求項2に記載の測色装置。 - 前記チャート領域選択処理部は、前記パッチ位置処理部が求めたパッチの位置を示す画像を、前記カラーチャートの画像に重ねて前記表示部に表示する、
請求項2または請求項3に記載の測色装置。 - 前記画像取得処理部で取得した前記カラーチャートの画像に基づいて、前記複数のパッチが存在するチャート領域の候補となるチャート領域候補を抽出するチャート領域候補抽出処理部と、
前記チャート領域候補抽出処理部で抽出したチャート領域候補について、前記チャート領域候補の画像に基づいて、チャート領域候補がチャート領域である度合いを表す評価値を求める評価指標演算処理部と、
前記チャート領域候補抽出処理部で抽出したチャート領域候補に対応する前記評価指標演算処理部で求めた評価値に基づいて、前記チャート領域候補抽出処理部で抽出した当該チャート領域候補がチャート領域であるか否かを判定するチャート領域判定処理部とを、更に備え、
前記チャート領域抽出処理部は、前記チャート領域判定処理部がチャート領域であると判定したチャート領域を抽出し、
前記チャート領域選択処理部は、前記評価指標演算処理部が求めた評価値に応じた前記パッチの位置を示す画像を、前記カラーチャートの画像に重ねて前記表示部に表示する、
請求項4に記載の測色装置。 - 前記チャート領域選択処理部は、前記カラーチャートの画像に存在するチャート領域であって、前記チャート領域抽出処理部が抽出した前記チャート領域以外のチャート領域をユーザが選択した場合には、ユーザにより選択されたチャート領域を、測色対象のチャート領域として取得する、
請求項2ないし請求項5のいずれか1項に記載の測色装置。 - 表示部と、色を測定する測色部と、画像を取得する撮像部と、被測定物のシートに対する前記測色部の位置を相対的に移動させる移動部と、前記測色部、前記撮像部および前記移動部を制御する制御処理部とを備える測色装置の測色方法であって、
所定の色の領域であるパッチを複数備えるカラーチャートの画像を前記撮像部によって取得する画像取得処理工程と、
前記画像取得処理工程で取得した前記カラーチャートの画像に基づいて、前記複数のパッチが存在するチャート領域を抽出するチャート領域抽出処理工程と、
前記チャート領域抽出処理工程で抽出したチャート領域について、前記画像取得処理工程で取得した前記カラーチャートの画像に基づいて、前記複数のパッチの位置を求めるパッチ位置処理工程と、
前記画像取得処理工程で取得したカラーチャートの画像を前記表示部に表示し、表示したチャート領域からユーザが選択したチャート領域を、測色対象のチャート領域として取得するチャート領域選択処理工程と、
前記チャート領域選択処理工程で取得した測色対象のチャート領域において、前記パッチ位置処理工程で求めた前記複数のパッチの各位置に、前記カラーチャートに対する前記測色部の位置を前記移動部によって相対的に移動させ、前記複数のパッチそれぞれの色を前記測色部によって測定する色測定処理工程とを備える、
測色方法。
Priority Applications (3)
| Application Number | Priority Date | Filing Date | Title |
|---|---|---|---|
| EP16768237.6A EP3258229B1 (en) | 2015-03-26 | 2016-02-17 | Colorimetry device and colorimetry method |
| US15/557,697 US10401227B2 (en) | 2015-03-26 | 2016-02-17 | Colorimetry device and colorimetry method |
| JP2017507606A JP6558435B2 (ja) | 2015-03-26 | 2016-02-17 | 測色装置および測色方法 |
Applications Claiming Priority (2)
| Application Number | Priority Date | Filing Date | Title |
|---|---|---|---|
| JP2015063720 | 2015-03-26 | ||
| JP2015-063720 | 2015-03-26 |
Publications (1)
| Publication Number | Publication Date |
|---|---|
| WO2016152334A1 true WO2016152334A1 (ja) | 2016-09-29 |
Family
ID=56977215
Family Applications (1)
| Application Number | Title | Priority Date | Filing Date |
|---|---|---|---|
| PCT/JP2016/054593 Ceased WO2016152334A1 (ja) | 2015-03-26 | 2016-02-17 | 測色装置および測色方法 |
Country Status (4)
| Country | Link |
|---|---|
| US (1) | US10401227B2 (ja) |
| EP (1) | EP3258229B1 (ja) |
| JP (1) | JP6558435B2 (ja) |
| WO (1) | WO2016152334A1 (ja) |
Cited By (3)
| Publication number | Priority date | Publication date | Assignee | Title |
|---|---|---|---|---|
| JP2019100863A (ja) * | 2017-12-04 | 2019-06-24 | コニカミノルタ株式会社 | 測色位置提示システムおよび測色位置提示方法 |
| EP3618413A1 (en) * | 2018-08-30 | 2020-03-04 | Seiko Epson Corporation | Non-transitory computer-readable storage medium storing program and method of producing printing system |
| JP2023087301A (ja) * | 2021-12-13 | 2023-06-23 | コニカミノルタ株式会社 | 画像形成システム、測色装置、および測色プログラム |
Families Citing this family (6)
| Publication number | Priority date | Publication date | Assignee | Title |
|---|---|---|---|---|
| WO2016158812A1 (ja) * | 2015-04-01 | 2016-10-06 | コニカミノルタ株式会社 | 測色装置および測色方法 |
| JP6525921B2 (ja) * | 2016-05-13 | 2019-06-05 | キヤノン株式会社 | 画像処理装置、画像処理方法、検索装置 |
| JP7229782B2 (ja) | 2019-01-09 | 2023-02-28 | キヤノン株式会社 | 測定装置及び画像形成システム |
| US11494953B2 (en) * | 2019-07-01 | 2022-11-08 | Microsoft Technology Licensing, Llc | Adaptive user interface palette for augmented reality |
| JP7732208B2 (ja) * | 2021-03-24 | 2025-09-02 | 株式会社リコー | 画像形成装置の異常診断方法 |
| JP7780311B2 (ja) * | 2021-12-01 | 2025-12-04 | キヤノン株式会社 | 印刷システム、画像形成装置とその制御方法、及びプログラム |
Citations (5)
| Publication number | Priority date | Publication date | Assignee | Title |
|---|---|---|---|---|
| JP2000253262A (ja) * | 1999-02-25 | 2000-09-14 | Sharp Corp | 色情報測定システム |
| JP2007081684A (ja) * | 2005-09-13 | 2007-03-29 | Canon Inc | 画像処理方法及び画像処理装置 |
| US20100165363A1 (en) * | 2008-12-29 | 2010-07-01 | Gabriel Marcu | Methods and systems for calibrating a source and destination pair |
| WO2013145295A1 (ja) * | 2012-03-30 | 2013-10-03 | 富士通株式会社 | カラーチャート検出装置、カラーチャート検出方法及びカラーチャート検出用コンピュータプログラム |
| JP2014132257A (ja) * | 2012-12-03 | 2014-07-17 | Ricoh Co Ltd | 類似度判定システム及び類似度判定方法 |
Family Cites Families (15)
| Publication number | Priority date | Publication date | Assignee | Title |
|---|---|---|---|---|
| DE50013566D1 (de) * | 2000-08-11 | 2006-11-16 | Gretag Macbeth Ag | Verfahren und Vorrichtung zur farbmetrischen Ausmessung einer zweidimensionalen Vorlage |
| JP5159460B2 (ja) * | 2008-06-20 | 2013-03-06 | キヤノン株式会社 | カラーチャート読取装置、カラーチャート読取方法およびカラーチャート読取プログラム |
| JP5079641B2 (ja) * | 2008-09-16 | 2012-11-21 | 富士フイルム株式会社 | 印刷色予測方法及び予測システム |
| JP2011061544A (ja) * | 2009-09-10 | 2011-03-24 | Fujifilm Corp | 色情報処理装置、及びそのプログラム |
| JP5343819B2 (ja) * | 2009-11-18 | 2013-11-13 | セイコーエプソン株式会社 | 液体噴射装置 |
| JP5494641B2 (ja) * | 2011-12-27 | 2014-05-21 | コニカミノルタ株式会社 | 色変換テーブル作成装置、色変換テーブル作成方法及びプログラム |
| US9671289B2 (en) * | 2014-04-28 | 2017-06-06 | Konica Minolta, Inc. | Color measurement device and color measurement method |
| WO2016076165A1 (ja) * | 2014-11-14 | 2016-05-19 | コニカミノルタ株式会社 | 測色装置および測色方法 |
| WO2016076163A1 (ja) * | 2014-11-14 | 2016-05-19 | コニカミノルタ株式会社 | 測色装置および測色方法 |
| JP6391439B2 (ja) * | 2014-11-21 | 2018-09-19 | キヤノン株式会社 | 情報処理装置、サーバ装置、情報処理システム、制御方法及びコンピュータプログラム |
| WO2016158812A1 (ja) * | 2015-04-01 | 2016-10-06 | コニカミノルタ株式会社 | 測色装置および測色方法 |
| JP6160933B2 (ja) * | 2015-04-13 | 2017-07-12 | コニカミノルタ株式会社 | 色管理装置及びチャート利用制御方法並びにチャート利用制御プログラム |
| JP6620484B2 (ja) * | 2015-09-18 | 2019-12-18 | セイコーエプソン株式会社 | 液体噴射装置及びクリーニング装置 |
| JP7098870B2 (ja) * | 2016-07-25 | 2022-07-12 | 富士フイルムビジネスイノベーション株式会社 | 測色システム、画像生成装置、および、プログラム |
| JP2018088615A (ja) * | 2016-11-29 | 2018-06-07 | セイコーエプソン株式会社 | 測色値の検査装置、検査方法、及び、検査プログラム |
-
2016
- 2016-02-17 US US15/557,697 patent/US10401227B2/en active Active
- 2016-02-17 JP JP2017507606A patent/JP6558435B2/ja active Active
- 2016-02-17 WO PCT/JP2016/054593 patent/WO2016152334A1/ja not_active Ceased
- 2016-02-17 EP EP16768237.6A patent/EP3258229B1/en active Active
Patent Citations (5)
| Publication number | Priority date | Publication date | Assignee | Title |
|---|---|---|---|---|
| JP2000253262A (ja) * | 1999-02-25 | 2000-09-14 | Sharp Corp | 色情報測定システム |
| JP2007081684A (ja) * | 2005-09-13 | 2007-03-29 | Canon Inc | 画像処理方法及び画像処理装置 |
| US20100165363A1 (en) * | 2008-12-29 | 2010-07-01 | Gabriel Marcu | Methods and systems for calibrating a source and destination pair |
| WO2013145295A1 (ja) * | 2012-03-30 | 2013-10-03 | 富士通株式会社 | カラーチャート検出装置、カラーチャート検出方法及びカラーチャート検出用コンピュータプログラム |
| JP2014132257A (ja) * | 2012-12-03 | 2014-07-17 | Ricoh Co Ltd | 類似度判定システム及び類似度判定方法 |
Non-Patent Citations (1)
| Title |
|---|
| See also references of EP3258229A4 * |
Cited By (6)
| Publication number | Priority date | Publication date | Assignee | Title |
|---|---|---|---|---|
| JP2019100863A (ja) * | 2017-12-04 | 2019-06-24 | コニカミノルタ株式会社 | 測色位置提示システムおよび測色位置提示方法 |
| EP3618413A1 (en) * | 2018-08-30 | 2020-03-04 | Seiko Epson Corporation | Non-transitory computer-readable storage medium storing program and method of producing printing system |
| CN110871635A (zh) * | 2018-08-30 | 2020-03-10 | 精工爱普生株式会社 | 记录介质、比色图表表格及印刷系统的制作方法 |
| CN110871635B (zh) * | 2018-08-30 | 2021-09-21 | 精工爱普生株式会社 | 记录介质、比色图表表格及印刷系统的制作方法 |
| JP2023087301A (ja) * | 2021-12-13 | 2023-06-23 | コニカミノルタ株式会社 | 画像形成システム、測色装置、および測色プログラム |
| JP7815732B2 (ja) | 2021-12-13 | 2026-02-18 | コニカミノルタ株式会社 | 画像形成システム、測色装置、および測色プログラム |
Also Published As
| Publication number | Publication date |
|---|---|
| EP3258229B1 (en) | 2023-08-02 |
| US20180045572A1 (en) | 2018-02-15 |
| US10401227B2 (en) | 2019-09-03 |
| JP6558435B2 (ja) | 2019-08-14 |
| EP3258229A1 (en) | 2017-12-20 |
| JPWO2016152334A1 (ja) | 2018-01-25 |
| EP3258229A4 (en) | 2018-03-28 |
Similar Documents
| Publication | Publication Date | Title |
|---|---|---|
| JP6558435B2 (ja) | 測色装置および測色方法 | |
| JP6597632B2 (ja) | 測色装置および測色方法 | |
| JP6610556B2 (ja) | 測色装置および測色方法 | |
| KR100938337B1 (ko) | 그리기 도구를 가지는 자율 핸드헬드 장치 | |
| JP6669163B2 (ja) | 測色装置および測色方法 | |
| EP2228769A1 (en) | Segmentation of a depth maps of printed circuit boards | |
| JP4774390B2 (ja) | 文字切り出し装置、方法およびプログラム | |
| JP6551402B2 (ja) | 測色装置および測色方法 | |
| JP6508198B2 (ja) | 測色装置および測色方法 | |
| JP6241052B2 (ja) | 画像処理システムおよび画像処理プログラム | |
| JP2020067308A (ja) | 画像処理方法および画像処理装置 | |
| JP6592904B2 (ja) | 電子機器、プログラム | |
| JP6520931B2 (ja) | 測色装置および測色方法 | |
| JP4574503B2 (ja) | 画像処理装置、画像処理方法およびプログラム | |
| JP2020107982A (ja) | 画像処理装置、色変換方法および色変換プログラム | |
| KR101903617B1 (ko) | 복수 개의 객체 이미지를 포함한 정적인 디지털 결합 이미지의 편집 방법 | |
| JP2008241424A (ja) | 画像処理装置及びこれを用いた画像処理方法 | |
| WO2015170604A1 (ja) | 測色装置および測色方法 | |
| JP2018173732A (ja) | 検査装置、検査方法、検査プログラム及び記録媒体 | |
| JP2013250927A (ja) | 画像処理装置、画像処理方法及び画像処理プログラム | |
| JPH07193709A (ja) | 画像評価方法及び装置 | |
| JPH07175933A (ja) | 画像評価方法及び装置 | |
| CN115826888A (zh) | 工艺参数的获取方法、打印方法、数码打印机及存储介质 | |
| JP2024092377A (ja) | 情報処理装置、情報処理方法及び情報処理プログラム | |
| JPH07190952A (ja) | 画像評価方法及び装置 |
Legal Events
| Date | Code | Title | Description |
|---|---|---|---|
| 121 | Ep: the epo has been informed by wipo that ep was designated in this application |
Ref document number: 16768237 Country of ref document: EP Kind code of ref document: A1 |
|
| ENP | Entry into the national phase |
Ref document number: 2017507606 Country of ref document: JP Kind code of ref document: A |
|
| WWE | Wipo information: entry into national phase |
Ref document number: 15557697 Country of ref document: US |
|
| REEP | Request for entry into the european phase |
Ref document number: 2016768237 Country of ref document: EP |
|
| NENP | Non-entry into the national phase |
Ref country code: DE |