WO2020021685A1 - Dispositif de surveillance d'usine, procédé de surveillance d'usine et support d'enregistrement lisible par ordinateur - Google Patents
Dispositif de surveillance d'usine, procédé de surveillance d'usine et support d'enregistrement lisible par ordinateur Download PDFInfo
- Publication number
- WO2020021685A1 WO2020021685A1 PCT/JP2018/028147 JP2018028147W WO2020021685A1 WO 2020021685 A1 WO2020021685 A1 WO 2020021685A1 JP 2018028147 W JP2018028147 W JP 2018028147W WO 2020021685 A1 WO2020021685 A1 WO 2020021685A1
- Authority
- WO
- WIPO (PCT)
- Prior art keywords
- plant
- causal relationship
- control program
- specified
- signals
- Prior art date
- Legal status (The legal status is an assumption and is not a legal conclusion. Google has not performed a legal analysis and makes no representation as to the accuracy of the status listed.)
- Ceased
Links
Images






Classifications
-
- G—PHYSICS
- G05—CONTROLLING; REGULATING
- G05B—CONTROL OR REGULATING SYSTEMS IN GENERAL; FUNCTIONAL ELEMENTS OF SUCH SYSTEMS; MONITORING OR TESTING ARRANGEMENTS FOR SUCH SYSTEMS OR ELEMENTS
- G05B19/00—Program-control systems
- G05B19/02—Program-control systems electric
- G05B19/418—Total factory control, i.e. centrally controlling a plurality of machines, e.g. direct or distributed numerical control [DNC], flexible manufacturing systems [FMS], integrated manufacturing systems [IMS] or computer integrated manufacturing [CIM]
- G05B19/4185—Total factory control, i.e. centrally controlling a plurality of machines, e.g. direct or distributed numerical control [DNC], flexible manufacturing systems [FMS], integrated manufacturing systems [IMS] or computer integrated manufacturing [CIM] characterised by the network communication
-
- G—PHYSICS
- G05—CONTROLLING; REGULATING
- G05B—CONTROL OR REGULATING SYSTEMS IN GENERAL; FUNCTIONAL ELEMENTS OF SUCH SYSTEMS; MONITORING OR TESTING ARRANGEMENTS FOR SUCH SYSTEMS OR ELEMENTS
- G05B19/00—Program-control systems
- G05B19/02—Program-control systems electric
- G05B19/418—Total factory control, i.e. centrally controlling a plurality of machines, e.g. direct or distributed numerical control [DNC], flexible manufacturing systems [FMS], integrated manufacturing systems [IMS] or computer integrated manufacturing [CIM]
- G05B19/4184—Total factory control, i.e. centrally controlling a plurality of machines, e.g. direct or distributed numerical control [DNC], flexible manufacturing systems [FMS], integrated manufacturing systems [IMS] or computer integrated manufacturing [CIM] characterised by fault tolerance, reliability of production system
-
- G—PHYSICS
- G05—CONTROLLING; REGULATING
- G05B—CONTROL OR REGULATING SYSTEMS IN GENERAL; FUNCTIONAL ELEMENTS OF SUCH SYSTEMS; MONITORING OR TESTING ARRANGEMENTS FOR SUCH SYSTEMS OR ELEMENTS
- G05B19/00—Program-control systems
- G05B19/02—Program-control systems electric
- G05B19/04—Program control other than numerical control, i.e. in sequence controllers or logic controllers
- G05B19/048—Monitoring; Safety
-
- G—PHYSICS
- G05—CONTROLLING; REGULATING
- G05B—CONTROL OR REGULATING SYSTEMS IN GENERAL; FUNCTIONAL ELEMENTS OF SUCH SYSTEMS; MONITORING OR TESTING ARRANGEMENTS FOR SUCH SYSTEMS OR ELEMENTS
- G05B19/00—Program-control systems
- G05B19/02—Program-control systems electric
- G05B19/04—Program control other than numerical control, i.e. in sequence controllers or logic controllers
- G05B19/05—Programmable logic controllers, e.g. simulating logic interconnections of signals according to ladder diagrams or function charts
-
- G—PHYSICS
- G05—CONTROLLING; REGULATING
- G05B—CONTROL OR REGULATING SYSTEMS IN GENERAL; FUNCTIONAL ELEMENTS OF SUCH SYSTEMS; MONITORING OR TESTING ARRANGEMENTS FOR SUCH SYSTEMS OR ELEMENTS
- G05B19/00—Program-control systems
- G05B19/02—Program-control systems electric
- G05B19/418—Total factory control, i.e. centrally controlling a plurality of machines, e.g. direct or distributed numerical control [DNC], flexible manufacturing systems [FMS], integrated manufacturing systems [IMS] or computer integrated manufacturing [CIM]
- G05B19/4183—Total factory control, i.e. centrally controlling a plurality of machines, e.g. direct or distributed numerical control [DNC], flexible manufacturing systems [FMS], integrated manufacturing systems [IMS] or computer integrated manufacturing [CIM] characterised by data acquisition, e.g. workpiece identification
-
- G—PHYSICS
- G05—CONTROLLING; REGULATING
- G05B—CONTROL OR REGULATING SYSTEMS IN GENERAL; FUNCTIONAL ELEMENTS OF SUCH SYSTEMS; MONITORING OR TESTING ARRANGEMENTS FOR SUCH SYSTEMS OR ELEMENTS
- G05B19/00—Program-control systems
- G05B19/02—Program-control systems electric
- G05B19/418—Total factory control, i.e. centrally controlling a plurality of machines, e.g. direct or distributed numerical control [DNC], flexible manufacturing systems [FMS], integrated manufacturing systems [IMS] or computer integrated manufacturing [CIM]
- G05B19/41865—Total factory control, i.e. centrally controlling a plurality of machines, e.g. direct or distributed numerical control [DNC], flexible manufacturing systems [FMS], integrated manufacturing systems [IMS] or computer integrated manufacturing [CIM] characterised by job scheduling, process planning, material flow
-
- G—PHYSICS
- G05—CONTROLLING; REGULATING
- G05B—CONTROL OR REGULATING SYSTEMS IN GENERAL; FUNCTIONAL ELEMENTS OF SUCH SYSTEMS; MONITORING OR TESTING ARRANGEMENTS FOR SUCH SYSTEMS OR ELEMENTS
- G05B23/00—Testing or monitoring of control systems or parts thereof
- G05B23/02—Electric testing or monitoring
-
- Y—GENERAL TAGGING OF NEW TECHNOLOGICAL DEVELOPMENTS; GENERAL TAGGING OF CROSS-SECTIONAL TECHNOLOGIES SPANNING OVER SEVERAL SECTIONS OF THE IPC; TECHNICAL SUBJECTS COVERED BY FORMER USPC CROSS-REFERENCE ART COLLECTIONS [XRACs] AND DIGESTS
- Y02—TECHNOLOGIES OR APPLICATIONS FOR MITIGATION OR ADAPTATION AGAINST CLIMATE CHANGE
- Y02P—CLIMATE CHANGE MITIGATION TECHNOLOGIES IN THE PRODUCTION OR PROCESSING OF GOODS
- Y02P90/00—Enabling technologies with a potential contribution to greenhouse gas [GHG] emissions mitigation
- Y02P90/02—Total factory control, e.g. smart factories, flexible manufacturing systems [FMS] or integrated manufacturing systems [IMS]
Definitions
- the present invention relates to a plant monitoring device and a plant monitoring method for monitoring the operation status of a plant, and further relates to a computer-readable recording medium on which a program for realizing these is recorded.
- Such a control system generally includes a PLC (Programmable Logic Controller), an engineering workstation (management device) for managing and maintaining the PLC, a terminal device for providing an HMI (Human Machine Interface) to an operator, and the like.
- PLC Process Control Controller
- HMI Human Machine Interface
- the PLC operates actuators and the like based on sensor data from sensors arranged in each part of the equipment.
- the PLC operates according to a program provided from the engineering workstation. Further, since the HMI displays the value of the sensor data, the operation state of the actuator, and the like, the operator can monitor the operation status of the facility through the HMI.
- Patent Literatures 1 and 2 propose control systems for reducing the burden on the operator.
- Patent Literature 1 when the control system disclosed in Patent Literature 1 detects an abnormality from a plant state quantity (temperature, pressure, flow rate, or the like), the control system determines the degree of urgency of the abnormality, and according to the cause of the abnormality and the degree of urgency. Then, an appropriate operation is specified from operation guides prepared in advance, and this is presented to the operator.
- a plant state quantity temperature, pressure, flow rate, or the like
- control system disclosed in Patent Document 2 acquires sensor data of each sensor in time series, and further calculates an index from the acquired time-series sensor data and the limit value for each sensor, Then, the sensor replacement time is calculated from the calculated index. Thereafter, the control system disclosed in Patent Literature 2 presents the calculated replacement time for each sensor to the operator.
- the above-mentioned control system is sometimes targeted by cyber attacks.
- a cyber attack for example, an attacker falsifies sensor data transmitted on a control system network by a man-in-the-middle attack or the like. Therefore, the PLC operates the actuator or the like based on the falsified sensor data, and as a result, the entire facility may be exposed to a dangerous state. Therefore, when receiving a cyber attack, the equipment operator needs to quickly take measures corresponding to the cyber attack.
- control system disclosed in Patent Document 1 described above can detect a system abnormality based on a plant state quantity, but assists in determining whether the detected abnormality is caused by a cyber attack. Do not mean. For this reason, even if the control system disclosed in Patent Literature 1 is introduced, the operator cannot quickly take measures corresponding to the cyber attack, and the damage may be increased. Further, the system disclosed in Patent Document 2 has a problem that it cannot cope with a cyber attack at all.
- control logic of the PLC is so complicated that the operator cannot immediately input the input values that are the basis for operating the specific actuator. Even if a manual is referred to, the analysis takes time. In the event of a cyber attack, it is a matter of time, and it is difficult to secure enough time to refer to the manual.
- An example of an object of the present invention is to solve the above-described problem and, when an abnormality occurs in a plant, present a causal relationship of a control program so that an operator can quickly take a corrective action. It is an object of the present invention to provide a monitoring method and a computer-readable recording medium.
- a plant monitoring device is a device for monitoring an operation state of a plant, Based on sensor data from a sensor installed in the plant, for controlling the plant, to obtain a control program, a control program acquisition unit, From the obtained control program, to extract a causal relationship between each of a plurality of signals used in the plant, a causal relationship extracting unit, The current state of the plurality of signals, and each of the extracted causal relationship is compared, to specify a causal relationship that matches the specified state, a causal relationship specifying unit, A display unit for displaying the specified causal relationship on a screen, Has, It is characterized by the following.
- a plant monitoring method is a method for monitoring an operation state of a plant, (A) obtaining a control program for controlling the plant based on sensor data from a sensor installed in the plant; and (B) extracting a causal relationship between each of a plurality of signals used in the plant from the acquired control program; (C) comparing a current state of the plurality of signals with each of the extracted causal relationships, and identifying a causal relationship that matches the identified state; (D) displaying the specified causal relationship on a screen; Having, It is characterized by the following.
- a computer-readable recording medium is a computer-readable recording medium that records a program for monitoring an operation state of a plant by a computer, On the computer, (A) obtaining a control program for controlling the plant based on sensor data from a sensor installed in the plant; and (B) extracting a causal relationship between each of the plurality of signals used in the plant from the obtained control program; (C) comparing a current state of the plurality of signals with each of the extracted causal relationships, and identifying a causal relationship that matches the identified state; (D) displaying the identified causal relationship on a screen; And recording a program including an instruction to execute the program.
- the causal relationship of the control program is presented, so that the operator can quickly take a corresponding process.
- FIG. 1 is a block diagram illustrating a schematic configuration of a plant monitoring device according to an embodiment of the present invention.
- FIG. 2 is a configuration diagram illustrating an example of a configuration of a plant to be monitored in the embodiment of the present invention.
- FIG. 3 is a block diagram showing a relationship between the plant monitoring device according to the embodiment of the present invention and the control system of the plant shown in FIG.
- FIG. 4 is a block diagram more specifically showing the configuration of the plant monitoring device according to the embodiment of the present invention.
- FIG. 5 shows an example of a control program used in the embodiment of the present invention.
- FIG. 6 is a diagram illustrating an example of an analysis process of a control program performed for extracting a causal relationship in the embodiment of the present invention.
- FIG. 1 is a block diagram illustrating a schematic configuration of a plant monitoring device according to an embodiment of the present invention.
- FIG. 2 is a configuration diagram illustrating an example of a configuration of a plant to be monitored in the embodiment of the present invention.
- FIG. 7 is a diagram illustrating a causal relationship extracted based on the result of the analysis processing illustrated in FIG.
- FIG. 8 is a diagram illustrating an example of the system state information acquired in the embodiment of the present invention.
- FIG. 9 is a diagram illustrating an example of the physical configuration information used in the embodiment of the present invention.
- FIG. 10 is a flowchart showing the operation of the plant monitoring device according to the embodiment of the present invention.
- FIG. 11 shows a first example of a display screen according to the embodiment of the present invention.
- FIG. 12 shows a second example of the display screen according to the embodiment of the present invention.
- FIG. 13 shows a third example of the display screen according to the embodiment of the present invention.
- FIG. 14 shows a fourth example of the display screen according to the embodiment of the present invention.
- FIG. 11 shows a first example of a display screen according to the embodiment of the present invention.
- FIG. 12 shows a second example of the display screen according to the embodiment of the present invention.
- FIG. 13
- FIG. 15 shows a fifth example of the display screen according to the embodiment of the present invention.
- FIG. 16 shows a sixth example of the display screen according to the embodiment of the present invention.
- FIG. 17 is a block diagram illustrating an example of a computer that realizes the plant monitoring device according to the embodiment of the present invention.
- FIG. 1 is a block diagram illustrating a schematic configuration of a plant monitoring device according to an embodiment of the present invention.
- the plant monitoring device 10 is a device for monitoring the operation status of a plant to be monitored.
- the plant monitoring device 10 includes a control program acquisition unit 11, a causality extraction unit 12, a causality identification unit 13, and a display unit 14.
- the control program acquisition unit 11 acquires a control program for controlling the plant based on sensor data from sensors installed in the plant.
- the causal relationship extracting unit 12 extracts a causal relationship between each of a plurality of signals used in the plant from the control program acquired by the control program acquiring unit 11.
- the causal relationship specifying unit 13 compares the current state of the plurality of signals with each of the extracted causal relationships, and specifies a causal relationship that matches the specified state.
- the display unit 14 displays the specified causal relationship on the screen.
- the plant monitoring apparatus 10 specifies the causal relationship between signals with respect to the signal currently used, and displays the specified causal relationship on the screen. For this reason, according to the plant monitoring apparatus 10, when an abnormality occurs in the plant, for example, an abnormal operation state of the actuator continues, the operator can immediately confirm the causal relationship of the abnormal signal, and quickly Can take corresponding measures.
- FIG. 2 is a configuration diagram illustrating an example of a configuration of a plant to be monitored in the embodiment of the present invention.
- FIG. 3 is a block diagram showing a relationship between the plant monitoring device according to the embodiment of the present invention and the control system of the plant shown in FIG.
- FIG. 4 is a block diagram more specifically showing the configuration of the plant monitoring device according to the embodiment of the present invention.
- the plant 20 includes a water storage tank 21, a temperature sensor 22, a heater 23, a supply line 24, a lower drain line 25, an upper drain line 26, and a valve 27. To 29. Further, the plant 20 includes, as control devices, a PLC (PLC1) 30 and a PLC (PLC2) 31 for executing a control program.
- PLC1 PLC
- PLC2 PLC
- the temperature sensor 22 measures the temperature of the water stored in the water storage tank 21 and outputs sensor data corresponding to the measured temperature.
- the heater 23 is arranged so as to heat water stored in the water storage tank 21.
- the PLC 30 adjusts the temperature of the water by operating the heater 23 according to the sensor data output from the temperature sensor 22.
- the supply line 24 is a line for supplying water to the water storage tank 21.
- the supply line 24 is provided with a valve 27.
- the lower drainage line 25 is a line for discharging water from a lower part of the water storage tank 21.
- the lower drain line 25 is provided with a valve 28.
- the upper drain line 26 is a line for discharging water overflowing from the upper part of the water storage tank 21.
- the upper drain line 26 is provided with a valve 29.
- the PLC 31 controls the opening and closing of each of the valves 27, 28, and 29.
- the PLC 30 and the PLC 31 communicate data via the network switch 32 and the control network (NW_c 1) to the engineering workstation 33 and the terminal device 34 used by the operator. Connected as possible. Further, the PLC 30 and the PLC 31 are also connected to the plant monitoring device 10 via the network switch 32 and the control network (NW_c1).
- the terminal device 31 provides the operator with an HMI.
- the operator is operating on the HMI of the terminal device 31.
- the engineering workstation 33 manages the operation state of each PLC, and further retains a control program thereof. Further, the engineering workstation 33 updates the control program according to an instruction from an operator or the like.
- the PLC 30 is connected to the temperature sensor 22 and the heater 23 via a field network (NW_f1).
- the PLC 31 is connected to each of the valves 27 to 29 via a field network (NW_f2).
- NW_f2 a field network
- the plant 20 to be monitored in the present embodiment includes a plurality of PLCs that execute a control program, and a network that connects the PLCs and other devices.
- the plant monitoring device 10 includes, in addition to the configuration shown in FIG. 1, a route specifying unit 15, a causal relationship storage unit 16, a system state acquisition unit 17, and a physical configuration storage unit 18. Have.
- the control program acquisition unit 11 acquires a control program for each PLC.
- the control program is held by the engineering workstation 33 shown in FIG. 2 as described above. Therefore, the control program acquisition unit 11 acquires each control program (see FIG. 5) from the engineering workstation 33.
- FIG. 5 shows an example of a control program used in the embodiment of the present invention.
- the control program shown in FIG. 5 is a control program for the PLC 30.
- “TT_1. AL”, “TT_1. AH”, “V_1. Status”, “V_2. Status”, “V_3. Status”, and “HA_1. Cmd” are signals used in the plant 20, respectively. Is shown.
- TT_1. AL is a signal that is “High (1)” when the temperature detected by the temperature sensor 22 is equal to or lower than the lower limit, and is “Low (0)” otherwise.
- TT_1. AH is a signal that is “High (1)” when the temperature detected by the temperature sensor 22 is equal to or higher than the upper limit, and is “Low (0)” otherwise.
- ⁇ V_1. ⁇ Status is a signal that becomes “High (1)” when the valve 27 is open and “Low (0)” when it is closed.
- V_2. Status is a signal that becomes “High (1)” when the valve 28 is open and “Low (0)” when it is closed.
- V_3. @ Status is a signal that becomes “High (1)” when the valve 29 is open and “Low (0)” when it is closed.
- H_1. Cmd is a signal that becomes “High (1)” when the heater 23 is operating and “Low (0)” when the heater 23 is stopped.
- the signal transmitted from the sensor and the like by the PLC to convey the state of the manufacturing process and the like is written in a location corresponding to the signal in a storage device provided in the PLC.
- the signal transmitted to the actuator or the like by the PLC for operating or stopping the actuator or the like is read from a location corresponding to the signal in a storage device included in the PLC.
- the location in the storage device is generally called a variable, a tag, a register, and the like, and in this embodiment, is called a variable.
- a variable to which a received signal is written is called an input variable
- a variable from which a transmitted signal is read is called an output variable.
- the causal relationship extracting unit 12 extracts a causal relationship from the control program of each PLC in the present embodiment, and stores the extracted causal relationship in the causal relationship storage unit 16.
- the causal relationship indicates, for example, what value of the input variable determines the value of the output variable output by each PLC. Further, the causal relationship extraction unit 12 stores the extracted causal relationship in the causal relationship storage unit 16.
- FIG. 6 is a diagram illustrating an example of an analysis process of a control program performed for extracting a causal relationship in the embodiment of the present invention.
- FIG. 7 is a diagram illustrating a causal relationship extracted based on the result of the analysis processing illustrated in FIG.
- the causal relationship extracting unit 12 first performs, as an analysis process, each of the variables to be read and written in each processing step (line) of the control program (upper part of FIG. 6). , Specify output variables.
- the specified output variables are as shown in the lower table of FIG.
- the causal relationship extraction unit 12 specifies, from the control program, an input variable that can influence the determination of the value of the output variable. In addition, if another input variable that can affect the determination of the value of the specified input variable exists, the causal relationship extraction unit 12 also specifies another input variable. Identify the input variables.
- ⁇ ⁇ Identification of an input variable that can influence the determination of the value of an output variable can be performed as follows.
- the causality extraction unit 12 specifies another variable referred to as a value to which the assignment statement is assigned as an input variable.
- the causality extraction unit 12 when whether or not to execute the assignment statement is determined by the evaluation result of the conditional expression in the conditional branch such as the IF statement, the causality extraction unit 12 also inputs another variable referred to by the conditional expression. Specify as a variable.
- the causal relationship extraction unit 12 searches the control program for an assignment statement that assigns a constant to an input variable or a conditional expression that compares an input variable with a constant, and searches for an assignment statement or conditional expression that can be identified by the search. It is determined whether the input variable can take a constant, and if so, the constant (value) is specified.
- ⁇ Cause-causality extraction unit 12 then comprehensively generates a plurality of input value patterns from the input variables specified so far and the constants (values) that the input variables can take.
- the causal relationship extraction unit 12 executes the control program once in a state where the input value pattern is given, and obtains an output value.
- the input variables referred to during the execution of the control program are also recorded.
- a list of execution results (analysis results) for each input value pattern is shown in the lower table of FIG.
- the input variables referred to during the execution of the control program are indicated by hatched columns in the lower table of FIG.
- the causal relationship extraction unit 12 extracts the recorded input variables and their values and the values of the output variables output by the control program, and sets these as a causal relationship.
- the extracted causal relationship is as shown in FIG. In the example of FIG. 7, causal relationships R01 to R05 are extracted.
- the causal relationship extraction unit 12 extracts signals and their values included in the assignment process and the branch condition in the conditional branch process as the causal relationship between the plurality of signals used in the plant.
- the causal relationship extracting unit 12 specifies an output variable, specifies an input variable, specifies a value that can be taken by the input variable, generates an input value pattern, obtains an output value and an input variable referred to when the control program is executed, Extract causal relationships.
- the system state acquisition unit 17 repeatedly acquires the system state information from each PLC or the terminal device (HMI) 34 which has already continuously acquired the system state information at a set interval, and Each time, the acquired system state information is output to the causal relationship specifying unit 13. As shown in FIG. 8, the system state information is information that specifies the current state of each signal in the plant 20.
- FIG. 8 is a diagram illustrating an example of the system state information acquired in the embodiment of the present invention.
- the causal relationship specifying unit 13 acquires the system state information (see FIG. 8) output from the system state acquiring unit 17. Then, the causal relationship specifying unit 13 compares the current state specified by the system state information with each of the causal relationships stored in the causal relationship storage unit 16 (see FIG. 7), and matches the current state. Identify causal relationships.
- the physical configuration storage unit 18 stores physical configuration information.
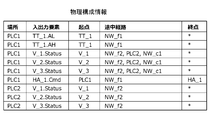
- the physical configuration information is information that specifies, for each signal used in the plant, at least a PLC that handles each signal, a starting point of each signal, and a path through which each signal passes.
- FIG. 9 is a diagram illustrating an example of the physical configuration information used in the embodiment of the present invention.
- the physical configuration information specifies a location, a starting point, an intermediate route, and an ending point in each signal (input / output element).
- the “location” here is a location where a signal is processed, and is mainly specified by the PLC.
- the “start point” is specified by a physical element that outputs a signal.
- the “intermediate route” is specified by a network, a PLC, and the like through which the signal passes.
- the route specifying unit 15 specifies a starting point and an intermediate route for each of the plurality of signals included in the causal relationship specified by the causal relationship specifying unit 13. Specifically, the route identifying unit 15 compares each signal included in the causal relationship with the physical configuration information stored in the physical configuration storage unit 18 and, for each signal, a corresponding starting point, intermediate route, Identify the end point. Further, in the present embodiment, the path specifying unit 15 specifies the starting point and the intermediate path of each signal for each PLC.
- the display unit 14 displays, as a causal relationship, each signal included in the causal relationship identified by the causal relationship identifying unit 13 and the starting point and the intermediate route identified by the route identifying unit 15. 34 (see FIG. 3).
- the route specifying unit 15 specifies the starting point and the intermediate route for each PLC
- the identified intermediate route includes a PLC different from the PLC
- the identified intermediate route includes a specific network. , Or both.
- the display unit 14 changes the display mode of the corresponding signal (the signal corresponding to the intermediate route in the above case) from the display mode of the other signals in accordance with the instruction of the route specifying unit 15.
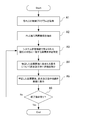
- FIG. 10 is a flowchart showing the operation of the plant monitoring device according to the embodiment of the present invention.
- FIGS. 1 to 9 will be referred to as appropriate.
- a plant monitoring method is performed by operating a plant monitoring device. Therefore, the description of the plant monitoring method in the present embodiment is replaced with the following description of the operation of the plant monitoring device.
- control program acquisition unit 11 acquires, from the engineering workstation 33, a control program of each PLC of the plant 20 (see FIG. 5 for an example of a control program of the PLC 30) (step S ⁇ b> 10). A1).
- the causal relationship extraction unit 12 extracts, for each PLC, a causal relationship between the signals used in the plant 20 from the control program of each PLC acquired in step A1 (step A2).
- the causal relationship extracting unit 12 first specifies, from the control program, an input variable that can influence the determination of the value of the output variable. Subsequently, the causality extraction unit 12 searches the control program for an assignment statement for assigning a constant to an input variable or a conditional expression for comparing an input variable with a constant, and finds the input variable identified by the search and the input variable A plurality of input value patterns are comprehensively generated from constants (values) that can be taken. Thereafter, the causal relationship extracting unit 12 executes the control program once for each input value pattern in a state where the input value pattern is given, obtains an output value, and refers to the output value during the execution of the control program. Record the input variables. The causal relationship is represented by the obtained input value and output value.
- the causal relationship identifying unit 13 acquires the system state information output from the system state acquiring unit 17. Then, the causal relationship specifying unit 13 compares the current state of each signal in the plant 20 specified by the system state information with each of the causal relationships extracted in step A2. Then, the causal relationship identifying unit 13 identifies a causal relationship that matches the current state from the result of the comparison (step A3).
- the system status acquisition unit 17 sends the system status from each PLC or the terminal device (HMI) 34 which has already continuously acquired the system status information at a set interval.
- the status information is repeatedly obtained, and the obtained system status information is output to the causality specifying unit 13.
- the route specifying unit 15 specifies a starting point and an intermediate route for each of the plurality of signals included in the causal relationship specified by the causal relationship specifying unit 13 (Step A4). Specifically, the route identifying unit 15 compares each signal included in the causal relationship with the physical configuration information stored in the physical configuration storage unit 18 and, for each signal, a corresponding starting point, intermediate route, Identify the end point.
- the display unit 14 displays, as a causal relationship, each signal included in the causal relationship specified in step A3, and the starting point and the intermediate route specified in step A4, in the terminal device (HMI) 34 (see FIG. 3). ) Is displayed on the screen (step A5).
- the causal relationship identifying unit 13 determines whether the end of the process is instructed (Step A6). As a result of the determination in step A6, when the end of the process is not instructed, the causality identification unit 13 executes step A3 again using the latest system state information. On the other hand, as a result of the determination in step A6, when the end of the process is instructed, the process in the plant monitoring device 10 ends.
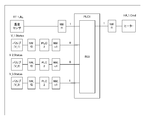
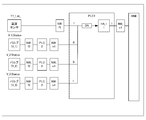
- FIGS. 11 to 16 show examples (first to sixth examples) of display screens according to the embodiment of the present invention, respectively.
- FIGS. 11 to 16 show the case where the causal relationship specified by the causal relationship specifying unit 13 based on the system state information is the causal relationship R03 of the PLC 30 shown in FIG. 7 unless otherwise specified. Is shown.
- the display unit 14 displays signals included in the specified causal relationship, specifically, “TT_1.AL”, “V_1. ⁇ Status ”,“ V_2. Status ”,“ V_3. ⁇ Status”, And “HA_1. @ Cmd” and their respective values are displayed on the screen.
- “V_1. @ Status”, “V_2. @ Status”, and “V_3. @ Status” include another PLC 31 and a specific control network (NW_c1) on the route. . For this reason, the display unit 14 gives “!” To “V_1. @ Status”, “V_2. @ Status”, and “V_3. @ Status” to change the display mode of these signals to the display of other signals. It differs from the embodiment.
- the display unit 14 displays “TT_1._1AL”, “V_1. Status”, “V_2. Status”, “V_3. Status”, and “HA_1. Cmd” as in the example of FIG. Are displayed on the screen. However, in the example of FIG. 12, the display unit 14 also displays the causality number (identifier) and the intermediate route of each signal.
- the display unit 14 displays the intermediate route of each signal as in the example of FIG. 12, but specifically displays the state of the output element instead of the causality number.
- "ON" is displayed to indicate that the heater 23 is operating.
- the display unit 14 also displays the terminal device 34 used by the operator on the screen shown in FIG. According to the example of FIG. 14, the operator can confirm what path the screen that he / she is viewing has been constructed.
- the display unit 14 darkens the background color of the corresponding signal in accordance with the risk in order to present the fact that the signal has a high risk of being tampered with.
- the icon of “NW” is added to the display area of the signal that has passed through the specific control network (NW_c1), and the background color is displayed even darker.
- FIG. 15A shows a display example when the causal relationship R02, R04, and R05 are specified at the same time when the heater 23 is off
- FIG. 15B shows the display when the heater is on. The case where the causal relationship R03 is specified is shown. According to the example of FIG. 15, the operator can grasp the risk for each signal.
- FIG. 16A shows a case where the causal relationship R02, R04 and R05 are specified at the same time when the heater 23 is off
- FIG. 16B shows a case where the causal relationship R03 is on when the heater is on. Is specified.
- the operator can grasp the risk for each signal.
- the causal relationship between signals that is currently valid in the plant 20 that is operating is displayed on the screen. Accordingly, the operator can immediately confirm which sensor or the like determines the signal indicating the operation or stop of the actuator based on the signal from the sensor. The operator who has doubts about the operation of the actuator at the time of occurrence of an abnormality immediately goes to a manufacturing process site where a sensor or the like that is a factor for operating or stopping the actuator is installed, and the actual situation and the It can be checked whether the signal from the sensor or the like matches. Thus, when a cyber attack such as falsifying a signal from a sensor or the like and abusing an actuator occurs, the operator can quickly grasp whether the signal has been tampered with and can respond to the cyber attack. .
- a cyber attack such as falsifying a signal from a sensor or the like and abusing an actuator
- a signal having a high risk of tampering for example, a signal passing through a network
- a signal having a high risk of tampering for example, a signal passing through a network
- the operator gives priority to a signal having a high risk of tampering.
- the operator can also grasp in advance the target portion of the cyber attack even in normal times.
- the program in the present embodiment may be any program that causes a computer to execute steps A1 to A5 shown in FIG.
- the processor of the computer functions as the control program acquiring unit 11, the causal relationship extracting unit 12, the causal relationship identifying unit 13, the display unit 14, the route identifying unit 15, and the system state acquiring unit 17, and performs processing.
- the causal relationship storage unit 16 and the physical configuration storage unit 18 can be realized by storing data files constituting them in a storage device such as a hard disk provided in a computer.
- the program according to the present embodiment may be executed by a computer system configured by a plurality of computers.
- each computer functions as one of the control program acquiring unit 11, the causal relationship extracting unit 12, the causal relationship identifying unit 13, the display unit 14, the route identifying unit 15, and the system state acquiring unit 17, respectively.
- You may.
- the causal relationship storage unit 16 and the physical configuration storage unit 18 may be configured on a computer different from the computer that executes the program according to the present embodiment.
- FIG. 17 is a block diagram illustrating an example of a computer that realizes the plant monitoring device according to the embodiment of the present invention.
- the computer 110 includes a CPU (Central Processing Unit) 111, a main memory 112, a storage device 113, an input interface 114, a display controller 115, a data reader / writer 116, and a communication interface 117. And these units are connected via a bus 121 so as to be able to perform data communication with each other.
- the computer 110 may include a GPU (Graphics Processing Unit) or an FPGA (Field-Programmable Gate Array) in addition to or instead of the CPU 111.
- the CPU 111 performs various operations by expanding the program (code) according to the present embodiment stored in the storage device 113 into the main memory 112 and executing them in a predetermined order.
- the main memory 112 is typically a volatile storage device such as a DRAM (Dynamic Random Access Memory).
- the program according to the present embodiment is provided in a state stored in computer-readable recording medium 120. Note that the program in the present embodiment may be distributed on the Internet connected via the communication interface 117.
- the storage device 113 includes a semiconductor storage device such as a flash memory in addition to a hard disk drive.
- the input interface 114 mediates data transmission between the CPU 111 and input devices 118 such as a keyboard and a mouse.
- the display controller 115 is connected to the display device 119 and controls display on the display device 119.
- the data reader / writer 116 mediates data transmission between the CPU 111 and the recording medium 120, reads out a program from the recording medium 120, and writes a processing result of the computer 110 to the recording medium 120.
- the communication interface 117 mediates data transmission between the CPU 111 and another computer.
- the recording medium 120 include a general-purpose semiconductor storage device such as CF (Compact @ Flash (registered trademark)) and SD (Secure Digital), a magnetic recording medium such as a flexible disk (Flexible @ Disk), or a CD-ROM.
- CF Compact @ Flash
- SD Secure Digital
- An optical recording medium such as a ROM (Compact Disk Read Only Memory) may be used.
- the plant monitoring device 10 can be realized not by a computer in which a program is installed but by using hardware corresponding to each unit. Further, part of the plant monitoring apparatus 10 may be realized by a program, and the remaining part may be realized by hardware.
- Appendix 1 An apparatus for monitoring the operation status of a plant, Based on sensor data from a sensor installed in the plant, for controlling the plant, to obtain a control program, a control program acquisition unit, From the obtained control program, to extract a causal relationship between each of a plurality of signals used in the plant, a causal relationship extracting unit, The current state of the plurality of signals, and each of the extracted causal relationship is compared, to specify a causal relationship that matches the specified state, a causal relationship specifying unit, A display unit for displaying the specified causal relationship on a screen, Has, A plant monitoring device, characterized in that:
- the plant monitoring device (Appendix 3) The plant monitoring device according to claim 2, wherein
- the control program acquisition unit acquires the control program for each of the control devices,
- the causal relationship extraction unit for each of the control devices, from the control program of the control device, extract the causal relationship
- the path identifying unit for each of the control device, for each of the plurality of signals included in the identified causal relationship, to identify a starting point and an intermediate route, At this time, if the specified intermediate route includes a control device different from the control device, and if the specified intermediate route includes a specific network, or one or both of the specified intermediate routes, the display unit may correspond.
- a plant monitoring device characterized by the above-mentioned.
- a method for monitoring the operation status of a plant comprising: (A) obtaining a control program for controlling the plant based on sensor data from a sensor installed in the plant; and (B) extracting a causal relationship between each of a plurality of signals used in the plant from the acquired control program; (C) comparing a current state of the plurality of signals with each of the extracted causal relationships, and identifying a causal relationship that matches the identified state; (D) displaying the specified causal relationship on a screen; Having, A plant monitoring method, comprising:
- (Appendix 6) The method for monitoring a plant according to claim 5, wherein (E) further comprising, for each of the plurality of signals included in the specified causal relationship, specifying a starting point and an intermediate route; In the step (d), the plurality of signals included in the identified causal relationship, the identified starting point, and the intermediate route are displayed on the screen as the causal relationship.
- a plant monitoring method comprising:
- step (a) The method for monitoring a plant according to claim 6, wherein
- the control program is acquired for each of the control devices;
- the causal relationship is extracted from the control program of the control device,
- step (e) for each of the control devices, a starting point and an intermediate route are specified for each of the plurality of signals included in the specified causal relationship;
- the step (d) is performed.
- the display mode of the corresponding signal is different from the display mode of other signals.
- a plant monitoring method comprising:
- a computer-readable recording medium recording a program for monitoring the operation status of the plant
- On the computer (A) obtaining a control program for controlling the plant based on sensor data from a sensor installed in the plant; and (B) extracting a causal relationship between each of the plurality of signals used in the plant from the obtained control program; (C) comparing a current state of the plurality of signals with each of the extracted causal relationships, and identifying a causal relationship that matches the identified state; (D) displaying the identified causal relationship on a screen; And a computer-readable recording medium storing a program including instructions for executing the program.
- step (a) A computer-readable recording medium according to supplementary note 10, wherein: In the case where the plant includes a plurality of control devices that execute the control program, and a network that connects the plurality of control devices, In the step (a), the control program is acquired for each of the control devices; In the step (b), for each of the control devices, the causal relationship is extracted from the control program of the control device, In the step (e), for each of the control devices, a starting point and an intermediate route are specified for each of the plurality of signals included in the specified causal relationship; At this time, if the specified intermediate route includes a control device different from the control device, and if the specified intermediate route includes a specific network, or both of them, the step (d) is performed. In, the display mode of the corresponding signal is different from the display mode of other signals, A computer-readable recording medium characterized by the above-mentioned.
- the present invention when an abnormality occurs in the plant, the causal relationship of the control program is presented, so that the operator can quickly take a corrective action.
- the present invention is useful for various plants controlled by a control device.
Landscapes
- Engineering & Computer Science (AREA)
- Physics & Mathematics (AREA)
- General Physics & Mathematics (AREA)
- Automation & Control Theory (AREA)
- General Engineering & Computer Science (AREA)
- Manufacturing & Machinery (AREA)
- Quality & Reliability (AREA)
- Testing And Monitoring For Control Systems (AREA)
- Programmable Controllers (AREA)
Abstract
L'invention concerne un dispositif de surveillance d'usine (10) destiné à surveiller l'état de fonctionnement d'une usine et comprenant : une unité d'acquisition de programme de commande (11) qui, sur la base de données de capteur provenant de capteurs installés dans une usine, acquiert un programme de commande pour commander l'usine ; une unité d'extraction de relation de cause à effet (12) qui extrait du programme de commande des relations de cause à effet entre chaque signal d'une pluralité de signaux utilisés dans l'usine ; une unité d'identification de relation de cause à effet (13) qui identifie l'état actuel de la pluralité de signaux, compare l'état identifié aux relations de cause à effet extraites et identifie une relation de cause à effet correspondant à l'état identifié ; et une unité d'affichage (14) qui affiche la relation de cause à effet identifiée sur un écran.
Priority Applications (3)
| Application Number | Priority Date | Filing Date | Title |
|---|---|---|---|
| PCT/JP2018/028147 WO2020021685A1 (fr) | 2018-07-26 | 2018-07-26 | Dispositif de surveillance d'usine, procédé de surveillance d'usine et support d'enregistrement lisible par ordinateur |
| JP2020532097A JP7031744B2 (ja) | 2018-07-26 | 2018-07-26 | プラント監視装置、プラント監視方法、プログラム |
| US17/262,561 US11579596B2 (en) | 2018-07-26 | 2018-07-26 | Plant monitoring apparatus, plant monitoring method, and computer readable recording medium |
Applications Claiming Priority (1)
| Application Number | Priority Date | Filing Date | Title |
|---|---|---|---|
| PCT/JP2018/028147 WO2020021685A1 (fr) | 2018-07-26 | 2018-07-26 | Dispositif de surveillance d'usine, procédé de surveillance d'usine et support d'enregistrement lisible par ordinateur |
Publications (1)
| Publication Number | Publication Date |
|---|---|
| WO2020021685A1 true WO2020021685A1 (fr) | 2020-01-30 |
Family
ID=69180756
Family Applications (1)
| Application Number | Title | Priority Date | Filing Date |
|---|---|---|---|
| PCT/JP2018/028147 Ceased WO2020021685A1 (fr) | 2018-07-26 | 2018-07-26 | Dispositif de surveillance d'usine, procédé de surveillance d'usine et support d'enregistrement lisible par ordinateur |
Country Status (3)
| Country | Link |
|---|---|
| US (1) | US11579596B2 (fr) |
| JP (1) | JP7031744B2 (fr) |
| WO (1) | WO2020021685A1 (fr) |
Cited By (1)
| Publication number | Priority date | Publication date | Assignee | Title |
|---|---|---|---|---|
| EP4250029A4 (fr) * | 2020-11-18 | 2024-12-18 | OMRON Corporation | Dispositif d'analyse de processus, procédé d'analyse de processus et programme d'analyse de processus |
Citations (4)
| Publication number | Priority date | Publication date | Assignee | Title |
|---|---|---|---|---|
| JPH07302393A (ja) * | 1994-05-09 | 1995-11-14 | Mitsubishi Heavy Ind Ltd | 運転支援方法及び装置 |
| JP2005044316A (ja) * | 2003-07-25 | 2005-02-17 | Omron Corp | シミュレーション支援ツールおよびラダープログラムの検証システムならびにプログラム製品 |
| JP2011060012A (ja) * | 2009-09-10 | 2011-03-24 | Fuji Electric Systems Co Ltd | プラント監視装置およびプラント監視方法 |
| JP2018005453A (ja) * | 2016-06-30 | 2018-01-11 | オムロン株式会社 | セーフティシステム、プログラム、および方法 |
Family Cites Families (8)
| Publication number | Priority date | Publication date | Assignee | Title |
|---|---|---|---|---|
| JPH09288512A (ja) * | 1996-04-22 | 1997-11-04 | Toshiba Corp | プラント状態可視化システム |
| JP2001100835A (ja) * | 1999-09-29 | 2001-04-13 | Toshiba Corp | プラント状態監視システム |
| JP5661659B2 (ja) * | 2012-02-03 | 2015-01-28 | 株式会社日立製作所 | プラント監視制御装置及びプラント監視制御方法 |
| US10503155B2 (en) * | 2014-06-26 | 2019-12-10 | Abb Schweiz Ag | Method for controlling a process plant using a redundant local supervisory controller |
| JP6638370B2 (ja) * | 2015-12-15 | 2020-01-29 | オムロン株式会社 | 制御装置、監視システム、制御プログラムおよび記録媒体 |
| JP6852519B2 (ja) * | 2016-04-04 | 2021-03-31 | オムロン株式会社 | プログラム作成支援装置、プログラム作成支援装置の制御方法、およびプログラム作成支援装置の制御プログラム |
| JP6624008B2 (ja) * | 2016-10-27 | 2019-12-25 | 横河電機株式会社 | エンジニアリングツール連携装置、エンジニアリングツール連携方法、エンジニアリングツール連携プログラム及び記録媒体 |
| CN108983710B (zh) * | 2017-06-02 | 2021-05-18 | 欧姆龙株式会社 | 工序分析装置、工序分析方法以及存储介质 |
-
2018
- 2018-07-26 WO PCT/JP2018/028147 patent/WO2020021685A1/fr not_active Ceased
- 2018-07-26 US US17/262,561 patent/US11579596B2/en active Active
- 2018-07-26 JP JP2020532097A patent/JP7031744B2/ja active Active
Patent Citations (4)
| Publication number | Priority date | Publication date | Assignee | Title |
|---|---|---|---|---|
| JPH07302393A (ja) * | 1994-05-09 | 1995-11-14 | Mitsubishi Heavy Ind Ltd | 運転支援方法及び装置 |
| JP2005044316A (ja) * | 2003-07-25 | 2005-02-17 | Omron Corp | シミュレーション支援ツールおよびラダープログラムの検証システムならびにプログラム製品 |
| JP2011060012A (ja) * | 2009-09-10 | 2011-03-24 | Fuji Electric Systems Co Ltd | プラント監視装置およびプラント監視方法 |
| JP2018005453A (ja) * | 2016-06-30 | 2018-01-11 | オムロン株式会社 | セーフティシステム、プログラム、および方法 |
Cited By (1)
| Publication number | Priority date | Publication date | Assignee | Title |
|---|---|---|---|---|
| EP4250029A4 (fr) * | 2020-11-18 | 2024-12-18 | OMRON Corporation | Dispositif d'analyse de processus, procédé d'analyse de processus et programme d'analyse de processus |
Also Published As
| Publication number | Publication date |
|---|---|
| JP7031744B2 (ja) | 2022-03-08 |
| US20210286344A1 (en) | 2021-09-16 |
| JPWO2020021685A1 (ja) | 2021-08-02 |
| US11579596B2 (en) | 2023-02-14 |
Similar Documents
| Publication | Publication Date | Title |
|---|---|---|
| CN105320854B (zh) | 通过签名平衡防止自动化组件受到程序篡改 | |
| US20170371311A1 (en) | Using soft-sensors in a programmable logic controller | |
| EP3771951B1 (fr) | Utilisation de dates provenant des systèmes plc et de dates provenant des sensors externes aux systèmes plc pour assurer l'intégrité des données des contrôleurs industriels | |
| TWI710873B (zh) | 支援裝置、學習裝置以及廠房運轉條件設定支援系統 | |
| JP5895906B2 (ja) | プロセス制御装置及びシステム並びにその健全性判定方法 | |
| EP3180667B1 (fr) | Système et procédé de commande de processus avancée | |
| JP7031744B2 (ja) | プラント監視装置、プラント監視方法、プログラム | |
| JP6176341B2 (ja) | プロセス制御装置及びシステム並びにその健全性判定方法 | |
| US12164289B2 (en) | Monitoring method, monitoring apparatus, and program | |
| CN112912903B (zh) | 推论装置、信息处理装置、推论方法、程序以及记录介质 | |
| US20220147032A1 (en) | Monitoring method, monitoring apparatus, and program | |
| JP2019102574A (ja) | 情報処理装置、情報処理装置の制御方法、およびプログラム | |
| JP7147993B2 (ja) | セキュリティアセスメント装置、セキュリティアセスメント方法、プログラム | |
| JP7416015B2 (ja) | 情報処理装置、アラーム予測方法およびアラーム予測プログラム | |
| US12045342B2 (en) | Information processing device, display method, and non-transitory computer readable medium | |
| JP7040618B2 (ja) | 解析支援装置、解析支援方法、及びプログラム | |
| JP2015230584A (ja) | 警報対応支援装置および警報対応支援方法 | |
| JP2025163549A (ja) | セキュリティ監視装置、セキュリティ監視方法、及びプログラム | |
| CN121039590A (zh) | 可解释模型监控 | |
| WO2021145147A1 (fr) | Dispositif d'affichage, procédé d'affichage et programme d'affichage | |
| JP2016201603A (ja) | 不正通信検査装置および通信システム |
Legal Events
| Date | Code | Title | Description |
|---|---|---|---|
| 121 | Ep: the epo has been informed by wipo that ep was designated in this application |
Ref document number: 18928004 Country of ref document: EP Kind code of ref document: A1 |
|
| ENP | Entry into the national phase |
Ref document number: 2020532097 Country of ref document: JP Kind code of ref document: A |
|
| NENP | Non-entry into the national phase |
Ref country code: DE |
|
| 122 | Ep: pct application non-entry in european phase |
Ref document number: 18928004 Country of ref document: EP Kind code of ref document: A1 |