WO2020121637A1 - Dispositif de simulation, programme de simulation et procédé de simulation - Google Patents
Dispositif de simulation, programme de simulation et procédé de simulation Download PDFInfo
- Publication number
- WO2020121637A1 WO2020121637A1 PCT/JP2019/039957 JP2019039957W WO2020121637A1 WO 2020121637 A1 WO2020121637 A1 WO 2020121637A1 JP 2019039957 W JP2019039957 W JP 2019039957W WO 2020121637 A1 WO2020121637 A1 WO 2020121637A1
- Authority
- WO
- WIPO (PCT)
- Prior art keywords
- analysis
- reference model
- model
- unit
- index
- Prior art date
- Legal status (The legal status is an assumption and is not a legal conclusion. Google has not performed a legal analysis and makes no representation as to the accuracy of the status listed.)
- Ceased
Links
Images


Classifications
-
- G—PHYSICS
- G06—COMPUTING OR CALCULATING; COUNTING
- G06F—ELECTRIC DIGITAL DATA PROCESSING
- G06F30/00—Computer-aided design [CAD]
- G06F30/10—Geometric CAD
-
- G—PHYSICS
- G06—COMPUTING OR CALCULATING; COUNTING
- G06F—ELECTRIC DIGITAL DATA PROCESSING
- G06F30/00—Computer-aided design [CAD]
- G06F30/20—Design optimisation, verification or simulation
Definitions
- the present invention relates to a simulation device, a simulation program, and a simulation method.
- a component of a structure composed of a planar element and/or a three-dimensional element is divided into a plurality of parts in a uniaxial direction.
- the component shape pattern is set by changing the height of the cross section or the like for each of the divided portions.
- a plurality of types of rigidity analysis of the structure are performed with the set parts incorporated in the structure.
- a multivariate analysis is performed on the results of the stiffness analysis.
- a stiffness analysis is selected based on the result of this multivariate analysis.
- the technique of "the cross-sectional shape is determined based on the multiple regression coefficient of the selected rigidity analysis” is disclosed.
- Patent Document 1 uniformly analyzes plane elements and/or three-dimensional elements, but does not consider narrowing down the locations of important shapes that affect performance. Further, the technique of Patent Document 1 has a problem that it is difficult to implement the technique for a complicated shape in which design parameters that affect performance cannot be selected.
- Patent Document 1 a large calculation load is required for CAE performance analysis per time (for example, a case of performing a large-scale fluid analysis), and a huge number of combination patterns in which each divided part is slightly changed.
- the CAE performance analysis is repeated in detail, it takes a lot of time to obtain an optimum solution.
- an object of the present invention is to provide a technology that efficiently supports improvement in performance by design.
- one of the representative simulation apparatuses of the present invention stores a reference model storage unit that stores a reference model as a processing target and a plurality of reference models that have performance indexes as comparison targets of the reference model.
- a reference model storage unit and an analysis processing unit.
- the analysis processing unit uses a space selection unit that sets a corresponding region for each reference model for the reference model divided region and a difference between the reference model corresponding region and the reference model corresponding region for each reference model as an analysis index.
- FIG. 1 is a diagram showing the configuration of the simulation apparatus 1.
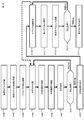
- FIG. 2 is a flowchart illustrating the operation of the simulation device 1.
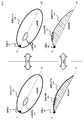
- FIG. 3 is a diagram for explaining the operation of the space selection unit 22.
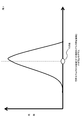
- FIG. 4 is a histogram showing the difference between the divided area and the corresponding area.
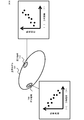
- FIG. 5 is a diagram for explaining the relationship between the analysis index and the performance index.
- FIG. 6 is a diagram for explaining the relationship between the analysis index and the performance index.
- FIG. 7 is a diagram showing an analysis model of an elevator cage.
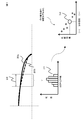
- FIG. 8 is a diagram illustrating an analysis procedure of the simulation device 1.
- FIG. 9 is a diagram showing the configuration of the simulation device 1A.
- FIG. 10 is a flowchart illustrating the operation of the simulation device 1A.
- FIG. 1 is a diagram illustrating the configuration of the simulation device 1 according to the first embodiment.
- the simulation device 1 is configured as an information processing device (computer or the like) including a CPU (Central Processing Unit), a memory and the like as hardware.
- a CPU Central Processing Unit
- a memory By executing the simulation program by this hardware, various functions described later are realized.
- Part or all of this hardware may be replaced with a DSP (Digital Signal Processor), an FPGA (Field-Programmable Gate Array), a GPU (Graphics Processing Unit), or the like.
- a part or all of the hardware may be centralized or distributed in a server on the network and placed in the cloud, and a plurality of people may share it via the network.
- the simulation device 1 includes a model management unit 10, an analysis processing unit 20, and an operation unit 40.
- the model management unit 10 includes a standard model storage unit 11 and a reference model storage unit 12.
- the reference model storage unit 11 stores a data group (hereinafter referred to as a “reference model”) defining at least shape design data for an object for which a user designs a shape.
- the reference model storage unit 12 stores a plurality of reference models each having a performance index as a comparison target of the reference model.
- the analysis processing unit 20 includes a model setting unit 21, a space selection unit 22, an analysis index extraction unit 23, an analysis unit 24, and an analysis result display unit 26.
- the model setting unit 21 acquires a set of reference models to be processed from the reference model storage unit 11. Further, the model setting unit 21 acquires from the reference model storage unit 12 a plurality of reference model sets that can be compared with the acquired reference model.
- the space selection unit 22 divides the reference model to be processed into a plurality of parts and sets the divided areas. Further, the space selection unit 22 sets a corresponding area for each reference model as an area corresponding to the divided area of the standard model.
- the analysis index extraction unit 23 obtains a difference in design data between the divided area of the standard model and the corresponding area of the reference model, and sets it as an analysis index.
- the analysis unit 24 obtains a correlation for each divided area of the reference model as to how much the analysis index contributes to the performance index of the reference model and what kind of tendency or relationship there is.
- the analysis result display unit 26 visualizes, by color-coding the graphic display of the reference model, the degree of contribution of the reference model to the performance according to the correlation for each section region. indicate.
- a segmented region having a high correlation with performance is displayed by color, region segmentation, marking, blinking, or the like so as to be noticeable to the user.
- the operation unit 40 includes a standard model registration unit 41, a reference model registration unit 42, and a parameter registration unit 43, and provides a user with a user interface for registering each of the standard model, the reference model, and the analysis parameter.
- FIG. 2 is a flowchart illustrating the operation of the simulation device 1. The operation of the simulation apparatus 1 will be described along the step numbers in the figure.
- Step S101 The user performs an operation of designing the shape of the object through the reference model registration unit 41, and creates a reference model data file in the reference model storage unit 11.
- a set of point coordinate data in a three-dimensional space for example, is stored as design data regarding the shape.
- design data relating to various physical characteristics of the object such as material, surface roughness, strength, elasticity, density and weight can be defined in the reference model.
- the standard model has basically the same data format as the reference model, and a data area for storing a performance index described later can be added.
- Step S102 A plurality of reference models are collected and registered in the reference model storage unit 12 in advance. These reference models are prepared in advance for a typical shape design. Further, the reference model is expanded at any time by collecting design information of past shape designs from the simulation device 1 or an external server. Further, the user can also collect the reference models and register them in the reference model storage unit 12 via the reference model registration unit 42, if necessary.
- performance index an index indicating the evaluation thereof
- design data capable of comparing differences with the design data of the standard model.
- Step S103 The user sets and registers the analysis parameter for the analysis process in the analysis processing unit 20 via the parameter registration unit 43.
- the analysis parameters are, for example, various conditions of the analysis process, the number of times the analysis process is repeated, the total number of reference models selected, and the like.
- Step S104 The model setting unit 21 selects a standard model and a reference model to be used in the analysis process, based on the model selection parameter in the analysis parameters.
- a reference model a plurality of reference models may be selected at random from the registered reference model group, or a plurality of reference models having the same or similar design data to the reference data to some extent may be set.
- Step S105 The operation of the space selection unit 22 will be described based on FIG. First, the space selection unit 22 determines a divided area obtained by dividing the reference model 100 into a plurality of areas based on the parameters (number, size, etc.) regarding the divided area in the analysis parameter. The space selection unit 22 selects a space that partitions the reference model so as to include these partitioned areas (hereinafter referred to as “partitioned space 101”).
- the partitioned space 101 may be a polygon, a circle, an ellipse, a plane or a curved surface formed by a combination thereof, or a three-dimensional columnar body, a polyhedron, a sphere, an ellipsoid, or a three-dimensional space formed by a combination thereof.
- the space selection unit 22 cuts out a design data group (segmented area) from the reference model 100 using the partitioned space 101.
- a group of design data corresponding to the surface of the object that affects the running resistance is cut out by the partitioned space 101.
- design data groups inside the object that affect weight reduction and strength performance are cut out by the partitioned space 101.
- the space selection unit 22 obtains a partitioned space 151 by mapping conversion of the partitioned space 101 with respect to the standard model 100 into each of the reference models 150. This mapping conversion is set such that both partitioned spaces 151 are converted into corresponding positions and corresponding sizes of the partitioned space 101 based on the reference points R and R′ for alignment between the standard model 100 and the reference model 150. It The space selection unit 22 cuts out the design data group (corresponding region) of the reference model 150 using the partitioned space 151.
- Step S106 The analysis index extraction unit 23 obtains, for each reference model, a difference in design data (a difference in shape or physical property) between the divided area of the standard model and the corresponding area of the reference model.
- the analysis index extraction unit 23 indexes the difference as an analysis index.
- the analysis index extraction unit 23 obtains the distance between the point coordinates as a difference in the design data of the point coordinates forming the object surface in order to compare the running resistance, and the representative value of these differences. (Integrated value, average value, median value, mode value, etc.) is used as an analysis index.
- FIG. 4 is an explanatory diagram showing a difference histogram between the divided area of the standard model and the corresponding area of the reference model. As shown in the figure, since the divided area and the corresponding area are in a relatively small range, the variation in the difference within the area is within a significant width. Therefore, by using the representative value of the variation of the difference as the analysis index, the tendency of the difference between the regions can be indexed using the representative value.
- Step S107 The analysis unit 24 performs correlation analysis or regression analysis between the analysis index and the performance index for each divided area of the reference model. When there are a plurality of analysis indexes, the analysis unit 24 performs multiple regression analysis between the plurality of analysis indexes and the performance index.
- FIG. 5 and FIG. 6 are diagrams for explaining the relationship between the analysis index and the performance index for the segmented areas 110 to 112 of the reference model.
- the analysis index and the performance index show a negative correlation, and the performance index tends to increase as the analysis index decreases in the negative direction (such as lowering the height of the surface shape). Further, in the divided area 111, the correlation between the analysis index and the performance index is low. On the other hand, in the divided area 112, the analysis index and the performance index have a positive correlation, and the performance index tends to increase as the analysis index increases in the positive direction (increases the height of the surface shape).
- Step S108 The analysis unit 24 determines whether or not the analysis of the reference model has been completed for an appropriate number of segmented regions at appropriate intervals, or whether an analysis result exceeding the correlation coefficient necessary for correcting the reference model has been obtained. Make a decision. When this determination condition is not satisfied, the analysis unit 24 returns the operation to step S105 and instructs the space selection unit 22 to further select the partitioned space. In this way, the operations of steps S105 to S108 are repeated until the determination condition is satisfied (or the processing is terminated by the termination). On the other hand, when the determination condition is satisfied, the analysis unit 24 moves the operation to step S109.
- Step S109 The analysis result display unit 26 performs evaluation judgment such as “high correlation coefficient”, “large regression coefficient”, “analysis index having large multiple regression coefficient”, and “large amount of shape change”. Based on this, the segmented region where the contribution of the reference model to the performance index is high is visualized. For example, a display in which the above-described divided areas that contribute to the performance improvement are colored in a heat map is composite-displayed on the 3D display of the reference model.
- Information may be provided to the user.
- FIG. 7 is a diagram representatively showing a standard model 200a and reference models 200b and 200c as analysis models of elevator cages.
- 201a to 201c indicate the upper surfaces of the standard model 200a and the reference models 200b and 200c.
- Reference numerals 202a to 202c denote side surfaces of the standard model 200a and the reference models 200b and 200c.
- the aerodynamic performance of the surface shape 203a of the reference model 200a on the upper surface of the elevator is improved.
- the surface shapes 203b and 203c of the reference model are compared with the surface shape 203a.
- the target regions are limited to 206a, 206b, 206c.
- ellipsoidal partition spaces 204a, 204b, and 204c are selected as arbitrary partition spaces, and the center position of the ellipsoid and the size of the ellipse are used as parameters.
- FIG. 8 shows a state in which the surface shape 203a of the standard model 200a and the surface shape 203b of the reference model 200b are overlapped with each other as the cross-sectional shape of the upper surface of the elevator.
- the difference in height between the partitioned area of the surface shape 203a cut out in the partitioned space 210 and the corresponding area of the corresponding surface shape 203b is the histogram 211. Is extracted as.
- An average value is calculated for this histogram 211 and selected as an analysis index of the reference model 200b, and a scatter diagram (hereinafter referred to as “correlation distribution”) between this analysis index and the performance index of the reference model 200b is represented as a plot 212.
- the correlation distribution between the analysis index and the performance index can be obtained.
- the traveling resistance can be reduced by modifying the reference model 200a in the direction of lowering the height of the surface shape 203a in the partitioned space 210.
- the traveling resistance can be reduced by correcting the reference model 200a so as to increase the height of the surface shape 203a in the partitioned space 210.
- Patent Document 1 has a problem that it is difficult to narrow down the locations of important shapes that affect performance.
- the segmented region of the reference model is a region that contributes to performance improvement, and thus it is possible to appropriately narrow down important places that affect performance.
- Patent Document 1 has a problem in that it is difficult to implement it for a complicated shape for which design parameters that affect performance cannot be selected.
- the difference between the shapes and the difference in the physical characteristics are used as the analysis indexes, and the performance index and the analysis index are correlated to determine whether the parameter factor that affects the performance is the shape. It becomes possible to appropriately select whether or not it is a physical characteristic.
- the analysis result display unit 26 displays the contribution of the reference model to the performance index in the partitioned area according to the correlation obtained for the partitioned area. Therefore, it becomes possible to notify the user of the divided area that is a key point in improving the performance of the reference model and appropriately support the user's design work.
- the analysis result display unit 26 specifically visualizes the segmented regions evaluated to have a high correlation coefficient. Therefore, it is possible to notify the user of the segmented region in which the performance index changes in response to the change in the analysis index.
- the analysis result display unit 26 visualizes the segmented region evaluated to have a large regression coefficient. Therefore, it is possible to notify the user of the segmented area in which the performance index changes significantly with respect to the change in the analysis index.
- the analysis result display unit 26 visualizes the sectioned region evaluated as having the analysis index having the large multiple regression coefficient. Therefore, it is possible to inform the user which analysis index has an effect on the performance improvement among many analysis indexes such as a difference in shape and a difference in various physical characteristics.
- the analysis result display unit 26 visualizes the segmented area evaluated to have a large amount of shape change.
- a segmented region having a large amount of shape change is a segmented region having a large difference in shape (analysis index) between a plurality of reference models.
- Such a segmented region is a point of caution because it greatly contributes to the performance index, but the shape change is likely to be large when the reference model is modified. It is possible to notify the user of the point of caution.
- a partitioned space including a polygon including a partitioned area of the reference model, a circle, an ellipse, a column, a polyhedron, a sphere, an ellipsoid, and a combination thereof. Therefore, even divided areas having various shapes can be freely cut out by various divided spaces.
- the corresponding area of the reference model is determined by mapping the divided space including the divided area of the standard model into the reference model. If there is a certain amount of positional deviation between the standard model and the reference model, it is difficult to set the corresponding area because the corresponding area is slightly deviated from the reference model simply by converting the divided area of the standard model into the reference model.
- the partitioned space that surrounds the partitioned area it is possible to set the corresponding area by surrounding the partitioned area with the partitioned space even if the positions of the standard model and the reference model deviate from each other. Therefore, by adopting the partition space, it is possible to increase the number of reference models available for analyzing the standard model.
- the difference in shape or physical property between the segmented region and the corresponding region can be used as the analysis index.
- the difference in shape As the analysis index, it becomes possible to assist the user in correcting the shape (height, inclination, step, curvature, unevenness, etc.) of the reference model.
- the difference in the physical properties is used as the analysis index, it becomes possible to assist the user in correcting the physical properties (material, surface roughness, strength, elasticity, density, weight, etc.) of the reference model.
- representative values such as integrated value, average value, mode value, and median value are also calculated and used as analysis indexes for a plurality of spatially sampled differences between the partitioned area and the corresponding area.
- FIG. 9 is a diagram showing the configuration of the simulation device 1A.
- the same components as those in the first embodiment are designated by the same reference numerals, and the duplicated description thereof will be omitted.
- the simulation device 1A includes a model correction unit 27, a corrected model display unit 28, and a model analysis unit 29 in the analysis processing unit 20.
- the model correction unit 27 automatically corrects the reference model in the direction of the analysis index having the higher performance index.
- the corrected model display unit 28 displays the corrected reference model.
- the model analysis unit 29 analyzes the performance index for the modified reference model.
- FIG. 10 is a flowchart illustrating the operation of the simulation device 1A.
- steps S101 to S109 are the same as those in the first embodiment, and therefore, redundant description will be omitted.
- step S110 will be described.
- Step S110 The model correction unit 27 selects a plurality of segmented regions evaluated to have a high contribution to the performance index based on the analysis processing of the analysis unit 24. For each of the selected segmented areas, the model modification unit 27 locally temporarily modifies the reference model in the direction of the analysis index having the higher performance index. The model correction unit 27 comprehensively corrects the reference model based on these local temporary corrections.
- Such comprehensive correction is performed by a process of continuously changing the connection shape of the target segmented region in the region of the boundary line or gap between the segmented regions. Further, the comprehensive correction may be a process of smoothing a local temporary correction to the entire reference model. Further, the comprehensive correction may be performed by a process (curved surface regression analysis) of forming a curved surface or a plane that approximately passes through the locally temporarily corrected region in the three-dimensional space of the reference model.
- Step S111 The model analysis unit 29 performs an analysis process on the corrected reference model to calculate a performance index.
- various analysis processing such as fluid analysis, strength analysis, and weight analysis can be used.
- Step S112 The reference model storage unit 12 sets the modified reference model and performance index as a set, registers it as a new reference model, and expands the database of reference models.
- Step S113 Based on the analysis parameter set in the model setting unit 21, the model analysis unit 29 determines whether or not the performance index of the modified reference model satisfies a predetermined standard.
- step S110 the operation is returned to step S110, and the model modification unit 27 modifies the modification amount of the standard model to remodify the standard model.
- the operation is returned to step S104, the setting of the analysis parameter (position and size of the segmented area, etc.) is changed, and the operation of steps S104 to S110 is performed. Will be redone.
- the modified reference model may be a new reference model.
- the model correction unit 27 shifts the operation to step S114.
- Step S114 The modified model display unit 28 displays the modified standard model satisfying the predetermined standard.
- the second embodiment has the following effect in addition to the effect of the first embodiment.
- the reference model when the corrected reference model does not satisfy the predetermined reference, the reference model is re-corrected by adjusting the correction amount of the reference model.
- the reference model can be re-corrected with a light process of adjusting the correction amount.
- the corrected reference model is stored as the reference model having the performance index analyzed by the model analysis unit 29. Therefore, the number of reference models stored in the reference model storage unit 12 can be automatically expanded.
- the elevator cage design application is described, but the application of the present invention is not limited to this.
- it can be applied to the top shape design of an aircraft, the body shape design of an automobile, the top shape design of a railway vehicle, and other uses.
- the present invention is not limited to the above-described embodiments, but includes various modifications.
- the above-described embodiments have been described in detail in order to explain the present invention in an easy-to-understand manner, and are not necessarily limited to those having all the configurations described.
- a part of the configuration of a certain embodiment can be replaced with the configuration of another embodiment, and the configuration of another embodiment can be added to the configuration of a certain embodiment.
Landscapes
- Engineering & Computer Science (AREA)
- Physics & Mathematics (AREA)
- Theoretical Computer Science (AREA)
- General Physics & Mathematics (AREA)
- Geometry (AREA)
- Evolutionary Computation (AREA)
- General Engineering & Computer Science (AREA)
- Computer Hardware Design (AREA)
- Computational Mathematics (AREA)
- Mathematical Analysis (AREA)
- Mathematical Optimization (AREA)
- Pure & Applied Mathematics (AREA)
- Management, Administration, Business Operations System, And Electronic Commerce (AREA)
Abstract
La présente invention a pour objet de fournir une technique permettant de mettre en œuvre de manière appropriée l'amélioration de performance par la conception. À cet effet, l'invention porte sur un dispositif de simulation représentatif qui comprend : une unité de mémorisation de modèle de critère qui mémorise un modèle de critère en tant que cible de traitement ; une unité de mémorisation de modèle de référence qui mémorise une pluralité de modèles de référence ayant chacun un indice de performance en tant que cible de comparaison du modèle de critère ; et une unité de traitement d'interprétation. L'unité de traitement d'interprétation comprend : une unité de sélection d'espace qui définit une zone correspondante pour chaque modèle de référence par rapport à la zone segmentée du modèle de critère ; une unité d'extraction d'indice d'analyse qui obtient, en tant qu'indice d'analyse, une différence entre la zone segmentée du modèle de critère et la zone correspondante du modèle de référence, pour chaque modèle de référence ; et une unité d'analyse qui obtient une corrélation entre un indice d'analyse obtenu pour chaque modèle de référence et un indice de performance pour chaque modèle de référence, pour la zone segmentée du modèle de critère.
Applications Claiming Priority (2)
| Application Number | Priority Date | Filing Date | Title |
|---|---|---|---|
| JP2018234875A JP2020095640A (ja) | 2018-12-14 | 2018-12-14 | シミュレーション装置、シミュレーションプログラムおよびシミュレーション方法 |
| JP2018-234875 | 2018-12-14 |
Publications (1)
| Publication Number | Publication Date |
|---|---|
| WO2020121637A1 true WO2020121637A1 (fr) | 2020-06-18 |
Family
ID=71075775
Family Applications (1)
| Application Number | Title | Priority Date | Filing Date |
|---|---|---|---|
| PCT/JP2019/039957 Ceased WO2020121637A1 (fr) | 2018-12-14 | 2019-10-10 | Dispositif de simulation, programme de simulation et procédé de simulation |
Country Status (3)
| Country | Link |
|---|---|
| JP (1) | JP2020095640A (fr) |
| TW (1) | TWI715342B (fr) |
| WO (1) | WO2020121637A1 (fr) |
Cited By (1)
| Publication number | Priority date | Publication date | Assignee | Title |
|---|---|---|---|---|
| CN113219948A (zh) * | 2021-05-06 | 2021-08-06 | 中车青岛四方车辆研究所有限公司 | 基于面向对象的机器人性能评价方法、系统、设备及介质 |
Citations (4)
| Publication number | Priority date | Publication date | Assignee | Title |
|---|---|---|---|---|
| JP2006119776A (ja) * | 2004-10-20 | 2006-05-11 | Hitachi Ltd | 解析作業支援装置 |
| JP2008089454A (ja) * | 2006-10-03 | 2008-04-17 | Bridgestone Corp | タイヤモデルの作成方法、装置、及びプログラム |
| JP2008146399A (ja) * | 2006-12-11 | 2008-06-26 | Hitachi Ltd | モデル作成装置、モデル作成方法、およびモデル作成プログラム |
| WO2012114457A1 (fr) * | 2011-02-22 | 2012-08-30 | 株式会社日立製作所 | Dispositif d'émission d'informations de modèles analytiques et programme d'émission d'informations de modèles analytiques |
Family Cites Families (1)
| Publication number | Priority date | Publication date | Assignee | Title |
|---|---|---|---|---|
| JPS4814751B1 (fr) * | 1967-02-15 | 1973-05-09 |
-
2018
- 2018-12-14 JP JP2018234875A patent/JP2020095640A/ja active Pending
-
2019
- 2019-10-10 WO PCT/JP2019/039957 patent/WO2020121637A1/fr not_active Ceased
- 2019-12-10 TW TW108145062A patent/TWI715342B/zh not_active IP Right Cessation
Patent Citations (4)
| Publication number | Priority date | Publication date | Assignee | Title |
|---|---|---|---|---|
| JP2006119776A (ja) * | 2004-10-20 | 2006-05-11 | Hitachi Ltd | 解析作業支援装置 |
| JP2008089454A (ja) * | 2006-10-03 | 2008-04-17 | Bridgestone Corp | タイヤモデルの作成方法、装置、及びプログラム |
| JP2008146399A (ja) * | 2006-12-11 | 2008-06-26 | Hitachi Ltd | モデル作成装置、モデル作成方法、およびモデル作成プログラム |
| WO2012114457A1 (fr) * | 2011-02-22 | 2012-08-30 | 株式会社日立製作所 | Dispositif d'émission d'informations de modèles analytiques et programme d'émission d'informations de modèles analytiques |
Cited By (2)
| Publication number | Priority date | Publication date | Assignee | Title |
|---|---|---|---|---|
| CN113219948A (zh) * | 2021-05-06 | 2021-08-06 | 中车青岛四方车辆研究所有限公司 | 基于面向对象的机器人性能评价方法、系统、设备及介质 |
| CN113219948B (zh) * | 2021-05-06 | 2022-08-26 | 中车青岛四方车辆研究所有限公司 | 基于面向对象的机器人性能评价方法、系统、设备及介质 |
Also Published As
| Publication number | Publication date |
|---|---|
| TWI715342B (zh) | 2021-01-01 |
| JP2020095640A (ja) | 2020-06-18 |
| TW202022658A (zh) | 2020-06-16 |
Similar Documents
| Publication | Publication Date | Title |
|---|---|---|
| US7933749B2 (en) | System and method for computing minimum distances between two point clouds | |
| US8072450B2 (en) | System and method for measuring a three-dimensional object | |
| US9619587B2 (en) | Decomposition of 3D geometry into developable surface patches and 2D cut patterns | |
| CN109624326B (zh) | 一种3d打印模型支撑结构生成过程中干涉点获取方法 | |
| JP5984114B2 (ja) | モデル作成プログラム、モデル作成方法、およびモデル作成装置 | |
| JP6179913B2 (ja) | 柱状物体抽出方法、柱状物体抽出プログラム、及び柱状物体抽出装置 | |
| CN106408604A (zh) | 一种点云数据的滤波方法及装置 | |
| JP2012037490A (ja) | データ解析装置、データ解析方法、及びプログラム | |
| CN110001066B (zh) | 一种三维打印最少分区填充方向确定方法 | |
| JP2020013351A (ja) | 三次元地図生成装置、及びプログラム | |
| CN111415403A (zh) | 基于路面扫描数据建虚拟实验数字路面的方法及存储介质 | |
| KR20180073914A (ko) | 3d 프린팅 시간 단축을 위한 상하 레이어 폴리라인 병합 기반 가변 슬라이싱 방법 | |
| WO2020121637A1 (fr) | Dispositif de simulation, programme de simulation et procédé de simulation | |
| CN120030948A (zh) | 一种cad模型碎面处理方法、装置、设备及介质 | |
| JP2017156251A (ja) | 地形変化点抽出システム、及び地形変化点抽出方法 | |
| CN114444185B (zh) | 原位标注的识别方法、装置及电子设备 | |
| CN112184900A (zh) | 高程数据的确定方法、装置及存储介质 | |
| JP2003263464A (ja) | フィレット作成方法、及び3次元cadプログラム | |
| CN114758104B (zh) | 一种适用于三维设计钢筋图的抗干涉散布筋自动标注方法 | |
| JP5831054B2 (ja) | プログラム、情報処理装置、およびメッシュ修正方法 | |
| JP2013105260A (ja) | 粘弾性体構造物の断面形状の設計装置、その方法及びそのプログラム | |
| CN108665514A (zh) | 字形剖分方法及字形剖分装置 | |
| CN114734640A (zh) | 一种打印路径生成方法、计算机设备及存储介质 | |
| CN110851555A (zh) | 一种基于线段角度权重的地块定位查找方法 | |
| JP2017157049A (ja) | 地形分類システム、及び地形分類方法 |
Legal Events
| Date | Code | Title | Description |
|---|---|---|---|
| NENP | Non-entry into the national phase |
Ref country code: DE |
|
| 122 | Ep: pct application non-entry in european phase |
Ref document number: 19896300 Country of ref document: EP Kind code of ref document: A1 |