WO2020183781A1 - Dispositif de diagnostic d'anomalie - Google Patents
Dispositif de diagnostic d'anomalie Download PDFInfo
- Publication number
- WO2020183781A1 WO2020183781A1 PCT/JP2019/043475 JP2019043475W WO2020183781A1 WO 2020183781 A1 WO2020183781 A1 WO 2020183781A1 JP 2019043475 W JP2019043475 W JP 2019043475W WO 2020183781 A1 WO2020183781 A1 WO 2020183781A1
- Authority
- WO
- WIPO (PCT)
- Prior art keywords
- data
- abnormality
- degree
- operation data
- category
- Prior art date
- Legal status (The legal status is an assumption and is not a legal conclusion. Google has not performed a legal analysis and makes no representation as to the accuracy of the status listed.)
- Ceased
Links
Images


Classifications
-
- G—PHYSICS
- G05—CONTROLLING; REGULATING
- G05B—CONTROL OR REGULATING SYSTEMS IN GENERAL; FUNCTIONAL ELEMENTS OF SUCH SYSTEMS; MONITORING OR TESTING ARRANGEMENTS FOR SUCH SYSTEMS OR ELEMENTS
- G05B23/00—Testing or monitoring of control systems or parts thereof
- G05B23/02—Electric testing or monitoring
Definitions
- the present invention relates to a plant or device abnormality diagnostic device.
- thermometers Many sensors such as thermometers, pressure gauges and flow meters are installed in power plants and related equipment for the purpose of monitoring and control.
- sensors such as acceleration sensors have been installed in infrastructure equipment such as bridges and roads to monitor the condition of the equipment.
- the feature of such sensor data is that there are multiple related sensor data and it is multidimensional time series data measured in a certain time cycle.
- Various methods have been proposed as condition monitoring methods that utilize such multidimensional time series data.
- Patent Document 1 As a technique using adaptive resonance theory, "it belongs to a category in which a plurality of measurement data from various sensors installed in a plant to be diagnosed are discriminated from normal data by adaptive resonance theory.
- a plant abnormality diagnosis device characterized by comprising an abnormality degree calculation unit for obtaining an abnormality degree of the entire plant to be diagnosed based on a difference in spatial distance between the data and the plurality of measurement data is disclosed. ..
- ART Adaptive Resonance Theory
- ART Adaptive Resonance Theory
- Patent Document 1 as shown in FIG. 1, an abnormality in equipment is detected based on operation data (diagnosis data) in which normal operation data (learning data) deviates from the classified category (normal category).
- diagnosis data normal operation data
- learning data learning data
- the degree of abnormality and the degree of abnormality contribution are calculated based on the difference between the normal data and the current measurement data.
- the degree of abnormality indicates the degree of abnormality in the data.
- the anomaly degree vector decomposed into the components of each measured value is defined as the anomaly contribution degree.
- the anomalous contribution indicates which signal has a large deviation from normal.
- FIG. 4 shows a situation in which new data m is measured in the vicinity in addition to the state in which the data k shown in FIGS. 2 and 3 is abnormal.
- the normal category closest to the data k is category 3, but the normal category closest to the data m is category 1.
- the values of the degree of anomaly of both data do not change significantly, but the degree of anomaly contribution changes significantly. That is, in the data k, the abnormal contribution of x2 was large, whereas in the data m, the abnormal contribution of the data x1 was large.
- the abnormality diagnosis device has "a category calculation unit that classifies the operation data output from a plurality of sensors provided in the diagnosis target into a plurality of categories, and a reference of the plurality of categories. It is provided with a data classification unit having a reference point calculation unit for calculating points, an abnormality degree calculation unit for comparing the reference point with the current operation data, and calculating the abnormality degree of the current operation data, and the reference point is , It is a weighted average of two or more categories out of a plurality of categories.
- the present invention has the above configuration, the anomaly contribution degree does not change significantly in the measurement data in the vicinity, and the accuracy of estimating the cause of the anomaly can be improved.
- the figure which shows the method of classifying the conventional data The figure which shows the example which calculated the degree of abnormality by the conventional method.
- the figure which shows the problem when the anomalous contribution degree is calculated by the conventional method.
- the figure which shows the structure of the Example of this invention The figure which shows the example of the operation data stored in the operation data database.
- the figure which shows the calculation method of the degree of abnormality of this invention The figure which shows an example of the trend graph of the classified category.
- the figure which shows the example which calculated the degree of abnormality by the conventional method using the test data The figure which shows the example which calculated the anomaly contribution degree by a conventional method using test data.
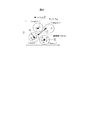
- FIG. 5 shows a configuration according to an embodiment of the present invention.
- This embodiment is an example in which the diagnostic apparatus of the present invention is used for abnormal diagnosis of a plant, and includes a plant 10, an operation data database 20, a data classification unit 30, a classification result database 40, and a display / operation unit 50.
- the outline of each component is described below.
- the target of abnormality diagnosis is not limited to plants, but can be applied to other devices and the like.
- Plant 10 is equipped with a sensor and is used for plant control and monitoring.
- sensors include, but are not limited to, flow meters, thermometers, pressure gauges, and the like.
- the operation data of the plant measured by the sensor of the plant 10 is stored as time-series data every minute, for example.
- the operation data designated as normal data by the display / operation unit 50 is cut out as learning data and sent to the data classification unit 30.
- the operation data database 20 also temporarily stores the data measured in real time by the plant 10, and then sends it to the data classification unit 30 as diagnostic data at regular intervals.
- the data classification unit 30 classifies multidimensional operation data into a plurality of categories by using an ART-based clustering algorithm (hereinafter referred to as improved ART).
- improved ART an ART-based clustering algorithm
- the input data is classified into multiple categories (clusters), and the classified category numbers are assigned to each input data.
- a category represents a group of data having similarities, and input data to which the same category number is assigned has a high degree of similarity.
- the operation data (learning data) in the normal state of the equipment is input to ART. Since ART classifies driving data (learning data) into multiple categories according to the similarity of data, it defines the category (normal category) to be generated when the driving data is normal.
- the driving data (diagnosis data) to be diagnosed is input to the ART that has learned the normal data.
- the data having a high degree of similarity to the learning data is classified into the same category as the learning phase.
- the tendency of the data changes, such as when some abnormality occurs in the equipment, it is classified into a category (new category) different from the training data.
- the data classification device 30 using the improved ART according to this embodiment outputs, as the data classification result, the category number in which the input multidimensional data is classified, the degree of abnormality, and the degree of abnormality contribution of each measurement data.
- the classification result database 40 manages the category number, the degree of anomaly, and the degree of anomaly contribution output from the data classification unit 30. In addition, the weighting coefficient that is the basis for selecting each category and the centroid data of the data classified into each category are saved.
- the display / operation unit 50 sets the conditions for learning data and diagnostic data.
- the operation data measured by the sensor of the plant 10 is determined to be learning data or diagnostic data based on this condition.
- the display / operation unit 50 displays a trend graph of the category number, the degree of abnormality, and the degree of abnormality contribution.
- the display / operation unit 50 may be configured such that the display unit and the operation unit are separated from each other.
- Plant 10 is composed of equipment and pipes, valves, etc. that connect it. Sensors such as flowmeters, thermometers, and pressure gauges are installed in the equipment and piping to monitor and control the condition of the plant. For example, in the case of a thermometer, these sensors are tagged with "TIC001". This tag becomes the ID of each sensor, and each sensor is identified by the ID.
- the operation data database 20 records the data measured by the sensor of the plant 10 as time series data.
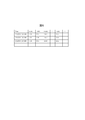
- An example of operation data is shown in FIG. As shown in FIG. 6, as the operation data for each hour measured by the sensor installed in the plant 10, the time when the operation data was measured is in the "Time” column, and "FIC001" and "PIC001" are in the other columns.
- the value measured by the sensor specified by the ID such as is recorded. This time interval can be arbitrarily specified, but in this embodiment, it is set to 1 minute.
- the data classification unit 30 classifies the operation data using the improved ART.
- the detailed configuration of the data classification unit 30 is shown in FIG.
- the data classification unit 30 includes a category calculation unit 31, a reference value calculation unit 32, an abnormality degree calculation unit 33, and an abnormality contribution calculation unit 34.
- the category calculation unit 31 classifies the driving data into categories according to the similarity of the driving data.
- the category in which driving data (learning data) is classified in the learning phase is regarded as a normal category. Since detailed algorithms for classifying into categories are described in Non-Patent Document 1 and Patent Document 1, description thereof will be omitted here.
- the reference point calculation unit 32 calculates a reference point for calculating the degree of abnormality.
- the degree of abnormality is calculated based on the deviation information between the reference point and the current operation data (diagnostic data).
- a method of calculating the degree of abnormality according to the present invention will be described with reference to FIG. In the present embodiment, it is calculated by equation (1) the weighted average g a of the center of gravity of the normal range as a reference point.
- g i is the normal categories j of the centroid vector (coordinates)
- d i (k) is the distance from g i to the current measurement data k
- f (x) is a monotonous decrease function of x, and in this embodiment, the sigmoid function of Eq. (2) was used as an example.
- Equation (2) the distance in accordance with the d i (k) is increased, f (d i (k)) becomes smaller. That is, the coefficient of the weighted average ga a becomes large in the normal category close to the measurement data m, and becomes small in the category far away.
- the sigmoid function used in Eq. (2) is a function whose value gradually approaches zero as x increases, the coefficient of the category with a large distance d i (k) approaches zero, which affects the calculation of the reference point. Do not give.
- the reference point obtained by the equation (1) is the average value of the center of gravity of the category close to the measurement data among the coordinates of the center of gravity of each category.
- the abnormality degree calculation unit 33 obtains the abnormality degree of the current measurement data k from the coordinates of the reference point obtained by the reference point calculation unit 32 and the coordinates of the current measurement data k.
- the degree of anomaly is defined by the distance between the two, and the magnitude of the degree of anomaly vector d a (k) in Eq. (3) is the degree of anomaly.
- the anomaly contribution calculation unit 34 obtains the anomaly contribution R i of the parameter i by the following equation (4), where each component of the anomaly vector d a (k) obtained by the anomaly calculation unit 33 is x i .
- the classification result database 40 stores the category number, abnormality degree, and abnormality contribution degree of each data obtained by the data classification unit 30.
- the display / operation unit 50 displays the data stored in the classification result database 40 and the operation data stored in the operation data database 20.
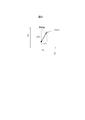
- the trend graph of the category classified in FIG. 9 is shown. It can be seen that the category changes with time and the state of the plant changes.
- categories 1 to 3 are normal categories, and category 4 is a new category.
- FIG. 10 shows a display example of the degree of abnormality and the degree of contribution to abnormality at the same time as in FIG. What is shown by the black line is the degree of abnormality. Since the anomalous contribution is calculated by the equation (4), the sum of the anomalous contributions of each parameter is the anomaly.
- the parameter is two examples, an abnormal contribution R 1 and parameter x 2 abnormality contribution R 2 a total error probability parameters x 1. Comparing FIGS. 9 and 10, it can be seen that the degree of abnormality increases from the time when the category becomes category 4, which is a new category.
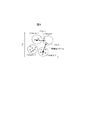
- FIG. 11 shows two-dimensional test data. There were 50 training data, and as a result of classification by ART, they were classified into 9 categories. The points shown in ⁇ indicate the center of gravity of each category. There are 31 points of diagnostic data, and at the time of diagnosis, the data were input in order from left to right.
- the results of determining the degree of anomaly and the degree of anomaly contribution by the conventional algorithm are shown in FIGS. 12 and 13.
- the anomaly degree shown in FIG. 12 does not change smoothly at the time of 7 minutes and 21 minutes, but there is no discontinuity, and there is no big problem in calculating the anomaly degree even with the conventional algorithm. You can see that.
- the anomalous contribution shown in FIG. 13 the anomalous contribution of the center of gravity of the closest normal category changes discontinuously at 7 minutes. If the anomalous contribution changes discontinuously due to changes in the closest normal category, it may be misjudged to estimate the cause of the anomaly using this data.
- FIGS. 14 and 15 show the results of determining the degree of anomaly and the degree of anomaly contribution by the algorithm of the present invention. Compared with the case of using the conventional algorithm, the tendency of the degree of anomaly does not change much, but it can be seen that there is no discontinuous change in the graph of the degree of anomaly contribution.
- the abnormality diagnosis device of the present invention by using the abnormality diagnosis device of the present invention, the phenomenon that the abnormality contribution degree changes significantly even though the measurement data are close to each other is solved. That is, the accuracy when estimating the cause of an abnormality using the degree of anomaly contribution is improved.
- ART is used as the data clustering technique, but other clustering techniques may be used.
- sigmoid function was used as f (x), another function such as 1 / x may be used.
Landscapes
- Physics & Mathematics (AREA)
- General Physics & Mathematics (AREA)
- Engineering & Computer Science (AREA)
- Automation & Control Theory (AREA)
- Testing And Monitoring For Control Systems (AREA)
Abstract
Dans le cas de dispositifs de diagnostic d'anomalie de la technique antérieure, des taux de contribution d'anomalie pour identifier des causes d'anomalies varient parfois significativement même si les données ne varient pas significativement. Un dispositif de diagnostic d'anomalie est caractérisé en ce qu'il est pourvu d'une unité de classification de données qui comprend : une unité de calcul de catégorie qui classe une sortie de données d'opération provenant d'une pluralité de capteurs fournis pour un objet à diagnostiquer, en une pluralité de catégories ; une unité de calcul de point de référence qui calcule un point de référence pour la pluralité de catégories ; et une unité de calcul de degré d'anomalie qui compare le point de référence aux données de fonctionnement actuelles et calcule le degré d'anomalie des données de fonctionnement actuelles. Le dispositif de diagnostic d'anomalie est également caractérisé en ce que le point de référence est une moyenne pondérée d'au moins deux catégories de la pluralité de catégories.
Priority Applications (1)
| Application Number | Priority Date | Filing Date | Title |
|---|---|---|---|
| CN201980067454.1A CN112912807A (zh) | 2019-03-13 | 2019-11-06 | 异常诊断装置 |
Applications Claiming Priority (2)
| Application Number | Priority Date | Filing Date | Title |
|---|---|---|---|
| JP2019045371A JP7233258B2 (ja) | 2019-03-13 | 2019-03-13 | 異常診断装置 |
| JP2019-045371 | 2019-03-13 |
Publications (1)
| Publication Number | Publication Date |
|---|---|
| WO2020183781A1 true WO2020183781A1 (fr) | 2020-09-17 |
Family
ID=72427429
Family Applications (1)
| Application Number | Title | Priority Date | Filing Date |
|---|---|---|---|
| PCT/JP2019/043475 Ceased WO2020183781A1 (fr) | 2019-03-13 | 2019-11-06 | Dispositif de diagnostic d'anomalie |
Country Status (3)
| Country | Link |
|---|---|
| JP (1) | JP7233258B2 (fr) |
| CN (1) | CN112912807A (fr) |
| WO (1) | WO2020183781A1 (fr) |
Cited By (1)
| Publication number | Priority date | Publication date | Assignee | Title |
|---|---|---|---|---|
| TWI768606B (zh) * | 2020-12-18 | 2022-06-21 | 日月光半導體製造股份有限公司 | 感測器監測系統及方法 |
Families Citing this family (2)
| Publication number | Priority date | Publication date | Assignee | Title |
|---|---|---|---|---|
| CN116448468A (zh) * | 2022-01-07 | 2023-07-18 | 泰科电子(上海)有限公司 | 人工智能诊断系统 |
| JP7722253B2 (ja) * | 2022-04-27 | 2025-08-13 | 横河電機株式会社 | 情報処理装置、要因分析方法及び要因分析プログラム |
Citations (3)
| Publication number | Priority date | Publication date | Assignee | Title |
|---|---|---|---|---|
| JPH05322642A (ja) * | 1992-05-22 | 1993-12-07 | Hitachi Ltd | 回転機器異常診断装置 |
| WO2018051568A1 (fr) * | 2016-09-15 | 2018-03-22 | 株式会社日立製作所 | Dispositif et système de diagnostic d'anomalie d'installation |
| JP2018159981A (ja) * | 2017-03-22 | 2018-10-11 | オムロン株式会社 | 制御システム、制御装置、制御プログラム、および制御方法 |
Family Cites Families (4)
| Publication number | Priority date | Publication date | Assignee | Title |
|---|---|---|---|---|
| US7933828B2 (en) * | 2005-07-26 | 2011-04-26 | Cfph, Llc | System and method for displaying and/or analyzing a limit order book |
| JP4832609B1 (ja) * | 2011-06-22 | 2011-12-07 | 株式会社日立エンジニアリング・アンド・サービス | 異常予兆診断装置および異常予兆診断方法 |
| JP6830414B2 (ja) * | 2017-06-28 | 2021-02-17 | 株式会社日立製作所 | 診断装置及び診断方法 |
| CN107506463B (zh) * | 2017-08-30 | 2020-08-18 | 宁波城市职业技术学院 | 一种数据分类和处理方法及设备 |
-
2019
- 2019-03-13 JP JP2019045371A patent/JP7233258B2/ja active Active
- 2019-11-06 CN CN201980067454.1A patent/CN112912807A/zh active Pending
- 2019-11-06 WO PCT/JP2019/043475 patent/WO2020183781A1/fr not_active Ceased
Patent Citations (3)
| Publication number | Priority date | Publication date | Assignee | Title |
|---|---|---|---|---|
| JPH05322642A (ja) * | 1992-05-22 | 1993-12-07 | Hitachi Ltd | 回転機器異常診断装置 |
| WO2018051568A1 (fr) * | 2016-09-15 | 2018-03-22 | 株式会社日立製作所 | Dispositif et système de diagnostic d'anomalie d'installation |
| JP2018159981A (ja) * | 2017-03-22 | 2018-10-11 | オムロン株式会社 | 制御システム、制御装置、制御プログラム、および制御方法 |
Cited By (1)
| Publication number | Priority date | Publication date | Assignee | Title |
|---|---|---|---|---|
| TWI768606B (zh) * | 2020-12-18 | 2022-06-21 | 日月光半導體製造股份有限公司 | 感測器監測系統及方法 |
Also Published As
| Publication number | Publication date |
|---|---|
| JP2020149259A (ja) | 2020-09-17 |
| CN112912807A (zh) | 2021-06-04 |
| JP7233258B2 (ja) | 2023-03-06 |
Similar Documents
| Publication | Publication Date | Title |
|---|---|---|
| CA2433941C (fr) | Modelisation adaptative des etats modifies dans la surveillance predictive des conditions | |
| US9122273B2 (en) | Failure cause diagnosis system and method | |
| US6859739B2 (en) | Global state change indicator for empirical modeling in condition based monitoring | |
| US20210397175A1 (en) | Abnormality detection device, abnormality detection method, and program | |
| Sun et al. | An improved k-nearest neighbours method for traffic time series imputation | |
| US10884404B2 (en) | Method of predicting plant data and apparatus using the same | |
| JP6482817B2 (ja) | プラント監視支援システム及びプラント監視支援方法 | |
| EP2081132A2 (fr) | Détection de nouveautés | |
| Tang et al. | Autoregressive model-based structural damage identification and localization using convolutional neural networks | |
| CN112836719B (zh) | 一种融合二分类和三元组的示功图相似性检测方法 | |
| Zhang et al. | Structural Vibration Data Anomaly Detection Based on Multiple Feature Information Using CNN‐LSTM Model | |
| JP6674033B2 (ja) | プラント異常診断装置及びプラント異常診断システム | |
| Li et al. | Structural health monitoring data anomaly detection by transformer enhanced densely connected neural networks | |
| WO2020183781A1 (fr) | Dispositif de diagnostic d'anomalie | |
| CN118551330B (zh) | 基于机器学习的深冷储氢罐故障诊断系统 | |
| CN113287104A (zh) | 数据分类装置 | |
| CN112949735A (zh) | 一种基于离群数据挖掘的液态危化品挥发浓度异常发现方法 | |
| KR101997580B1 (ko) | 상관도를 고려한 데이터 분류 방법 및 이 방법을 수행하기 위한 프로그램이 저장된 컴퓨터 판독가능한 저장매체 | |
| CN120086747A (zh) | 一种闸门故障检测方法及系统 | |
| CN120145168A (zh) | 基于ndir技术的智能化多气体数据检测系统及方法 | |
| CN119785534A (zh) | 一种基于大数据的水位序列数据监测与预警方法 | |
| Lee et al. | Deep learning-based anomaly detection in acceleration data of long-span cable-stayed bridges | |
| JP6951202B2 (ja) | データ分類装置 | |
| Sakib et al. | SRDI: Synergistic distance-based approaches for supervised statistical pattern recognition in structural health monitoring | |
| CN120541585B (zh) | 一种油井施工的安全监测方法及监测系统 |
Legal Events
| Date | Code | Title | Description |
|---|---|---|---|
| 121 | Ep: the epo has been informed by wipo that ep was designated in this application |
Ref document number: 19919170 Country of ref document: EP Kind code of ref document: A1 |
|
| NENP | Non-entry into the national phase |
Ref country code: DE |
|
| 122 | Ep: pct application non-entry in european phase |
Ref document number: 19919170 Country of ref document: EP Kind code of ref document: A1 |