WO2024257872A1 - 遺伝子導入率予測方法 - Google Patents
遺伝子導入率予測方法 Download PDFInfo
- Publication number
- WO2024257872A1 WO2024257872A1 PCT/JP2024/021754 JP2024021754W WO2024257872A1 WO 2024257872 A1 WO2024257872 A1 WO 2024257872A1 JP 2024021754 W JP2024021754 W JP 2024021754W WO 2024257872 A1 WO2024257872 A1 WO 2024257872A1
- Authority
- WO
- WIPO (PCT)
- Prior art keywords
- acid
- cells
- gene
- car
- cell
- Prior art date
- Legal status (The legal status is an assumption and is not a legal conclusion. Google has not performed a legal analysis and makes no representation as to the accuracy of the status listed.)
- Ceased
Links
Images








Classifications
-
- C—CHEMISTRY; METALLURGY
- C07—ORGANIC CHEMISTRY
- C07K—PEPTIDES
- C07K14/00—Peptides having more than 20 amino acids; Gastrins; Somatostatins; Melanotropins; Derivatives thereof
- C07K14/435—Peptides having more than 20 amino acids; Gastrins; Somatostatins; Melanotropins; Derivatives thereof from animals; from humans
-
- C—CHEMISTRY; METALLURGY
- C07—ORGANIC CHEMISTRY
- C07K—PEPTIDES
- C07K16/00—Immunoglobulins [IG], e.g. monoclonal or polyclonal antibodies
-
- C—CHEMISTRY; METALLURGY
- C12—BIOCHEMISTRY; BEER; SPIRITS; WINE; VINEGAR; MICROBIOLOGY; ENZYMOLOGY; MUTATION OR GENETIC ENGINEERING
- C12N—MICROORGANISMS OR ENZYMES; COMPOSITIONS THEREOF; PROPAGATING, PRESERVING, OR MAINTAINING MICROORGANISMS; MUTATION OR GENETIC ENGINEERING; CULTURE MEDIA
- C12N15/00—Mutation or genetic engineering; DNA or RNA concerning genetic engineering, vectors, e.g. plasmids, or their isolation, preparation or purification; Use of hosts therefor
- C12N15/09—Recombinant DNA-technology
- C12N15/11—DNA or RNA fragments; Modified forms thereof; Non-coding nucleic acids having a biological activity
- C12N15/62—DNA sequences coding for fusion proteins
-
- C—CHEMISTRY; METALLURGY
- C12—BIOCHEMISTRY; BEER; SPIRITS; WINE; VINEGAR; MICROBIOLOGY; ENZYMOLOGY; MUTATION OR GENETIC ENGINEERING
- C12N—MICROORGANISMS OR ENZYMES; COMPOSITIONS THEREOF; PROPAGATING, PRESERVING, OR MAINTAINING MICROORGANISMS; MUTATION OR GENETIC ENGINEERING; CULTURE MEDIA
- C12N5/00—Undifferentiated human, animal or plant cells, e.g. cell lines; Tissues; Cultivation or maintenance thereof; Culture media therefor
- C12N5/06—Animal cells or tissues; Human cells or tissues
-
- C—CHEMISTRY; METALLURGY
- C12—BIOCHEMISTRY; BEER; SPIRITS; WINE; VINEGAR; MICROBIOLOGY; ENZYMOLOGY; MUTATION OR GENETIC ENGINEERING
- C12N—MICROORGANISMS OR ENZYMES; COMPOSITIONS THEREOF; PROPAGATING, PRESERVING, OR MAINTAINING MICROORGANISMS; MUTATION OR GENETIC ENGINEERING; CULTURE MEDIA
- C12N5/00—Undifferentiated human, animal or plant cells, e.g. cell lines; Tissues; Cultivation or maintenance thereof; Culture media therefor
- C12N5/10—Cells modified by introduction of foreign genetic material
-
- C—CHEMISTRY; METALLURGY
- C12—BIOCHEMISTRY; BEER; SPIRITS; WINE; VINEGAR; MICROBIOLOGY; ENZYMOLOGY; MUTATION OR GENETIC ENGINEERING
- C12Q—MEASURING OR TESTING PROCESSES INVOLVING ENZYMES, NUCLEIC ACIDS OR MICROORGANISMS; COMPOSITIONS OR TEST PAPERS THEREFOR; PROCESSES OF PREPARING SUCH COMPOSITIONS; CONDITION-RESPONSIVE CONTROL IN MICROBIOLOGICAL OR ENZYMOLOGICAL PROCESSES
- C12Q1/00—Measuring or testing processes involving enzymes, nucleic acids or microorganisms; Compositions therefor; Processes of preparing such compositions
- C12Q1/02—Measuring or testing processes involving enzymes, nucleic acids or microorganisms; Compositions therefor; Processes of preparing such compositions involving viable microorganisms
- C12Q1/04—Determining presence or kind of microorganism; Use of selective media for testing antibiotics or bacteriocides; Compositions containing a chemical indicator therefor
- C12Q1/06—Quantitative determination
-
- C—CHEMISTRY; METALLURGY
- C12—BIOCHEMISTRY; BEER; SPIRITS; WINE; VINEGAR; MICROBIOLOGY; ENZYMOLOGY; MUTATION OR GENETIC ENGINEERING
- C12Q—MEASURING OR TESTING PROCESSES INVOLVING ENZYMES, NUCLEIC ACIDS OR MICROORGANISMS; COMPOSITIONS OR TEST PAPERS THEREFOR; PROCESSES OF PREPARING SUCH COMPOSITIONS; CONDITION-RESPONSIVE CONTROL IN MICROBIOLOGICAL OR ENZYMOLOGICAL PROCESSES
- C12Q1/00—Measuring or testing processes involving enzymes, nucleic acids or microorganisms; Compositions therefor; Processes of preparing such compositions
- C12Q1/68—Measuring or testing processes involving enzymes, nucleic acids or microorganisms; Compositions therefor; Processes of preparing such compositions involving nucleic acids
-
- G—PHYSICS
- G01—MEASURING; TESTING
- G01N—INVESTIGATING OR ANALYSING MATERIALS BY DETERMINING THEIR CHEMICAL OR PHYSICAL PROPERTIES
- G01N33/00—Investigating or analysing materials by specific methods not covered by groups G01N1/00 - G01N31/00
- G01N33/48—Biological material, e.g. blood, urine; Haemocytometers
- G01N33/50—Chemical analysis of biological material, e.g. blood, urine; Testing involving biospecific ligand binding methods; Immunological testing
Definitions
- the present invention relates to a method for predicting a gene transfer rate and/or the number of gene-transferred cells.
- Non-Patent Document 1 reports that CAR-T cells were measured using flow cytometry.
- Cytometry Part B Clinical Cytometry, Volume 100, Issue 2, p. 218-224
- the present invention aims to provide a method for predicting the gene transfer rate and/or the number of gene-transferred cells, which enables the measurement of the gene transfer rate and/or the number of gene-transferred cells in a simpler and more efficient manner than conventional methods.
- the inventors discovered that there are differences in the components of the culture supernatant between transfected and non-transfected cells, and discovered that by analyzing the medium in which the cells are cultured and using the medium components (e.g., metabolites in the medium, pH, extracellular vesicles) as indicators, it is possible to simply and efficiently predict the gene transfer rate and/or the number of transfected cells in animal cells.
- the medium components e.g., metabolites in the medium, pH, extracellular vesicles
- the present invention was completed based on these findings and through further investigation, and provides the following method for predicting the gene transfer rate and/or the number of gene-transferred cells in animal cells.
- a method for predicting a gene transfer rate and/or a number of gene-transferred cells in an animal cell comprising the steps of: A method comprising: (1) measuring components of a culture supernatant in which genetically-introduced animal cells have been cultured; and (2) predicting the gene introduction rate and/or the number of genetically-introduced cells based on the values measured in step (1).
- a method comprising: (1) measuring components of a culture supernatant in which genetically-introduced animal cells have been cultured; and (2) predicting the gene introduction rate and/or the number of genetically-introduced cells based on the values measured in step (1).
- the metabolite is at least one selected from the group consisting of organic acids, sugars, lipids, vitamins, amines, nucleic acids, amino acids and other metabolite ions.
- the organic acid is at least one selected from the group consisting of decenoic acid, dodecenoic acid, myristoleic acid, palmitic acid, palmitoleic acid, hexadecadienoic acid, stearic acid, oleic acid, linoleic acid, ⁇ -linolenic acid, ⁇ -linolenic acid, arachidic acid, eicosenoic acid, eicosadienoic acid, mead acid, arachidonic acid, docosapentaenoic acid, docosahexaenoic acid, nervonic acid, 2-hydroxyvaleric acid, 2-oxoglutaric acid, indoxyl s
- [5] The method according to [3] or [4], wherein the sugar is at least one selected from the group consisting of fructose, inositol, galactose, glucose, and sucrose.
- the lipid is at least one selected from the group consisting of ceramide, Hex2-ceramide, Hex-ceramide, cholesterol, cholesterol sulfate, cardiolipin, monoglycerol, lysophosphatidylcholine, lysophosphatidylethanolamine, phosphatidic acid, phosphatidylcholine, phosphatidylethanolamine, phosphatidylglycerol, phosphatidylinositol, phosphatidylserine, sphingomyelin, dihydrosphingomyelin, triglyceride, glycerol-3-phosphate, and ganglioside GM3.
- amino acid is at least one selected from the group consisting of acylcarnitine, alanine, arginine, asparagine, aspartic acid, ⁇ -alanine, cysteine, cysteine-HPE-AM, cysteine-SS-HPE-AM, dimethylglycine, glutamic acid, glutamine, glycine, isoleucine, leucine, leucine acid, lysine, methionine, homocysteine-HPE-AM, N-acetyl- ⁇ -alanine, N-acetylcysteine, N-acetylserine, N-acetyltryptophan, N-carbamoyl-aspartate, O-acetylserine, ornithine, pyroglutamic acid, phenylalanine, proline, serine, S-sulfocysteine, taurine
- a method for producing a gene-introduced cell preparation comprising the steps of measuring components of a culture supernatant in which animal cells are cultured, and determining the gene introducion rate and/or the number of gene-introduced cells based on the measured values.
- the method for predicting the gene introduction rate and/or the number of gene-introduced cells of the present invention does not require complicated steps compared to conventional methods, and allows the gene introduction rate and/or the number of gene-introduced cells to be measured with simple operations (e.g., the only operation required is automatic measurement using a measuring device). Furthermore, the method for predicting the gene introduction rate and/or the number of gene-introduced cells of the present invention allows the gene introduction rate of cells to be measured efficiently (e.g., in a short time of less than 5 minutes). In addition, since the culture supernatant is used, cell sampling is not required, so there is no stirring process and damage to the cells is minimal.
- the CAR introduction rate and the number of introduced cells can be grasped easily and quickly without damaging the cells, making it possible to confirm whether a product that meets the standards has been manufactured.
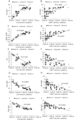
- Example 1 shows the results of Example 1.
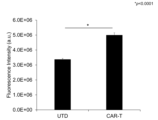
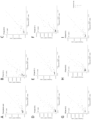
- Fig. 1 shows the results of Example 1. Graph showing each component in the supernatant after culture of control T cells (UTD) not transfected with a gene and CAR-T cells transfected with a CAR gene.
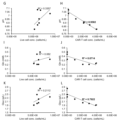
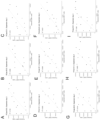
- Figure 4 shows the results of Example 4. Graphs showing the correlation between each component in the culture supernatant on the final day of culture and cell density or CAR-introduced T cell (CAR-T) density (C-D: lactic acid, E-F: ammonium ion). Figure 4 shows the results of Example 4. Graphs showing the correlation between each component in the culture supernatant on the final day of culture and cell density or CAR-introduced T cell (CAR-T) density (GH: pH, I-J: glutamine, K-L: glucose). Fig. 4 shows the results of Example 4.
- CAR-T CAR-introduced T cell
- Fig. 6 shows the results of Example 5.
- Fig. 6 is a graph showing (A) cell density and (B) CAR introduction efficiency at each date during the amplification step.
- Figure 5 shows the results of Example 5.
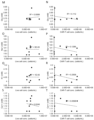
- Example 6 Graph showing the correlation between each component in the culture supernatant and cell density or CAR-T cell density throughout the entire period of the amplification process (A-B: lactate, C-D: ammonium ion, E-F: pH, G-H: glutamine, I-J: glucose). This shows the results of Example 6.
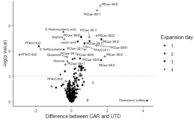
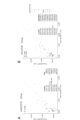
- This graph uses a volcano plot to show the differences in components in the supernatant between UTD and CAR-T cells.
- the horizontal axis shows the estimated amount of change under conditions with the highest CAR introduction efficiency, obtained by performing a Williams test on the difference in the amount of each component between UTD and CAR-T cells.
- the left side shows the components that decreased in CAR-T cells, and the right side shows the components that increased in CAR-T cells.
- the vertical axis also shows the -Log(p value) of the Williams test on the difference in the amount of each component at each date during the amplification process.
- Fig. 7 shows the results of Example 7.
- Fig. 7 shows the results of Example 7.
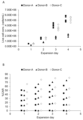
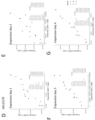
- A-C Graphs showing prediction of the number of CAR-T cells (cells/mL) by LASSO regression analysis from components in the culture supernatant at each date during the amplification process.
- Fig. 7 shows the results of Example 7.
- Figure showing the results of Example 7. Graph showing prediction of CAR-T cell count (cells/mL) by simple regression analysis from components in the culture supernatant during the entire amplification process.
- FIG. 7 shows the results of Example 7.
- Fig. 1 shows the results of Example 8.
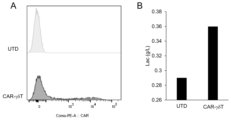
- Graphs showing (A) CAR transfection efficiency and (B) lactic acid in the supernatant after culture of non-gene-transfected control SK-HEP-1 cells (UTD) and CAR gene-transfected SK-HEP-1 cells (N 4, *p ⁇ 0.05, p value analyzed by t-test).
- Fig. 13 shows the results of Example 9.
- Fig. 1 shows the results of Example 10.
- Fig. 11 shows the results of Example 11.
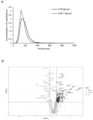
- A Graph showing the particle size of exosomes in the supernatants of UTD and CAR-T cells
- C A table showing proteins whose expression levels are predominantly changed in UTD and exosomes derived from CAR-T cells.
- Fig. 1 shows the results of Example 11.
- D Graph showing the correlation between the number of CAR-T cells and CD63-positive exosomes.
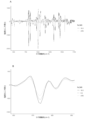
- Fig. 12 shows the results of Example 12.
- A shows an example of the entire second derivative of the Raman spectroscopy spectrum obtained for the UTD and the culture supernatant of CAR-T cells
- B shows an example of a peak that has a difference.
- Comprise(s) means the inclusion, but not the limitation, of the elements that follow the phrase. Thus, it indicates the inclusion of the elements that follow the phrase, but not the exclusion of any other elements.
- Consist(s) of means the inclusion, and the limitation, of any elements that follow the phrase. Thus, the phrase “consisting of” indicates that the recited elements are required or essential, and that other elements are substantially absent.
- Consist(s) essentially of means the inclusion, and the limitation, of any elements that follow the phrase, and that other elements do not affect the activity or function of the element identified in this disclosure. Thus, the phrase “consisting essentially of” indicates that the recited elements are required or essential, but that other elements are optional and may or may not be present depending on whether they affect the activity or function of the recited elements.
- pluripotent stem cells refers to embryonic stem cells (ES cells) and cells that have the same differentiation pluripotency, i.e., the potential ability to differentiate into various tissues of the body (all of the endoderm, mesoderm, and ectoderm).
- Cells that have the same differentiation pluripotency as ES cells include "induced pluripotent stem cells” (sometimes referred to as “iPS cells” in this specification).
- iPS cells induced pluripotent stem cells
- the pluripotent stem cells are ES cells or any cells derived from a human embryo, the cells may be cells produced by destroying an embryo or cells produced without destroying an embryo, and are preferably cells produced without destroying an embryo.
- a “cell population” refers to two or more cells of the same or different types.
- a “cell population” also refers to a mass of cells of the same or different types.
- culture refers to maintaining and/or growing cells in an in vitro environment.
- “Culturing” refers to sustaining and/or growing cells outside a tissue or outside the body, for example in a cell culture dish or flask.
- the present invention provides a method for predicting the gene introduction rate and/or the number of gene-introduced cells in animal cells, comprising: (1) a step of measuring components of a culture supernatant in which gene-introduced animal cells have been cultured; and (2) a step of predicting the gene introduction rate and/or the number of gene-introduced cells based on the values measured in step (1).
- the "gene transfer rate” refers to the rate of transfer of a nucleic acid into a cell, and is, for example, the proportion of cells into which a nucleic acid has been transferred among all cells, the amount of nucleic acid taken up in a cell population, or the expression rate of a transferred gene in a whole cell population.
- the transferred gene is a CAR, it may also be referred to as the CAR positive rate.
- the "number of gene-transduced cells” refers to the number of cells into which a gene has been introduced in a cell population.
- the transduced gene is CAR, it may also be referred to as the number of CAR-positive cells.
- the term "and/or" in the "method for predicting the gene transfer rate and/or the number of gene-transferred cells in animal cells" of the present invention means that the prediction method of the present invention is a method for predicting both the gene transfer rate and the number of gene-transferred cells, or a method for measuring either one of them. More preferably, it is a method for predicting the number of gene-transferred cells.
- Step (1) components of the culture supernatant in which gene-transfected animal cells have been cultured are measured.
- animal cell is not particularly limited, and various animal cells can be widely used.
- animal cell types include spleen cells, nerve cells, glial cells, pancreatic ⁇ cells, bone marrow cells, mesangial cells, Langerhans cells, epidermal cells, epithelial cells, endothelial cells, fibroblasts, fibrocytes, muscle cells (e.g., skeletal muscle cells, cardiac muscle cells, myoblasts, muscle satellite cells), adipocytes, immune cells (e.g., macrophages, T cells, B cells, natural killer cells (NK cells), mast cells, neutrophils, basophils, eosinophils, monocytes, megakaryocytes), synovial cells, chondrocytes, bone cells, osteoblasts, osteoclasts, mammary gland cells, hepatocytes, interstitial cells, egg cells, and sperm cells, as well as stem cells that can be induced to differentiate into these cells (including pluripotent stem cells such as neural
- T cells include ⁇ T cells, ⁇ T cells, helper T cells, cytotoxic T cells, regulatory T cells, suppressor T cells, tumor-infiltrating T cells, memory T cells, naive T cells, NKT cells, TCR-T cells, STAR receptor T cells, CAR-T cells (e.g., CAR- ⁇ T cells, CAR-gdT cells), etc.
- animal cells also include the above cells produced by inducing differentiation in vitro of primary cells, the above stem cells (e.g., iPS cells), etc.
- animal cells also include various types of cancer cells. Animal cells may include only one type, or two or more types.
- the organism from which the animal cells are derived is not particularly limited, and examples of such organisms include mammals, such as humans, mice, rats, cows, horses, pigs, rabbits, dogs, cats, goats, monkeys, and chimpanzees. Among these, humans are preferred.
- Animal cells are animal cells into which a foreign gene has been introduced.
- An “exogenous gene” is a gene or monomeric nucleotide that is introduced from the outside in order to cause an animal cell to express a desired protein, and can be selected appropriately depending on the use of the animal cell.
- animal cells into which a gene has been introduced includes both animal cells into which a gene has actually been introduced in an attempt to introduce a gene, and animal cells into which no gene has been introduced.
- (animal) cells into which a gene has been introduced” means (animal) cells into which a gene has actually been introduced.
- Cells into which a gene has been introduced and “cells into which a gene has been introduced” can be used interchangeably depending on the context.
- the foreign gene may be, for example, a gene for expressing a CAR (chimeric antigen receptor).
- the foreign gene may be, for example, a gene for expressing a CAR and a gene for expressing a cytokine and/or a chemokine.
- a CAR expressed by an animal cell is basically, like a general or known CAR, composed of peptides at each of the following sites linked via a spacer as necessary: (i) an antigen recognition site (e.g., a single-chain antibody, a ligand, a peptide, etc.) that recognizes a cell surface antigen of a cancer cell; (ii) a cell membrane-spanning domain; and (iii) a signal transduction domain that induces T cell activation.
- an antigen recognition site e.g., a single-chain antibody, a ligand, a peptide, etc.
- TCR T cell receptor
- STAR synthetic T cell receptor and antigen receptor
- chimeric TAC T cell antigen coupler
- suicide genes iCas9, HSV-TK, etc.
- cytokines interleukins, chemokines, etc.
- T cell activation inhibitors molecules that suppress the expression of immune checkpoint factors (CTLA-4, PD-1, TIM-3, LAG-3, TGIT, BTLA, VISTA (PD-1H), etc.), CD160, Cbl-b, endogenous TCR, etc.
- T cell activation promoters CD28, ICOS, CD137, 0X40, CD27, GITR, BAFFR, TACI, BMCA, CD40L, etc.
- the expression vector may be linear or circular, and may be a non-viral vector such as a plasmid, a viral vector, or a transposon-based vector.
- the technique for introducing the expression vector into the animal cell can be an appropriate one depending on the embodiment.
- the expression vector can be introduced into the animal cell by known methods such as the viral infection method, the calcium phosphate method, the lipofection method, the microinjection method, and the electroporation method.
- the expression vector can be prepared in a form suitable for use in each technique by known means or, as appropriate, using a commercially available kit (following the instructions for the kit).
- the expression vector can be introduced into animal cells by viral infection.
- viral vectors include retroviral vectors, lentiviral vectors, adenoviral vectors, and adeno-associated viral vectors.
- retroviral vectors When using these viral vectors, a vector containing the desired foreign gene and the packaging vector (plasmid) of each virus are transfected into host cells using a corresponding commercially available kit to produce a recombinant virus, and then the resulting recombinant virus is used to infect animal cells.
- all of the foreign genes may be contained in one expression vector, all of the foreign genes may be contained in separate expression vectors, or some of the multiple foreign genes may be contained in one expression vector and the rest may be contained in separate expression vectors.
- multiple foreign genes are contained in one expression vector, there is no particular limitation on the order in which the foreign genes are arranged from upstream to downstream.
- the foreign gene can be composed of a nucleic acid (polynucleotide) having a base sequence that codes for the amino acid sequence of the desired protein or polypeptide.
- a person skilled in the art can design and prepare an expression vector that can express the desired protein (polypeptide) in an animal cell.
- the nucleic acid contained in the expression vector can be prepared by a chemical DNA synthesis reaction, or can be prepared as cDNA (cloned).
- the expression vector may contain sequences such as a promoter, terminator, enhancer, initiation codon, termination codon, polyadenylation signal, nuclear localization signal (NLS), multiple cloning site (MCS), etc., as necessary.
- the expression vector may further include nucleic acids (base sequences) encoding "functional genes" such as reporter genes (e.g., genes encoding fluorescent proteins of various colors), drug selection genes (e.g., kanamycin resistance genes, ampicillin resistance genes, puromycin resistance genes), and suicide genes (e.g., genes encoding diphtheria A toxin, herpes simplex thymidine kinase (HSV-TK), carboxypeptidase G2 (CPG2), carboxylesterase (CA), cytosine deaminase (CD), cytochrome P450 (cyt-450), deoxycytidine kinase (dCK), nitroreductase (NR), purine nucleoside phosphorylase (PNP), thymidine phosphorylase (TP), varicella zoster virus thymidine kinase (VZV-TK), xanthine-guanine phosphoribosyltransfera
- Nucleic acid refers to any molecule formed by polymerizing monomeric nucleotides or nucleotides and molecules having equivalent functions to the nucleotides, such as RNA, which is a polymer of ribonucleotides, DNA, which is a polymer of deoxyribonucleotides, a mixed polymer of ribonucleotides and deoxyribonucleotides, and a nucleotide polymer containing a nucleotide analogue, and may also be a nucleotide polymer containing a nucleic acid derivative.
- the nucleic acid may be a single-stranded nucleic acid or a double-stranded nucleic acid. Double-stranded nucleic acids also include double-stranded nucleic acids in which one strand hybridizes to the other strand under stringent conditions.
- Nucleotide analogues may be any molecule that is a ribonucleotide, deoxyribonucleotide, RNA or DNA modified to improve or stabilize nuclease resistance, increase affinity with complementary nucleic acid strands, increase cell permeability or to make it visible, as compared to RNA or DNA.
- Nucleotide analogues may be naturally occurring or non-naturally occurring molecules, such as sugar-modified nucleotide analogues (e.g., nucleotide analogues substituted with 2'-O-methylribose, nucleotide analogues substituted with 2'-O-propylribose, nucleotide analogues substituted with 2'-methoxyethoxyribose, nucleotide analogues substituted with 2'-O-methoxyethylribose, nucleotide analogues substituted with 2'-O-[2-(guanidinium)ethyl]ribose, nucleotide analogues substituted with 2'-fluororibose, bridged structure-type artificial nucleotide analogues, etc.
- sugar-modified nucleotide analogues e.g., nucleotide analogues substituted with
- nucleic acids BNA: Bridged Nucleic Acid
- locked artificial nucleic acid LNA: Locked Nucleic Acid
- ethylene bridged artificial nucleic acid ENA: Ethylene bridged nucleic acid acid
- PNA peptide nucleic acid
- OPNA oxypeptide nucleic acid
- PRNA peptide ribonucleic acid
- nucleotide analogues modified with phosphodiester bonds e.g. nucleotide analogues substituted with phosphorothioate bonds, nucleotide analogues substituted with N3'-P5' phosphoamidate bonds
- a nucleic acid derivative may be any molecule in which another chemical substance has been added to the nucleic acid in order to improve nuclease resistance, stabilize the nucleic acid, increase affinity with a complementary nucleic acid strand, increase cell permeability, or make it visible, and specific examples include 5'-polyamine-added derivatives, cholesterol-added derivatives, steroid-added derivatives, bile acid-added derivatives, vitamin-added derivatives, Cy5-added derivatives, Cy3-added derivatives, 6-FAM-added derivatives, and biotin-added derivatives.
- a protein, siRNA, shRNA, dsRNA, miRNA, antisense nucleic acid, etc. may be introduced into the animal cell, and even if other substances besides a foreign gene are introduced into the animal cell, the gene introduction rate of the cells can be measured by measuring the components of the culture supernatant.
- the medium used in the culture in step (1) can be a basal medium that is used for culturing animal cells.
- the basal medium is not particularly limited as long as it can be used for culturing animal cells, and examples thereof include AIMV, X-VIVO-15, NeuroBasal, EGM2, TeSR, BME, BGJb, CMRL 1066, Glasgow MEM, improved MEM zinc option, IMDM, 199 medium, Eagle MEM, ⁇ MEM, DMEM, Ham, RPMI-1640, Fisher medium, and various commercially available products for culturing T cells (e.g., CTS TM OpTmizer TM T-Cell Expansion Basal Medium (Thermo Fisher Scientific), CTS OpTmizer Pro Serum Free Medium (Thermo Fisher Scientific), CTS OpTmizer Pro TM (Thermo Fisher Scientific), CTS TM OpTmizer TM T-Cell Expansion Supplement (Thermo Fisher Scientific), 4Cell Nutri-T GMP lymphocyte medium (
- the medium may contain serum or may be serum-free.
- the medium may also contain serum substitutes (e.g., albumin, transferrin, Knockout Serum Replacement (KSR), CTS Immune Cell SR (Thermo Fisher Scientific), fatty acids, insulin, collagen precursors, trace elements, 2-mercaptoethanol, 3'-thiolglycerol, ITS-supplement, B27 (trademark) supplement, etc.).
- serum substitutes e.g., albumin, transferrin, Knockout Serum Replacement (KSR), CTS Immune Cell SR (Thermo Fisher Scientific)
- fatty acids e.g., insulin, collagen precursors, trace elements, 2-mercaptoethanol, 3'-thiolglycerol, ITS-supplement, B27 (trademark) supplement, etc.
- the medium may also contain one or more substances such as lipids, amino acids (non-essential amino acids, etc.), L-glutamine, vitamins, growth factors, cytokines, antibiotics, antioxidant
- the pH of the medium at the start of the culture is usually 7.0 to 7.8, preferably 7.2 to 7.6. After the start of culture, the pH varies depending on the type of cells to be cultured and the culture period, but is, for example, 6.8 to 7.8.
- the medium is preferably sterilized by a method such as filtration, ultraviolet irradiation, heat sterilization, or radiation exposure before use to prevent contamination.
- the culture conditions are not particularly limited, and the culture temperature is, for example, about 37 to 42°C, preferably about 37 to 39°C, the CO2 concentration is, for example, 2% to 10%, preferably 2 to 5%, and the oxygen concentration is, for example, 1 to 20%, preferably 5 to 20%.
- culture supernatant components are not particularly limited as long as they can be used to predict the gene transfer rate and/or the number of cells into which genes have been transferred.
- examples of the culture supernatant components include the pH of the culture supernatant, metabolites, and extracellular vesicles.
- the components of the culture supernatant also include the pH of the culture supernatant.
- examples of metabolites include organic acids, sugars, lipids, vitamins, amines, nucleic acids, amino acids, and other metabolite ions.
- Organic acids in metabolites include, for example, decenoic acid, lauric acid, dodecenoic acid, myristic acid, myristoleic acid, palmitic acid, palmitoleic acid, hexadecadienoic acid, stearic acid, oleic acid, vaccenic acid, linoleic acid, gamma-linolenic acid, alpha-linolenic acid, eleostearic acid, arachidic acid, eicosenoic acid, eicosadienoic acid, mead acid, arachidonic acid, behenic acid, docosapentaenoic acid, and docosahexaenoic acid.
- organic acids examples include lactic acid, lignoceric acid, nervonic acid, 2-hydroxyvaleric acid, 2-oxoglutaric acid, indoxyl sulfate, 4-pyridoxy acid, 4-ethylphenyl sulfate, adipic acid, citric acid, cis-aconitic acid, isocitric acid, oxalosuccinic acid, oxaloacetic acid, fumaric acid, succinic acid, lactic acid, malic acid, phenyllactic acid, pantothenic acid, pipecolic acid, pyruvic acid, tartronic acid, paracresol sulfate, and xanthurenic acid.
- preferred organic acids are lactic acid, 2-hydroxyvaleric acid, indoxyl sulfate, 4-pyridoxy acid, phenyllactic acid, and xanthurenic acid.
- sugars in metabolites include fructose, inositol, galactose, glucose, sucrose, maltose, and lactose. Of these, glucose and fructose are preferred.
- Lipids in the metabolism include, for example, ceramide, Hex2-ceramide, Hex-ceramide, cholesterol, cholesterol sulfate, cardiolipin, monoglycerol, diglycerol, lysophosphatidylcholine, lysophosphatidylethanolamine, lysophosphatidylglycerol, lysophosphatidylinositol, lysophosphatidylserine, phosphatidic acid, phosphatidylcholine, phosphatidylethanolamine, phosphatidylglycerol, phosphatidylinositol, phosphatidylserine, sphingomyelin, dihydrosphingomyelin, triglycerides, glycerol 3-phosphate, and ganglioside GM3.
- the lipids include ceramide (16:0), Hex2-ceramide ((16:0) and (24:1)), Hex-ceramide ((16:0) and (24:1)), cholesterol, cholesterol sulfate, cardiolipin ((aaaa-70:5), (aaaa-70:6), (aaaa-72:6), and (aaa a-72:7), monoglycerol ((e-16:0), (a-16:1), (a-18:1), and (a-20:0)), lysophosphatidylcholine ((a-14:0), (a-16:0), (a-16:1), (a-18:0), (a-18:1), (a-18:2), and (a-20:4)), lysophosphatidylethanolamine ((a-14:0), (a-16:0), (a-16:1), (a-18:0), (a-18:1), (a-18:2), and (a-20:4)), amines (a-18:0,
- cholesterol sulfate Among the lipids, cholesterol sulfate, FFA (C10:1), FFA (C16:2), FFA (C22:5), MG (a-16:1), PC (aa-28:0), PC (aa-30:0), PC (aa-30:1), PC (aa-32:1), PC (aa-34:2), PE (aa-34:2), PE (aa-36:2), PE (aa-36:3), and SM (16:0) are preferred.
- vitamins in metabolites include alpha-tocopherol, nicotinamide, choline, retinol, ergocalciferol, cholecalciferol, tocotrienol, phylloquinone, menaquinone, thiamine, riboflavin, nicotinic acid, pantothenic acid, pyridoxal, pyridoxamine, pyridoxine, biotin, folic acid, cyanocobalamin, methylcobalamin, hydroxocobalamin, and ascorbic acid.
- Examples of amines in metabolites include ethanolamine and ethanolamine phosphate.
- nucleic acids in metabolites include adenosine, methylthioadenosine, guanosine, 5-methyluridine, uridine, and cytidine. Of these, methylthioadenosine is preferred as a nucleic acid.
- Amino acids in metabolites include, for example, acylcarnitines (e.g., acylcarnitine (C5:0)), alanine, arginine, asparagine, aspartic acid, ⁇ -alanine, cysteine, cysteine-HPE-AM, cysteine-SS-HPE-AM, dimethylglycine, glutamic acid, glutamine, glycine, isoleucine, leucine, leucine acid, lysine, methionine, homocysteine-HPE-AM, N-acetyl- ⁇ -alanine, N-acetylcysteine, N-acetylserine, N-acetyltryptophan, N-carbamoyl-aspartate, O-acetylserine, ornithine, pyroglutamic acid, phenylalanine, proline, serine, S-sulfocysteine, taurine
- amino acids alanine, arginine, cysteine-SS-HPE-AM, leucic acid, N-acetylcysteine, N-acetylserine, pyroglutamic acid, and S-sulfocysteine are preferred.
- metabolite ions in metabolites include, for example, ammonium ion, potassium ion, calcium ion, sodium ion, pyrophosphate, sulfate, sulfite, phenol sulfate, SS-bis-HPE-AM, etc.
- ammonium ion, potassium ion, calcium ion, and SS-bis-HPE-AM are preferred.
- Extracellular vesicles are minute vesicles with a membrane structure that are secreted or released from various types of cells. Extracellular vesicles are secreted from various cells containing functional molecules such as proteins, microRNA, and mRNA, and are known to function as a mediator of intercellular communication in the body. Examples of extracellular vesicles include exosomes, microvesicles, and apoptotic bodies.
- the size of exosomes is, for example, about 30 nm to 100 nm in diameter
- the size of microvesicles is, for example, about 100 nm to 1.0 ⁇ m in diameter
- the size of apoptotic bodies is, for example, about 1.0 ⁇ m to 5.0 ⁇ m in diameter.
- Extracellular vesicles can be purified, separated, and concentrated from the culture supernatant according to or in accordance with known methods, such as ultracentrifugation (e.g., pellet down method, sucrose cushion method, density gradient centrifugation, etc.), methods using immunoaffinity carriers, gel filtration, field-flow fractionation, FACS, etc.
- ultracentrifugation e.g., pellet down method, sucrose cushion method, density gradient centrifugation, etc.
- methods using immunoaffinity carriers e.g., gel filtration, field-flow fractionation, FACS, etc.
- purification, separation, and concentration of extracellular vesicles can be performed using commercially available kits. Exosomes are preferred as extracellular vesicles.
- the method for measuring the components of the culture supernatant is not particularly limited as long as it can measure (particularly, quantify) the components of the culture supernatant, and examples thereof include a method using various commercially available measuring devices, a method using various commercially available measuring reagents and measuring kits, and the like.
- the components of the culture supernatant can also be measured by Raman spectroscopy.
- the basic parameters for physically evaluating the particles are particle size and zeta potential, and examples of particle size analyzers include transmission electron microscopes (TEM), submerged atomic force microscopes (AFM), nanoparticle tracking analysis (NTA), particle size analyzers using the Coulter counter method, and flow cytometers.
- Examples of devices for measuring metabolites in the culture supernatant include FLEX2 (Novo biomedical), STAT PROFILE Prime series (Novo biomedical), Cedex analyzer series (Roche Diagnostics), ABL800 FLEX blood gas analyzer series (RADIOMETER), REBEL cell culture component analyzer (ST Japan Co., Ltd.), Bioflow BF series (Oji Instruments Co., Ltd.), RapidPoint 500e blood gas analyzer (SIEMENS Healthineers), and Extracellular Flux Analyzer XF series (Prime Tech Co., Ltd.).
- Examples of devices for measuring the pH of the culture supernatant include various commercially available pH meters.
- Examples of devices for measuring extracellular vesicles in culture supernatants include the nanoparticle analysis system NANOSIGHT series (Japan Quantum Design Co., Ltd.), EXOVIEW IMAGER (Quantum Design), ExoCounter (Sysmex Corporation), VIDEODROP nanoparticle imaging analyzer (Meiwafosis Co., Ltd.), NanoFCM (Meiwafosis Co., Ltd.), Exoid nanoparticle multianalyzer (Meiwafosis Co., Ltd.), ZE5 Cell Analyzer series (Bio-Rad Laboratories), CytoFLEX series (Thermo Fisher Scientific), BD FACSymphony TM series (BD Bioscience), nanoparticle size/concentration counter nCS1 (Spectradyne), disc centrifuge particle size distribution measurement device CPS Disc Centrifuge series (CPS Instruments), and laser diffraction/scattering particle size distribution measurement device Bettersizer2600
- Examples of measuring devices using Raman spectroscopy include the RamanRxn Systems series (Endless+Hauser), LabRAM HR Evolution, LC-Raman System, AFM Raman, LabRAM Soleil, XploRA PLUS, Standard Microscope Spectroscopy Systems (HORIBA, Ltd.), inVia series, Virsa fiber Raman device, RA816, RA802 (Renishaw), TRS100, RapID, Vaya (Agilent Technologies), ProCellics (Merck Millipore), Ramina Process Analyzer (Thermo Fisher Scientific), BioPAT Spectro (Sartorius), BRAVO, SENTERRAII, MultiRAM, RAM II (Bruker), etc. Measurement of the components of the culture supernatant using a measuring device can be performed according to a known method, for example, according to the manual of the measuring device.
- Step (2) the gene transfer rate and/or the number of gene-transfected cells is predicted based on the values measured in step (1).
- a method for using the measured values of the components of the culture supernatant to predict the gene transfer rate and/or the number of gene-transferred cells of a cell population includes, for example, creating a calibration curve based on the gene transfer rate and/or the number of gene-transferred cells in cells with a known gene transfer rate and/or number of gene-transferred cells and the measured values of the components of the culture supernatant, and using the calibration curve to determine the gene transfer rate and/or the number of gene-transferred cells from parameters obtained from the values measured in step (1).
- the calibration curve can be created using software or the like by a standard method such as the least squares method.
- the gene transfer rate and/or the number of cells into which the gene has been transferred may be predicted based on one type of component of the culture supernatant, or the gene transfer rate and/or the number of cells into which the gene has been transferred may be predicted based on a combination of two or more types of components of the culture supernatant.
- the combination may be 3 or more types, 4 or more types, 5 or more types, 6 or more types, 7 or more types, 8 or more types, 9 or more types, 10 or more types, etc., with no particular upper limit, and examples of the combination include 30 or less types, 20 or less types, 10 or less types, etc.
- the metabolic products of the culture supernatant, glutamine, glucose, potassium ions, and calcium ions, are negatively correlated with the gene transfer rate and the number of gene-transfected cells, while lactate, ammonium ions, PC(aa-28:0), PC(aa-30:0), PC(aa-30:1), PC(aa-32:1), PC(aa-34:2), PC(aa-36:2), PC(aa-36:3), FFA(C10:1), and phenyllactic acid are positively correlated with the number of gene-transfected cells.
- the pH of the culture supernatant is negatively correlated with the gene transfer rate and the number of gene-transfected cells.
- glutamine, glutamic acid, glucose, potassium ion, calcium ion, lactic acid, ammonium ion, pH, PC(aa-28:0), PC(aa-30:0), PC(aa-30:1), PC(aa-32:1), PC(aa-36:2), FFA(C10:1), phenyllactic acid, etc. can be used individually to predict the gene transfer rate and/or the number of gene-transfected cells of a cell population for each number of culture days.
- predictions can also be made by combining multiple components.
- components used in such predictions include alanine, arginine, N-acetylcysteine, S-methyl-5-thioadenosine, indoxyl sulfate, SS-bis-HPE-AM, N-acetylserine, 2-hydroxyvaleric acid, PC(aa-28:0), PC(aa-30:0), PC(aa-30:1), PC(aa-32:1), PE(aa-34:2), PE(aa-36:2), PE(aa-36:3), FFA(C10:1), FFA(C16:2), FFA(C22:5), lactic acid, leucine acid, phenyllactic acid, SM(16:0), fructose, 4-pyridoxalic acid, MG(a-16:1), xanthurenic acid, pyroglutamic acid, S-sulfocysteine, and cholesterol sulfate.
- PC(aa-28:0), PC(aa-30:0), PC(aa-30:1), PC(aa-32:1), PC(aa-34:2), PC(aa-36:2), PC(aa-36:3), FFA(C10:1), phenyllactic acid, etc. can be used alone to predict the gene transfer rate and/or the number of gene-transfected cells of a cell population.
- Components used for such prediction include, for example, PC(aa-28:0), PC(aa-30:0), PC(aa-30:1), PC(aa-32:1), PC(aa-34:2), PE(aa-34:2), PE(aa-36:2), PE(aa-36:3), FFA(C10:1), FFA(C16:2), lactic acid, leucic acid, phenyllactic acid, cysteine-SS-HPE-AM, etc.
- the prediction can be performed, for example, by multivariate analysis, and in particular, a method using a prediction model obtained by regression analysis can be used.
- a regression analysis method can be any method that can perform regression analysis, and examples include lasso regression, PLS (Partial Least Squares), OPLS (Orthogonal Partial Least Squares), ridge regression, elastic net regression, principal component regression, partial least squares regression, random forest, neural network, deep learning, and support vector machine.
- PLS Partial Least Squares
- OPLS Orthogonal Partial Least Squares
- ridge regression elastic net regression
- principal component regression principal component regression
- partial least squares regression random forest
- neural network deep learning
- support vector machine support vector machine
- the gene transfer rate and/or the number of gene-transferred cells measured by Raman spectroscopy can be predicted by using the Raman spectroscopy measured values of the components of the culture supernatant.
- the height of the peak in the Raman spectroscopy spectrum can be used to predict the gene transfer rate and/or the number of gene-transferred cells of a cell population.
- step (2) the change in the composition of the culture supernatant before and after gene introduction can also be used to predict the gene introduction rate and/or the number of cells into which the gene has been introduced.
- the composition of the culture supernatant changes before and after gene introduction.
- the component to be measured in step (1) is preferably at least one selected from the group consisting of lactic acid, ammonium ion, pH, glutamine, glucose, phenyllactic acid, FFA (C10:1), PC (aa-28:0), PC (aa-30:0), PC (aa-30:1), PC (aa-32:1), PE (aa-34:2), PE (aa-36:2) and PE (aa-36:3), and more preferably at least one selected from the group consisting of lactic acid, ammonium ion, pH, glutamine and glucose.
- the component to be measured in step (1) is preferably at least one selected from the group consisting of lactate, ammonium ion, glucose, glutamate, sodium ion, and pH.
- the component to be measured in step (1) is preferably lactic acid.
- the method for producing a gene-introduced cell preparation of the present invention comprises the steps of: (I) The method is characterized by comprising a step of measuring components of a culture supernatant in which animal cells have been cultured, and determining the gene transfer rate and/or the number of gene-transferred cells based on the measured values.
- the manufacturing method of the present invention comprises the steps of: (II) the step of introducing a gene into an animal cell may be further included.
- the steps (I) and (II) of the production method of the present invention can be carried out by the method described above.
- the cell preparation produced by the production method of the present invention (hereinafter, sometimes referred to as the cell preparation of the present invention) is preferably produced as a parenteral preparation by mixing an effective amount of gene-transduced animal cells with a pharma- ceutically acceptable carrier according to known means (e.g., the method described in the Japanese Pharmacopoeia, etc.).
- the cell preparation of the present invention is preferably produced as a parenteral preparation such as an injection, suspension, or drip infusion.
- Parenteral administration methods include intravenous, intraarterial, intramuscular, intraperitoneal, and subcutaneous administration.
- Pharmaceutically acceptable carriers include, for example, solvents, bases, diluents, excipients, soothing agents, buffers, preservatives, stabilizers, suspending agents, isotonic agents, surfactants, and solubilizing agents.
- the dosage of the cell preparation of the present invention can be appropriately determined depending on various conditions such as the patient's weight, age, sex, and symptoms.
- the cell preparation of the present invention can be administered once or multiple times.
- the cell preparation of the present invention can be in a known form suitable for parenteral administration, such as an injection or infusion.
- the cell preparation of the present invention may also contain physiological saline, phosphate buffered saline (PBS), a culture medium, etc., in order to stably maintain the cells. Examples of culture media include, but are not limited to, RPMI, AIM-V, and X-VIVO10.
- the cell preparation may also contain a medicamentically acceptable carrier (e.g., human serum albumin), a preservative, etc. for the purpose of stabilization.
- the cell preparation of the present invention is applicable to mammals, including humans.
- the method for predicting the gene transfer rate and/or the number of gene-transferred cells of the present invention does not require complicated steps, unlike the conventional method using flow cytometry, which requires manual work, and for example, the gene transfer rate and/or the number of gene-transferred cells can be measured by a simple operation of automatic measurement using a measuring device. Furthermore, the method for predicting the gene transfer rate and/or the number of gene-transferred cells of the present invention makes it possible to efficiently measure the gene transfer rate of cells in a short time of, for example, less than 5 minutes, whereas the conventional method requires 6-7 hours. In addition, since sampling is not required, there is no stirring step and the damage to the cells is small. Furthermore, the method of the present invention is not particularly limited to the type of cells, and can be applied to various cells. It is anticipated that the method of the present invention will be applied to gene therapy such as CAR-T cell therapy.
- CAR-T cells Culture medium for CAR- ⁇ T cells (hereinafter, also simply referred to as CAR-T cells) and CAR-gdT cells: OpTmizer CTS T-Cell Expansion basal medium (Thermo Fisher Scientific) was supplemented with 2.6% OpTmizer Expansion Basal Supplement (Thermo Fisher Scientific), 1% L-Glutamine (Thermo Fisher Scientific), 1% Streptomycin, and 2% CTS Immune Cell SR (Thermo Fisher Scientific) to prepare a basal medium.
- MACS GMP IL-2 (Miltenyi Biotec) was added to the medium at a concentration of 20 IU/mL or 40 IU/mL.
- SK-HEP-1 cell culture medium MEM, L-Gln(+) (Thermo Fisher Scientific) was prepared by adding 10% FBS (Biosera), 1% non-essential amino acids (Fujifilm Wako Pure Chemical Corporation), 1% penicillin-streptomycin solution (Fujifilm Wako Pure Chemical Corporation), and 1 mM sodium pyruvate (Fujifilm Wako Pure Chemical Corporation).
- the cells were diluted with culture medium using a LOVO Cell processing system (Fresenius Kabi) or a centrifuge, and seeded at 6.07x10 5 cells/cm 2 or less into a culture bag that had been previously coated with RetroNectinTM (Takara Bio Inc.) and a retrovirus carrying the CAR gene, and cultured until the next day.
- the cells were seeded in culture bottles (G-REX, Wilson Wolf) at a density of 2.2x10⁶ cells/cm2 or less and cultured for 3-7 days to produce CAR-T cells and CAR-gdT cells (amplification step).
- the CAR gene used has the base sequence shown in SEQ ID NO: 1 (the same applies to the SK-HEP-1 cells described below).
- PBMCs Charles River Laboratories
- BINKITTM for NK cells expansion from PBMCs
- RetroNectinTM Retrovirus carrying a CAR gene
- SK-HEP-1 cells (ATCC) were diluted with SK-HEP-1 cell culture medium to a concentration of 2.0x10⁶ cells/mL or less, seeded at a density of 6.07x10⁵ cells/cm2 or less onto a culture plate that had been pre-coated with RetroNectin (Takara Bio Inc.) and a retrovirus carrying the CAR gene, and cultured for 4 days to introduce the CAR gene into the SK-HEP-1 cells.
- Glucose uptake was measured using a Glucose Uptake Detection Kit Green (Dojindo Laboratories, Ltd.) according to the manual.
- ⁇ Metabolome and lipidome analysis> The culture supernatant was homogenized by adding 9 volumes of methanol and vortexing, and then analyzed by hydrophilic interaction chromatography/tandem mass spectrometry (HILIC/MS/MS), lipidomics, and gas chromatography/tandem mass spectrometry (GC/MS/MS).
- HILIC/MS/MS hydrophilic interaction chromatography/tandem mass spectrometry
- lipidomics lipidomics
- GC/MS/MS gas chromatography/tandem mass spectrometry
- LC/MS/MS liquid chromatography/tandem mass spectrometry
- SRM Selected reaction monitoring
- GC/MS/MS analysis was performed by centrifuging the homogenate, drying 10 ⁇ L of the supernatant with a nitrogen stream, and then derivatizing the compounds through a two-step reaction of oximation and trimethylsilylation.
- 1 ⁇ L of the reaction mixture was injected into an Agilent 7890B series gas chromatography system using a GC Injector 80 autosampler (Agilent Technologies).
- Exosomes in the culture supernatant were isolated using MagCapture TM Exosome Isolation Kit PS ver.2 (Fujifilm Wako Pure Chemical Corporation). Eight volumes of cold acetone (Fujifilm Wako Pure Chemical Corporation) were added to the exosome suspension, and the suspension was left to stand overnight at -20°C. The supernatant was removed by centrifugation (15,000 ⁇ g, 4°C, 20 minutes), and the precipitate was suspended in cold acetone. The suspension was mixed by inversion and centrifuged again (15,000 ⁇ g, 4°C, 5 minutes), and the supernatant was removed. Finally, the precipitate was air-dried (left at room temperature for 30 minutes).
- the dried precipitate was dissolved in 10 ⁇ L of solubilization buffer [8 M urea (Fujifilm Wako Pure Chemical Corporation), 50 mM Tris-HCl, pH 8.0 (Nippon Gene Co., Ltd., 312-90061)] (protein solution).
- solubilization buffer [8 M urea (Fujifilm Wako Pure Chemical Corporation), 50 mM Tris-HCl, pH 8.0 (Nippon Gene Co., Ltd., 312-90061)] (protein solution).
- the entire protein solution was subjected to hydrolysis with trypsin (Promega). That is, 1.1 ⁇ L of 100 mM dithiothreitol (DTT) (FUJIFILM Wako Pure Chemical Co., Ltd.) solution was added to the protein solution and incubated at 37°C for 30 minutes (final DTT concentration: 10 mM).
- DTT dithiothreitol
- the peptide solution after the reaction was desalted using a C18 + SDB STAGE Tip (Rappsilber, J. et al., Anal. Chem. 2003, 75: 663-70).
- the desalted sample was dried under reduced pressure.
- the dried peptide sample was dissolved in a solvent (volume ratio 98:2:0.1) consisting of water (Fujifilm Wako Pure Chemical Corporation, 210-01303), acetonitrile (same company, 018-19853), and trifluoroacetic acid (same company, 204-02743).
- the volume of the added solvent was adjusted to 0.1 ⁇ g/ ⁇ L based on the total protein amount (equivalent to 2 ⁇ g) and the solution was subjected to LC-MS/MS.
- the measurement data obtained from each sample by LC-MS/MS was processed as follows. Specifically, peak alignment and sequence database search of each LC-MS/MS data were performed using Thermo Fisher Scientific's software Proteome Discoverer (ver. 3.0) (hereafter referred to as "PD 3.0") (https://www.thermofisher.com/jp/ja/home/industrial/mass-spectrometry/liquid-chromatography-mass-spectrometry-lc-ms/lc-ms-software/multi-omics-data-analysis/proteome-discoverer-software.html). Sequest HT software was used for the sequence database search.
- the identification information of peptides deemed significant was linked to each detection peak, and the intensity value of the linked detection peak was taken as the detection intensity of the peptide in question (two types: detection intensity before normalization "Abundance” and intensity after normalization “Abundances (Normalized)”). Peak detection intensity normalization was performed according to the PD 3.0 algorithm.
- ⁇ Raman spectroscopy measurement> The Raman spectroscopy of the culture supernatant was measured using an Endress+Hauser Raman analyzer, RamanRxn2 system. The obtained spectra were then subjected to second-order differentiation using statistical analysis software R, and the spectra of samples with different CAR gene transfection rates were compared.
- Example 1 Changes in the composition of culture supernatant in T cells by CAR gene introduction CAR-T cells were produced, and the cell density, viability, and gene introduction efficiency after production were measured. The results are shown in Figure 1. As a result, a slight decrease in viability was observed depending on the presence or absence of CAR gene introduction (Figure 1B), but there was no change in cell density ( Figure 1A). However, in the culture supernatant containing phenol red, it was observed that the pH of the CAR-T cells was lower and more acidic than that of T cells not introduced with the gene (UTD) ( Figures 1D-1E). Furthermore, metabolites were measured to investigate changes in the supernatant components. The results are shown in Figure 2.
- Example 2 Changes in metabolism in T cells due to CAR gene introduction Since changes were observed in the culture supernatant in Example 1, changes in metabolism in T cells due to CAR gene introduction were confirmed. The results are shown in Figure 3. After producing non-gene-introduced T cells (UTD) and CAR-T cells, the medium was replaced with fresh medium and cultured. After 1, 3, 6, or 24 hours, cell counts and analysis of the culture supernatant were performed ( Figure 3A). During the 24-hour culture, no increase in cell number was observed in UTD and CAR-T cells ( Figure 3B). However, a decrease in glucose and an increase in lactate were observed in the culture supernatant of CAR-T cells, confirming the enhancement of glycolysis ( Figures 3C-3D).
- Example 3 Change in glucose uptake in T cells by CAR gene introduction Since it was confirmed from the results of Example 2 that metabolism was changed by CAR gene introduction, the actual glucose uptake was quantified. The results are shown in Figure 4. As a result, it was confirmed that the glucose uptake increased by CAR gene introduction.
- Example 4 Prediction of the number of CAR-T cells on the final day of production from the components in the culture supernatant From the results of Examples 1-3, it is inferred that the number of CAR-T cells correlates with the components in the culture supernatant.
- T cells with and without the CAR gene introduced from T cells of one donor were prepared. After that, the cells were mixed so that the gene-introduced T cells were 0, 25, 50, 75, and 100%, and cultured for 4 days. Although there was no significant difference in the number of cells, a cell population containing CAR-T cells at a ratio according to the mixture ratio was prepared with respect to the CAR introduction rate (FIGS. 5-1A and 5-1B).
- Example 5 Prediction of CAR-T cell numbers over time from components in culture supernatants using multiple donors Using the same production method as in Example 4, CAR-T cells were prepared from T cells of three donors, and the cell density and CAR introduction rate were measured on all culture days from days 1 to 4 of expansion. The results are shown in Figures 6A-B. After that, when the correlation between cell density and CAR-T cell density was confirmed from the culture components found in Example 4, a correlation was also shown with CAR-T cell density, but a higher correlation was shown with cell density ( Figures 7A-J).
- Example 6 Comprehensive analysis of culture supernatant using metabolomic and lipidomic analysis Metabolomic and lipidomic analysis was performed using the culture supernatant used in Example 5. Regarding the difference in the supernatant components between non-gene-transduced T cells (UTD) and CAR-T cells, assuming that the difference between each component increases according to the CAR transduction rate when UTD is used as the control group, a Williams test was performed to extract components whose difference increases according to the CAR transduction rate. The results are shown in FIG. 8.
- the components that accumulate in the supernatant depending on the CAR transduction rate are plotted in the upper right, and the components that are consumed depending on the CAR transduction rate are plotted in the upper left.
- the abbreviations of the lipid components in the figure are as follows.
- PC phosphatidylcholine
- PE phosphatidylethanolamine
- SM sphingomyelin
- FFA free fatty acid.
- the bond between glycerol and fatty acid is represented as a if it is an ester bond, and e if it is an ether bond, and the numbers of a and e indicate the number of fatty acid residues bound to the glycerol part.
- the total number of carbon atoms (x) and the number of double bonds (y) of the bound fatty acid residues are represented as x:y.
- PC (aa-34:1) indicates that two fatty acids are bound to the glycerol part of phosphatidylcholine by ester bonds, the total number of carbon atoms of the fatty acid residue is 34, and there is one double bond among them.
- HPE-AM is an abbreviation for ⁇ -(4-hydroxyphenyl)ethyl iodoacetamide, and is used to stabilize and detect sulfur compounds such as persulfides and polysulfides. Therefore, Cysteine-SS-HPE-AM in the figure indicates cysteine persulfide, etc., and SS-bis-HPE-AM indicates sulfur metabolites such as H 2 S 2 .
- PE aa-34:2), PC (aa-30:1), PE (aa-36:2), PC (aa-30:0), FFA (C10:1), etc. were observed to accumulate in the supernatant in a CAR introduction rate-dependent manner, while FFA (C16:2), arginine, glutamine, etc. were observed to be consumed in a CAR introduction rate-dependent manner.
- Example 7 Prediction of CAR-T cell number from components in culture supernatant using metabolomic/lipidomic analysis Metabolomic/lipidomic analysis was performed using the culture supernatant used in Example 5 to confirm whether there was a component capable of predicting the number of CAR-T cells.
- LASSO regression and OPLS regression were performed as multivariate analysis for the same corrected values, and the selection of components contributing to the regression to the number of CAR-T cells or the importance of variables was analyzed. The results are shown in FIG. 10.
- Fig. 10A-C the actual measurements and predictions of the number of CAR-T cells on days 2, 3, and 4 of amplification during the amplification process
- Fig. 10D-G the actual measurements and predictions of the number of CAR-T cells on days 1, 2, 3, and 4 of amplification during the amplification process
- metabolites with high variable importance at that time are shown in the same graph.
- Example 8 Change in metabolism in SK-Hep-1 cells by CAR gene introduction Using SK-Hep-1 cells, a hepatic cancer cell line, it was confirmed whether the introduction of the CAR gene used in Example 1 changes cell metabolism, regardless of the introduced cells (i.e., other than T cells). The results are shown in Figure 13. As in Example 1, an increase in lactate in the culture supernatant was observed by CAR gene introduction.
- Example 9 Change in metabolism in gdT cells by CAR gene introduction Using gdT cells, it was confirmed whether the introduction of the CAR gene used in Example 1 changes the metabolism of the cells. The results are shown in Figure 14. As a result, an increase in lactic acid in the culture supernatant was observed due to the introduction of the CAR gene.
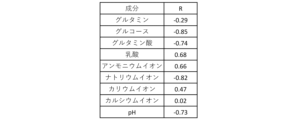
- Example 10 Changes in metabolism in NK cells due to CAR gene introduction CAR-NK cells were produced, and correlations between the components in the culture supernatant and the number of CAR-NK cells were confirmed. The results are shown in Figure 15. The number of CAR-NK cells was positively correlated with lactate and ammonium ions, and negatively correlated with glucose, glutamate, sodium ions, and pH. The number of CAR-NK cells can be predicted from the components of the culture supernatant.
- Example 11 Changes in exosomes by CAR gene introduction
- exosomes which are cell vesicles in the culture supernatant, change due to the introduction of the CAR gene used in Example 1.
- the results are shown in Figure 16. It was confirmed that the particle size of exosomes becomes smaller than that of T cells by the introduction of the CAR gene ( Figure 16A).
- proteome analysis of exosomes derived from CAR-T cells or T cells was performed to confirm the exosome profile.
- the profile of exosome proteins changed between CAR-T cells and T cells ( Figure 16B).
- Example 12 Change in Raman spectroscopy due to introduction of CAR gene It was confirmed whether the Raman spectroscopy of the culture supernatant changes due to introduction of the CAR gene used in Example 1. The results are shown in FIG. 17.
- FIG. 17A shows the entire second derivative of the acquired Raman spectroscopy spectrum. Differences were observed in various peaks between CAR-introduced cells and non-introduced cells.
- FIG. 17B shows an example of the peaks.
Landscapes
- Health & Medical Sciences (AREA)
- Life Sciences & Earth Sciences (AREA)
- Chemical & Material Sciences (AREA)
- Engineering & Computer Science (AREA)
- Organic Chemistry (AREA)
- Genetics & Genomics (AREA)
- Zoology (AREA)
- Biomedical Technology (AREA)
- Wood Science & Technology (AREA)
- Biotechnology (AREA)
- Biochemistry (AREA)
- Molecular Biology (AREA)
- Bioinformatics & Cheminformatics (AREA)
- General Health & Medical Sciences (AREA)
- Proteomics, Peptides & Aminoacids (AREA)
- General Engineering & Computer Science (AREA)
- Microbiology (AREA)
- Biophysics (AREA)
- Immunology (AREA)
- Physics & Mathematics (AREA)
- Cell Biology (AREA)
- Medicinal Chemistry (AREA)
- Analytical Chemistry (AREA)
- Urology & Nephrology (AREA)
- Hematology (AREA)
- Toxicology (AREA)
- Pathology (AREA)
- General Physics & Mathematics (AREA)
- Food Science & Technology (AREA)
- Plant Pathology (AREA)
- Gastroenterology & Hepatology (AREA)
- Measuring Or Testing Involving Enzymes Or Micro-Organisms (AREA)
Abstract
開示されているのは、動物細胞の遺伝子導入率及び/又は遺伝子導入細胞数の予測方法であって、(1)遺伝子導入した動物細胞が培養された培養上清の成分を測定する工程、及び(2)工程(1)で測定した値に基づいて遺伝子導入率及び/又は遺伝子導入細胞数を予測する工程を含む方法である。
Description
本発明は、遺伝子導入率及び/又は遺伝子導入細胞数の予測方法に関する。
(発明の背景)
(発明の背景)
近年、キメラ抗原受容体(CAR)-T細胞などの遺伝子組換え細胞医薬品(遺伝子導入した/された細胞製剤)の研究開発が盛んに行われている。CAR-T細胞などの遺伝子組換え細胞医薬品では、全体の細胞数に導入遺伝子の割合をかけることで製品の量を規定している。そのため、CAR-T細胞製品では、製造工程、出荷及び投薬においてCAR導入率は最も重要な指標になっている。しかしながら、従来、細胞への遺伝子導入率の測定法にはフローサイトメトリーが用いられているが、測定から解析までの時間が長いこと(6-7時間)と複雑な工程(細胞の染色工程が手作業)が必要という問題がある。例えば、非特許文献1では、フローサイトメトリーを使用して、CAR-T細胞の測定を行ったことが報告されている。
Cytometry Part B: Clinical Cytometry, Volume 100, Issue 2, p. 218-224
本発明は、従来法と比較して簡便且つ効率的に細胞の遺伝子導入率及び/又は遺伝子導入細胞数の測定が可能となる、遺伝子導入率及び/又は遺伝子導入細胞数の予測方法等を提供することを課題とする。
本発明者らは、上記目的を達成すべく鋭意研究を重ねた結果、遺伝子導入細胞と非導入細胞で培養上清の成分に違いがあることを見出し、細胞を培養する培地を分析し、培地の成分(例えば、培地中の代謝物、pH、細胞外小胞)を指標とすることで、動物細胞の遺伝子導入率及び/又は遺伝子導入細胞数を簡便且つ効率的に予測することが可能となるという知見を得た。
本発明は、これら知見に基づき、更に検討を重ねて完成されたものであり、次の動物細胞の遺伝子導入率及び/又は遺伝子導入細胞数の予測方法を提供するものである。
[1]動物細胞の遺伝子導入率及び/又は遺伝子導入細胞数の予測方法であって、
(1)遺伝子導入した動物細胞が培養された培養上清の成分を測定する工程、及び
(2)工程(1)で測定した値に基づいて遺伝子導入率及び/又は遺伝子導入細胞数を予測する工程
を含む方法。
[2]工程(1)において、培養上清のpH、代謝物又は細胞外小胞の測定を行う 、[1]に記載の方法。
[3]前記代謝物が、有機酸、糖類、脂質、ビタミン、アミン類、核酸類、アミノ酸及びその他代謝物イオンからなる群から選択される少なくとも1種である、[2]に記載の方法。
[4]前記有機酸が、デセン酸、ドデセン酸、ミリストレイン酸、パルミチン酸、パルミトレイン酸、ヘキサデカジエン酸、ステアリン酸、オレイン酸、リノール酸、γ-リノレン酸、α-リノレン酸、アラキジン酸、エイコセン酸、エイコサジエン酸、ミード酸、アラキドン酸、ドコサペンタエン酸、ドコサヘキサエン酸、ネルボン酸、2-ヒドロキシ吉草酸、2-オキソグルタル酸、インドキシル硫酸、4-ピリドキシ酸、硫酸4エチルフェニル、アジピン酸、クエン酸、フマル酸、乳酸、リンゴ酸、フェニル乳酸、パントテン酸、ピペコリン酸、ピルビン酸、タルトロン酸、パラクレゾール硫酸、及びキサンツレン酸からなる群から選択される少なくとも1種である、[3]に記載の方法。
[5]前記糖類がフルクトース、イノシトール、ガラクトース、グルコース、及びスクロースからなる群から選択される少なくとも1種である、[3]又は[4]に記載の方法。
[6]前記脂質がセラミド、Hex2-セラミド、Hex-セラミド、コレステロール、コレステロール硫酸塩、カルジオリピン、モノグリセロール、リゾホスファチジルコリン、リゾホスファチジルエタノールアミン、ホスファチジン酸、ホスファチジルコリン、ホスファチジルエタノールアミン、ホスファチジルグリセロール、ホスファチジルイノシトール、ホスファチジルセリン、スフィンゴミエリン、ジヒドロスフィンゴミエリン、トリグリセリド、グリセロール3リン酸、及びガングリオシドGM3からなる群から選択される少なくとも1種である、[3]~[5]のいずれかに記載の方法。
[7]前記ビタミンがαトコフェロール、ニコチンアミド、及びコリンからなる群から選択される少なくとも1種である、[3]~[6]のいずれかに記載の方法。
[8]前記アミン類がエタノールアミン、及びエタノールアミンリン酸からなる群から選択される少なくとも1種である、[3]~[7]のいずれかに記載の方法。
[9]前記核酸類がアデノシン、及びメチルチオアデノシンからなる群から選択される少なくとも1種である、[3]~[8]のいずれかに記載の方法。
[10]前記アミノ酸がアシルカルニチン、アラニン、アルギニン、アスパラギン、アスパラギン酸、β-アラニン、システイン、システイン-HPE-AM、システイン-SS-HPE-AM、ジメチルグリシン、グルタミン酸、グルタミン、グリシン、イソロイシン、ロイシン、ロイシン酸、リシン、メチオニン、ホモシステイン-HPE-AM、N-アセチル-β-アラニン、N-アセチルシステイン、N-アセチルセリン、N-アセチルトリプトファン、N-カルバモイル-アスパルテート、O-アセチルセリン、オルニチン、ピログルタミン酸、フェニルアラニン、プロリン、セリン、S-スルフォシステイン、タウリン、スレオニン、トリプトファン、チロシン、及びバリンからなる群から選択される少なくとも1種である、[3]~[9]に記載の方法。
[11]前記その他代謝物イオンがアンモニウムイオン、カリウムイオン、カルシウムイオン、ナトリウムイオン、ピロリン酸、硫酸、亜硫酸、フェノール硫酸、及びSS-bis-HPE-AMからなる群から選択される少なくとも1種である、[3]~[10]のいずれかに記載の方法。
[12]工程(1)における培養上清の成分の測定を、ラマン分光法により行う、[1]~[11]のいずれかに記載の方法。
[13]工程(2)において、培養上清の1種類の成分に基づいて遺伝子導入率及び/又は遺伝子導入細胞数の予測を行う、[1]~[12]のいずれかに記載の方法。
[14]工程(2)において、培養上清の2種以上の成分の組合せに基づいて遺伝子導入率及び/又は遺伝子導入細胞数の予測を行う、[1]~[12]のいずれかに記載の方法。
[15]工程(2)において、遺伝子導入前後の培養上清の成分の変化を遺伝子導入率及び/又は遺伝子導入細胞数の予測に使用する、[1]~[14]のいずれかに記載の方法。
[16]前記動物細胞が、免疫細胞である、[1]~[15]のいずれかに記載の方法。[17]前記免疫細胞が、T細胞又はNK細胞である、[16]に記載の方法。
[18]前記動物細胞が、上皮細胞である、[1]~[15]のいずれかに記載の方法。
[18a]前記動物細胞が、肝がん細胞である、[18]に記載の方法。
[18b]前記動物細胞が、ヒト細胞である、[1]~[18a]のいずれかに記載の方法。
[19]前記遺伝子が、キメラ抗原受容体をコードする核酸である、[1]~[18b]のいずれかに記載の方法。
[20]遺伝子導入した細胞製剤の製造方法であって、動物細胞が培養された培養上清の成分を測定し、測定した値に基づいて遺伝子導入率及び/又は遺伝子導入細胞数を測定する工程を含む方法。
(1)遺伝子導入した動物細胞が培養された培養上清の成分を測定する工程、及び
(2)工程(1)で測定した値に基づいて遺伝子導入率及び/又は遺伝子導入細胞数を予測する工程
を含む方法。
[2]工程(1)において、培養上清のpH、代謝物又は細胞外小胞の測定を行う 、[1]に記載の方法。
[3]前記代謝物が、有機酸、糖類、脂質、ビタミン、アミン類、核酸類、アミノ酸及びその他代謝物イオンからなる群から選択される少なくとも1種である、[2]に記載の方法。
[4]前記有機酸が、デセン酸、ドデセン酸、ミリストレイン酸、パルミチン酸、パルミトレイン酸、ヘキサデカジエン酸、ステアリン酸、オレイン酸、リノール酸、γ-リノレン酸、α-リノレン酸、アラキジン酸、エイコセン酸、エイコサジエン酸、ミード酸、アラキドン酸、ドコサペンタエン酸、ドコサヘキサエン酸、ネルボン酸、2-ヒドロキシ吉草酸、2-オキソグルタル酸、インドキシル硫酸、4-ピリドキシ酸、硫酸4エチルフェニル、アジピン酸、クエン酸、フマル酸、乳酸、リンゴ酸、フェニル乳酸、パントテン酸、ピペコリン酸、ピルビン酸、タルトロン酸、パラクレゾール硫酸、及びキサンツレン酸からなる群から選択される少なくとも1種である、[3]に記載の方法。
[5]前記糖類がフルクトース、イノシトール、ガラクトース、グルコース、及びスクロースからなる群から選択される少なくとも1種である、[3]又は[4]に記載の方法。
[6]前記脂質がセラミド、Hex2-セラミド、Hex-セラミド、コレステロール、コレステロール硫酸塩、カルジオリピン、モノグリセロール、リゾホスファチジルコリン、リゾホスファチジルエタノールアミン、ホスファチジン酸、ホスファチジルコリン、ホスファチジルエタノールアミン、ホスファチジルグリセロール、ホスファチジルイノシトール、ホスファチジルセリン、スフィンゴミエリン、ジヒドロスフィンゴミエリン、トリグリセリド、グリセロール3リン酸、及びガングリオシドGM3からなる群から選択される少なくとも1種である、[3]~[5]のいずれかに記載の方法。
[7]前記ビタミンがαトコフェロール、ニコチンアミド、及びコリンからなる群から選択される少なくとも1種である、[3]~[6]のいずれかに記載の方法。
[8]前記アミン類がエタノールアミン、及びエタノールアミンリン酸からなる群から選択される少なくとも1種である、[3]~[7]のいずれかに記載の方法。
[9]前記核酸類がアデノシン、及びメチルチオアデノシンからなる群から選択される少なくとも1種である、[3]~[8]のいずれかに記載の方法。
[10]前記アミノ酸がアシルカルニチン、アラニン、アルギニン、アスパラギン、アスパラギン酸、β-アラニン、システイン、システイン-HPE-AM、システイン-SS-HPE-AM、ジメチルグリシン、グルタミン酸、グルタミン、グリシン、イソロイシン、ロイシン、ロイシン酸、リシン、メチオニン、ホモシステイン-HPE-AM、N-アセチル-β-アラニン、N-アセチルシステイン、N-アセチルセリン、N-アセチルトリプトファン、N-カルバモイル-アスパルテート、O-アセチルセリン、オルニチン、ピログルタミン酸、フェニルアラニン、プロリン、セリン、S-スルフォシステイン、タウリン、スレオニン、トリプトファン、チロシン、及びバリンからなる群から選択される少なくとも1種である、[3]~[9]に記載の方法。
[11]前記その他代謝物イオンがアンモニウムイオン、カリウムイオン、カルシウムイオン、ナトリウムイオン、ピロリン酸、硫酸、亜硫酸、フェノール硫酸、及びSS-bis-HPE-AMからなる群から選択される少なくとも1種である、[3]~[10]のいずれかに記載の方法。
[12]工程(1)における培養上清の成分の測定を、ラマン分光法により行う、[1]~[11]のいずれかに記載の方法。
[13]工程(2)において、培養上清の1種類の成分に基づいて遺伝子導入率及び/又は遺伝子導入細胞数の予測を行う、[1]~[12]のいずれかに記載の方法。
[14]工程(2)において、培養上清の2種以上の成分の組合せに基づいて遺伝子導入率及び/又は遺伝子導入細胞数の予測を行う、[1]~[12]のいずれかに記載の方法。
[15]工程(2)において、遺伝子導入前後の培養上清の成分の変化を遺伝子導入率及び/又は遺伝子導入細胞数の予測に使用する、[1]~[14]のいずれかに記載の方法。
[16]前記動物細胞が、免疫細胞である、[1]~[15]のいずれかに記載の方法。[17]前記免疫細胞が、T細胞又はNK細胞である、[16]に記載の方法。
[18]前記動物細胞が、上皮細胞である、[1]~[15]のいずれかに記載の方法。
[18a]前記動物細胞が、肝がん細胞である、[18]に記載の方法。
[18b]前記動物細胞が、ヒト細胞である、[1]~[18a]のいずれかに記載の方法。
[19]前記遺伝子が、キメラ抗原受容体をコードする核酸である、[1]~[18b]のいずれかに記載の方法。
[20]遺伝子導入した細胞製剤の製造方法であって、動物細胞が培養された培養上清の成分を測定し、測定した値に基づいて遺伝子導入率及び/又は遺伝子導入細胞数を測定する工程を含む方法。
本発明の遺伝子導入率及び/又は遺伝子導入細胞数の予測方法によれば、従来法と比較して複雑な工程が必要なく簡便な操作(例えば、必要な操作は測定装置による自動的な測定のみ)で細胞の遺伝子導入率及び/又は遺伝子導入細胞数の測定が可能である。さらに、本発明の遺伝子導入率及び/又は遺伝子導入細胞数の予測方法によれば、効率的(例えば、5分未満の短時間)に細胞の遺伝子導入率の測定が可能となる。また、培養上清を使用するため細胞のサンプリングが不要なため撹拌工程がなく細胞へのダメージも少ない。例えば、CAR-T細胞製品の製造工程・品質管理工程において、遺伝子導入前と遺伝子導入後に培養上清の成分を測定することで、短時間で簡便に細胞を傷つけずにCAR導入率及び導入細胞数を把握でき、基準を満たした製品が製造できているか確認することが可能となる。
以下、本発明の実施の形態について詳細に説明する。
「~を含む(comprise(s)又はcomprising)」とは、その語句に続く要素の包含を示すがこれに限定されないことを意味する。したがって、その語句に続く要素の包含は示唆するが、他の任意の要素の除外は示唆しない。「~からなる(consist(s) of又はconsisting of)」とは、その語句に続くあらゆる要素を包含し、かつ、これに限定されることを意味する。したがって、「~からなる」という語句は、列挙された要素が要求されるか又は必須であり、他の要素は実質的に存在しないことを示す。「~から本質的になる(consist(s) essentially of又はconsisting essentially of)」とは、その語句に続く任意の要素を包含し、かつ、その要素について本開示で特定された活性又は作用に影響しない他の要素に限定されることを意味する。したがって、「~から本質的になる」という語句は、列挙された要素が要求されるか又は必須であるが、他の要素は任意選択であり、それらが列挙された要素の活性又は作用に影響を及ぼすかどうかに応じて、存在させる場合もあり、存在させない場合もあることを示す。
本明細書において、「多能性幹細胞(pluripotent stem cell)」とは、胚性幹細胞(ES細胞)及びこれと同様の分化多能性、すなわち生体の様々な組織(内胚葉、中胚葉、外胚葉の全て)に分化する能力を潜在的に有する細胞を指す。ES細胞と同様の分化多能性を有する細胞としては、「人工多能性幹細胞」(本明細書中、「iPS細胞」と称することもある)が挙げられる。多能性幹細胞がES細胞又はヒト胚に由来する任意の細胞である場合、その細胞は胚を破壊して作製された細胞であっても、又は胚を破壊することなく作製された細胞であってもよく、好ましくは、胚を破壊することなく作製された細胞である。
本明細書において、「細胞集団(population)」とは、同じ種類又は異なる種類の2以上の細胞を意味する。「細胞集団(population)」は、同じ種類又は異なる種類の細胞の一塊(mass)をも意味する。
本明細書において、「培養」とは、細胞をインビトロ環境において維持し、又は/及び増殖させることを指す。「培養する」とは、組織外又は体外で、例えば、細胞培養ディッシュ又はフラスコ中で細胞を持続させ、又は/及び増殖させることを意味する。
本発明は、動物細胞の遺伝子導入率及び/又は遺伝子導入細胞数の予測方法であって、(1)遺伝子導入した動物細胞が培養された培養上清の成分を測定する工程、及び
(2)工程(1)で測定した値に基づいて遺伝子導入率及び/又は遺伝子導入細胞数を予測する工程
を含むことを特徴とする。
(2)工程(1)で測定した値に基づいて遺伝子導入率及び/又は遺伝子導入細胞数を予測する工程
を含むことを特徴とする。
本発明における「遺伝子導入率」とは、細胞への核酸の導入率をいい、例えば、全細胞中の核酸が導入された細胞の割合、細胞集団における核酸の取り込み量、又は全細胞集団における導入遺伝子の発現率である。導入遺伝子がCARの場合、CAR陽性率と記載することもある。
本発明における「遺伝子導入細胞数」とは、細胞集団において遺伝子が導入された細胞の数である。導入遺伝子がCARの場合、CAR陽性細胞数と記載することもある。
本発明の「動物細胞の遺伝子導入率及び/又は遺伝子導入細胞数の予測方法」における「及び/又は」とは、本発明の予測方法は、遺伝子導入率と遺伝子導入細胞数の双方を予測する方法でもあり、いずれか一方を測定する方法でもあることを意味する。より好ましくは、遺伝子導入細胞数の予測方法である。
・工程(1)
工程(1)では、遺伝子導入した動物細胞が培養された培養上清の成分の測定を行う。
工程(1)では、遺伝子導入した動物細胞が培養された培養上清の成分の測定を行う。
動物細胞の種類は、特に限定されず、各種の動物細胞を広く使用することができる。動物細胞の種類としては、例えば、牌細胞、神経細胞、グリア細胞、膵臓β細胞、骨髄細胞、メサンギウム細胞、ランゲルハンス細胞、表皮細胞、上皮細胞、内皮細胞、繊維芽細胞、繊維細胞、筋細胞(例:骨格筋細胞、心筋細胞、筋芽細胞、筋衛星細胞)、脂肪細胞、免疫細胞(例:マクロファージ、T細胞、B細胞、ナチュラルキラー細胞(NK細胞)、肥満細胞、好中球、好塩基球、好酸球、単球、巨核球)、滑膜細胞、軟骨細胞、骨細胞、骨芽細胞、破骨細胞、乳腺細胞、肝細胞、間質細胞、卵細胞及び精細胞、並びにこれらの細胞に分化誘導可能な幹細胞(神経幹細胞、造血幹細胞、間葉系幹細胞、歯髄幹細胞、iPS細胞、ES細胞などの多能性幹細胞を含む)、前駆細胞、血球系細胞、卵母細胞及び受精卵が挙げられる。T細胞には、αβT細胞、γδT細胞、ヘルパーT細胞、細胞傷害性T細胞、制御性T細胞、サプレッサーT細胞、腫瘍浸潤T細胞、メモリーT細胞、ナイーブT細胞、NKT細胞、TCR-T細胞、STAR受容体T細胞、CAR-T細胞(例:CAR-αβT細胞、CAR-gdT細胞)などが包含される。さらに、動物細胞は、初代細胞、上記幹細胞(例:iPS細胞)等をin vitroで分化誘導して作製した上記細胞も含む。また、動物細胞は、各種のがん細胞も包含する。動物細胞は、1種のみ、又は2種以上を含むものであってもよい。
また、動物細胞の由来生物は特に限定されず、そのような生物としては、哺乳類、例えば、ヒト、マウス、ラット、ウシ、ウマ、ブタ、ウサギ、イヌ、ネコ、ヤギ、サル、チンパンジーなどが例示される。中でも、ヒトが好ましい。
動物細胞は、外来遺伝子を導入した動物細胞である。「外来遺伝子」は、動物細胞に所望のタンパク質を発現させるために、外部より導入される遺伝子又はモノマーヌクレオチドであり、動物細胞の用途に応じて適宜選択することができる。本発明における「遺伝子導入した動物細胞」とは、遺伝子導入を試みて、実際に遺伝子が導入された動物細胞、及び遺伝子が導入されなかった動物細胞の両方の意味を含む。また、本発明において「遺伝子導入された(動物)細胞」は、実際に遺伝子が導入された(動物)細胞を意味する。「遺伝子導入した細胞」と「遺伝子導入された細胞」は文脈により相互互換的に用いられ得る。
外来遺伝子は、例えば、CAR(キメラ抗原受容体)を発現するための遺伝子とすることができる。外来遺伝子は、例えば、CARを発現するための遺伝子と、サイトカイン及び/又はケモカインを発現するための遺伝子とすることができる。動物細胞が発現するCARは基本的に、一般的又は公知のCARと同様に、(i)がん細胞の細胞表面抗原を認識する抗原認識部位(例えば、一本鎖抗体、リガンド、ペプチドなど)、(ii)細胞膜貫通領域、及び(iii)T細胞の活性化を誘導するシグナル伝達領域、の各部位のペプチドが、必要に応じてスペーサーを介して連結することによって構成されている。その他の外来遺伝子としては、TCR(T細胞受容体)、STAR(Synthetic T cell receptor and antigen receptor)、chimeric TAC(T cell antigen coupler)receptor、自殺遺伝子(iCas9,HSV-TK等)、サイトカイン(インターロイキン、ケモカイン等)、T細胞活性化抑制因子(免疫チェックポイント因子(CTLA-4、PD-1、TIM-3、LAG-3、TGIT、BTLA、VISTA(PD-1H)等)、CD160、Cbl-b、内因性TCR等)の発現を抑制する分子、T細胞活性化促進因子(CD28、ICOS、CD137、0X40、CD27、GITR、BAFFR、TACI、BMCA、CD40L等)などが挙げられる。
外来遺伝子を動物細胞に導入するための手段は特に限定されるものではなく、公知又は一般的な各種の手段を採用することができる。典型的には上記外来遺伝子は、発現ベクターを用いて動物細胞に導入し、発現させる。発現ベクターは、直鎖状でも環状でもよく、プラスミドなどの非ウイルスベクターでも、ウイルスベクターでも、トランスポゾンによるベクターでもよい。
発現ベクターを動物細胞に導入するための手法は、実施形態に応じた適切なものとすることができる。例えば、ウイルス感染法、リン酸カルシウム法、リポフェクション法、マイクロインジェクション法、エレクトロポレーション法などの公知の方法により、発現ベクターを動物細胞に導入することができる。発現ベクターは、公知の手段によって、また適宜市販のキットを用いて(その指示書に従って)、各手法における使用に適した形態に調製することができる。
発現ベクターは、ウイルス感染法により動物細胞に導入することができる。ウイルスベクターとしては、例えば、レトロウイルスベクター、レンチウイルスベクター、アデノウイルスベクター、アデノ随伴ウイルスベクターが挙げられる。これらのウイルスベクターを用いる場合は、対応する市販のキットを用いて、所望の外来遺伝子を含むベクター及び各ウイルスのパッケージングベクター(プラスミド)を宿主細胞にトランスフェクションして組換えウイルスを作製した後、得られた組換えウイルスを動物細胞に感染させるようにすればよい。
外来遺伝子が複数の場合、全ての外来遺伝子が1つの発現ベクターに含まれていてもよいし、すべての外来遺伝子がそれぞれ別個の発現ベクターに含まれていてもよいし、複数の外来遺伝子のうちの一部は1つの発現ベクターに含まれ、残りはそれぞれ別個の発現ベクターに含まれていてもよい。1つの発現ベクターに複数の外来遺伝子が含まれる場合、上流側から下流側に向けてどの順序でそれらの外来遺伝子が配置されるかは特に限定されるものではない。
外来遺伝子は、所望のタンパク質又はポリペプチドのアミノ酸配列に応じて、それをコードする塩基配列を有する核酸(ポリヌクレオチド)により構成することができる。当業者であれば、所望のタンパク質(ポリペプチド)を動物細胞において発現させることのできる発現ベクターを設計し、作製することが可能である。発現ベクターが含む核酸は、化学的なDNA合成反応により作製してもよいし、cDNAとして作製(クローニング)してもよい。
発現ベクターは、外来遺伝子に加えて、必要に応じて、プロモーター、ターミネーター、エンハンサー、開始コドン、終止コドン、ポリアデニル化シグナル、核局在化シグナル(NLS)、マルチクローニングサイト(MCS)等の配列を含んでいてもよい。発現ベクターは更に、レポーター遺伝子(例えば、各色の蛍光タンパク質をコードする遺伝子)、薬剤選択遺伝子(例えば、カナマイシン耐性遺伝子、アンピシリン耐性遺伝子、ピューロマイシン耐性遺伝子)、自殺遺伝子(例えば、ジフテリアA毒素、単純ヘルペスチミジンキナーゼ(HSV-TK)、カルボキシペプチダーゼG2(CPG2)、カルボキシルエステラーゼ(CA)、シトシンデアミナーゼ(CD)、チトクロームP450(cyt-450)、デオキシシチジンキナーゼ(dCK)、ニトロレダクターゼ(NR)、プリンヌクレオシドホスホリラーゼ(PNP)、チミジンホスホリラーゼ(TP)、水痘帯状疱疹ウイルスチミジンキナーゼ(VZV-TK)、キサンチン-グアニンホスホリボシルトランスフェラーゼ(XGPRT)、誘導性カスパーゼ9(inducible caspase 9)などをコードする遺伝子)のような“機能的遺伝子”をコードする核酸(塩基配列)を含んでいてもよい。
「核酸」とは、モノマーヌクレオチド、又はヌクレオチド及び該ヌクレオチドと同等の機能を有する分子が重合した分子であればいかなるものでもよく、例えば、リボヌクレオチドの重合体であるRNA、デオキシリボヌクレオチドの重合体であるDNA、リボヌクレオチド及びデオキシリボヌクレオチドが混合した重合体、及びヌクレオチド類似体を含むヌクレオチド重合体を挙げることができ、さらに、核酸誘導体を含むヌクレオチド重合体であってもよい。核酸は、一本鎖核酸又は二本鎖核酸であってもよい。二本鎖核酸には、一方の鎖に対し、他方の鎖がストリンジェントな条件でハイブリダイズする二本鎖核酸も含まれる。
ヌクレオチド類似体としては、RNA又はDNAと比較して、ヌクレアーゼ耐性の向上又は、安定化させるため、相補鎖核酸とのアフィニティーを上げるため、あるいは細胞透過性を上げるため、あるいは可視化させるために、リボヌクレオチド、デオキシリボヌクレオチド、RNA又はDNAに修飾を施した分子であればいかなる分子でもよい。ヌクレオチド類似体としては、天然に存在する分子でも非天然の分子でもよく、例えば、糖部修飾ヌクレオチド類似体(例:2’-O-メチルリボースで置換されたヌクレオチド類似体、2’-O-プロピルリボースで置換されたヌクレオチド類似体、2’-メトキシエトキシリボースで置換されたヌクレオチド類似体、2’-O-メトキシエチルリボースで置換されたヌクレオチド類似体、2’-O-[2-(グアニジウム)エチル]リボースで置換されたヌクレオチド類似体、2’-フルオロリボースで置換されたヌクレオチド類似体、架橋構造型人工核酸(BNA:Bridged Nucleic Acid)、ロックド人工核酸(LNA:Locked Nucleic Acid)、エチレン架橋構造型人工核酸(ENA:Ethylene bridged nucleic acid)、ペプチド核酸(PNA)、オキシペプチド核酸(OPNA)、ペプチドリボ核酸(PRNA))、リン酸ジエステル結合修飾ヌクレオチド類似体(例:ホスフォロチオエート結合に置換されたヌクレオチド類似体、N3’-P5’ホスフォアミデート結合に置換されたヌクレオチド類似体)等が挙げられる。
核酸誘導体としては、核酸に比べ、ヌクレアーゼ耐性を向上させるため、安定化させるため、相補鎖核酸とのアフィニティーを上げるため、細胞透過性を上げるため、あるいは可視化させるために、該核酸に別の化学物質を付加した分子であればいかなる分子でもよく、その具体例としては、5’-ポリアミン付加誘導体、コレステロール付加誘導体、ステロイド付加誘導体、胆汁酸付加誘導体、ビタミン付加誘導体、Cy5付加誘導体、Cy3付加誘導体、6-FAM付加誘導体、ビオチン付加誘導体等を挙げることができる。
本発明の別の実施態様において、外来遺伝子に代えてタンパク質、siRNA、shRNA、dsRNA、miRNA、アンチセンス核酸などを動物細胞に導入してもよく、外来遺伝子以外にもこれらのものを動物細胞に導入しても培養上清の成分を測定することにより細胞の遺伝子導入率の測定が可能となる。
工程(1)の培養で使用される培地は、動物細胞の培養に用いられる培地を基礎培地として使用することができる。基礎培地としては、動物細胞の培養に使用できるものであれば特に限定されず、例えば、AIMV、X-VIVO-15、NeuroBasal、EGM2、TeSR、BME、BGJb、CMRL 1066、グラスゴーMEM、改良MEM亜鉛オプション、IMDM、199培地、イーグルMEM、αMEM、DMEM、Ham、RPMI-1640、フィッシャー培地、T細胞培養用の市販の各種製品(例えば、CTSTM OpTmizerTM T-Cell Expansion Basal Medium(Thermo Fisher Scientific社)、CTS OpTmizer Pro Serum Free Medium(Thermo Fisher Scientific社)、CTS OpTmizer ProTM(Thermo Fisher Scientific社)、CTSTM OpTmizerTM T-Cell Expansion Supplement(Thermo Fisher Scientific社)、4Cell Nutri-T GMPリンパ球用培地(Sartorius社)、PRIME-XV T Cellシリーズ(富士フイルム和光純薬株式会社)、ImmunoCult-XF T cell expansion medium(株式会社ベリタス)、RPMI 1640 Mediumシリーズ(Thermo Fisher Scientific社)、iMediam for T培地(株式会社GCリンフォテック)、TexMACSTM Medium(Miltenyi Biotec社)、ExcellerateTM T Cell Expansion Media, Xeno-Free(R&D Systems社)など)、NK細胞の市販培地(例えば、LGM-3(ロンザ株式会社)、X-VIVOTM 15無血清リンパ球培地(ロンザ株式会社)、Advanced RPMI 1640 Medium(Thermo Fisher Scientific社)、EALITM 515-NKシリーズ(株式会社ボルドバイオテクノロジー)、ExCellerateTM Human NK Cell Expansion Media, Xeno-Free(R&D Systems社)、またNK細胞拡大培養用KitであるBINKIT内のNK Cell Initial Medium及びNK Cell Subculture Medium(株式会社日本バイオセラピー研究所)、KBN NK Kit内のKBM NKCC-1,-2(コージンバイオ株式会社)など)が挙げられる。培地は、血清を含有していてもよいし、無血清でもよい。培地はまた、血清代替物(例えば、アルブミン、トランスフェリン、Knockout Serum Replacement(KSR)、CTS Immune Cell SR(Thermo Fisher Scientific社)、脂肪酸、インスリン、コラーゲン前駆体、微量元素、2-メルカプトエタノール、3’-チオールグリセロール、ITS-サプリメント、B27(商標)サプリメント等)を含有していてもよい。さらに、培地には、脂質、アミノ酸(非必須アミノ酸等)、L-グルタミン、ビタミン、増殖因子、サイトカイン、抗生物質、抗酸化剤、ピルビン酸、緩衝剤、無機塩類などの1つ以上の物質も含有することができる。培地のpHは、培養開始時は、通常7.0~7.8、好ましくは7.2~7.6である。培養開始後は培養する細胞の種類及び培養期間によって変化するが、例えば6.8~7.8である。培地は、使用前にはコンタミネーションを防止するため、濾過、紫外線照射、加熱滅菌、放射線照射等の方法により好ましくは滅菌される。培養条件は、特に制限されず、培養温度は、例えば、37~42℃程度、好ましくは37~39℃程度であり、CO2濃度は、例えば2%~10%、好ましくは2~5%であり、酸素濃度は、例えば1~20%、好ましくは5~20%である。
「培養上清の成分」としては、遺伝子導入率及び/又は遺伝子導入細胞数の予測に使用することができるものであれば特に限定されない。培養上清の成分としては、例えば、培養上清のpH、代謝物、細胞外小胞などが挙げられる。なお、本発明において、培養上清の成分には、培養上清のpHも含まれるものとする。代謝物としては、例えば、有機酸、糖類、脂質、ビタミン、アミン類、核酸類、アミノ酸、その他代謝物イオンなどが挙げられる。
代謝物における有機酸としては、例えば、デセン酸、ラウリン酸、ドデセン酸、ミリスチン酸、ミリストレイン酸、パルミチン酸、パルミトレイン酸、ヘキサデカジエン酸、ステアリン酸、オレイン酸、バクセン酸、リノール酸、γ-リノレン酸、α-リノレン酸、エレオステアリン酸、アラキジン酸、エイコセン酸、エイコサジエン酸、ミード酸、アラキドン酸、ベヘン酸、ドコサペンタエン酸、ドコサヘキサエン酸、リグノセリン酸、ネルボン酸、2-ヒドロキシ吉草酸、2-オキソグルタル酸、インドキシル硫酸、4-ピリドキシ酸、硫酸4エチルフェニル、アジピン酸、クエン酸、cis-アコニット酸、イソクエン酸、オキサロコハク酸、オキサロ酢酸、フマル酸、コハク酸、乳酸、リンゴ酸、フェニル乳酸、パントテン酸、ピペコリン酸、ピルビン酸、タルトロン酸、パラクレゾール硫酸、キサンツレン酸などが挙げられる。有機酸としては、中でも、乳酸、2-ヒドロキシ吉草酸、インドキシル硫酸、4-ピリドキシ酸、フェニル乳酸、キサンツレン酸が好ましい。
代謝物における糖類としては、例えば、フルクトース、イノシトール、ガラクトース、グルコース、スクロース、マルトース、ラクトースなどが挙げられる。糖類としては、中でも、グルコース、フルクトースが好ましい。
代謝物における脂質としては、例えば、セラミド、Hex2-セラミド、Hex-セラミド、コレステロール、コレステロール硫酸塩、カルジオリピン、モノグリセロール、ジグリセロール、リゾホスファチジルコリン、リゾホスファチジルエタノールアミン、リゾホスファチジルグリセロール、リゾホスファチジルイノシトール、リゾホスファチジルセリン、ホスファチジン酸、ホスファチジルコリン、ホスファチジルエタノールアミン、ホスファチジルグリセロール、ホスファチジルイノシトール、ホスファチジルセリン、スフィンゴミエリン、ジヒドロスフィンゴミエリン、トリグリセリド、グリセロール3リン酸、ガングリオシドGM3などが挙げられる。脂質としては、より具体的には、セラミド(16:0)、Hex2-セラミド((16:0)、及び(24:1))、Hex-セラミド((16:0)、及び(24:1))、コレステロール、コレステロール硫酸塩、カルジオリピン((aaaa-70:5)、(aaaa-70:6)、(aaaa-72:6)、及び(aaaa-72:7))、モノグリセロール((e-16:0)、(a-16:1)、(a-18:1)、及び(a-20:0))、リゾホスファチジルコリン((a-14:0)、(a-16:0)、(a-16:1)、(a-18:0)、(a-18:1)、(a-18:2)、及び(a-20:4))、リゾホスファチジルエタノールアミン((a-18:0)、(a-18:1)、及び(a-20:4))、ホスファチジン酸((aa-32:0)、(aa-32:1)、(aa-34:1)、(aa-36:1)、(aa-36:2)、及び(aa-36:3))、ホスファチジルコリン((aa-28:0)、(aa-30:0)、(aa-30:1)、(aa-32:0)、(aa-32:1)、(aa-32:2)、(aa-34:0)、(aa-34:1)、(aa-34:2)、(aa-36:1)、(aa-36:2)、(aa-36:3)、(aa-36:4)、(aa-36:6)、(aa-38:1)、(aa-38:2)、(aa-38:3)、(aa-38:4)、(aa-38:5)、(aa-38:6)、(aa-38:7)、(aa-40:2)、(aa-40:3)、 (aa-40:4)、(aa-40:5)、(aa-40:6)、(aa-40:7)、(aa-42:5)、(aa-42:6)、(aa-42:7)、(ae-26:0)、(ae-28:0))、(ae-30:0)、(ae-32:0)、(ae-32:1)、(ae-34:0)、(ae-34:1)、(ae-34:2)、(ae-36:2)、(ae-36:3)、(ae-36:4)、(ae-38:4)、及び(ae-38:5))、ホスファチジルエタノールアミン((aa-28:0)、(aa-30:0)、(aa-30:1)、(aa-32:0)、(aa-32:1)、(aa-32:2)、(aa-34:0)、(aa-34:1)、(aa-34:2)、(aa-34:3)、(aa-34:4)、(aa-36:1)、(aa-36:2)、(aa-36:3)、(aa-36:4)、(aa-36:5)、(aa-38:2)、(aa-38:3)、(aa-38:4)、(aa-38:5)、(aa-38:6)、(aa-38:7)、(aa-40:3)、(aa-40:4)、(aa-40:5)、(aa-40:6)、(aa-40:7)、(aa-40:8)、(ae-32:1)、(ae-32:2)、(ae-34:1)、(ae-34:2)、(ae-34:3)、(ae-34:4)、(ae-36:2)、(ae-36:3)、(ae-36:4)、(ae-36:5)、(ae-36:6)、(ae-38:3)、(ae-38:4)、(ae-38:5)、(ae-38:6)、(ae-38:7)、(ae-40:5)、(ae-40:6)、(ae-40:7)、及び(ae-40:8))、ホスファチジルグリセロール((aa-32:0)、(aa-32:1)、(aa-34:1)、(aa-34:2)、(aa-36:1)、(aa-36:2)、及び(aa-36:3))、ホスファチジルイノシトール((aa-32:1)、(aa-34:1)、(aa-34:2)、(aa-36:1)、(aa-36:2)、(aa-36:3)、(aa-38:2)、(aa-38:3)、(aa-38:4)、(aa-38:5)、(aa-38:6)、(aa-40:3)、(aa-40:4)、(aa-40:5)、及び(aa-40:6))、ホスファチジルセリン((aa-32:1)、(aa-34:0)、(aa-34:1)、(aa-34:2)、(aa-36:1)、(aa-36:2)、(aa-36:3)、(aa-38:2)、(aa-38:3)、(aa-38:4)、(aa-38:5)、(aa-40:4)、及び(aa-40:5))、スフィンゴミエリン((14:0)、(16:0)、(16:1)、(18:0)、(20:0)、(22:0)、(22:1)、(24:0)、(24:1)、(24:2)、(24:3)、(26:1)、及び(26:2))、ジヒドロスフィンゴミエリン(16:0)、トリグリセリド((aaa-42:0)、(aaa-44:0)、(aaa-44:2)、(aaa-46:0)、(aaa-46:1)、(aaa-46:2)、(aaa-48:0)、(aaa-48:1)、(aaa-48:3)、(aaa-50:0)、(aaa-50:1)、(aaa-50:2)、(aaa-50:3)、(aaa-50:4)、(aaa-52:1)、(aaa-52:2)、(aaa-52:3)、(aaa-52:4)、(aaa-52:5)、(aaa-54:1)、(aaa-54:2)、(aaa-54:3)、(aaa-54:4)、(aaa-54:5)、(aaa-54:6)、(aaa-54:7)、(aaa-56:3)、(aaa-56:4)、(aaa-56:5)、(aaa-56:6)、(aaa-56:7)、(aaa-56:8)、(aaa-58:4)、(aaa-58:5)、(aaa-58:6)、(aaa-58:7)、(aaa-58:8)、(aaa-58:9)、(aaa-60:7)、及び(aaa-60:8))、グリセロール3リン酸、ガングリオシドGM3((16:0)及び(24:1))などが挙げられる。脂質としては、中でも、コレステロール硫酸塩、FFA(C10:1)、FFA(C16:2)、FFA(C22:5)、MG(a-16:1)、PC(aa-28:0)、PC(aa-30:0)、PC(aa-30:1)、PC(aa-32:1)、PC(aa-34:2)、PE(aa-34:2)、PE(aa-36:2)、PE(aa-36:3)、SM(16:0)が好ましい。
代謝物におけるビタミンとしては、例えば、αトコフェロール、ニコチンアミド、コリン、レチノール、エルゴカルシフェロール、コレカルシフェロール、トコトリエノール、フィロキノン、メナキノン、チアミン、リボフラビン、ニコチン酸、パントテン酸、ピリドキサール、ピリドキサミン、ピリドキシン、ビオチン、葉酸、シアノコバラミン、メチルコバラミン、ヒドロキソコバラミン、アスコルビン酸などが挙げられる。
代謝物におけるアミン類としては、例えば、エタノールアミン、エタノールアミンリン酸などが挙げられる。
代謝物における核酸類としては、例えば、アデノシン、メチルチオアデノシン、グアノシン、5-メチルウリジン、ウリジン、シチジンなどが挙げられる。核酸類としては、中でも、メチルチオアデノシンが好ましい。
代謝物におけるアミノ酸としては、例えば、アシルカルニチン(例えば、アシルカルニチン(C5:0))、アラニン、アルギニン、アスパラギン、アスパラギン酸、β-アラニン、システイン、システイン-HPE-AM、システイン-SS-HPE-AM、ジメチルグリシン、グルタミン酸、グルタミン、グリシン、イソロイシン、ロイシン、ロイシン酸、リシン、メチオニン、ホモシステイン-HPE-AM、N-アセチル-β-アラニン、N-アセチルシステイン、N-アセチルセリン、N-アセチルトリプトファン、N-カルバモイル-アスパルテート、O-アセチルセリン、オルニチン、ピログルタミン酸、フェニルアラニン、プロリン、セリン、S-スルフォシステイン、タウリン、スレオニン、トリプトファン、チロシン、バリンなどが挙げられる。アミノ酸としては、中でも、アラニン、アルギニン、システイン-SS-HPE-AM、ロイシン酸、N-アセチルシステイン、N-アセチルセリン、ピログルタミン酸、S-スルフォシステインが好ましい。
代謝物におけるその他代謝物イオンとしては、例えば、アンモニウムイオン、カリウムイオン、カルシウムイオン、ナトリウムイオン、ピロリン酸、硫酸、亜硫酸、フェノール硫酸、SS-bis-HPE-AMなどが挙げられる。その他代謝物イオンとしては、中でも、アンモニウムイオン、カリウムイオン、カルシウムイオン、SS-bis-HPE-AMが好ましい。
細胞外小胞は、さまざまな種類の細胞から分泌、放出等される膜構造を有する微小な小胞である。細胞外小胞は、タンパク質、microRNA、mRNA等の機能分子を包含して種々の細胞から分泌され、生体内の細胞間コミュニケーションの媒介役として機能することが知られている。細胞外小胞としては、例えば、エクソソーム、マイクロベシクル、アポトーシス小体等が挙げられる。エクソソームの大きさは例えば直径30nm~100nm程度であり、マイクロベシクルの大きさは例えば直径100nm~1.0μm程度であり、アポトーシス小体の大きさは例えば直径1.0μm~5.0μm程度である。細胞外小胞は、培養上清から、公知の方法に従って又は準じて、精製、分離、濃縮することができ、そのような方法としては、例えば、超遠心法(例えばペレットダウン法、スクロースクッション法、密度勾配遠心法等)、イムノアフィニティー担体を用いる方法、ゲルろ過法、フィールド・フロー分画法、FACS法等が挙げられる。また、細胞外小胞の精製、分離、濃縮は、市販のキットなどを用いて行うことも可能である。細胞外小胞としては、エクソソームが好ましい。
培養上清の成分を測定する方法としては、培養上清の成分を測定(特に、定量)することができるものであれば特に限定されず、例えば、各種市販の測定装置を使用して測定する方法、各種市販の測定試薬及び測定キットを使用して測定する方法などが挙げられる。また、培養上清の成分の測定は、ラマン分光法により行うこともできる。培養上清の細胞外小胞の測定について、粒子を物理的に評価する場合の基本的パラメーターは、粒径とゼータ電位であり、粒径解析装置としては、透過型電子顕微鏡(TEM)、液中原子間力顕微鏡(AFM)、ナノ粒子追跡解析(NTA)及びコールターカウンター方式による粒径解析装置、フローサイトメーターなどが挙げられる。そして、細胞外小胞の構成成分であるタンパク質、microRNA、mRNA等については、トランスクリプトーム、プロテオーム等の、いわゆるオミクス解析で用いられている種々の手法(例えば、マイクロアレイ、シーケンサー、ウエスタンブロット、質量分析法等)を使用することができる。細胞外小胞の測定では、細胞外小胞(特にエクソソーム)の粒子径を測定することが好ましく、また細胞外小胞(特にエクソソーム)に包含されるタンパク質を測定することも好ましい。
上記のような培養上清の代謝物の測定装置としては、例えば、FLEX2(Novo biomedical社)、STAT PROFILE Primeシリーズ(Novo biomedical社)、Cedex分析装置シリーズ(Roche Diagnostics社)、ABL800 FLEX血液ガス分析装置シリーズ(RADIOMETER社)、REBEL細胞培養成分分析計(株式会社エス・ティ・ジャパン)、バイオフローBFシリーズ(王子計測機器株式会社)、ラッピドポイント500e血液ガス分析装置(SIEMENS Healthineers社)、細胞外フラックスアナライザーXFシリーズ(プライムテック株式会社)などが挙げられる。培養上清のpHの測定装置としては、例えば、各種市販のpHメーターなどが挙げられる。培養上清の細胞外小胞の測定装置としては、例えば、ナノ粒子解析システム NANOSIGHTシリーズ(日本カンタム・デザイン株式会社)、EXOVIEW IMAGER(Quntum Design社)、ExoCounter(シスメックス株式会社)、VIDEODROPナノ粒子イメージングアナライザー(メイワフォーシス株式会社)、NanoFCM(メイワフォーシス株式会社)、Exoidナノ粒子マルチアナライザー(メイワフォーシス株式会社)、ZE5 Cell Analyzerシリーズ(Bio-Rad Laboratories社)、CytoFLEXシリーズ(Thermo Fisher Scientific社)、BD FACSymphonyTM シリーズ(BD Bioscience)、ナノ粒子径・濃度カウンターnCS1(Spectradyne社)、ディスク遠心式粒子径分布測定装置 CPS Disc Centrifugeシリーズ(CPS Instruments社)、レーザー回折・散乱式粒子径分布測定装置 Bettersizer2600(Betterisize社)などが挙げられる。ラマン分光法による測定装置としては、例えば、RamanRxn Systemsシリーズ(Endless+Hauser社)、LabRAM HR Evolution、LC-Raman System、AFM Raman、LabRAM Soleil、XploRA PLUS、Standard Microscope Spectroscopy Systems(株式会社堀場製作所)、inViaシリーズ、Virsaファイバーラマン装置、RA816、RA802(Renishaw社)TRS100、RapID、Vaya(Agilent Technologies社)、ProCellics(Merck Millipore社)、Ramina Process Analyzer(Thermo Fisher Scientific社)、BioPAT Spectro(Sartorius社)、BRAVO、SENTERRAII、MultiRAM、RAM II(Bruker社)などが挙げられる。測定装置による培養上清の成分の測定は、公知の方法に従い実施することができ、例えば、測定装置のマニュアルに従って実施することができる。
・工程(2)
工程(2)では、工程(1)で測定した値に基づいて遺伝子導入率及び/又は遺伝子導入細胞数の予測を行う。
工程(2)では、工程(1)で測定した値に基づいて遺伝子導入率及び/又は遺伝子導入細胞数の予測を行う。
後述する実施例において、培養上清の成分の測定値(pH、濃度など)と遺伝子導入率及び/又は遺伝子導入細胞数が相関していることが確認されているので、培養上清の成分の測定値を使用することで遺伝子導入率び/又は遺伝子導入細胞数の予測を行うことができる。本発明において「予測」とは、「測定」と同じ意味で使用され、互換的に使用され得る。
培養上清の成分の測定値を細胞集団の遺伝子導入率及び/又は遺伝子導入細胞数の予測に使用する方法としては、例えば、遺伝子導入率及び/又は遺伝子導入細胞数が既知の細胞における遺伝子導入率及び/又は遺伝子導入細胞数と培養上清の成分の測定値とに基づいて検量線を作成し、当該検量線を用いて工程(1)で測定した値から得られたパラメーターから遺伝子導入率及び/又は遺伝子導入細胞数を決定することが挙げられる。検量線は、最小二乗法などの常法によりソフトウェアなどを使用して作成することができる。
工程(2)において、培養上清の1種類の成分に基づいて遺伝子導入率及び/又は遺伝子導入細胞数の予測を行ってもよいし、培養上清の2種以上の成分の組合せに基づいて遺伝子導入率及び/又は遺伝子導入細胞数の予測を行ってもよい。培養上清の2種以上の成分の組合せを用いる場合、組合せは3種以上、4種以上、5種以上、6種以上、7種以上、8種以上、9種以上、10種以上などが挙げられ、上限は特に限定されず、例えば、30種以下、20種以下、10種以下などが挙げられる。
培養上清の代謝物である、グルタミン、グルコース、カリウムイオン、カルシウムイオンは遺伝子導入率及び遺伝子導入細胞数と負の相関があり、乳酸、アンモニウムイオン、PC(aa-28:0)、PC(aa-30:0)、PC(aa-30:1)、PC(aa-32:1)、PC(aa-34:2)、PC(aa-36:2)、PC(aa-36:3)、FFA(C10:1)、フェニル乳酸は遺伝子導入細胞数と正の相関がある。また、培養上清のpHは、遺伝子導入率及び遺伝子導入細胞数と負の相関がある。
培養日数ごとで、例えば、グルタミン、グルタミン酸、グルコース、カリウムイオン、カルシウムイオン、乳酸、アンモニウムイオン、pH、PC(aa-28:0)、PC(aa-30:0)、PC(aa-30:1)、PC(aa-32:1)、PC(aa-36:2)、FFA(C10:1)、フェニル乳酸などを単独で細胞集団の遺伝子導入率及び/又は遺伝子導入細胞数の予測に使用できる。培養日数ごとでは細胞集団の遺伝子導入率及び/又は遺伝子導入細胞数の予測を行う場合は、複数の成分を組み合わせて予測を行うこともできる。そのような予測に使用する成分としては、例えば、アラニン、アルギニン、N-アセチルシステイン、S-メチル-5-チオアデノシン、インドキシル硫酸、SS-bis-HPE-AM、N-アセチルセリン、2-ヒドロキシ吉草酸、PC(aa-28:0)、PC(aa-30:0)、PC(aa-30:1)、PC(aa-32:1)、PE(aa-34:2)、PE(aa-36:2)、PE(aa-36:3)、FFA(C10:1)、FFA(C16:2)、FFA(C22:5)、乳酸、ロイシン酸、フェニル乳酸、SM(16:0)、フルクトース、4-ピリドキシ酸、MG(a-16:1)、キサンツレン酸、ピログルタミン酸、S-スルホシステイン、コレステロール硫酸塩などが挙げられる。
培養日数にかかわらず細胞集団の遺伝子導入率及び/又は遺伝子導入細胞数の予測を行う場合は、PC(aa-28:0)、PC(aa-30:0)、PC(aa-30:1)、PC(aa-32:1)、PC(aa-34:2)、PC(aa-36:2)、PC(aa-36:3)、FFA(C10:1)、フェニル乳酸などを単独で細胞集団の遺伝子導入率及び/又は遺伝子導入細胞数の予測に使用できる。培養日数にかかわらず細胞集団の遺伝子導入率及び/又は遺伝子導入細胞数の予測を行う場合は、複数の成分を組み合わせて予測を行うことが好ましい。そのような予測に使用する成分としては、例えば、PC(aa-28:0)、PC(aa-30:0)、PC(aa-30:1)、PC(aa-32:1)、PC(aa-34:2)、PE(aa-34:2)、PE(aa-36:2)、PE(aa-36:3)、FFA(C10:1)、FFA(C16:2)、乳酸、ロイシン酸、フェニル乳酸、システイン-SS-HPE-AMなどが挙げられる。
培養上清の2種以上の成分の組合せに基づいて遺伝子導入率及び/又は遺伝子導入細胞数の予測を行う場合は、例えば、多変量解析により予測を行うことができ、特に回帰分析により得られた予測モデルを用いる方法が挙げられる。そのような回帰分析の方法としては、回帰分析を行えるものであればよく、例えば、ラッソ回帰、PLS(Partial Least Squares)、OPLS(Orthogonal Partial Least Squares)、リッジ回帰、エラスティックネット回帰、主成分回帰、部分最小二乗回帰、ランダムフォレスト、ニューラルネットワーク、ディープラーニング、サポートベクターマシーンなどが挙げられる。また、これらの回帰分析の結果から変数重要度の高い成分を選択することが可能であり、このように選択された成分を予測に使用することができる。多変量解析を行う場合は、このような変数重要度が高くない成分であったとしても、多変量解析で使用することで精度向上に寄与する。そのため、変数重要度が高くない成分、単独では遺伝子導入率及び/又は遺伝子導入細胞数と相関を示さない成分であっても、遺伝子導入率及び/又は遺伝子導入細胞数の予測に使用可能である。
後述する実施例において、培養上清の細胞外小胞の測定値(特にエクソソームの粒子径、エクソソームタンパク質のプロファイル)と遺伝子導入率及び/又は遺伝子導入細胞数が相関していることが確認されているので、培養上清の細胞外小胞の測定値を使用することで遺伝子導入率及び/又は遺伝子導入細胞数の予測を行うことができる。細胞外小胞の粒子径は遺伝子導入率及び遺伝子導入細胞数と負の相関がある。細胞外小胞に包含されるタンパク質としては、例えば図16Cに記載のタンパク質などを単独で又は2種以上組み合わせて細胞集団の遺伝子導入率及び/又は遺伝子導入細胞数の予測に使用できる。
後述する実施例において、培養上清の成分のラマン分光法による測定値(ラマン分光スペクトル)と遺伝子導入率及び/又は遺伝子導入細胞数が相関していることが確認されているので、培養上清の成分のラマン分光法による測定値を使用することで遺伝子導入率及び/又は遺伝子導入細胞数の予測を行うことができる。例えば、ラマン分光スペクトルのピークの高さを細胞集団の遺伝子導入率及び/又は遺伝子導入細胞数の予測に使用できる。
工程(2)において、遺伝子導入前後の培養上清の成分の変化を遺伝子導入率及び/又は遺伝子導入細胞数の予測に使用することもできる。後述する実施例において、遺伝子導入前後で培養上清の成分が変化していることが示されている。
遺伝子(例;キメラ抗原受容体をコードする核酸)導入細胞がαβT細胞である場合、工程(1)で測定する成分としては乳酸、アンモニウムイオン、pH、グルタミン、グルコース、Phenyllactic acid、FFA(C10:1)、PC(aa-28:0)、PC(aa-30:0)、PC(aa-30:1)、PC(aa-32:1)、PE(aa-34:2)、PE(aa-36:2)及びPE(aa-36:3) からなる群から選択される少なくとも1種が好ましく、乳酸、アンモニウムイオン、pH、グルタミン及びグルコースからなる群から選択される少なくとも1種がより好ましい。
遺伝子(例;キメラ抗原受容体をコードする核酸)導入細胞がNK細胞である場合、工程(1)で測定する成分としては乳酸、アンモニウムイオン、グルコース、グルタミン酸、ナトリウムイオン及びpHからなる群から選択される少なくとも1種が好ましい。
遺伝子(例;キメラ抗原受容体をコードする核酸)導入細胞がgdT細胞である場合、工程(1)で測定する成分としては乳酸が好ましい。
本発明の遺伝子導入した細胞製剤の製造方法(本明細書において、単に「本発明の製造方法」と称することがある)は、
(I)動物細胞が培養された培養上清の成分を測定し、測定した値に基づいて遺伝子導入率及び/又は遺伝子導入細胞数を測定する工程
を含むことを特徴とする。
(I)動物細胞が培養された培養上清の成分を測定し、測定した値に基づいて遺伝子導入率及び/又は遺伝子導入細胞数を測定する工程
を含むことを特徴とする。
本発明の製造方法は、
(II)動物細胞に遺伝子を導入する工程
を更に含んでいてもよい。
(II)動物細胞に遺伝子を導入する工程
を更に含んでいてもよい。
本発明の製造方法の工程(I)及び(II)は、前述する方法により実施することができる。本発明の製造方法により製造される細胞製剤(以下、本発明の細胞製剤と称することがある)は、公知の手段(例えば、日本薬局方に記載の方法等)に従って、有効量の遺伝子導入した動物細胞を薬学的に許容される担体と混合するなどして、非経口製剤として製造することが好ましい。本発明の細胞製剤は、注射剤、懸濁剤、点滴剤等の非経口製剤として製造することが好ましい。非経口的な投与方法としては、静脈内、動脈内、筋肉内、腹腔内、皮下投与などの方法が挙げられる。薬学的に許容される担体としては、例えば、溶剤、基剤、希釈剤、賦形剤、無痛化剤、緩衝剤、保存料、安定剤、懸濁剤、等張化剤、界面活性剤、溶解補助剤等が挙げられる。
本発明の細胞製剤の投与量は、患者の体重、年齢、性別、症状などの種々の条件に応じて適宜決定することができる。また、1回で投与してもよく、複数回にわたって投与してもよい。本発明の細胞製剤は、非経口投与に適した公知の形態、例えば、注射又は注入剤とすることができる。また、本発明の細胞製剤は、細胞を安定に維持するために、生理食塩水、リン酸緩衝生理食塩水(PBS)、培地等を含んでもよい。培地としては、特に限定するものではないが、RPMI、AIM-V、X-VIVO10などの培地が挙げられるが、これらに限定されない。また、該細胞製剤には医薬的に許容される担体(例:ヒト血清アルブミン)、保存剤等が安定化の目的で添加されていてもよい。本発明の細胞製剤は、ヒトを含む哺乳動物に対して適用されるものである。
本発明の遺伝子導入率及び/又は遺伝子導入細胞数の予測方法によれば、フローサイトメトリーなどを使用する従来法では手作業が必要であったのに対して、そのような複雑な工程が必要なく、例えば、必要な操作は測定装置による自動的な測定のみの簡便な操作で細胞の遺伝子導入率及び/又は遺伝子導入細胞数の測定が可能である。さらに、本発明の遺伝子導入率及び/又は遺伝子導入細胞数の予測方法によれば、従来法では6-7時間かかるのに対して、例えば、5分未満の短時間で効率的に細胞の遺伝子導入率の測定が可能となる。また、サンプリングが不要なため撹拌工程がなく細胞へのダメージも少ない。そして、本発明の方法、細胞の種類に特に制限は無く、様々な細胞に適用可能がある。本発明の方法は、CAR-T細胞療法などの遺伝子治療への応用が想定される。
本明細書及び請求の範囲で使用される場合、特に文脈上必要とされない限り、単数形の用語は複数形を含み、複数形の用語は単数形を含むものとする。したがって、単数形の冠詞(例えば、英語の場合は「a」、「an」、「the」など)は、特に言及しない限り、その複数形の概念をも含むことが理解されるべきである。
以下、本発明を更に詳しく説明するため実施例を挙げる。しかし、本発明はこれら実施例等になんら限定されるものではない。
<培地>
CAR-αβT細胞(以下、単にCAR-T細胞とも記載する)及びCAR-gdT細胞培養培地:OpTmizer CTS T-Cell Expansion basal medium(Thermo Fisher Scientific社)に2.6% OpTmizer Expansion Basal Supplement(Thermo Fisher Scientific社), 1% L-Glutamine(Thermo Fisher Scientific社), 1% Streptomycin, 2% CTS Immune Cell SR(Thermo Fisher Scientific社)を添加し、基礎培地を作製した。そこに20 IU/mLもしくは40 IU/mLになるようにMACS GMP IL-2(Miltenyi Biotec社)を添加した。
SK-HEP-1細胞培養培地:MEM, L-Gln(+)(Thermo Fisher Scientific社)に10% FBS(Biosera社), 1% Non-essential amino acids(富士フイルム和光純薬株式会社), 1% Penicillin-Streptomycin solution(富士フイルム和光純薬株式会社), 1 mM Sodium pyruvate(富士フイルム和光純薬株式会社)を添加し作製した。
CAR-αβT細胞(以下、単にCAR-T細胞とも記載する)及びCAR-gdT細胞培養培地:OpTmizer CTS T-Cell Expansion basal medium(Thermo Fisher Scientific社)に2.6% OpTmizer Expansion Basal Supplement(Thermo Fisher Scientific社), 1% L-Glutamine(Thermo Fisher Scientific社), 1% Streptomycin, 2% CTS Immune Cell SR(Thermo Fisher Scientific社)を添加し、基礎培地を作製した。そこに20 IU/mLもしくは40 IU/mLになるようにMACS GMP IL-2(Miltenyi Biotec社)を添加した。
SK-HEP-1細胞培養培地:MEM, L-Gln(+)(Thermo Fisher Scientific社)に10% FBS(Biosera社), 1% Non-essential amino acids(富士フイルム和光純薬株式会社), 1% Penicillin-Streptomycin solution(富士フイルム和光純薬株式会社), 1 mM Sodium pyruvate(富士フイルム和光純薬株式会社)を添加し作製した。
<CAR-T細胞及びCAR-gdT細胞の製造>
Leukopak(Charles River Laboratories社)又はgdT細胞(Charles River Laboratories社)を融解後に、細胞を2.0x10⁶ cells/mL以下になるようにCAR-T細胞及びCAR-gdT細胞培養培地で希釈した(製造前の原材料)。細胞懸濁液: MACS GMP T-Cell TransACT(Miltenyi Biotec社)=17.5:1になるように培養バッグに播種し、36時間超-48時間未満で培養した。培養後の細胞をLOVO Cell processing system(Fresenius Kabi社)もしくは遠心機を用いて培養培地で希釈し、レトロネクチン(商標)(タカラバイオ株式会社)とCAR遺伝子を導入したレトロウイルスで事前にコートしておいた培養バッグに6.07x10⁵ cells/cm2以下で播種し、翌日まで培養した。2.2x106 cells/cm2以下で培養ボトル(G-REX, Wilson Wolf社)に播種し、3-7日間培養し、CAR-T細胞及びCAR-gdT細胞を製造した(増幅工程)。なお、使用したCAR遺伝子は配列番号1に示される塩基配列を有する(以下のSK-HEP-1細胞の場合も同じである)。
Leukopak(Charles River Laboratories社)又はgdT細胞(Charles River Laboratories社)を融解後に、細胞を2.0x10⁶ cells/mL以下になるようにCAR-T細胞及びCAR-gdT細胞培養培地で希釈した(製造前の原材料)。細胞懸濁液: MACS GMP T-Cell TransACT(Miltenyi Biotec社)=17.5:1になるように培養バッグに播種し、36時間超-48時間未満で培養した。培養後の細胞をLOVO Cell processing system(Fresenius Kabi社)もしくは遠心機を用いて培養培地で希釈し、レトロネクチン(商標)(タカラバイオ株式会社)とCAR遺伝子を導入したレトロウイルスで事前にコートしておいた培養バッグに6.07x10⁵ cells/cm2以下で播種し、翌日まで培養した。2.2x106 cells/cm2以下で培養ボトル(G-REX, Wilson Wolf社)に播種し、3-7日間培養し、CAR-T細胞及びCAR-gdT細胞を製造した(増幅工程)。なお、使用したCAR遺伝子は配列番号1に示される塩基配列を有する(以下のSK-HEP-1細胞の場合も同じである)。
<CAR-NK細胞の製造>
PBMC(Charles River Laboratories社)を融解後に、BINKIT(商標) for NK cells expansion from PBMCs(株式会社日本バイオセラピー研究所)を用いて培養し、レトロネクチン(商標)(タカラバイオ株式会社)とCAR遺伝子を導入したレトロウイルスを用いてCAR-NK細胞を製造した。
PBMC(Charles River Laboratories社)を融解後に、BINKIT(商標) for NK cells expansion from PBMCs(株式会社日本バイオセラピー研究所)を用いて培養し、レトロネクチン(商標)(タカラバイオ株式会社)とCAR遺伝子を導入したレトロウイルスを用いてCAR-NK細胞を製造した。
<SK-HEP-1細胞へのCAR遺伝子の導入>
SK-HEP-1細胞(ATCC社)が2.0x10⁶ cells/mL以下になるようにSK-HEP-1細胞培養培地で希釈し、レトロネクチン(タカラバイオ株式会社)とCAR遺伝子を導入したレトロウイルスで事前にコートしておいた培養プレートに6.07x105 cells/cm2以下で播種し、4日間培養することで、SK-HEP-1細胞へCAR遺伝子を導入した。
SK-HEP-1細胞(ATCC社)が2.0x10⁶ cells/mL以下になるようにSK-HEP-1細胞培養培地で希釈し、レトロネクチン(タカラバイオ株式会社)とCAR遺伝子を導入したレトロウイルスで事前にコートしておいた培養プレートに6.07x105 cells/cm2以下で播種し、4日間培養することで、SK-HEP-1細胞へCAR遺伝子を導入した。
<フローサイトメトリーを用いた遺伝子導入効率の測定>
BD FACSCanto IIフローサイトメーター(BD Biosciences社)でCAR抗原を用いて遺伝子導入効率を測定した。
BD FACSCanto IIフローサイトメーター(BD Biosciences社)でCAR抗原を用いて遺伝子導入効率を測定した。
<細胞環境分析装置を用いた培養上清成分の測定>
バイオプロファイルFLEX2(Novo biomedical社)で培養上清の成分を定量化した。
バイオプロファイルFLEX2(Novo biomedical社)で培養上清の成分を定量化した。
<グルコース取り込み能の測定>
グルコース取り込み検出キットGreen(株式会社同仁化学研究所)を用いて、マニュアルに従ってグルコース取り込み能を測定した。
グルコース取り込み検出キットGreen(株式会社同仁化学研究所)を用いて、マニュアルに従ってグルコース取り込み能を測定した。
<メタボローム・リピドーム解析>
培養上清に9倍量のメタノールを添加してボルテックスしてホモジナイズした後、親水性相互作用クロマトグラフィー/タンデム質量分析(HILIC/MS/MS)、リピドミクス、ガスクロマトグラフィー/タンデム質量分析(GC/MS/MS)による分析を行った。
培養上清に9倍量のメタノールを添加してボルテックスしてホモジナイズした後、親水性相互作用クロマトグラフィー/タンデム質量分析(HILIC/MS/MS)、リピドミクス、ガスクロマトグラフィー/タンデム質量分析(GC/MS/MS)による分析を行った。
HILIC/MS/MSでは、100μLのホモジネートを21,500g、4℃で5分間遠心分離した。得られた76μLの上清を4μLの400 mMギ酸アンモニウムと混合した。この混合物をボルテックスし、21,500g、4℃で5分間遠心分離を行った。上清2μLを、UHPLC Nexera液体クロマトグラフィーシステム(株式会社島津製作所)と5500QTRAP質量分析計(AB Sciex Pte社)からなる液体クロマトグラフィー/タンデム質量分析(LC/MS/MS)システムに注入した。クロマトグラフィー分離は、ZIC-cHILICカラム(2.1×100 mm, 3μm, Merck Millipore社)を用いた。代謝物の検出にはSelected reaction monitoring(SRM)を用い、各代謝物の存在量はSRMクロマトグラム上のピーク面積として評価した。
リピドミクスは、ホモジネートを遠心分離して得た上清2μLをUltimate3000 RSLC system(Thermo Fisher Scientific社)とQ Exactive HF-X mass spectrometer(Thermo Fisher Scientific社)からなるLC/MS/MSシステムにより分析した。液体クロマトグラフィーによる分離は、逆相カラムCORTECS T3(2.1×50 mm, 2.7μm, 120Å, Waters社)を用いて実施した。
GC/MS/MS分析は、ホモジネートを遠心分離して得た上清10μLを窒素気流で乾燥させた後、オキシメーションとトリメチルシリル化の2段階の反応により誘導体化して実施した。反応混合物1μLをGCインジェクター80オートサンプラー(Agilent Technologies社)を用いてAgilent 7890Bシリーズガスクロマトシステムに注入した。ガスクロマトグラフによる分離は、J&W Scientific DB-5MS-DG カラム(30 m×0.25 mm i.d., df = 0.25μm, Agilent Technologies社)により実施した。各標的分子をSRMで検出し、そのピーク面積をMassHunterソフトウェア(Agilent Technologies社)で評価した。
<メタボローム・リピドームデータの統計解析>
統計解析ソフトRを用い、メタボローム・リピドーム解析で取得した培養上清の代謝物の測定データについて統計解析を行った。遺伝子導入をしていないT細胞(UTD)とCAR-T細胞の上清成分の差について、UTDを対照群としたときに、各成分との差がCAR導入率に応じて大きくなると仮定してWilliams検定を行った。また、全代謝物について、各代謝物ごとにCAR細胞数との単回帰分析を行った。また、多変量解析としてLASSO回帰、OPLS回帰を行い、CAR細胞数への回帰に寄与する成分の選択もしくは変数重要度を分析した。回帰については、増幅工程中の各日程ごと、及び全日程での測定値について解析した。
統計解析ソフトRを用い、メタボローム・リピドーム解析で取得した培養上清の代謝物の測定データについて統計解析を行った。遺伝子導入をしていないT細胞(UTD)とCAR-T細胞の上清成分の差について、UTDを対照群としたときに、各成分との差がCAR導入率に応じて大きくなると仮定してWilliams検定を行った。また、全代謝物について、各代謝物ごとにCAR細胞数との単回帰分析を行った。また、多変量解析としてLASSO回帰、OPLS回帰を行い、CAR細胞数への回帰に寄与する成分の選択もしくは変数重要度を分析した。回帰については、増幅工程中の各日程ごと、及び全日程での測定値について解析した。
<エクソソームの粒子計解析>
培養上清中のエクソソームをMagCaptureTM Exosome Isolation Kit PS ver.2(富士フイルム和光純薬株式会社)を用いて単離した。その後、ナノサイトLM10(日本カンタム・デザイン株式会社)を用いて粒子径を測定した。
培養上清中のエクソソームをMagCaptureTM Exosome Isolation Kit PS ver.2(富士フイルム和光純薬株式会社)を用いて単離した。その後、ナノサイトLM10(日本カンタム・デザイン株式会社)を用いて粒子径を測定した。
<エクソソームのプロテオーム解析>
培養上清中のエクソソームをMagCaptureTM Exosome Isolation Kit PS ver.2(富士フイルム和光純薬株式会社)を用いて単離した。エクソソーム懸濁液に8倍容の冷アセトン(富士フイルム和光純薬株式会社)を添加してから-20℃の条件下で一晩静置した。遠心処理(15,000×g、4℃、20分間)によって生じた上清を除去し、沈殿は冷アセトンに懸濁した。懸濁液を転倒混和後に再び遠心し(15,000×g、4℃、5分間)、上清を除去した。最後に沈殿を風乾した(室温で30分間静置)。乾燥した沈殿物を可溶化緩衝液[8M尿素(富士フイルム和光純薬株式会社)、50 mM Tris-HCl, pH 8.0(株式会社ニッポンジーン、312-90061)]10μLに溶解した(タンパク質溶解液)。タンパク質溶解液の全量をトリプシン(Promega社)による加水分解に供した。すなわち、タンパク質溶解液に100 mMジチオトレイトール(DTT)(富士フイルム和光純薬株式会社)溶液1.1μLを加え37℃で30分間保温した(DTT終濃度: 10 mM)。続いて250 mMヨードアセトアミド(IAA)(富士フイルム和光純薬株式会社、095-02151)溶液1.2μLを加え暗所で20分間静置した(IAA終濃度: 25 mM)(還元アルキル化)。還元アルキル化処理後に50 mM Tris-HCl(pH 8.0)を27.7μL加えて溶液の尿素濃度を2 Mまで下げた。最後に1μg/μLトリプシン溶液1μLを加え、37℃で16時間保温して加水分解反応をおこなった(トリプシン終濃度24.4 ng/μL)。反応後のペプチド溶液にはC18 + SDB STAGE Tipによる脱塩処理を施した(Rappsilber, J. et al., Anal. Chem. 2003, 75: 663-70)。脱塩処理後の試料を減圧下で乾燥した。乾燥済みのペプチド試料を、水(富士フイルム和光純薬株式会社、210-01303)、アセトニトリル(同、018-19853)及びトリフルオロ酢酸(同、204-02743)からなる溶媒(体積比98:2:0.1)を用いて溶解した。溶解の際は、総タンパク質量(2μg相当分)から計算して0.1μg/μLになるように添加溶媒の容積を調整し、LC-MS/MSに供した。
培養上清中のエクソソームをMagCaptureTM Exosome Isolation Kit PS ver.2(富士フイルム和光純薬株式会社)を用いて単離した。エクソソーム懸濁液に8倍容の冷アセトン(富士フイルム和光純薬株式会社)を添加してから-20℃の条件下で一晩静置した。遠心処理(15,000×g、4℃、20分間)によって生じた上清を除去し、沈殿は冷アセトンに懸濁した。懸濁液を転倒混和後に再び遠心し(15,000×g、4℃、5分間)、上清を除去した。最後に沈殿を風乾した(室温で30分間静置)。乾燥した沈殿物を可溶化緩衝液[8M尿素(富士フイルム和光純薬株式会社)、50 mM Tris-HCl, pH 8.0(株式会社ニッポンジーン、312-90061)]10μLに溶解した(タンパク質溶解液)。タンパク質溶解液の全量をトリプシン(Promega社)による加水分解に供した。すなわち、タンパク質溶解液に100 mMジチオトレイトール(DTT)(富士フイルム和光純薬株式会社)溶液1.1μLを加え37℃で30分間保温した(DTT終濃度: 10 mM)。続いて250 mMヨードアセトアミド(IAA)(富士フイルム和光純薬株式会社、095-02151)溶液1.2μLを加え暗所で20分間静置した(IAA終濃度: 25 mM)(還元アルキル化)。還元アルキル化処理後に50 mM Tris-HCl(pH 8.0)を27.7μL加えて溶液の尿素濃度を2 Mまで下げた。最後に1μg/μLトリプシン溶液1μLを加え、37℃で16時間保温して加水分解反応をおこなった(トリプシン終濃度24.4 ng/μL)。反応後のペプチド溶液にはC18 + SDB STAGE Tipによる脱塩処理を施した(Rappsilber, J. et al., Anal. Chem. 2003, 75: 663-70)。脱塩処理後の試料を減圧下で乾燥した。乾燥済みのペプチド試料を、水(富士フイルム和光純薬株式会社、210-01303)、アセトニトリル(同、018-19853)及びトリフルオロ酢酸(同、204-02743)からなる溶媒(体積比98:2:0.1)を用いて溶解した。溶解の際は、総タンパク質量(2μg相当分)から計算して0.1μg/μLになるように添加溶媒の容積を調整し、LC-MS/MSに供した。
LC-MS/MSにより各試料から得られた測定データを次の手順で処理した。すなわち、Thermo Fisher Scientific社のソフトウェア、Proteome Discoverer(ver. 3.0)(以下、「PD 3.0」)(https://www.thermofisher.com/jp/ja/home/industrial/mass-spectrometry/liquid-chromatography-mass-spectrometry-lc-ms/lc-ms-software/multi-omics-data-analysis/proteome-discoverer-software.html)を用いて、各LC-MS/MSデータのピーク整列化及び配列データベース検索をおこなった。配列データベース検索には、Sequest HTソフトウェアを用いた。有意とみなしたペプチドの同定情報を各検出ピークに連結し、連結された検出ピークの強度値を当該ペプチドの検出強度とした[2種類: 正規化前の検出強度“Abundance”及び正規化後の強度“Abundances (Normalized)”]。ピーク検出強度の正規化処理はPD 3.0のアルゴリズムに従っておこなった。
<ラマン分光の測定>
Endress+Hauser社製ラマン分析装置 RamanRxn2システムを用いて培養上清中のラマン分光を測定した。その後、得られたスペクトルに対し、統計解析ソフトRを用いて二次微分を行い、CAR遺伝子の導入率の異なるサンプル間のスペクトルを比較した。
Endress+Hauser社製ラマン分析装置 RamanRxn2システムを用いて培養上清中のラマン分光を測定した。その後、得られたスペクトルに対し、統計解析ソフトRを用いて二次微分を行い、CAR遺伝子の導入率の異なるサンプル間のスペクトルを比較した。
実施例1:CAR遺伝子導入によるT細胞での培養上清成分の変化
CAR-T細胞を製造し、製造後の細胞密度、生存率、遺伝子導入効率を測定した。結果を図1に示す。その結果CAR遺伝子導入の有無により生存率は若干の減少がみられたが(図1B)、細胞密度には変化がなかった(図1A)。しかしフェノールレッドを含む培養上清では遺伝子を導入していないT細胞(UTD)に比べて、CAR-T細胞でpHが低くなり、酸性になっていることが観察された(図1D-1E)。さらに上清成分中の変化を調べるために、代謝物の測定を実施した。結果を図2に示す。その結果、CAR-T細胞の培養上清では、UTDと比較してグルタミン(Gln)、グルコース(Gluc)、カリウムイオン、カルシウムイオンの減少、乳酸(Lac)、アンモニウムイオンの増加がみられた。しかしグルタミン酸(Glu)とナトリウムイオンについては変化が見られなかった(図2A-2H)。
CAR-T細胞を製造し、製造後の細胞密度、生存率、遺伝子導入効率を測定した。結果を図1に示す。その結果CAR遺伝子導入の有無により生存率は若干の減少がみられたが(図1B)、細胞密度には変化がなかった(図1A)。しかしフェノールレッドを含む培養上清では遺伝子を導入していないT細胞(UTD)に比べて、CAR-T細胞でpHが低くなり、酸性になっていることが観察された(図1D-1E)。さらに上清成分中の変化を調べるために、代謝物の測定を実施した。結果を図2に示す。その結果、CAR-T細胞の培養上清では、UTDと比較してグルタミン(Gln)、グルコース(Gluc)、カリウムイオン、カルシウムイオンの減少、乳酸(Lac)、アンモニウムイオンの増加がみられた。しかしグルタミン酸(Glu)とナトリウムイオンについては変化が見られなかった(図2A-2H)。
実施例2:CAR遺伝子導入によるT細胞での代謝の変化
実施例1で培養上清に変化が見られたため、CAR遺伝子導入によるT細胞での代謝の変化を確認した。結果を図3に示す。遺伝子導入をしていないT細胞(UTD)とCAR-T細胞を製造後に、新鮮培地に置換し、培養した。その後、1、3、6又は24時間後にセルカウントと培養上清の解析を実施した(図3A)。24時間培養中は細胞数の増加はUTDとCAR-T細胞では見られなかった(図3B)。しかしCAR-T細胞の培養上清では、グルコースの低下と乳酸の増加が観察され、解糖系の亢進が確認された(図3C-3D)。またCAR-T細胞の培養上清では、グルタミンの低下とアンモニウムイオンの増加も観察され、グルタミン代謝の亢進も確認された(図3E-3G)。この結果から、CAR遺伝子導入により代謝が変化することが確認された。
実施例1で培養上清に変化が見られたため、CAR遺伝子導入によるT細胞での代謝の変化を確認した。結果を図3に示す。遺伝子導入をしていないT細胞(UTD)とCAR-T細胞を製造後に、新鮮培地に置換し、培養した。その後、1、3、6又は24時間後にセルカウントと培養上清の解析を実施した(図3A)。24時間培養中は細胞数の増加はUTDとCAR-T細胞では見られなかった(図3B)。しかしCAR-T細胞の培養上清では、グルコースの低下と乳酸の増加が観察され、解糖系の亢進が確認された(図3C-3D)。またCAR-T細胞の培養上清では、グルタミンの低下とアンモニウムイオンの増加も観察され、グルタミン代謝の亢進も確認された(図3E-3G)。この結果から、CAR遺伝子導入により代謝が変化することが確認された。
実施例3:CAR遺伝子導入によるT細胞でのグルコース取り込み量の変化
実施例2の結果より、CAR遺伝子導入により代謝が変化することが確認されたために、実際のグルコースの取り込み量の定量化を実施した。結果を図4に示す。その結果、CAR遺伝子導入によりグルコースの取り込み量が増加することを確認した。
実施例2の結果より、CAR遺伝子導入により代謝が変化することが確認されたために、実際のグルコースの取り込み量の定量化を実施した。結果を図4に示す。その結果、CAR遺伝子導入によりグルコースの取り込み量が増加することを確認した。
実施例4:培養上清中の成分から製造終了日でのCAR-T細胞数の予測
実施例1-3の結果よりCAR-T細胞数は、培養上清中の成分と相関することが推察される。このことを確認するために、1ドナーのT細胞からCAR遺伝子を導入したT細胞と導入していないT細胞を準備した。その後に、遺伝子導入したT細胞が0、25、50、75、100%になるように細胞を混和し、4日間培養し、細胞数には大きな違いがないもののCAR導入率に関しては、混合比に応じた割合のCAR-T細胞を含む細胞集団を作製した(図5-1A、B)。製造終了日に培養上清と細胞密度、CAR-T細胞密度で相関を確認したところ、どの培養上清中の成分も細胞密度とは相関を示さなかった。一方、CAR-T細胞密度に関しては、乳酸とアンモニウムイオンとは正に相関を示し、pH、グルタミン、グルコースとは負の相関を示した。しかし他の成分ではCAR-T細胞密度とは相関を示さなかった(図5-2C-F、図5-3G-L、図5-4M-T)。この結果から、製造終了日においては培養上清中の乳酸、アンモニウムイオン、pH、グルタミン、グルコースからCAR-T細胞数を予測することができる。
実施例1-3の結果よりCAR-T細胞数は、培養上清中の成分と相関することが推察される。このことを確認するために、1ドナーのT細胞からCAR遺伝子を導入したT細胞と導入していないT細胞を準備した。その後に、遺伝子導入したT細胞が0、25、50、75、100%になるように細胞を混和し、4日間培養し、細胞数には大きな違いがないもののCAR導入率に関しては、混合比に応じた割合のCAR-T細胞を含む細胞集団を作製した(図5-1A、B)。製造終了日に培養上清と細胞密度、CAR-T細胞密度で相関を確認したところ、どの培養上清中の成分も細胞密度とは相関を示さなかった。一方、CAR-T細胞密度に関しては、乳酸とアンモニウムイオンとは正に相関を示し、pH、グルタミン、グルコースとは負の相関を示した。しかし他の成分ではCAR-T細胞密度とは相関を示さなかった(図5-2C-F、図5-3G-L、図5-4M-T)。この結果から、製造終了日においては培養上清中の乳酸、アンモニウムイオン、pH、グルタミン、グルコースからCAR-T細胞数を予測することができる。
実施例5:複数ドナーを用いた培養上清中の成分から経時的なCAR-T細胞数の予測
実施例4と同じ製造方法を用いて、3ドナーのT細胞からCAR-T細胞を準備し、さらに増幅1-4日目の全て培養日に細胞密度とCAR導入率を測定した。結果を図6A-Bに示す。その後、実施例4で見つかった培養成分から細胞密度とCAR-T細胞密度との相関を確認したところ、CAR-T細胞密度とも相関を示すが、細胞密度でより高い相関を示した(図7A-J)。
実施例4と同じ製造方法を用いて、3ドナーのT細胞からCAR-T細胞を準備し、さらに増幅1-4日目の全て培養日に細胞密度とCAR導入率を測定した。結果を図6A-Bに示す。その後、実施例4で見つかった培養成分から細胞密度とCAR-T細胞密度との相関を確認したところ、CAR-T細胞密度とも相関を示すが、細胞密度でより高い相関を示した(図7A-J)。
実施例6:メタボローム・リピドーム解析を用いた培養上清の網羅的な解析
実施例5で使用した培養上清を用いてメタボローム・リピドーム解析を実施した。遺伝子導入をしていないT細胞(UTD)とCAR-T細胞の上清成分の差について、UTDを対照群としたときに、各成分との差がCAR導入率に応じて大きくなると仮定してWilliams検定を行い、CAR導入率に応じて差が大きくなる成分を抽出した。結果を図8に示す。縦軸をWilliams検定での-log(p value)、横軸をCAR導入率が最も高い条件での変化量の推定値とすることで、CAR導入率依存的に上清に蓄積される成分が右上、CAR導入率依存的に消費される成分が左上にプロットされる。図中の脂質成分の略号は以下の通りである。PC:ホスファチジルコリン、PE:ホスファチジルエタノールアミン、SM:スフィンゴミエリン、FFA:遊離脂肪酸。さらに詳細な分類として、グリセロールと脂肪酸の結合がエステル結合のものをa、エーテル結合のものをeとして表記し、a及びeの数はグリセロール部分に結合する脂肪酸残基の数を示している。また、結合している脂肪酸残基の総炭素数(x)と二重結合数(y)をx:yとして表記する。たとえば、PC(aa-34:1)はホスファチジルコリンのグリセロール部分に2つの脂肪酸がエステル結合で結合しており、その脂肪酸残基の総炭素数が34個であり、その中に二重結合が1個存在することを示している。また、HPE-AMはβ-(4-hydroxyphenyl)ethyl iodoacetamideの略号であり、パースルフィド、ポリスルフィド等の硫黄化合物を安定化して検出するために使用される。したがって、図中のCysteine-SS-HPE-AMはシステインパースルフィド等、SS-bis-HPE-AMはH2S2等の硫黄代謝物を示している。
実施例5で使用した培養上清を用いてメタボローム・リピドーム解析を実施した。遺伝子導入をしていないT細胞(UTD)とCAR-T細胞の上清成分の差について、UTDを対照群としたときに、各成分との差がCAR導入率に応じて大きくなると仮定してWilliams検定を行い、CAR導入率に応じて差が大きくなる成分を抽出した。結果を図8に示す。縦軸をWilliams検定での-log(p value)、横軸をCAR導入率が最も高い条件での変化量の推定値とすることで、CAR導入率依存的に上清に蓄積される成分が右上、CAR導入率依存的に消費される成分が左上にプロットされる。図中の脂質成分の略号は以下の通りである。PC:ホスファチジルコリン、PE:ホスファチジルエタノールアミン、SM:スフィンゴミエリン、FFA:遊離脂肪酸。さらに詳細な分類として、グリセロールと脂肪酸の結合がエステル結合のものをa、エーテル結合のものをeとして表記し、a及びeの数はグリセロール部分に結合する脂肪酸残基の数を示している。また、結合している脂肪酸残基の総炭素数(x)と二重結合数(y)をx:yとして表記する。たとえば、PC(aa-34:1)はホスファチジルコリンのグリセロール部分に2つの脂肪酸がエステル結合で結合しており、その脂肪酸残基の総炭素数が34個であり、その中に二重結合が1個存在することを示している。また、HPE-AMはβ-(4-hydroxyphenyl)ethyl iodoacetamideの略号であり、パースルフィド、ポリスルフィド等の硫黄化合物を安定化して検出するために使用される。したがって、図中のCysteine-SS-HPE-AMはシステインパースルフィド等、SS-bis-HPE-AMはH2S2等の硫黄代謝物を示している。
PE(aa-34:2)、PC(aa-30:1)、PE(aa-36:2)、PC(aa-30:0)、FFA(C10:1)などがCAR導入率依存的に上清に蓄積し、FFA(C16:2)、Arginine、GlutamineなどがCAR導入率依存的に消費されることが観察された。
実施例7:メタボローム・リピドーム解析を用いた培養上清中の成分からのCAR-T細胞数の予測
実施例5で使用した培養上清を用いてメタボローム・リピドーム解析を実施し、CAR-T細胞数を予測できる成分があるかどうかを確認した。
実施例5で使用した培養上清を用いてメタボローム・リピドーム解析を実施し、CAR-T細胞数を予測できる成分があるかどうかを確認した。
全代謝物について、各代謝物の測定値を細胞密度で106細胞当たりに補正し、CAR-T細胞数との単回帰分析を行った。結果を図9に示す。増幅工程中の各日程ごとで単回帰における決定係数R2の高い成分として増幅2日目でのPC(aa-30:0)、PC(aa-32:1)、PE(aa-36:2)、増幅3日目でのFFA(C10:1)、PC(aa-30:1)、増幅4日目でのFFA(C10:1)、PC(aa-28:0)、PC(aa-30:1)、Phenyllactic acidが抽出された。また、同じ補正値に対し、多変量解析としてLASSO回帰、OPLS回帰を行い、CAR-T細胞数への回帰に寄与する成分の選択もしくは変数重要度を分析した。結果を図10に示す。LASSO回帰について増幅工程中の増幅2, 3, 4日目でのCAR-T細胞数の実測と予測を示し(図10A-C)、回帰の際に選択された代謝物の係数を同じグラフ内に示した。OPLS回帰についても同様に増幅工程中の増幅1, 2, 3, 4日目でのCAR-T細胞数の実測と予測を示し(図10D-G)、その際の変数重要度の高い代謝物を同じグラフ内に示した。
また、全日程での測定値についても同様に単回帰、LASSO回帰、OPLS回帰を実施し、日程を区別せずにCAR-T細胞数が予測できるかを確認した。結果を図11-12に示す。単回帰における決定係数R2の高い成分としてPhenyllactic acid, FFA(C10:1)、PC(aa-28:0)、PC(aa-30:0)、PC(aa-30:1)、PC(aa-32:1)、PE(aa-34:2)、PE(aa-36:2)、PE(aa-36:3)が抽出された(図11A-I)。また、LASSO回帰での予測とその際に選択された化合物とその係数(図12A)、OPLS回帰での予測とその際に変数重要度の高かった化合物を確認した(図12B)。
実施例8:CAR遺伝子導入によるSK-Hep-1細胞での代謝の変化
肝癌細胞株であるSK-Hep-1細胞を用いて導入細胞(つまり、T細胞以外)に関係なく、実施例1で用いたCAR遺伝子導入により細胞の代謝が変化するかを確認した。結果を図13に示す。実施例1と同様にCAR遺伝子導入により、培養上清中の乳酸の増加が観察された。
肝癌細胞株であるSK-Hep-1細胞を用いて導入細胞(つまり、T細胞以外)に関係なく、実施例1で用いたCAR遺伝子導入により細胞の代謝が変化するかを確認した。結果を図13に示す。実施例1と同様にCAR遺伝子導入により、培養上清中の乳酸の増加が観察された。
実施例9:CAR遺伝子導入によるgdT細胞での代謝の変化
gdT細胞を用いて、実施例1で用いたCAR遺伝子導入により細胞の代謝が変化するかを確認した。結果を図14に示す。その結果、CAR遺伝子導入により、培養上清中の乳酸の増加が観察された。
gdT細胞を用いて、実施例1で用いたCAR遺伝子導入により細胞の代謝が変化するかを確認した。結果を図14に示す。その結果、CAR遺伝子導入により、培養上清中の乳酸の増加が観察された。
実施例10:CAR遺伝子導入によるNK細胞での代謝の変化
CAR-NK細胞を製造し、培養上清中の成分とCAR-NK細胞数での相関を確認した。結果を図15に示す。CAR-NK細胞数と乳酸、アンモニウムイオンは正に相関し、グルコース、グルタミン酸、ナトリウムイオン、pHは負に相関した。培養上清の成分からCAR-NK細胞数を予測することができる。
CAR-NK細胞を製造し、培養上清中の成分とCAR-NK細胞数での相関を確認した。結果を図15に示す。CAR-NK細胞数と乳酸、アンモニウムイオンは正に相関し、グルコース、グルタミン酸、ナトリウムイオン、pHは負に相関した。培養上清の成分からCAR-NK細胞数を予測することができる。
実施例11:CAR遺伝子導入によるエクソソームの変化
実施例1で用いたCAR遺伝子導入により培養上清中の細胞小胞であるエクソソームが変化するかを確認した。結果を図16に示す。エクソソームの粒子径がCAR遺伝子を導入することでT細胞と比べて小さくなることを確認した(図16A)。次にエクソソームのプロファイルを確認するためにCAR-T細胞又はT細胞由来のエクソソームのプロテオーム解析を実施した。ボルケーノプロット解析の結果、CAR-T細胞とT細胞でエクソソームタンパク質のプロファイルが変化していた(図16B)。CAR-T細胞で有意に増加しているエクソソームタンパク質に関してt検定を実施した(図16C、N=3)。さらに、CAR-T細胞数を予測するための図16Cの中のタンパク質を1例として解析を実施したところ、CD63陽性エクソソームからCAR-T細胞数を予測できることを確認した(図16D、R2=0.9846)。
実施例1で用いたCAR遺伝子導入により培養上清中の細胞小胞であるエクソソームが変化するかを確認した。結果を図16に示す。エクソソームの粒子径がCAR遺伝子を導入することでT細胞と比べて小さくなることを確認した(図16A)。次にエクソソームのプロファイルを確認するためにCAR-T細胞又はT細胞由来のエクソソームのプロテオーム解析を実施した。ボルケーノプロット解析の結果、CAR-T細胞とT細胞でエクソソームタンパク質のプロファイルが変化していた(図16B)。CAR-T細胞で有意に増加しているエクソソームタンパク質に関してt検定を実施した(図16C、N=3)。さらに、CAR-T細胞数を予測するための図16Cの中のタンパク質を1例として解析を実施したところ、CD63陽性エクソソームからCAR-T細胞数を予測できることを確認した(図16D、R2=0.9846)。
実施例12:CAR遺伝子導入によるラマン分光の変化
実施例1で用いたCAR遺伝子導入により培養上清のラマン分光が変化するかを確認した。結果を図17に示す。図17Aで取得したラマン分光スペクトルの二次微分の全体を示す。様々なピークでCAR導入細胞と非導入細胞で差がみられた。図17Bにそのピークの一例を示した。
実施例1で用いたCAR遺伝子導入により培養上清のラマン分光が変化するかを確認した。結果を図17に示す。図17Aで取得したラマン分光スペクトルの二次微分の全体を示す。様々なピークでCAR導入細胞と非導入細胞で差がみられた。図17Bにそのピークの一例を示した。
本出願は、日本で2023年6月16日に出願された特願2023-99695号を基礎としており、その内容は本明細書にすべて包含される。
Claims (20)
- 動物細胞の遺伝子導入率及び/又は遺伝子導入細胞数の予測方法であって、
(1)遺伝子導入した動物細胞が培養された培養上清の成分を測定する工程、及び
(2)工程(1)で測定した値に基づいて遺伝子導入率及び/又は遺伝子導入細胞数を予測する工程
を含む方法。 - 工程(1)において、培養上清のpH、代謝物又は細胞外小胞の測定を行う 、請求項1に記載の方法。
- 前記代謝物が、有機酸、糖類、脂質、ビタミン、アミン類、核酸類、アミノ酸及びその他代謝物イオンからなる群から選択される少なくとも1種である、請求項2に記載の方法。
- 前記有機酸が、デセン酸、ドデセン酸、ミリストレイン酸、パルミチン酸、パルミトレイン酸、ヘキサデカジエン酸、ステアリン酸、オレイン酸、リノール酸、γ-リノレン酸、α-リノレン酸、アラキジン酸、エイコセン酸、エイコサジエン酸、ミード酸、アラキドン酸、ドコサペンタエン酸、ドコサヘキサエン酸、ネルボン酸、2-ヒドロキシ吉草酸、2-オキソグルタル酸、インドキシル硫酸、4-ピリドキシ酸、硫酸4エチルフェニル、アジピン酸、クエン酸、フマル酸、乳酸、リンゴ酸、フェニル乳酸、パントテン酸、ピペコリン酸、ピルビン酸、タルトロン酸、パラクレゾール硫酸、及びキサンツレン酸からなる群から選択される少なくとも1種である、請求項3に記載の方法。
- 前記糖類がフルクトース、イノシトール、ガラクトース、グルコース、及びスクロースからなる群から選択される少なくとも1種である、請求項3に記載の方法。
- 前記脂質がセラミド、Hex2-セラミド、Hex-セラミド、コレステロール、コレステロール硫酸塩、カルジオリピン、モノグリセロール、リゾホスファチジルコリン、リゾホスファチジルエタノールアミン、ホスファチジン酸、ホスファチジルコリン、ホスファチジルエタノールアミン、ホスファチジルグリセロール、ホスファチジルイノシトール、ホスファチジルセリン、スフィンゴミエリン、ジヒドロスフィンゴミエリン、トリグリセリド、グリセロール3リン酸、及びガングリオシドGM3からなる群から選択される少なくとも1種である、請求項3に記載の方法。
- 前記ビタミンがαトコフェロール、ニコチンアミド、及びコリンからなる群から選択される少なくとも1種である、請求項3に記載の方法。
- 前記アミン類がエタノールアミン、及びエタノールアミンリン酸からなる群から選択される少なくとも1種である、請求項3に記載の方法。
- 前記核酸類がアデノシン、及びメチルチオアデノシンからなる群から選択される少なくとも1種である、請求項3に記載の方法。
- 前記アミノ酸がアシルカルニチン、アラニン、アルギニン、アスパラギン、アスパラギン酸、β-アラニン、システイン、システイン-HPE-AM、システイン-SS-HPE-AM、ジメチルグリシン、グルタミン酸、グルタミン、グリシン、イソロイシン、ロイシン、ロイシン酸、リシン、メチオニン、ホモシステイン-HPE-AM、N-アセチル-β-アラニン、N-アセチルシステイン、N-アセチルセリン、N-アセチルトリプトファン、N-カルバモイル-アスパルテート、O-アセチルセリン、オルニチン、ピログルタミン酸、フェニルアラニン、プロリン、セリン、S-スルフォシステイン、タウリン、スレオニン、トリプトファン、チロシン、及びバリンからなる群から選択される少なくとも1種である、請求項3に記載の方法。
- 前記その他代謝物イオンがアンモニウムイオン、カリウムイオン、カルシウムイオン、ナトリウムイオン、ピロリン酸、硫酸、亜硫酸、フェノール硫酸、及びSS-bis-HPE-AMからなる群から選択される少なくとも1種である、請求項3に記載の方法。
- 工程(1)における培養上清の成分の測定を、ラマン分光法により行う、請求項1に記載の方法。
- 工程(2)において、培養上清の1種類の成分に基づいて遺伝子導入率及び/又は遺伝子導入細胞数の予測を行う、請求項1に記載の方法。
- 工程(2)において、培養上清の2種以上の成分の組合せに基づいて遺伝子導入率及び/又は遺伝子導入細胞数の予測を行う、請求項1に記載の方法。
- 工程(2)において、遺伝子導入前後の培養上清の成分の変化を遺伝子導入率及び/又は遺伝子導入細胞数の予測に使用する、請求項1に記載の方法。
- 前記動物細胞が、免疫細胞である、請求項1に記載の方法。
- 前記免疫細胞が、T細胞又はNK細胞である、請求項16に記載の方法。
- 前記動物細胞が、上皮細胞である、請求項1に記載の方法。
- 前記遺伝子が、キメラ抗原受容体をコードする核酸である、請求項1に記載の方法。
- 遺伝子導入した細胞製剤の製造方法であって、動物細胞が培養された培養上清の成分を測定し、測定した値に基づいて遺伝子導入率及び/又は遺伝子導入細胞数を測定する工程を含む方法。
Applications Claiming Priority (2)
| Application Number | Priority Date | Filing Date | Title |
|---|---|---|---|
| JP2023099695 | 2023-06-16 | ||
| JP2023-099695 | 2023-06-16 |
Publications (1)
| Publication Number | Publication Date |
|---|---|
| WO2024257872A1 true WO2024257872A1 (ja) | 2024-12-19 |
Family
ID=93852263
Family Applications (1)
| Application Number | Title | Priority Date | Filing Date |
|---|---|---|---|
| PCT/JP2024/021754 Ceased WO2024257872A1 (ja) | 2023-06-16 | 2024-06-14 | 遺伝子導入率予測方法 |
Country Status (1)
| Country | Link |
|---|---|
| WO (1) | WO2024257872A1 (ja) |
Citations (4)
| Publication number | Priority date | Publication date | Assignee | Title |
|---|---|---|---|---|
| JPH10509318A (ja) * | 1994-11-08 | 1998-09-14 | チャン,ラン−ジ | 組換えcmv−ie/hiv−tar/モロニーマウス白血病ウイルスltrを含有するレトロウイルスベクター |
| JP2007524375A (ja) * | 2003-03-07 | 2007-08-30 | ダイヴァーサ コーポレイション | ヒドロラーゼ、それをコードする核酸並びにその製造および使用方法 |
| US20190226994A1 (en) * | 2016-07-04 | 2019-07-25 | Celltool Gmbh | Device and Method for the Determination of Transfection |
| WO2021005729A1 (ja) * | 2019-07-09 | 2021-01-14 | 株式会社島津製作所 | iPS細胞の分化効率予測モデルの構築方法及びiPS細胞の分化効率予測方法 |
-
2024
- 2024-06-14 WO PCT/JP2024/021754 patent/WO2024257872A1/ja not_active Ceased
Patent Citations (4)
| Publication number | Priority date | Publication date | Assignee | Title |
|---|---|---|---|---|
| JPH10509318A (ja) * | 1994-11-08 | 1998-09-14 | チャン,ラン−ジ | 組換えcmv−ie/hiv−tar/モロニーマウス白血病ウイルスltrを含有するレトロウイルスベクター |
| JP2007524375A (ja) * | 2003-03-07 | 2007-08-30 | ダイヴァーサ コーポレイション | ヒドロラーゼ、それをコードする核酸並びにその製造および使用方法 |
| US20190226994A1 (en) * | 2016-07-04 | 2019-07-25 | Celltool Gmbh | Device and Method for the Determination of Transfection |
| WO2021005729A1 (ja) * | 2019-07-09 | 2021-01-14 | 株式会社島津製作所 | iPS細胞の分化効率予測モデルの構築方法及びiPS細胞の分化効率予測方法 |
Similar Documents
| Publication | Publication Date | Title |
|---|---|---|
| Zhou et al. | Transfer of cGAMP into bystander cells via LRRC8 volume-regulated anion channels augments STING-mediated interferon responses and anti-viral immunity | |
| Haneke et al. | CDK1 couples proliferation with protein synthesis | |
| Tajan et al. | A role for p53 in the adaptation to glutamine starvation through the expression of SLC1A3 | |
| JP5892939B2 (ja) | 細胞状態をモニタリングするための方法及び間葉系幹細胞を不死化するための方法 | |
| Yoon et al. | Wnt signaling regulates mitochondrial physiology and insulin sensitivity | |
| US20200048616A1 (en) | Methods and products for transfection | |
| Namgaladze et al. | Polarization of human macrophages by interleukin-4 does not require ATP-citrate lyase | |
| SG183579A1 (en) | Methods of detecting therapeutic exosomes | |
| EP2616540A1 (en) | Method of efficiently establishing induced pluripotent stem cells | |
| Romero-Moya et al. | Genetic rescue of mitochondrial and skeletal muscle impairment in an induced pluripotent stem cells model of coenzyme Q10 deficiency | |
| Franzolin et al. | The pyrimidine nucleotide carrier PNC1 and mitochondrial trafficking of thymidine phosphates in cultured human cells | |
| TW202345878A (zh) | 控制性t細胞之製造方法 | |
| Xia et al. | CBP-dependent Wnt/β-catenin signaling is crucial in regulation of MDR1 transcription | |
| Miyazaki et al. | Glutamine protects mouse spermatogonial stem cells against NOX1-derived ROS for sustaining self-renewal division in vitro | |
| CA2964229A1 (en) | Tolerogenic dendritic cells, methods of producing the same, and uses thereof | |
| Alborzinia et al. | Selenocysteine metabolism is a targetable vulnerability in MYCN-amplified cancers | |
| Martin et al. | Therapeutic extracellular vesicle production is substantially increased by inhibition of cellular cholesterol biosynthesis | |
| Xian et al. | DUSP facilitates RPMI8226 myeloma cell aging and inhibited TLR4 expression | |
| EP4545632A1 (en) | Cell culture method | |
| EP4561602A1 (en) | Polynucleotides encoding linked antigens and uses thereof | |
| Alkan et al. | N-acetylaspartate improves cell survival when glucose is limiting | |
| EP4502172A1 (en) | Method for predicting gene transfer rate | |
| Kim et al. | Cytoplasmic fusion between an enlarged embryonic stem cell and a somatic cell using a microtunnel device | |
| WO2020196926A1 (ja) | 細胞競合の制御剤 | |
| Salmond et al. | DMEM, or Opti-MEM, that is the Question: An Important Consideration for Extracellular Vesicle Isolation and their Downstream Applications |
Legal Events
| Date | Code | Title | Description |
|---|---|---|---|
| 121 | Ep: the epo has been informed by wipo that ep was designated in this application |
Ref document number: 24823485 Country of ref document: EP Kind code of ref document: A1 |
|
| NENP | Non-entry into the national phase |
Ref country code: DE |