EP0294121A2 - Dekonvolution von chromatographischen Peaks - Google Patents
Dekonvolution von chromatographischen Peaks Download PDFInfo
- Publication number
- EP0294121A2 EP0294121A2 EP88304858A EP88304858A EP0294121A2 EP 0294121 A2 EP0294121 A2 EP 0294121A2 EP 88304858 A EP88304858 A EP 88304858A EP 88304858 A EP88304858 A EP 88304858A EP 0294121 A2 EP0294121 A2 EP 0294121A2
- Authority
- EP
- European Patent Office
- Prior art keywords
- spectra
- matrix
- data
- component
- interval
- Prior art date
- Legal status (The legal status is an assumption and is not a legal conclusion. Google has not performed a legal analysis and makes no representation as to the accuracy of the status listed.)
- Granted
Links
Images


Classifications
-
- G—PHYSICS
- G01—MEASURING; TESTING
- G01N—INVESTIGATING OR ANALYSING MATERIALS BY DETERMINING THEIR CHEMICAL OR PHYSICAL PROPERTIES
- G01N30/00—Investigating or analysing materials by separation into components using adsorption, absorption or similar phenomena or using ion-exchange, e.g. chromatography or field flow fractionation
- G01N30/02—Column chromatography
- G01N30/86—Signal analysis
- G01N30/8603—Signal analysis with integration or differentiation
- G01N2030/862—Other mathematical operations for data preprocessing
-
- G—PHYSICS
- G06—COMPUTING OR CALCULATING; COUNTING
- G06F—ELECTRIC DIGITAL DATA PROCESSING
- G06F2218/00—Aspects of pattern recognition specially adapted for signal processing
- G06F2218/02—Preprocessing
Definitions
- the present invention relates to chromatography, and, more particularly to a system, program and method for estimating component spectra of a chromatogram with overlapping component peaks.
- Analytic chemistry has provided scientists the ability to break down chemical systems into their constituents, the properties of which can then be investigated individually. Chromatography contributes to this ability by permitting scientists to determine the identity and relative concentrations of compounds in a mixture.
- the mixture itself can be the result of the breakdown of a highly complex molecular structure, such as a protein, so that chromatography can be used as a sub-procedure in the study of complex molecules.
- Chromatography involves the flow of a mobile phase over a stationary phase. Each component of a mixture is distributed between these two phases according to a characteristic ratio. As the mobile phase moves past the stationary phase, repeated adsorption and desorption of a component occurs at a rate determined chiefly by its ratio of distribution between the two phases. To the extent that their distribution ratios are different, the components of the mixture move at different rates.
- the components of the mixture can be resolved into a series of bands. Spectral distributions can then be determined for the individual bands.
- a spectral distribution can be one of several types, generally corresponding to the specific chromatographic technique applied. For example, in a liquid chromatography system, in which a mobile liquid phase is passed through a stationary solid or liquid phase, a diode array detector can be used to determine the visible light or ultra-violet absorption spectra of the eluting components.
- gas chromatography systems in which a mobile gas phase passes a stationary solid or liquid phase, can use Fourier transform infrared spectroscopy or mass spectroscopy to obtain chromatograms.
- the spectra measured as a chromatographic peak elutes are those characteristic of a single component. However, with complex mixtures, there is some overlap of pure component spectra.
- the spectra constituting an overlap can sometimes be deconvolved, i.e., mathematically estimated. Where deconvolution is possible, it is often more effective and efficient than successive chromatographic runs which might also be used, in effect, to resolve overlapping peaks.
- the polar and azimuthal angles of the points are then used as polar coordinates in a plane, to map the points from the spherical surface to a plane, with the polar angle used as the radius vector and the azimuthal angle as the vectorial angle.
- Vandeginste et al. (op. cit) used the spectral estimates to compute elution profiles for the individual compounds. They were able to improve the spectral estimates by adjusting the spectra so that the amplitudes of any two components are zero at the peak of the elution profile of the third, where the peaks are found using the first estimates. Of course, this assumption may not be appropriate.
- Vandeginste et al. (op cit) used this expansion in a way completely analogous to the method using principal components of the spectra.
- the application of their constraints to obtain estimates of the elution profiles of the compounds works better in some cases than in the analogous case of estimating their spectra.
- Spectral estimates can then be obtained from the data array of spectra vs. time, using the estimated elution profiles.
- Harris and coworkers have developed yet another method for attacking the problem of mathematically deconvolving overlapped chromatographic bands as disclosed in U.S. Patent No. 4,353,242.
- the peak shapes of the chromatographic bands are assumed to be known, and parameters of the bands such as mean position and peak width are computed from the array of data by a least squares fitting procedure.
- the spectra can then be computed from the data array and the elution profiles.
- Deconvolution can be applied straightforwardly under each of the following conditions: 1) the spectral distributions of the components are known, for example, where only the relative concentrations of the components are unknown; and 2) at most two peaks overlap. More complex overlapping can be handled in a relatively straightforward manner by imposing certain assumptions on more complex spectral distributions. For example, one can assume that the unknown spectral distributions have a predetermined shape. Such an assumption can facilitate component estimation when correct. On the other hand, the imposition of strong assumptions can decrease the likelihood estimates obtained are valid, thus limiting confidence in the results of such methods.
- Area normalization methods permit a representation of chromatographic data in a plane in which binary mixtures of varying relative concentrations lie along a line segment defined by endpoints representing the pure component spectra of the pure compounds in the mixture.
- This permits straightforward linear extrapolation of pure component spectra as follows. Given a chromatographic elution sequence of compound A alone, A mixed with compound B, B mixed with A and compound C, B mixed with C, and C alone, the pure component spectra for B corresponds to the intersection of straight line segments defined during binary mixture elutions A with B and B with C.
- This reliable method for extrapolating pure component spectra can serve as the basis for determining the concentration profiles for each eluting compound represented in a chromatogram.
- area normalization There are two fundamental disadvantages to area normalization. The first is that it amplifies low signal regions of a chromatogram relative to large signal regions, thus amplifying noise relative to signal. The second is that area normalization permits division by zero and near-zero amounts when both positive and negative spectral components are involved, skewing any possible interpretation of results with large values of little validity.
- Euclidean normalization is compatible with methods applying baseline correction or using derivatives of the spectra.
- the polar coordinate reference frame generated using Euclidean normalization does not permit linear extrapolation of pure component spectra. Accordingly, the foregoing methods in the Euclidean category have had one or more of the following disadvantages: 1) a requirement for assumptions as to peak shape; 2) a difficulty in determining a confidence level or error bound for the result obtained; 3) inaccuracy of the results; and 4) severe computational requirements.
- the application of an appropriate coordinate transformation allows linear extrapolation to be used with Euclidean normalization.
- the novel Euclidean-extrapolation method combines the advantages of prior Eucludean and area normalization methods. Spectra expressed as Euclidean normalized linear combinations of principal factors are mapped onto a plane so that mixtures of two spectral components lie on straight lines, the endpoints of which represent the spectra of the individual components. Initial estimates of the component spectra can then be obtained by extrapolation. Error analysis can then be applied to supply an error bound on the estimate and to provide improved estimates.
- an interval of interest is selected from a chromatogram.
- the interval is selected so that the ends of the interval are dominated by respective single component spectra.
- an interval might include a peak and relative minimums to either side of the peak.
- the data within the interval is then converted to Euclidean-normalized linear combinations of three principle factors obtained through factor analysis of the data.
- the converted data are confined to the surface of a unit sphere.
- the converted data can be reexpressed in spherical coordinates ⁇ , a polar angle, and ⁇ , an azimuthal angle about an equator.
- each spectra curve segment are determined by selecting a best point in the original planar expression, and the above procedure is replicated for each intermediate vertex to obtain estimations for all the components of the interval of interest.
- the estimates can be used to identify the associated compounds.
- the distribution of each component spectrum can be integrated over the interval to determine the relative concentrations of each compound in the original mixture.
- Errors in the estimated component spectra can be assessed by evaluating the matrix of concentrations C, whose rows are the computed elution profiles for the components, and whose columns are the computed concentrations found from each experimental spectrum. All negative values and all values beyond a predetermined number of standard deviations from the corresponding peak are set to zero and the remaining values are scaled so that the sum of the elements in each column is retained. The difference between the original matrix and this revised matrix is an estimated error matrix, which can be used to determine the error in the estimated component spectra.
- This error in the estimated component spectra can be used to derive revised estimated component spectra, and the error estimation can be reiterated until satisfactory convergence is achieved.
- the remaining error is a component in the total error. This can be combined with estimated noise and the norm of the difference between the total signal chromatogram and the reconstructed total signal chromatogram so that a total error bound can be constructed using known techniques.
- the invention combines the use of Euclidean normalization of the mixture spectra with the representation of these spectra as points on a plane where the points representing mixtures of two compounds lie on a straight line.
- a straight line permits linear extrapolation, useful for making estimates of the spectra of pure compounds.
- Euclidean normalization is preferable to normalization where the sum of elements in a spectrum is required to be unity, because it is often advantageous to modify the spectra so that the sum of elements is zero, or very small. For example, one might correct for a constant offset of unknown amplitude of every element of a spectrum by requiring the average of the elements to be zero.
- Other commonly used modifications of spectra involve the use of the first or higher derivatives of the spectra instead of the spectra themselves. Since the sum of the elements of these modified spectra may be very small, these modifications are inconsistent with normalizaton so that the sum is unity.
- the invention permits results to be achieved relatively quickly while using all the data available.
- iterative target transfer factor analysis method discussed in the background section above, one must find the principal factors of much larger data arrays than is called for by the present invention. This time required to compute the principal factors increased rapidly with the size of the array.
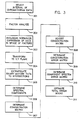
- an improved system, program and method for estimating the spectra and relative concentrations of components of a mixture involves obtaining a chromatogram 100, illustrated in FIG. 1, and processing the data by means of a system 200 of FIG. 2 according to a program and method as presented in the flow chart of FIG. 3.
- the program is designed to deconvolve chromatographic peaks with up to three overlapping spectra components, provided each region of triple overlap to be deconvolved is immediately preceded and followed by a region in which two spectral components overlap.
- the program involves for iterative improvements in the estimates and for an estimated error bound for the estimates.
- the chromatogram of FIG. 1 comprises a series of spectra 101, 102, etc.
- Each spectrum comprises a series of intensities taken over different frequencies, f1, f2, ... f n .
- each spectrum represents a point in frequency space with the coordinates (f1, f2, ... f n ).
- the i th spectrum can thus be characterized as a vector S ( i ) with the foregoing coordinates as its elements.
- a chromatogram, and any interval of a chromatogram can be expressed as a matrix S having a series of vectors S ( i ) as its columns.
- the illustrated chromatogram 100 is only a small section of a chromatogram with up to 100 or more peaks, and with 10-30 spectra per peak.
- the spectra represent ultra-violet and visible light absorption spectra taken during the elution of a chromatographic sample mixture from a chromatography column 202 of FIG. 2.
- the spectra are obtained by the ultra-violet and visible light spectrum analyzer 204.
- the spectra are analyzed by a computer 206 and a display/hardcopy device provides for display of the results, as indicated in subsequent figures.
- the chromatographic data are in the form of absorption versus frequency versus time.
- the results of the program are applied to data obtained through mass spectroscopy of compounds obtained through gas chromatography so that the data is in the form of quantity versus mass versus time.
- the computer program is not concerned with the physical referents of the data it processes.
- the present invention can be applied to deconvolve other types of data, provided the underlying assumptions discussed below are substantially met.
- the method of the present invention requires the selection of an appropriate candidate for deconvolution, as indicated at 301 in FIG. 3.
- the program is applied to a time interval of the chromatogram.
- Deconvolution is not a substitute for good chromatography.
- a typical chromatogram for a complex mixture can have 20-100 peaks. Most of these peaks should represent single components.
- visual inspection of a relatively efficient mathematical procedure, such as a peak purity test can be used to identify convoluted peaks.
- peaks of special interest in a mixture can be tested through deconvolution to determine whether or not multiple components are represented.
- the present method involves extrapolation of component spectra from data representing preceding and succeeding component spectra. While the extrapolation can be applied readily to intermediate components, it is difficult to extrapolate the spectral components of the first and last components represented in an interval. Therefore, the interval is preferably selected so that the first and last components are accurately represented by unextrapolated data. This is best ensured by selecting an interval including amplitudes at relatively low, e.g., background levels, to either side of the peak.
- the objective of the present method is to determine the "pure" spectra P (k) and the elution profiles C ( i ) of the compounds eluting during the interval.
- the pure spectra vectors P (k) define the columns of a pure component spectra matrix P and the elution profile vectors C ( i ) define the rows of a concentration matrix C .
- the vectors S ( i ) are factor analyzed to determine three principal factors, as indicated at 302.
- the factor analysis can be simplified by grouping the data. The division into groups is done in such a way that the number of groups is maximized, up to 12, consistent with minimizing the number of spectra left over at the beginning and end of the series.
- the vectors within each group are added to define 10 to 12 vectors S r ( j ), the columns of a "reduced" data matrix S r to be factor analyzed.
- vectors S (2), S (3) and S (4) are added to define a single vector S r (1).
- Successive combinations vectors S r (2) through S r (12) are similarly defined for succeeding groups of three S ( i ) vectors.
- Vectors S r (1) through S r (12) are the columns of the matrix S r to be factor analyzed.
- S (1) and S (38) are not used in determining the principal factors.
- the combinations of the S ( i ) vectors in defining the S r matrix reduces noise and computation time, while making use of substantially all the data. This treatment does not seriously impair finding the principal components as long as the span of each group of spectra is no greater than the width of a chromatographic peak.
- the experimental spectra can be windowed or weighted, but they are not normalized.
- the principal factors, or principal components, are the columns of F r corresponding to the larger eigenvalues. It is easy to show that the columns of F r are orthogonal to each other, and they consequently form an orthogonal basis that spans the same space as the columns of S r and the experimental spectra S ( i ).
- Each spectrum S ( i ) is then approximated by its expansion S f ( i ) in the space of the first three principal factors, f x , f y , and f z and the resulting vectors are Euclidean normalized, as indicated at 303, i.e., over all i in the selected interval. In other words, all the original data in the interval are expanded individually.
- W x tan( ⁇ ) cos( ⁇ )
- W y tan( ⁇ ) sin( ⁇ )
- S w S x ⁇ W x + S y ⁇ W y .
- This transformation not only maps the surface of the unit sphere into the plane W , but also maps great circles into straight lines and great arcs into straight line segments.
- binary mixtures of two compounds lie on a straight line segment with the spectra of the two compounds defining the endpoints of the segment.
- a chromatographic interval characterized by alternating unitary and binary sub-intervals would be represented by a series of straight line segments joined by vertices V ( k ) representing the spectra of the pure compounds.
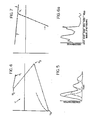
- a rounded, rather than a sharply defined, vertex U ( k ) is formed in the spectra curve, as typified by rounded vertices U 1, U 2, U 3 and U 4 in Fig. 4.
- a rounded vertex U ( k ) can be used to indicate the region of the virtual vertex V ( k ) corresponding to the spectrum for a single compound; the precise location of the vertex V ( k ) representative of the pure component spectra P ( k ) in the plane W being identified through extrapolation, indicated at 305 in FIG. 3.
- a major advantage of Euclidean normalization methods over methods employing area normalization is that the former is less sensitive to noise and more compatible with various baseline correction techniques and various approaches to data modification which can include negative spectral values.
- the present invention provides the advantages of linear extrapolation obtained by prior area normalization methods, without the disadvantages inherent in area normalization.
- the sequence of points corresponding to the chromatogram lies along a curve U in the constructed X,Y plane W.
- this curve U would consist of straight line segments with more or less sharp curved segments joining them.
- the curve U is subdivided for further analysis using the verticces U ( k ) as reference points.
- the number of vertices U ( k ), in the chromatogram curve in the plane W is equal to the number of components represented in the series of spectra S ( i ). Noise displaces the spectral points from the location they would otherwise have and, as might be expected, can make determining the number and position of vertices U ( k ) difficult.
- the preferred algorithm for locating vertices consists of finding the maxima in the correlation between each spectrum S w ( i ) and the next S w ( i +1). If the maxima are too close to each other, they are presumed to represent a single rounded vertex, which is taken to be to the point midway between.
- a point midway between U 3 and U 4 cooperates with the first spectrum S (1) of the interval to define a first group including U 1, U 2 and U 3, but excluding U 4.
- This first group is used for the extrapolation of the spectral component most closely associated with vertex U 2.
- a point midway between U 1 and U 2 cooperates with the last spectrum of the interval to define a second group including U 2, U 3 and U 4, but excluding U 1.
- This second group is used for the extrapolation of the spectral component most closely associated with vertex U 3.
- the extrapolation technique is not applicable to the first and last vertices of the chromatogram curve.
- the first and last vertices located by finding the correlation maxima are the initial estimates for the first and last component spectra represented in the interval. These estimates should be valid to the extent that the first and last vertices represent single compounds rather than mixtures. This condition is generally satisfied by defining the ends of the interval of interest away from the peak. In the example, the spectra corresponding to U 1 and U 4 are taken to represent the spectra of the first and fourth compounds to be eluted during the selected interval.
- the vectors S ( i ) representing each group are factor analyzed using the algorithm originally applied to the entire interval.
- the i th group has associated with it a matrix F i of three principal factors, F ix , F iy , and F iz .
- the vectors S ( i ) are expanded in the space defined by these factors, and the expansion is Euclidean normalized.
- each portion of the curve has associated with it a space defined by a matrix F i , of three principal factors.
- the data in each portion of the curve are then expanded and Euclidean normalized in the space of the corresponding principal factors.
- the transformation to polar and then to planar coordinates is performed as above with respect to the entire interval.
- the present method selects the optimal plane W i for extrapolating each vertex V ( k ) when more than three compounds are involved. At this point, the case of more than three vertices U ( k ) is reduced to separately treatable instances of curves with three vertices.
- the expansions of the spectra at the first and last vertices on plane W for the complete interval are used for the estimates of the spectra of the first and last components that elute in the interval being analyzed.
- Estimates for the intermediate components are found using the corresponding factor space, by extrapolating straight line segments to either side of the respective vertex, as described by O.S. Borgen and B.R. Kowalski (op. cit.).
- the coordinates of the intersection are the coefficients of the linear expansion of the estimated spectrum in terms of the respective set of principal components.
- the vertex V (2) defined by the intersection of the straight line segments in the plane W 1 of the three principle factors for the first group is used to estimate the second spectral component, corresponding to curve vertex U (2).
- straight line segments in the plane W 2 of the three principle factors for the second group are used to extrapolate V (3), the estimate the third spectral component, corresponding to vertex U (3).
- the spectrum P (2) of the second component eluting during the interval is equal to the product of the corresponding factor matrix F 2 and the coordinates of the extrapolated intersection V (2) by curve vertex U (2).
- the estimates of the spectra of the component compounds that have been made as described above comprise a matrix P , whose columns are the pure component spectra P ( k ), completing the method step indicated at 306 of FIG. 3.
- concentrations relative to the concentrations of each compound for which the sum of the squares of the spectral elements is unity one are found, as indicated at 307 of FIG. 3, by least-squares fitting of the estimated spectra P ( k ) of the component compounds to each experimental spectrum and then integrating over the interval, for example by using the trapezoidal rule, to find their total area.
- the concentration vectors C ( i ) can be used to obtain a concentration versus time plot for each of the four principle components P ( k ) as illustrated in FIG. 5.
- a curve P representing the sum of the four components P ( k ) serves as a reconstruction of the original data matrix S .
- the effectiveness of the present method is demonstrated by comparing the estimated spectrum for the second compound corresponding to P (2) as illustrated in FIG. 6A with the experimental spectrum in FIG. 6B of the same compound well-separated chromatographically.
- the program provides for improving the original estimates, as indicated in the second column of FIG. 3, by comparing the computed concentrations with a standard.
- it is convenient to express the original spectra in a space defined by a principal factor matrix G , where the number of principal factors is set equal to the number of compounds present.
- the factor matrix G is determined by factor analyzing all the experimental spectra S ( j ) between the first and last vertices, e.g., between U (1) and U (4) in the example.
- the full set of spectra data S is used in the analysis.
- the expansion of the truncated data in the space of matrix G is denoted as S g ; likewise the expansion of S( i ) in the space G is denoted S g ( i ).
- S g ( i ) is the expansion of the i th spectrum in the space of factors defined by matrix G
- G ′ is the transpose of G
- the component factor matrix A 1 is a ( k x k , e.g. 4 x 4, in the example) square matrix, the columns of which are vectors whose elements are equal in number to the compounds present.
- C 1( i ) is the concentration vector for S ( i ) having the relative concentrations of the compounds as its elements.
- the subscript "1" denotes that A 1 and C 1( i ) are the first estimates used in an iterative procedure for determining successively improved estimates.
- the rows of matrix C 1 are the computed elution profiles for the components; the columns of C 1 are the computed concentrations found from each experimental spectrum.
- B With iteration, the value of B becomes smaller. It does not necessarily go to zero, since the referent of interest may not be attainable with a limited number of factors. When the iteration process seems to work well, the change in spectral estimates is relatively slight. At each stage of the iteration process, B provides for an estimate of the error in the component spectra.
- the error in the estimated component spectra is one of two sources of error in the computation of concentration.
- the other source of error is noise in the experimental spectra.
- the noise is orthogonal to the principal factors, its root means square amplitude is given by the Euclidean norm ⁇ S ( i ) - GG ′ S ( i ) ⁇ . Because of the factor expansion we are using, this is also equal to the norm of the residual misfit between the experimental spectrum and the least-squares linear combination of estimated component spectrum.
- the norm for the total concentration vectors can be estimated by ⁇ X ⁇ - ⁇ C ( i ) ⁇
- ⁇ X ⁇ The error bound, ⁇ X ⁇ , is estimated using a method adapted from J. Stoer and R. Bulirsch, Introduction to Numerical Analysis , Springer-Verlag, New York, 1980.
- ⁇ X ⁇ lub( A ⁇ 1) lub( B ) ⁇ X ⁇ . + (lub( A ⁇ 1))2 lub( B ) ⁇ Y ⁇ + lub( A ⁇ 1) ⁇ Y ⁇
- lub( A ⁇ 1) is large, as it will be if component spectra are highly correlated, the error bound may very well be larger than the integrated area of a component peak, especially if the peak is small.
- the error in each component peak must be less than the error bound, but one cannot really say how much of the total error should be ascribed to each peak.
- the error bound may not be a sufficient measure of error if a mistake is made in determining the number of compounds present or if an assumption such as linearity does not apply.
- the complete spectra of the components are reconstructed from the same spectra used to form the data matrix, without any weighting or windowing, by assuming that they are the same linear combination of the original data that the weighted component spectra used for deconvolution are of the weighted spectra that comprise the data matrix.
- the complete spectra are also updated and stored.
- the effect of the improvement procedure shows up much more strongly in the deconvolution of a section of a chromatogram obtained using gas chromatography with mass spectroscopy (GC/MS) techniques.
- GC/MS gas chromatography with mass spectroscopy
- the vertex-picking algorithm finds too many vertices because of the noise in the data. Vertices should be at regions where the density of data points in their locus plane is a maximum, corresponding to maximum in the relative concentrations of the eluting compounds. It is therefore easy to reject the extra ones that appear where the density of points is low. After rejecting the low density maxima, four rounded vertices 701, 702, 703 and 704 are identified, indicating four principal components.
- steps 301-307 in the first column of FIG. 3 leads to the deconvoluted peaks shown in FIG. 8.
- the negative amplitude for the second component indicates that the estimates for the spectra could be improved.
- steps 308-311 in the second column of FIG. 3 are shown in FIG. 9.
- the iterative improvement process does not change the spectral estimates very much. As might be expected when there are only weak requirements on the elution profiles, the estimates must be reasonably accurate in the first place if the procedure is to converge to a better result.
- the table of FIG. 10 shows how the estimates of peak areas and error bound change with each iteration. Except for the increase in the second peak's area as the negative part disappears, changes in peak area are less than 3% after the first iteration.
- a system, program and method for deconvolving chromatographic peaks having the following characteristics. 1) Deconvolution can be performed in a reasonable time. 2) The chromatographic overlap can be fairly complicated; i.e., up to three components may elute at once, and chains of at least six compounds are readily accommodated. 3) The method is applicable to any sort of chromatographic detector that produces spectra whose amplitudes are linear with concentration. 4) No assumptions are made about the shape of the elution peaks except, in the improvement routine, non-negativity and negligible amplitude away from the mean. 5) No assumptions whatsoever are made about the structure of the spectra of the constituent compounds. 6) An error bound is obtained on the computed concentrations. 7) No previous knowledge of the spectra of the eluting compounds is required. 8) Estimates of the full spectra of the eluting compounds are created that can be used to identify them.
- the present invention can be applied to data after base-line correction has been effected, and the present invention can be applied to modified data arrays, such as result when the first or higher order derivatives of spectral data are obtained. Since there are innumerable equivalent procedures for implementing each step of the invention, its scope is limited only by the following claims.
Landscapes
- General Physics & Mathematics (AREA)
- Physics & Mathematics (AREA)
- Chemical & Material Sciences (AREA)
- Analytical Chemistry (AREA)
- Mathematical Optimization (AREA)
- Pure & Applied Mathematics (AREA)
- Health & Medical Sciences (AREA)
- Life Sciences & Earth Sciences (AREA)
- Algebra (AREA)
- Mathematical Analysis (AREA)
- Biochemistry (AREA)
- General Health & Medical Sciences (AREA)
- Immunology (AREA)
- Pathology (AREA)
- Investigating Or Analysing Materials By Optical Means (AREA)
- Treatment Of Liquids With Adsorbents In General (AREA)
- Other Investigation Or Analysis Of Materials By Electrical Means (AREA)
Applications Claiming Priority (2)
| Application Number | Priority Date | Filing Date | Title |
|---|---|---|---|
| US07/057,077 US4807148A (en) | 1987-05-29 | 1987-05-29 | Deconvolving chromatographic peaks |
| US57077 | 1987-05-29 |
Publications (3)
| Publication Number | Publication Date |
|---|---|
| EP0294121A2 true EP0294121A2 (de) | 1988-12-07 |
| EP0294121A3 EP0294121A3 (en) | 1990-07-04 |
| EP0294121B1 EP0294121B1 (de) | 1995-10-04 |
Family
ID=22008354
Family Applications (1)
| Application Number | Title | Priority Date | Filing Date |
|---|---|---|---|
| EP88304858A Expired - Lifetime EP0294121B1 (de) | 1987-05-29 | 1988-05-27 | Dekonvolution von chromatographischen Peaks |
Country Status (4)
| Country | Link |
|---|---|
| US (1) | US4807148A (de) |
| EP (1) | EP0294121B1 (de) |
| JP (1) | JP3045729B2 (de) |
| DE (1) | DE3854537T2 (de) |
Cited By (9)
| Publication number | Priority date | Publication date | Assignee | Title |
|---|---|---|---|---|
| WO1999001760A1 (de) * | 1997-06-30 | 1999-01-14 | GSF - Forschungszentrum für Umwelt und Gesundheit GmbH | Verfahren zur bestimmung der anzahl von komponenten in peaks, banden und signalen von chromatogrammen, elektrogrammen und spektrogrammen aller art |
| EP1333382A1 (de) * | 2002-01-30 | 2003-08-06 | Agilent Technologies, Inc. (a Delaware corporation) | Verfahren zur Bearbeitung von Messdaten und Vorrichtung zur Durchführung des Verfahrens |
| EP2012111A4 (de) * | 2006-03-24 | 2009-07-15 | Arkray Inc | Verfahren zur messung der glykohämoglobinkonzentration und vorrichtung zur konzentrationsmessung |
| EP2250474A4 (de) * | 2008-02-06 | 2011-11-02 | Fei Co | Verfahren und system zur spektraldatenanalyse |
| CN102735783A (zh) * | 2012-06-25 | 2012-10-17 | 上海申瑞继保电气有限公司 | 一种油中气体色谱图面积计算方法 |
| CN104049055A (zh) * | 2014-06-04 | 2014-09-17 | 上海申瑞继保电气有限公司 | 电力设备油中气体色谱峰面积计算方法 |
| CN104931631A (zh) * | 2015-07-07 | 2015-09-23 | 天津大学 | 基于双峰搜索法分离严重重叠色谱峰的方法 |
| EP3407061A4 (de) * | 2015-11-05 | 2019-10-23 | Shimadzu Corporation | Verfahren und vorrichtung zur verarbeitung von daten aus chromatografischer massenspektrometrie |
| CN111195131A (zh) * | 2018-11-20 | 2020-05-26 | 三星电子株式会社 | 测量光谱的装置及估计分析物浓度的装置和方法 |
Families Citing this family (57)
| Publication number | Priority date | Publication date | Assignee | Title |
|---|---|---|---|---|
| US4941101A (en) * | 1987-09-01 | 1990-07-10 | Hewlett-Packard Company | Method for analyzing chromatograms |
| US5014216A (en) * | 1988-07-19 | 1991-05-07 | Beckman Instruments, Inc. | Concentration determination with multiple wavelength flash photometers |
| US4974209A (en) * | 1988-09-02 | 1990-11-27 | The Perkin-Elmer Corporation | Interactive smoothing system |
| US5311445A (en) * | 1989-04-19 | 1994-05-10 | Board Of Regents Of The University Of Oklahoma | Deconvoluted band representation for infrared spectrum compression |
| US5121443A (en) * | 1989-04-25 | 1992-06-09 | Spectra-Physics, Inc. | Neural net system for analyzing chromatographic peaks |
| US5023804A (en) * | 1989-05-23 | 1991-06-11 | The Perkin-Elmer Corporation | Method and apparatus for comparing spectra |
| US5043928A (en) * | 1989-06-19 | 1991-08-27 | Linear Instruments | Resampling system using data interpolation to eliminate time effects |
| JP2517688B2 (ja) * | 1989-12-25 | 1996-07-24 | 日本電子株式会社 | 3次元核磁気共鳴スペクトルの対称化処理方法 |
| WO1991019183A1 (en) * | 1990-06-04 | 1991-12-12 | Eastman Kodak Company | Method for interactive self-modeling mixture analysis |
| US5121337A (en) * | 1990-10-15 | 1992-06-09 | Exxon Research And Engineering Company | Method for correcting spectral data for data due to the spectral measurement process itself and estimating unknown property and/or composition data of a sample using such method |
| JP2602366B2 (ja) * | 1991-02-18 | 1997-04-23 | 株式会社日立製作所 | クロマトグラフ装置 |
| FR2675265B1 (fr) * | 1991-04-11 | 1993-07-30 | Schlumberger Services Petrol | Procede d'analyse de melanges d'huiles hydrocarbonees utilisant la chromatographie par permeation de gel. |
| US5175430A (en) | 1991-05-17 | 1992-12-29 | Meridian Instruments, Inc. | Time-compressed chromatography in mass spectrometry |
| CA2133412A1 (en) * | 1992-04-16 | 1993-10-28 | Kenneth R. Beebe | Improved method for interpreting complex data and detecting abnormal instrument or process behavior |
| US5465608A (en) * | 1993-06-30 | 1995-11-14 | Orbital Sciences Corporation | Saw vapor sensor apparatus and multicomponent signal processing |
| JPH07218491A (ja) * | 1994-01-31 | 1995-08-18 | Shimadzu Corp | クロマトグラフ用検出装置 |
| US5644503A (en) * | 1994-03-28 | 1997-07-01 | Hitachi, Ltd. | Methods and apparatuses for analyzing multichannel chromatogram |
| US5586049A (en) * | 1994-10-19 | 1996-12-17 | International Business Machines Corporation | Apparatus and method for generating profiles of constituents of chemical mixtures |
| US5585919A (en) * | 1994-10-19 | 1996-12-17 | International Business Machines Corporation | Error minimization apparatus and method for real-time spectral deconvolution of chemical mixtures |
| US5567625A (en) * | 1994-10-19 | 1996-10-22 | International Business Machines Corporation | Apparatus and method for real-time spectral deconvolution of chemical mixtures |
| US5710713A (en) * | 1995-03-20 | 1998-01-20 | The Dow Chemical Company | Method of creating standardized spectral libraries for enhanced library searching |
| US5545895A (en) * | 1995-03-20 | 1996-08-13 | The Dow Chemical Company | Method of standardizing data obtained through mass spectrometry |
| US5602755A (en) * | 1995-06-23 | 1997-02-11 | Exxon Research And Engineering Company | Method for predicting chemical or physical properties of complex mixtures |
| US5827946A (en) * | 1997-04-30 | 1998-10-27 | Hewlett-Packard Company | Method for sample identification using a locked retention time database |
| US5985120A (en) * | 1997-06-12 | 1999-11-16 | University Of Massachusetts | Rapid analysis of analyte solutions |
| US5939612A (en) * | 1998-04-28 | 1999-08-17 | Hewlett-Packard Company | Retention time-locked spectral database for target analyte analysis |
| US7200494B2 (en) * | 2001-10-30 | 2007-04-03 | Hitachi, Ltd. | Method and apparatus for chromatographic data processing |
| US6748333B1 (en) * | 1999-09-27 | 2004-06-08 | Hitachi, Ltd. | Method and apparatus for chromatographic data processing, and chromatograph |
| US6629039B1 (en) * | 2000-04-27 | 2003-09-30 | Perkinelmer Instruments Llc | Method and apparatus for impurity detection |
| US6922715B2 (en) * | 2000-05-08 | 2005-07-26 | International Business Machines Corporation | Computer implemented method and program for estimation of characteristic values of matrixes using statistical sampling |
| GB2405972B (en) * | 2002-05-31 | 2007-08-15 | Waters Investments Ltd | A method of using data binning in the analysis of chromatograhpy/spectrometry data |
| JP4753722B2 (ja) * | 2006-01-06 | 2011-08-24 | 財団法人電力中央研究所 | Pcb分析方法 |
| US20080306694A1 (en) * | 2006-02-06 | 2008-12-11 | Siemens Healthcare Diagnostics Inc. | Methods for Detecting Peaks in a Nucleic Acid Data Trace |
| US7720612B2 (en) * | 2006-02-06 | 2010-05-18 | Siemens Healthcare Diagnostics, Inc. | Methods for resolving convoluted peaks in a chromatogram |
| US20080073499A1 (en) * | 2006-07-25 | 2008-03-27 | George Yefchak | Peak finding in low-resolution mass spectrometry by use of chromatographic integration routines |
| US8073639B2 (en) * | 2007-08-31 | 2011-12-06 | Dh Technologies Development Pte. Ltd. | Method for identifying a convolved peak |
| US7983852B2 (en) * | 2008-10-21 | 2011-07-19 | Thermo Finnigan Llc | Methods of automated spectral peak detection and quantification without user input |
| JP5146344B2 (ja) * | 2009-02-09 | 2013-02-20 | 株式会社島津製作所 | クロマトグラフ用データ処理装置 |
| US8428889B2 (en) | 2010-10-07 | 2013-04-23 | Thermo Finnigan Llc | Methods of automated spectral peak detection and quantification having learning mode |
| US8664595B2 (en) | 2012-06-28 | 2014-03-04 | Fei Company | Cluster analysis of unknowns in SEM-EDS dataset |
| US9188555B2 (en) | 2012-07-30 | 2015-11-17 | Fei Company | Automated EDS standards calibration |
| US9091635B2 (en) | 2012-10-26 | 2015-07-28 | Fei Company | Mineral identification using mineral definitions having compositional ranges |
| US9778215B2 (en) | 2012-10-26 | 2017-10-03 | Fei Company | Automated mineral classification |
| US8937282B2 (en) | 2012-10-26 | 2015-01-20 | Fei Company | Mineral identification using mineral definitions including variability |
| US9048067B2 (en) | 2012-10-26 | 2015-06-02 | Fei Company | Mineral identification using sequential decomposition into elements from mineral definitions |
| US9194829B2 (en) | 2012-12-28 | 2015-11-24 | Fei Company | Process for performing automated mineralogy |
| US9714908B2 (en) | 2013-11-06 | 2017-07-25 | Fei Company | Sub-pixel analysis and display of fine grained mineral samples |
| US10302607B2 (en) | 2015-06-10 | 2019-05-28 | Vuv Analytics, Inc. | Method for detailed and bulk classification analysis of complex samples using vacuum ultra-violet spectroscopy and gas chromatography |
| CN105067732A (zh) * | 2015-07-07 | 2015-11-18 | 天津大学 | 基于二阶高斯函数拟合的色谱重叠峰定量方法 |
| US9967367B2 (en) * | 2015-08-04 | 2018-05-08 | Utomik Bv | Method and system for predictively providing software |
| CN105675778B (zh) * | 2016-01-06 | 2017-05-17 | 东南大学 | 基于双树复小波变换的色谱重叠峰分解方法 |
| US10139378B2 (en) * | 2016-05-16 | 2018-11-27 | Exxonmobil Chemical Patents Inc. | Methods of determining molecular weight and comonomer characteristics of a copolymer in polymer blends |
| US10732158B2 (en) * | 2016-08-31 | 2020-08-04 | Exxonmobil Chemical Patents Inc. | Integrated high-throughput methods to characterize multi-component polymers |
| CN109085282A (zh) * | 2018-06-22 | 2018-12-25 | 东南大学 | 一种基于小波变换和随机森林模型的色谱重叠峰解析方法 |
| SG10202002459UA (en) * | 2020-03-17 | 2021-10-28 | Shimadzu Corp | Peak analyzing method and waveform processing device |
| JP7517295B2 (ja) * | 2021-09-27 | 2024-07-17 | 株式会社島津製作所 | データ処理方法及びデータ処理システム |
| WO2023150167A1 (en) * | 2022-02-01 | 2023-08-10 | Genentech, Inc. | Peak deconvolution for chromatographic time-series composite signals |
Family Cites Families (15)
| Publication number | Priority date | Publication date | Assignee | Title |
|---|---|---|---|---|
| JPS537398A (en) * | 1976-06-30 | 1978-01-23 | Hitachi Ltd | Data processing apparatus |
| FR2443102A1 (fr) * | 1978-11-28 | 1980-06-27 | Delsi | Procede de trace d'un chromatogramme |
| US4314343A (en) * | 1980-01-25 | 1982-02-02 | Spectra-Physics, Inc. | Method and apparatus for detecting and integrating chromatographic peaks |
| US4353242A (en) * | 1980-12-16 | 1982-10-12 | University Of Utah Research Foundation | Multichannel detection and resolution of chromatographic peaks |
| JPS58144744A (ja) * | 1982-02-24 | 1983-08-29 | Hitachi Ltd | クロマトグラフデ−タ処理装置 |
| JPS59218951A (ja) * | 1983-05-27 | 1984-12-10 | Asahi Chem Ind Co Ltd | クロマトグラムのピ−ク値算出装置 |
| JPS6022659A (ja) * | 1983-07-18 | 1985-02-05 | Asahi Chem Ind Co Ltd | クロマトグラムのピ−ク値算出装置 |
| JPS6035259A (ja) * | 1983-08-05 | 1985-02-23 | Asahi Chem Ind Co Ltd | 成分分析装置 |
| US4631687A (en) * | 1983-11-03 | 1986-12-23 | Rohrback Technology Corporation | Method and apparatus for analysis employing multiple separation processes |
| US4642778A (en) * | 1984-03-02 | 1987-02-10 | Indiana University Foundation | Method and device for spectral reconstruction |
| JPH0715465B2 (ja) * | 1984-09-29 | 1995-02-22 | 株式会社島津製作所 | 液体クロマトグラフ用マルチチヤンネル検出デ−タ処理装置 |
| JPS61154563U (de) * | 1985-03-18 | 1986-09-25 | ||
| JPS62231164A (ja) * | 1986-03-31 | 1987-10-09 | Japan Spectroscopic Co | 複数の検出器を用いたクロマトグラフイにおけるデ−タ処理方法 |
| JPS63151851A (ja) * | 1986-12-17 | 1988-06-24 | Hitachi Ltd | クロマトグラフ用デ−タ処理装置 |
| JPS63204146A (ja) * | 1987-02-19 | 1988-08-23 | Shimadzu Corp | ガスクロマトグラフイ質量分析装置における定性分析方法 |
-
1987
- 1987-05-29 US US07/057,077 patent/US4807148A/en not_active Expired - Lifetime
-
1988
- 1988-05-27 JP JP63131294A patent/JP3045729B2/ja not_active Expired - Fee Related
- 1988-05-27 EP EP88304858A patent/EP0294121B1/de not_active Expired - Lifetime
- 1988-05-27 DE DE3854537T patent/DE3854537T2/de not_active Expired - Fee Related
Cited By (16)
| Publication number | Priority date | Publication date | Assignee | Title |
|---|---|---|---|---|
| US6339950B1 (en) | 1997-06-30 | 2002-01-22 | GSF Foschungszentrum für Umwelt und Gesundheit GmbH | Process for determining the number of components in peaks, bands, and signals of chromatograms, electrograms, and spectrograms |
| WO1999001760A1 (de) * | 1997-06-30 | 1999-01-14 | GSF - Forschungszentrum für Umwelt und Gesundheit GmbH | Verfahren zur bestimmung der anzahl von komponenten in peaks, banden und signalen von chromatogrammen, elektrogrammen und spektrogrammen aller art |
| EP1333382A1 (de) * | 2002-01-30 | 2003-08-06 | Agilent Technologies, Inc. (a Delaware corporation) | Verfahren zur Bearbeitung von Messdaten und Vorrichtung zur Durchführung des Verfahrens |
| US7117109B2 (en) | 2002-01-30 | 2006-10-03 | Agilent Technologies, Inc. | Procedure for processing measuring data and device to perform the process |
| EP2012111A4 (de) * | 2006-03-24 | 2009-07-15 | Arkray Inc | Verfahren zur messung der glykohämoglobinkonzentration und vorrichtung zur konzentrationsmessung |
| US8268625B2 (en) | 2006-03-24 | 2012-09-18 | Arkray, Inc. | Method of measuring glycated hemoglobin concentration and concentration measuring apparatus |
| EP2250474A4 (de) * | 2008-02-06 | 2011-11-02 | Fei Co | Verfahren und system zur spektraldatenanalyse |
| CN102084229B (zh) * | 2008-02-06 | 2014-10-15 | Fei公司 | 谱数据分析的方法和系统 |
| CN102735783B (zh) * | 2012-06-25 | 2015-02-18 | 上海申瑞继保电气有限公司 | 一种油中气体色谱图面积计算方法 |
| CN102735783A (zh) * | 2012-06-25 | 2012-10-17 | 上海申瑞继保电气有限公司 | 一种油中气体色谱图面积计算方法 |
| CN104049055A (zh) * | 2014-06-04 | 2014-09-17 | 上海申瑞继保电气有限公司 | 电力设备油中气体色谱峰面积计算方法 |
| CN104049055B (zh) * | 2014-06-04 | 2016-01-20 | 上海申瑞继保电气有限公司 | 电力设备油中气体色谱峰面积计算方法 |
| CN104931631A (zh) * | 2015-07-07 | 2015-09-23 | 天津大学 | 基于双峰搜索法分离严重重叠色谱峰的方法 |
| EP3407061A4 (de) * | 2015-11-05 | 2019-10-23 | Shimadzu Corporation | Verfahren und vorrichtung zur verarbeitung von daten aus chromatografischer massenspektrometrie |
| US10866222B2 (en) | 2015-11-05 | 2020-12-15 | Shimadzu Corporation | Chromatograph mass spectrometric data processing method and processing device |
| CN111195131A (zh) * | 2018-11-20 | 2020-05-26 | 三星电子株式会社 | 测量光谱的装置及估计分析物浓度的装置和方法 |
Also Published As
| Publication number | Publication date |
|---|---|
| DE3854537T2 (de) | 1996-03-21 |
| JPS63308560A (ja) | 1988-12-15 |
| EP0294121B1 (de) | 1995-10-04 |
| EP0294121A3 (en) | 1990-07-04 |
| US4807148A (en) | 1989-02-21 |
| JP3045729B2 (ja) | 2000-05-29 |
| DE3854537D1 (de) | 1995-11-09 |
Similar Documents
| Publication | Publication Date | Title |
|---|---|---|
| US4807148A (en) | Deconvolving chromatographic peaks | |
| Gemperline | Target transformation factor analysis with linear inequality constraints applied to spectroscopic-chromatographic data | |
| US7110886B2 (en) | Method and apparatus for analyzing multi-channel chromatogram | |
| Perczel et al. | Analysis of the circular dichroism spectrum of proteins using the convex constraint algorithm: a practical guide | |
| Keller et al. | Evolving factor analysis | |
| EP0437829B1 (de) | Verfahren zur Unterscheidung von Mischungen chemischer Verbindungen | |
| Windig | Self-modeling mixture analysis of spectral data with continuous concentration profiles | |
| Hamilton et al. | Mixture analysis using factor analysis. II: self‐modeling curve resolution | |
| US9472386B2 (en) | Chromatograph mass spectrometry data processing apparatus | |
| US4802102A (en) | Baseline correction for chromatography | |
| Manne et al. | Resolution of two-way data from hyphenated chromatography by means of elementary matrix transformations | |
| WO1991019183A1 (en) | Method for interactive self-modeling mixture analysis | |
| Xu et al. | Evolving window orthogonal projections method for two-way data resolution | |
| Molenaar et al. | Peak-tracking algorithm for use in comprehensive two-dimensional liquid chromatography–Application to monoclonal-antibody peptides | |
| Liang et al. | Resolution of two-way data: theoretical background and practical problem-solving Part 1: Theoretical background and methodology: Part 1: Theoretical background and methodology | |
| Davis et al. | Principal-component analysis applied to combined gas chromatographic-mass spectrometric data | |
| Lindberg et al. | Multivariate resolution of overlapped peaks in liquid chromatography using diode array detection | |
| Sanchez et al. | Algorithms for the assessment of peak purity in liquid chromatography with photodiode-array detection. Part II | |
| Sánchez et al. | Effect of different preprocessing methods for principal component analysis applied to the composition of mixtures: Detection of impurities in HPLC—DAD | |
| Chen et al. | Reconstruction of mass spectra of components of unknown mixtures based on factor analysis | |
| US20020133298A1 (en) | Determination and use of three-dimensional moments of molecular property fields | |
| WO2005096765A2 (en) | Methods and apparatuses for processing biological data | |
| JPH0815247A (ja) | マルチチャンネルクロマトグラムの解析方法及びデータ処理装置 | |
| Sharaf | Qualitative and quantitative resolution of ternary mixtures | |
| Mauro et al. | Resolution of infrared spectra of mixtures by self-modeling curve resolution using a library of reference spectra with simplex-assisted searching |
Legal Events
| Date | Code | Title | Description |
|---|---|---|---|
| PUAI | Public reference made under article 153(3) epc to a published international application that has entered the european phase |
Free format text: ORIGINAL CODE: 0009012 |
|
| AK | Designated contracting states |
Kind code of ref document: A2 Designated state(s): DE FR GB |
|
| PUAL | Search report despatched |
Free format text: ORIGINAL CODE: 0009013 |
|
| AK | Designated contracting states |
Kind code of ref document: A3 Designated state(s): DE FR GB |
|
| 17P | Request for examination filed |
Effective date: 19901003 |
|
| 17Q | First examination report despatched |
Effective date: 19930517 |
|
| GRAA | (expected) grant |
Free format text: ORIGINAL CODE: 0009210 |
|
| AK | Designated contracting states |
Kind code of ref document: B1 Designated state(s): DE FR GB |
|
| REF | Corresponds to: |
Ref document number: 3854537 Country of ref document: DE Date of ref document: 19951109 |
|
| ET | Fr: translation filed | ||
| PGFP | Annual fee paid to national office [announced via postgrant information from national office to epo] |
Ref country code: FR Payment date: 19960415 Year of fee payment: 9 |
|
| PGFP | Annual fee paid to national office [announced via postgrant information from national office to epo] |
Ref country code: DE Payment date: 19960423 Year of fee payment: 9 |
|
| PGFP | Annual fee paid to national office [announced via postgrant information from national office to epo] |
Ref country code: GB Payment date: 19960425 Year of fee payment: 9 |
|
| PLBE | No opposition filed within time limit |
Free format text: ORIGINAL CODE: 0009261 |
|
| STAA | Information on the status of an ep patent application or granted ep patent |
Free format text: STATUS: NO OPPOSITION FILED WITHIN TIME LIMIT |
|
| 26N | No opposition filed | ||
| PG25 | Lapsed in a contracting state [announced via postgrant information from national office to epo] |
Ref country code: GB Effective date: 19970527 |
|
| GBPC | Gb: european patent ceased through non-payment of renewal fee |
Effective date: 19970527 |
|
| PG25 | Lapsed in a contracting state [announced via postgrant information from national office to epo] |
Ref country code: FR Free format text: LAPSE BECAUSE OF NON-PAYMENT OF DUE FEES Effective date: 19980130 |
|
| PG25 | Lapsed in a contracting state [announced via postgrant information from national office to epo] |
Ref country code: DE Free format text: LAPSE BECAUSE OF NON-PAYMENT OF DUE FEES Effective date: 19980203 |
|
| REG | Reference to a national code |
Ref country code: FR Ref legal event code: ST |