EP2667183A1 - Lichtanalyseverfahren und lichtanalysevorrichtung mit erkennung von licht aus einzelnen lichtemittierenden teilchen - Google Patents
Lichtanalyseverfahren und lichtanalysevorrichtung mit erkennung von licht aus einzelnen lichtemittierenden teilchen Download PDFInfo
- Publication number
- EP2667183A1 EP2667183A1 EP12736506.2A EP12736506A EP2667183A1 EP 2667183 A1 EP2667183 A1 EP 2667183A1 EP 12736506 A EP12736506 A EP 12736506A EP 2667183 A1 EP2667183 A1 EP 2667183A1
- Authority
- EP
- European Patent Office
- Prior art keywords
- light
- emitting
- detection region
- emitting particles
- detecting
- Prior art date
- Legal status (The legal status is an assumption and is not a legal conclusion. Google has not performed a legal analysis and makes no representation as to the accuracy of the status listed.)
- Withdrawn
Links
- 239000002245 particle Substances 0.000 title claims abstract description 479
- 238000000034 method Methods 0.000 title claims abstract description 131
- 230000023077 detection of light stimulus Effects 0.000 title description 2
- 238000007557 optical granulometry Methods 0.000 title 2
- 238000001514 detection method Methods 0.000 claims abstract description 210
- 239000012488 sample solution Substances 0.000 claims abstract description 126
- 238000005259 measurement Methods 0.000 claims abstract description 89
- 230000003287 optical effect Effects 0.000 claims abstract description 81
- 238000004458 analytical method Methods 0.000 claims description 38
- 238000012545 processing Methods 0.000 claims description 27
- 230000008569 process Effects 0.000 abstract description 53
- 239000000243 solution Substances 0.000 description 39
- 238000004204 optical analysis method Methods 0.000 description 19
- 238000002060 fluorescence correlation spectroscopy Methods 0.000 description 18
- 230000005284 excitation Effects 0.000 description 17
- 230000006870 function Effects 0.000 description 14
- 239000000523 sample Substances 0.000 description 12
- 238000002474 experimental method Methods 0.000 description 11
- 230000008859 change Effects 0.000 description 10
- 230000005653 Brownian motion process Effects 0.000 description 9
- 238000005537 brownian motion Methods 0.000 description 9
- 238000010586 diagram Methods 0.000 description 9
- 238000009499 grossing Methods 0.000 description 9
- 238000009826 distribution Methods 0.000 description 8
- 238000004364 calculation method Methods 0.000 description 7
- 230000033001 locomotion Effects 0.000 description 6
- 238000009739 binding Methods 0.000 description 5
- 238000006243 chemical reaction Methods 0.000 description 5
- 238000009792 diffusion process Methods 0.000 description 5
- 239000007850 fluorescent dye Substances 0.000 description 5
- 108090000623 proteins and genes Proteins 0.000 description 5
- 230000003252 repetitive effect Effects 0.000 description 5
- 230000009471 action Effects 0.000 description 4
- 230000029918 bioluminescence Effects 0.000 description 4
- 238000005415 bioluminescence Methods 0.000 description 4
- 238000005286 illumination Methods 0.000 description 4
- 230000007246 mechanism Effects 0.000 description 4
- 108020004707 nucleic acids Proteins 0.000 description 4
- 102000039446 nucleic acids Human genes 0.000 description 4
- 150000007523 nucleic acids Chemical class 0.000 description 4
- 102000004169 proteins and genes Human genes 0.000 description 4
- 241000700605 Viruses Species 0.000 description 3
- 150000001413 amino acids Chemical class 0.000 description 3
- 239000000356 contaminant Substances 0.000 description 3
- 239000000835 fiber Substances 0.000 description 3
- 239000010419 fine particle Substances 0.000 description 3
- 150000002632 lipids Chemical class 0.000 description 3
- 238000000691 measurement method Methods 0.000 description 3
- 108090000765 processed proteins & peptides Proteins 0.000 description 3
- 238000010183 spectrum analysis Methods 0.000 description 3
- 238000003860 storage Methods 0.000 description 3
- 239000000126 substance Substances 0.000 description 3
- 239000000758 substrate Substances 0.000 description 3
- 238000012360 testing method Methods 0.000 description 3
- 230000002776 aggregation Effects 0.000 description 2
- 238000004220 aggregation Methods 0.000 description 2
- 238000005311 autocorrelation function Methods 0.000 description 2
- 230000004888 barrier function Effects 0.000 description 2
- 239000000084 colloidal system Substances 0.000 description 2
- 239000006185 dispersion Substances 0.000 description 2
- 208000018459 dissociative disease Diseases 0.000 description 2
- 239000000975 dye Substances 0.000 description 2
- 230000000694 effects Effects 0.000 description 2
- 230000003993 interaction Effects 0.000 description 2
- 230000009878 intermolecular interaction Effects 0.000 description 2
- 208000037805 labour Diseases 0.000 description 2
- 239000013307 optical fiber Substances 0.000 description 2
- 238000005457 optimization Methods 0.000 description 2
- 238000002360 preparation method Methods 0.000 description 2
- 238000012827 research and development Methods 0.000 description 2
- 238000012109 statistical procedure Methods 0.000 description 2
- 238000012935 Averaging Methods 0.000 description 1
- 108090000790 Enzymes Proteins 0.000 description 1
- 102000004190 Enzymes Human genes 0.000 description 1
- 229920001213 Polysorbate 20 Polymers 0.000 description 1
- 238000010521 absorption reaction Methods 0.000 description 1
- 239000007864 aqueous solution Substances 0.000 description 1
- 238000000149 argon plasma sintering Methods 0.000 description 1
- 230000008901 benefit Effects 0.000 description 1
- 230000000975 bioactive effect Effects 0.000 description 1
- 238000002306 biochemical method Methods 0.000 description 1
- 239000007853 buffer solution Substances 0.000 description 1
- 238000003759 clinical diagnosis Methods 0.000 description 1
- 238000007796 conventional method Methods 0.000 description 1
- 230000003247 decreasing effect Effects 0.000 description 1
- 238000011161 development Methods 0.000 description 1
- 230000018109 developmental process Effects 0.000 description 1
- 230000004069 differentiation Effects 0.000 description 1
- 238000006073 displacement reaction Methods 0.000 description 1
- 238000010494 dissociation reaction Methods 0.000 description 1
- 239000003814 drug Substances 0.000 description 1
- 239000013067 intermediate product Substances 0.000 description 1
- 230000001678 irradiating effect Effects 0.000 description 1
- 239000007788 liquid Substances 0.000 description 1
- 239000000693 micelle Substances 0.000 description 1
- 230000004048 modification Effects 0.000 description 1
- 238000012986 modification Methods 0.000 description 1
- 239000003960 organic solvent Substances 0.000 description 1
- 239000013618 particulate matter Substances 0.000 description 1
- 235000010486 polyoxyethylene sorbitan monolaurate Nutrition 0.000 description 1
- 239000000256 polyoxyethylene sorbitan monolaurate Substances 0.000 description 1
- 239000000047 product Substances 0.000 description 1
- 230000009467 reduction Effects 0.000 description 1
- 238000012216 screening Methods 0.000 description 1
- 238000004904 shortening Methods 0.000 description 1
- 238000013179 statistical model Methods 0.000 description 1
Images


Classifications
-
- G—PHYSICS
- G01—MEASURING; TESTING
- G01J—MEASUREMENT OF INTENSITY, VELOCITY, SPECTRAL CONTENT, POLARISATION, PHASE OR PULSE CHARACTERISTICS OF INFRARED, VISIBLE OR ULTRAVIOLET LIGHT; COLORIMETRY; RADIATION PYROMETRY
- G01J1/00—Photometry, e.g. photographic exposure meter
- G01J1/42—Photometry, e.g. photographic exposure meter using electric radiation detectors
-
- G—PHYSICS
- G01—MEASURING; TESTING
- G01N—INVESTIGATING OR ANALYSING MATERIALS BY DETERMINING THEIR CHEMICAL OR PHYSICAL PROPERTIES
- G01N21/00—Investigating or analysing materials by the use of optical means, i.e. using sub-millimetre waves, infrared, visible or ultraviolet light
- G01N21/62—Systems in which the material investigated is excited whereby it emits light or causes a change in wavelength of the incident light
- G01N21/63—Systems in which the material investigated is excited whereby it emits light or causes a change in wavelength of the incident light optically excited
- G01N21/64—Fluorescence; Phosphorescence
- G01N21/645—Specially adapted constructive features of fluorimeters
- G01N21/6452—Individual samples arranged in a regular 2D-array, e.g. multiwell plates
-
- G—PHYSICS
- G02—OPTICS
- G02B—OPTICAL ELEMENTS, SYSTEMS OR APPARATUS
- G02B21/00—Microscopes
- G02B21/0004—Microscopes specially adapted for specific applications
- G02B21/002—Scanning microscopes
- G02B21/0024—Confocal scanning microscopes (CSOMs) or confocal "macroscopes"; Accessories which are not restricted to use with CSOMs, e.g. sample holders
- G02B21/0052—Optical details of the image generation
- G02B21/0076—Optical details of the image generation arrangements using fluorescence or luminescence
-
- G—PHYSICS
- G02—OPTICS
- G02B—OPTICAL ELEMENTS, SYSTEMS OR APPARATUS
- G02B21/00—Microscopes
- G02B21/16—Microscopes adapted for ultraviolet illumination ; Fluorescence microscopes
Definitions
- This invention relates to an optical analysis method and an optical analysis device capable of detecting light from a particulate object, e.g. an atom, a molecule or an aggregate thereof (Hereafter, these are called a "particle”.), such as a biological molecule, for example, protein, peptide, nucleic acid, lipid, sugar chain, amino acid or these aggregate, virus and cell, etc., or a non-biological particle, dispersed or dissolved in a solution, by using an optical system, such as the optical system of a confocal microscope or a multiphoton microscope, which can detect light from a micro region in a solution, to acquire useful information in an analysis of conditions (interaction, binding or dissociating condition, etc.) of particles, and more specifically, relates to a method and a device of detecting individually the light from a single particle which emits light, using an optical system as described above, to make it possible to conduct various optical analyses.
- a particulate object e.g. an atom, a
- a particle which emits light may be any of a particle which itself emits light and a particle to which an arbitrary light-emitting label or light-emitting probe has been attached, and the light emitted from a light-emitting particle may be fluorescence, phosphorescence, chemiluminescence, bioluminescence, scattered light, etc.
- patent documents 1-3 and non-patent documents 1-3 by means of the optical system of a laser confocal microscope and a photon counting technique, there is performed the measurement of fluorescence intensity of fluorescent molecules or fluorescently labeled molecules (fluorescent molecules, etc.), entering into and exiting out of a micro region (the focal region to which the laser light of the microscope is condensed, called a "confocal volume”) in a sample solution, and based on the average dwell time (translational diffusion time) of the fluorescent molecules, etc.
- a micro region the focal region to which the laser light of the microscope is condensed
- patent document 5 there is generated a histogram of fluorescence intensity of fluorescent molecules, etc., entering into and exiting out of a confocal volume, measured similarly to FCS; and the average value of the characteristic brightness of the fluorescent molecules, etc. and the average number of molecules dwelling in the confocal volume are calculated by fitting a statistical model formula to the distribution of the histogram, so that, based on the information thereof, the structure or size changes, binding or dissociative conditions or dispersion and aggregation conditions of molecules can be estimated.
- Patent documents 6 and 7 there are proposed methods of detecting fluorescent substances based on a time progress of fluorescence signals of a sample solution measured using the optical system of a confocal microscope.
- Patent document 8 has proposed a signal calculation processing technique for measuring faint light from fluorescent fine particles flowing through a flow cytometer or fluorescent fine particles fixed on a substrate by a photon counting technique to detect the existences of the fluorescent fine particles in the flow or on the substrate.
- a sample amount required for the measurement may be extremely small (an amount used in one measurement is at most several tens of ⁇ L), and its concentration is extremely low as compared with the prior art, and the measuring time is also shortened extremely (In one measurement, a measuring process for time of order of seconds is repeated several times.).
- those techniques are expected to be a strong tool enabling an experiment or a test at low cost and/or quickly in comparison with conventional biochemical methods, especially in conducting an analysis of a rare or expensive sample often used in the field of the medical or biological research and development or in conducting tests of a large number of specimens, such as sick clinical diagnosis or the screening of bioactive substances.
- the measured light is the light emitted from single or several fluorescent molecules
- the statistical procedures for the calculating of the fluorescence intensity fluctuation, etc. such as the computation of the autocorrelation function or the fitting to the histogram of fluorescence intensity data measured in time series, and therefore the signal of the light from an individual fluorescent molecule is not seen or analyzed. That is, in these optical analysis techniques, through the statistical processing of the signals of the lights from a plurality of fluorescent molecules, etc., statistical average characteristics of the fluorescent molecules, etc. will be detected.
- the concentration or number density of a fluorescent molecule, etc. to be an observation object in the sample solution should be at a level so that fluorescent molecules, etc. of the number enabling a statistical process will enter in and exit from a micro region in one measuring term of a length of order of seconds in an equilibrium, preferably at a level so that about one fluorescent molecule, etc. will be always present in the micro region.
- the volume of a confocal volume is about 1 fL, the concentration of a fluorescent molecule, etc.
- Applicant of the present application has proposed an optical analysis technique based on a new principle which makes it possible to observe quantitatively a condition or characteristic of a light-emitting particle in a sample solution where the concentration or number density of the light-emitting particle to be an observation object is lower than the level at which the optical analysis techniques including statistical procedures, such as FCS and FIDA, etc. are used.
- an optical system which can detect light from a micro region in a solution, such as an optical system of a confocal microscope or a multiphoton microscope, similarly to FCS, FIDA, etc., and additionally, the position of the micro region, i.e.
- the detection region of light (called “light detection region” in the following) is moved in the sample solution, namely, the inside of the sample solution is scanned with the light detection region, and when the light detection region encompasses a light-emitting particle, dispersed and moving at random in the sample solution, the light emitted from the light-emitting particle is detected, and thereby each of the light-emitting particles in the sample solution is detected individually so that it becomes possible to perform the counting of light-emitting particles and the acquisition of the information about the concentration or number density of the light-emitting particle in the sample solution.
- light detection region the detection region of light
- a sample amount necessary for measurement may be small (for example, about several 10 ⁇ L) and the measuring time is short similarly to optical analysis techniques, such as FCS and FIDA, but also, it becomes possible to detect the presence of a light-emitting particle and to quantitatively detect its characteristic, such as a concentration, a number density, etc., at a lower concentration or number density, as compared with the case of optical analysis techniques, such as FCS and FIDA.
- the scanning molecule counting method in detecting a light-emitting particle in a sample solution individually and determining its concentration or other characteristics by the above-mentioned "scanning molecule counting method", it is preferable to detect the number of light-emitting particles which gives the accuracy required in the result. For instance, in determining a light-emitting particle concentration in a sample solution by the scanning molecule counting method, there are conducted processes of counting the number of individually detected light-emitting particles and dividing the counted number with the total volume of the passing region of a light detection region during a measuring time (the time of performing the light detection).
- the light-emitting particles are dispersed at random in the sample solution, and therefore, in order to determine its concentration at high accuracy, the count number of the light-emitting particles should have reached a number so sufficient that its scattering will be small.
- the count number of the light-emitting particles increases during much shorter time as the light-emitting particle concentration in the sample solution increases, and accordingly, the measuring time to achieve the detection of light-emitting particles of the number which gives the requested accuracy becomes shorter as the light-emitting particle concentration becomes high.
- the necessary measuring time differs depending on the light-emitting particle concentrations.
- the measuring time taken for the detection of light-emitting particles of the number which gives a requested accuracy, is unknown, and thus, the measuring time will be set so that the detection of light-emitting particles of the number which gives the requested accuracy will be achieved even at a low light-emitting particle concentration. In that case, for a sample solution with a high light-emitting particle concentration, the measuring time may become long more than needed.
- the scattering can become small in the result of a high light-emitting particle concentration while the scattering can become large in the result of a low light-emitting particle concentration.
- one object of the present invention is to provide a new method and device which can complete the detection of light-emitting particles of the number which achieves an accuracy required in a result in as short a time as possible in the above-mentioned "scanning molecule counting method.”
- Another object of the present invention is to provide a new method and device which can suppress the scattering in a result small, irrespective of concentrations of light-emitting particles to be observation objects, in the above-mentioned "scanning molecule counting method.”
- the other object of the present invention is to provide a new method and device which can optimize the measuring time in the above-mentioned "scanning molecule counting method" in accordance with the concentration of a light-emitting particle to be an observation object.
- the above-mentioned object is achieved by a method of detecting and analyzing light from a light-emitting particle dispersed and moving at random in a sample solution using an optical system of a confocal microscope or a multiphoton microscope, characterized by comprising: a light detection region moving step of moving a position of a light detection region of the optical system of the microscope in the sample solution by changing an optical path of the optical system; a light detecting step of detecting light from the light detection region with moving the position of the light detection region in the sample solution; and a light-emitting particle detecting step of detecting a signal from each light-emitting particle individually from the detected light; wherein said three steps are repeated until the number of the signals from the light-emitting particles reaches a predetermined number and a concentration of the light-emitting particle in the sample solution is determined based on a time taken for the number of the signals from the light-emitting particles to reaches the predetermined number.
- a light-emitting particle "dispersed and moving at random in a sample solution” may be a particle, such as an atom, a molecule or an aggregate of these, which is dispersed or dissolved in a sample solution and emits light, and it may be an arbitrary particulate matter making the Brownian motion freely in a solution without being fixed on a substrate, etc.
- the light-emitting particle is typically a fluorescent particle, but may be a particle which emits light by phosphorescence, chemiluminescence, bioluminescence, light scattering, etc.
- the "light detection region” of the optical system of the confocal microscope or multiphoton microscope is the micro region where light is detected in those microscopes, which region corresponds to the region to which illumination light is condensed when the illumination light is given from an objective (Especially in a confocal microscope, this region is determined in accordance with the spatial relationship of an objective and a pinhole.
- a light-emitting particle which emits light without illumination light for example, a molecule which emits light according to chemiluminescence or bioluminescence, no illumination light is required in the microscope.
- a signal means "a signal expressing light from a light-emitting particle” unless noted otherwise.
- the light detection is sequentially performed while the position of a light detection region is moved in a sample solution, namely, while the inside of the sample solution is scanned with the light detection region. Then, when the moving light detection region encompasses a randomly moving light-emitting particle, the light from the light-emitting particle is detected by the light detecting portion, and thereby, it is expected that the existence of one particle will be detected.
- a signal indicating the light from a light-emitting particle is individually detected, and thereby, the individual existences of light-emitting particles are detected one by one, and accordingly, diverse information on the condition of the particle in the solution will be acquired.
- this series of steps i.e., the light detection region moving step, the light detecting step and the light-emitting particle detecting step are performed for a certain fixed measuring time irrespective of the light-emitting particle concentrations in a sample solution, as noted above, the scattering in the numbers of the detected light-emitting particles differs depending upon the light-emitting particle concentrations, and at a high light-emitting particle concentration, the measuring time may become long more than needed, while, at a low light-emitting particle concentration, the detection of the number of light-emitting particles which achieves the accuracy required in the measurement may not be achieved.
- the light detection region moving step, light detecting step and light-emitting particle detecting step are not performed for a certain fixed measuring time, but repeated until the number of the signals from the light-emitting particles reaches a predetermined number as noted above. Then, the time taken to detect the predetermined number of light-emitting particles is measured, and based on the time taken for this number of the signals from light-emitting particles to reach the predetermined number, a light-emitting particle concentration in a sample solution is determined.
- the number of detected light-emitting particles will reach a predetermined number for a shorter time as the light-emitting particle concentration becomes higher, and thus, the shortening of the measuring time for a high light-emitting particle concentration sample solution is expected, and also, the measurement for a low light-emitting particle concentration sample solution will be performed with a sufficient time. That is, according to the above-mentioned structure, the measuring time is optimized according to the light-emitting particle concentration.
- the predetermined number is set to the number which attains an accuracy required in a result, the scattering in the time taken for the detection of the predetermined number of light-emitting particles for a low light-emitting particle concentration sample solution or an arbitrary result derived therefrom will be suppressed small, so that it becomes possible to make the accuracy of the result sufficient.
- the concentration is determinable based upon the time taken for the number of the signals from the light-emitting particles to reach the predetermined number.
- a light-emitting particle concentration may be computed using an arbitrary function of a time taken for the number of signals from light-emitting particles to reach a predetermined number.
- a detection rate of light-emitting particles (detected number per unit time), determined based on the number of detected light-emitting particles (namely, the predetermined number) and a time taken for the number of the signals from the light-emitting particles to reach the predetermined number, is proportional to a light-emitting particle concentration, it may be used advantageously.
- the detection of light-emitting particles is performed until the number of the signals from the light-emitting particles reaches a predetermined number, it is required to detect a signal from a light-emitting particle during the light detection region moving step and light detecting step.
- the light detection region moving step, light detecting step and light-emitting particle detecting step may be repeated every predetermined interval in a period until the number of the signals from the light-emitting particles reaches the predetermined number.
- This predetermined interval may be fixed or may be modified based on the number of the light-emitting particles detected so far during the period until the number of the signals from the light-emitting particles reaches the predetermined number.
- a step of estimating the time taken for the number of the signals from the light-emitting particles to reach the predetermined number based on the number of the light-emitting particles detected so far in the period until the number of the signals from the light-emitting particles reaches the predetermined number.
- a detection rate of light-emitting particles is determined based on the elapsed time after starting the detection and the number of the light-emitting particles detected so far, and from this light-emitting particle detection rate, it becomes possible to estimate the time taken for the number of the signals from the light-emitting particles to reach the predetermined number.
- this structure when the measuring time is completed will become predictable, which is information convenient for an experimenter.
- the moving speed of the position of the light detection region in a sample solution may be appropriately changed based on the characteristic of a light-emitting particle or its concentration in the sample solution. Especially when the moving speed of the light detection region becomes high, the light amount obtained from one light-emitting particle will be reduced, and therefore, it is preferable to appropriately change the moving speed of the light detection region in order to measure the light from one light-emitting particle precisely or sensitively.
- the moving speed of the position of the light detection region in the sample solution is preferably set to be higher than the diffusional moving velocity of a light-emitting particle (the average moving speed of a particle owing to the Brownian motion).
- the light-emitting particle will be detected individually by detecting the light emitted from a light-emitting particle encompassed in the light detection region.
- the moving speed of the light detection region is set higher than the diffusional moving velocity of the light-emitting particle, and thereby it becomes possible to make one light-emitting particle correspond to one signal.
- the diffusional moving velocity differs depending upon light-emitting particles, it is preferable that the moving speed of the light detection region can be changed appropriately according to the characteristics of the light-emitting particle as described above.
- the changing of the optical path of the optical system for moving the position of the light detection region may be done in an arbitrary way.
- the position of the light detection region may be changed by changing the optical path using a galvanomirror employed in the laser scan type optical microscope.
- the movement route of the position of the light detection region may be set arbitrarily, for example, which is selectable from circular, elliptical, rectangular, straight and curvilinear ones.
- the position of the light detection region is moved by changing the optical path of an optical system, the movement of the light detection region is quick without substantial generation of mechanical vibration and hydrodynamic effect in the sample solution, and therefore, the measurement of light can be performed under a stable condition without dynamic action affecting the light-emitting particle in the sample solution (without artifact)
- the measurement and analysis can be conducted with a small amount of the sample solution (at the level of one to several tens of ⁇ L) similarly to FCS, etc.
- the above-mentioned inventive method is realized with a new optical analysis device which can detect the light of each light-emitting particle with moving the position of a light detection region in a sample solution.
- an optical analysis device which detects light from a light-emitting particle dispersed and moving at random in a sample solution using an optical system of a confocal microscope or a multiphoton microscope, characterized by comprising a light detection region moving portion which moves a position of a light detection region of an optical system of the microscope in the sample solution by changing an optical path of the optical system; a light detecting portion which detects light from the light detection region; and a signal processing portion which detects individually a signal from each light-emitting particle detected in the light detecting portion with moving the position of the light detection region in the sample solution, wherein the device repeats the moving of the position of the light detection region of the optical system with the light detection region moving portion, the detecting of
- the light-emitting particle concentration may be determined based on a detection rate of the light-emitting particles determined based on the time taken for the number of the signals from the light-emitting particles to reach the predetermined number.
- the above-mentioned inventive device may be designed to repeat the moving of the position of the light detection region of the optical system with the light detection region moving portion, the detecting of the light from the light detection region with the light detecting portion and the detecting of the signals from the light-emitting particles with the signal processing portion every predetermined interval in a period until the number of the signals from the light-emitting particles reaches the predetermined number.
- the predetermined interval may be an arbitrarily fixed interval, or there may be provided a means for modifying the predetermined interval based on the number of the light-emitting particles detected so far in the period until the number of the signals from the light-emitting particles reaches the predetermined number, so that the optimization of the predetermined interval and the measuring time may be improved.
- a measurement end time display portion which indicates the time until the number of the signals from the light-emitting particles reaches the predetermined number, the time being estimated based on the number of the signals from the light-emitting particles detected with the signal processing portion after starting the detection of the signals from the light-emitting particles, and/or a light-emitting particle detected number display portion which indicates the number of the signals from the light-emitting particles detected with the signal processing portion after starting the detection of the signals from the light-emitting particles, and thus, according to this structure, the experimenter can advantageously expect the end time of the detection of the light-emitting particles.
- the moving of the position of the light detection region with the light detection region moving portion may be performed at a predetermined velocity or at a velocity quicker than the diffusion moving velocity of the light-emitting particle, and the moving speed of the position of the light detection region may be set arbitrarily.
- the optical analysis technique of the present invention is used, typically, for an analysis of a condition in a solution of a biological particulate object, such as a biological molecule, e.g. a protein, a peptide, a nucleic acid, a lipid, a sugar chain, an amino acid or these aggregate, a virus and a cell, etc., but it may be used for an analysis of a condition in a solution of a non-biological particle (for example, an atom, a molecule, a micelle, a metallic colloid, etc.), and it should be understood that such a case belongs to the scope of the present invention also.
- a biological particulate object such as a biological molecule, e.g. a protein, a peptide, a nucleic acid, a lipid, a sugar chain, an amino acid or these aggregate, a virus and a cell, etc.
- a non-biological particle for example, an atom, a molecule, a micelle,
- the scanning molecule counting method which detects an existence of a light-emitting particle individually by scanning the inside of a sample solution with a light detection region in a confocal microscope or a multiphoton microscope
- the optimization of the measuring time becomes possible depending upon a light-emitting particle concentration in the sample solution.
- the predetermined number to be reached by the number of the signals from the light-emitting particles to a number which attains an accuracy requested in a result of an arbitrary experiment or measurement, it is expected that an accurate detected result will be obtained irrespective of light-emitting particle concentrations even when an actual concentration is unknown.
- a light-emitting particle is detected individually and its concentration is determined, and therefore, even a light-emitting particle, whose concentration is relatively low in a sample solution so that light will be buried in the light from other light-emitting particles in a conventional method, becomes detectable and its existence becomes observable.
- This feature is expected to be used for applications to detection of products of reactions with a comparatively low reaction ratio or intermediate products of a relatively small number.
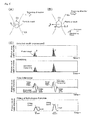
- the optical analysis technique according to the present invention can be realized with an optical analysis device constructed by associating the optical system of a confocal microscope and a photodetector, enabling FCS, FIDA, etc., as schematically illustrated in Fig. 1 (A) .
- the optical analysis device 1 consists of an optical system 2-17 and a computer 18 for acquiring and analyzing data together with controlling the operation of each part in the optical system.
- the optical system of the optical analysis device 1 may be the same as the optical system of a usual confocal microscope, where laser light, emitted from a light source 2 and transmitted through the inside of a single mode fiber 3 (Ex), forms light diverging to be radiated at the angle decided by an inherent NA at the emitting end of the fiber; and after forming a parallel beam with a collimator 4, the light is reflected on a dichroic mirror 5 and reflective mirrors 6 and 7, entering into an objective 8.
- the objective 8 typically, there is placed a sample container or a micro plate 9 having wells 10 arranged thereon, to which one to several tens of ⁇ L of a sample solution is dispensed, and the laser light emitted from the objective 8 is focused in the sample solution in the sample container or well 10, forming a region having strong light intensity (excitation region).
- light-emitting particles to be observed objects which are typically molecules to which a light emitting label such as a fluorescent dye is attached, are dispersed or dissolved, and when a light-emitting particle enters into the excitation region, the light-emitting particle is excited and emits light during dwelling in the excitation region.
- the pinhole 13 is located at a conjugate position of the focal position of the objective 8, and thereby only the light emitted from the focal region of the laser light, i.e., the excitation region, as schematically shown in Fig. 1 (B) , passes through the pinhole 13 while the light from regions other than the focal plane is blocked.
- confocal volume is a light detection region, whose effective volume is usually about 1-10 fL in this optical analysis device, which is called as "confocal volume".
- the light intensity is spread in accordance with a Gaussian type or Lorentz type distribution having the peak at the center of the region, and the effective volume is a volume of an approximate ellipsoid bordering a surface where the light intensity is reduced to 1/e 2 of the peak intensity.
- the light having passed through the pinhole 13 passes the dichroic mirror 14a and transmits through the corresponding barrier filter 14 (where a light component only in a specific wavelength band is selected); and is introduced into a multimode fiber 15, reaching to the corresponding photodetector 16, and after the conversion into time series electric signals, the signals are inputted into the computer 18, where the processes for optical analyses are executed in manners explained later.
- the photodetector 16 preferably, a super high sensitive photodetector, usable for the photon counting, is used, so that the light from one light-emitting particle, for example, the faint light from one or several fluorescent dye molecule(s), can be detected.
- a mechanism for changing the optical path of the optical system to scan the inside of the sample solution with the light detection region namely to move the position of the focal region i.e., the light detection region, within the sample solution.
- a mirror deflector 17 which changes the direction of the reflective mirror 7, as schematically illustrated in Fig. 1 (C) .
- This mirror deflector 17 may be the same as that of a galvanomirror device equipped on a usual laser scan type microscope.
- the mirror deflector 17 is driven in harmony with the light detection of the photodetector 16 under the control of the computer 18.
- the movement track of the position of the light detection region may be arbitrarily selected from circular, elliptical, rectangular, straight and curvilinear ones, or a combination of these (The program in the computer 18 may be designed so that various moving patterns can be selected.).
- the position of the light detection region may be moved in the vertical direction by moving the objective 8 up and down.
- stage position changing apparatus 17a for moving the horizontal position of the micro plate 9, in order to change the well 10 to be observed.
- the operation of the stage position changing apparatus 17a may be controlled by the computer 18.
- the above-mentioned optical system is used as a multiphoton microscope. In that case, since the light is emitted only from the focal region of the excitation light (light detection region), the pinhole 13 may be removed.
- the above-mentioned optical system of the confocal microscope is used as it is. Further, in the case that a light-emitting particle emits light owing to a chemiluminescence or bioluminescence phenomenon without excitation light, the optical system 2-5 for generating excitation light may be omitted.
- two or more excitation light sources 2 may be provided so that the wavelength of the excitation light can be appropriately selected in accordance with the wavelength of the light for exciting a light-emitting particle.
- two or more photodetectors 16 may also be provided so as to detect the lights from light-emitting particles of two or more kinds having different light-emitting wavelengths, if contained in a sample, separately depending upon the wavelengths.
- the inventive method is designed to repeat the moving of a light detection region, the detecting of light and the detecting of a light-emitting particle until the number of the signals from the light-emitting particles reaches a predetermined number, and determine a light-emitting particle concentration in a sample solution based on the time taken for the number of the signals from the light-emitting particles to reach the predetermined number.
- the principles of the scanning molecule counting method and the determination of a light-emitting particle concentration in the present invention are explained.
- Spectral analysis techniques such as FCS, FIDA, etc.
- FCS fluorescence intensity fluctuation
- concentration or number density of the light-emitting particle in a sample solution should be at a level where about one light-emitting particle always exists in a light detection region CV during the fluorescence intensity measurement as schematically drawn in Fig.
- the concentration of the light-emitting particle is significantly lower than the level where about one light-emitting particle always exists in the inside of the light detection region during the measurement, the calculation of light intensity fluctuation would become subject to the influence of the background, and the measuring time should be made long in order to obtain the significant quantity of the light intensity data (photon count) sufficient for the calculation.
- the light detection namely, measurement of light intensity
- moving the position of the light detection region CV in a sample solution namely, scanning the inside of the sample solution with the light detection region CV by driving the mechanism (mirror deflector 17) for moving the position of the light detection region to change the optical path as schematically drawn in Fig. 2 .
- the mechanism mirror deflector 17
- the light-emitting particles are detected individually, and by counting the number thereof, the information about the number, concentration or number density of the light-emitting particles existing in the measured region can be acquired.
- the scanning molecule counting method no statistical calculation processes, such as the calculation of the fluorescence intensity fluctuation, are conducted and the light-emitting particles are one by one detected, and therefore, the information about the concentration or number density of the particle is acquirable even in a sample solution with a low particle concentration at the level where no sufficiently accurate analysis is available in FCS, FIDA, etc.
- the scanning molecule counting method since light-emitting particles to be observation objects are dispersed at random in a sample solution, there is scattering in the number of detected light-emitting particles obtained in the light detection for a certain measuring time (the detected numbers differ in performed measurements). Accordingly, for determining, at an allowable or satisfiable accuracy, arbitrary characteristics derived with the number of detected light-emitting particles, such as a light-emitting particle concentration, etc. obtained by dividing the number of detected light-emitting particles by the volume of the passing region of the light detection region in a measuring time, the light intensity measurement should be performed for a time required to detect the number of light-emitting particles necessary for achieving the allowable or satisfiable accuracy.
- the number of detected light-emitting particles obtained in a certain measuring time is to decrease as the light-emitting particle concentration becomes lower, and its scattering is to increase, and thus, in order to attain an allowable or satisfiable accuracy, a longer measuring time will be needed.
- a longer measuring time will be needed.
- the measuring time will be set long enough for the case of a low light-emitting particle concentration.
- the light intensity measurement will be continued more than the time necessary to determine at allowable or satifiable accuracy a characteristic, such as concentration, in a case of a high light-emitting particle concentration in a sample solution.
- a characteristic such as concentration
- the light intensity measurement with moving a light detection region and the detection of the signals of light-emitting particles are repeated until the number of the signals from the light-emitting particles reaches a predetermined number; the time taken for the number of the signals from the light-emitting particles to reach the predetermined number is measured; and based on this time taken for the number of the signals from the light-emitting particles to reach the predetermined number, the light-emitting particle concentration is determined.
- the time taken for the light intensity measurement is shortened for a high light-emitting particle concentration in a sample solution, and it becomes possible to continue the light intensity measurement until the number of light-emitting particles, achieving an accuracy requested for a result (namely, the light-emitting particle concentration), is obtained for a low light-emitting particle concentration in a sample solution.
- the number of the light-emitting particles which achieves the accuracy requested in the result will be reflected in the time taken for the number of the signals from the light-emitting particles to reach the predetermined number, and therefore, it is expected that the light-emitting particle concentration value determined based on the time has the allowable or satisfiable accuracy.
- the light-emitting particle concentration C is proportional to the detection rate V in first-order so that the correspondence relation between the light-emitting particle concentration C and the detection rate V is intelligible, and therefore, in an actual experiment, the light-emitting particle concentration C may be determined using the detection rate V (see the following embodiment
- the particle to be observed in the inventive optical analysis technique may be an arbitrary particle as long as it is dispersed in a sample solution and moving at random in the solution, such as a dissolved molecule, and the particle may be, for instance, a biological molecule, i.e. a protein, a peptide, a nucleic acid, a lipid, a sugar chain, an amino acid, etc. or an aggregate thereof, a virus, a cell, a metallic colloid or other non-biological particle (Typically, the sample solution is an aqueous solution, but not limited to this, and it may be an organic solvent or other arbitrary liquids.).
- a biological molecule i.e. a protein, a peptide, a nucleic acid, a lipid, a sugar chain, an amino acid, etc. or an aggregate thereof, a virus, a cell, a metallic colloid or other non-biological particle
- the sample solution is an aqueous solution, but not limited to this, and it may be an
- the particle to be observed may be a particle which emits light by itself, or may be a particle to which a light emitting label (a fluorescence molecule, a phosphorescence molecule, and a chemiluminescent or bioluminescent molecule) is attached in an arbitrary manner.
- a light emitting label a fluorescence molecule, a phosphorescence molecule, and a chemiluminescent or bioluminescent molecule
- a light-emitting particle concentration in a sample solution can be determined in this embodiment, for example, a solution containing a component of a unknown concentration, a solution whose light-emitting particle concentration varies before and after a binding and dissociation reaction or an intermolecular interaction, etc. may be used as a sample solution, and the determination of a concentration of a component in a solution or the detection of the presence or absence or the degree of the progress of a reaction or an interaction may be done.
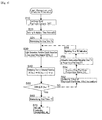
- Fig. 4 shows in the form of a flow chart one example of processes of light intensity measurement of a sample solution and detecting and counting light-emitting particles in the present embodiment performed with the optical analysis device 1 illustrated in Fig. 1 (A) .
- a series of processes of the moving of the position of a light detection region, the detecting of light from the light detection region, the detecting of signals from light-emitting particles and the counting of the signals of the detected light-emitting particles is repetitively performed every analytical time interval t (predetermined interval) until the number of the detected light-emitting particles X reaches the end particle count XE (the predetermined number that the number of light-emitting particles is to reach).
- the computer 18 performs, as the initial setting, the setting of the end particle count XE(step 10) and the setting of the analytical time interval t (step 20).
- the end particle count XE and the analytical time interval t may be arbitrarily set by the user.
- the end particle count XE can be appropriately determined with reference to a result of a preliminary experiment using a solution having a known light-emitting particle concentration (see Embodiment described later).
- an arbitrary time interval enough shorter than the period until the number of light-emitting particles (X) reaches the end particle count (XE) after starting the process may be appropriately set, considering the processing speed, etc. of Fig. 5 as described later in the device 1.
- a value, determined beforehand with reference to a result of a preliminary experiment using a solution having a known light-emitting particle concentration, may be memorized in the device 1 so that the memorized value can be used automatically or by a user's choice.
- the light intensity measuring process, the detection of signals of light-emitting particles from measured light intensity data and detection of the number of light-emitting particles x (step 30) in the analytical time interval t according to the scanning molecule counting method; and a process of accumulating the number of the light-emitting particles x detected in step 30 and computing the total number X(tn) of the light-emitting particles (step 40) are repetitively performed every analytical time interval t until the total number X(tn) of the light-emitting particles reaches the end particle count XE (step 50) as described below.
- the starting time Ts of a series of processes may be memorized (step 25). In the following, the processes of steps 30-50 will be explained in detail.
- Fig. 5 shows an example of the process of step 30 in the form of a flow chart.
- step 30 first, with driving the mirror deflector 17 to move the position of the light detection region within the sample solution (scan in the sample solution), a light intensity measurement is conducted for the analytical time interval t ( Fig. 5 -step 100).
- the photodetector 16 sequentially converts the received light into an electric signal and transmits it to the computer 18, which generates the time series light intensity data from the transmitted signals and store it in an arbitrary manner.
- the photodetector 16 is typically a super high sensitive photodetector which can detect an arrival of a single photon, and thus the detection of light may be the photon counting performed in the manner of measuring sequentially the number of photons which arrive at the photodetector for every predetermined unit time (BIN TIME), for example, every 10 ⁇ s, and accordingly the time series light intensity data will be a time series photon count data.
- BIN TIME predetermined unit time
- the moving speed of the position of the light detection region in order to perform quantitatively precisely individual detection of a light-emitting particle from the measured time series light intensity data in the scanning molecule counting method, preferably, the moving speed of the position of the light detection region during the light intensity measurement is set to a value quicker than the moving speed in the random motion, i.e., the Brownian motion of a light-emitting particle.
- the moving speed of the position of the light detection region is slower than the movement of a particle owing to the Brownian motion, the particle moves at random in the region as schematically drawn in Fig.
- the moving speed of the position of the light detection region is set to be quicker than the average moving speed of a particle by the Brownian motion (diffusional moving velocity) so that the particle will cross the light detection region CV in an approximately straight line and thereby the profile of the change of the light intensity corresponding to each particle in the time series light intensity data becomes almost bell-shaped similarly to the excitation light intensity distribution as illustrated in the most upper row of Fig. 6 (C) and the correspondence between each light-emitting particle and light intensity can be easily determined.
- the moving speed of the position of the light detection region may be set to its 10 times or more, e.g., 15 mm/s.
- an appropriate moving speed of the position of the light detection region may be determined by repeating the executions of a preliminary experiment with setting various moving speeds of the position of the light detection region in order to find the condition that the profile of a light intensity variation becomes an expected profile (typically, similar to the excitation light intensity distribution).
- the light intensity variation in the signal corresponding to the particle in the time series light intensity data has a bell shaped profile reflecting the light intensity distribution in the light detection region (determined by the optical system) (see the most upper row of Fig. 6(C) ).
- the signal having the profile of the light intensity may be judged to correspond to one particle having passed through the light detection region, and thereby one light-emitting particle is detected.
- a signal whose time width for which the light intensity exceeding the threshold value continues is not in a predetermined range is judged as noise or a signal of a contaminant.
- a smoothing treatment is performed to the time series light signal data ( Fig. 6(C) , the most upper row "detected result (unprocessed)") ( Fig. 5 - step 110, Fig. 6 (C) mid-upper row "smoothing").
- the smoothing treatment may be done, for example, by the moving average method, etc.
- parameters in performing the smoothing treatment e.g., the number of datum points in one time of the averaging, the number of times of a moving average, etc. in the moving averages method, may be appropriately set in accordance with the moving speed (scanning speed) of the position of the light detection region and/or BIN TIME in the light intensity data acquisition.
- the first differentiation value with time of the time series light intensity data after the smoothing treatment is computed (step 120).
- the mid-low row "time differential" in the time differential value of time series light signal data the variation of the value increases at the time of the signal value change, and thereby, the start point and the end point of a significant signal can be determined advantageously by referring to the time differential value.
- a significant pulse signal is detected sequentially on the time series light intensity data, and it is judged whether or not the detected pulse signal is a signal corresponding to a light-emitting particle.
- the start point and the end point of one pulse signal are searched and determined by referring to the time differential value sequentially, so that a pulse existing region will be specified (step 130).
- the fitting of a bell-shaped function is applied to the smoothed time series light intensity data in the pulse existing region ( Fig.
- the bell-shaped function to be used in the fitting is typically Gauss function as in Expression (8), it may be Lorentz type function.
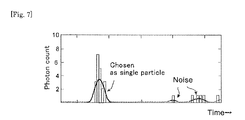
- step 150 it is judged whether or not the computed parameters of the bell-shaped function are within the respective ranges assumed for the parameters of the bell-shaped profile drawn by a pulse signal detected when one light-emitting particle passes a light detection region, i.e., whether or not each of the peak intensity, the pulse width and the correlation coefficient of the pulse is within the corresponding predetermined range. Then, the signal, whose computed parameters of the bell-shaped function are judged to be within the ranges assumed in a light signal corresponding to one light-emitting particle, as shown in Fig.
- Step 160 a pulse signal, whose computed parameters of the bell-shaped function are not within the assumed ranges, as shown in Fig. 7 right, is disregarded as noise.
- Step 170 The search, judgment and counting of (a) pulse signal(s) in the processes of the above-mentioned steps 130-160 are repetitively carried out in the whole region of the time series light signal data in the analytical time interval t.
- Step 170 the process of detecting individually signals of light-emitting particles from time series light intensity data may be conducted by an arbitrary way other than the above-mentioned way.
- X (t n-1 ) is the total number of the particles detected till the last analytical time interval t, and its initial value is 0.
- steps 30-40 are repeated every analytical time interval t until the total number of the detected light-emitting particles X(tn) reaches the end particle count XE, namely, X t n ⁇ XE is established (step 50).
- the total number of the detected light-emitting particles X(t n ) and/or the measurement end time TE or the measurement remaining time Tr may be indicated on a display, such as a monitor, etc. of the computer 18. According to this structure, it is advantageous in that a user can predict when an executed measurement is ended by seeing those indications.
- Tp is the present time.
- the measurement remaining time Tr time to the end of the processes of steps 30-50
- Tr XE - X t n / v
- the measurement end time TE time of the end of the processes of steps 30-50
- TE Tp + Tr (Step 56).
- the estimated measurement end time TE or the measurement remaining time Tr is indicated on the display (step 58).
- the repetitive executions of steps 30-50 have been already executed, the already indicated values are updated.
- the above-mentioned processes of steps 30-50 in Fig. 4 and steps 100-170 in Fig. 5 are repeated every analytical time interval t.
- the light intensity measurement of step 100 of Fig. 5 may be continuously performed from the start of measurement to its end even during the execution of the signal processing steps other than step 100.
- the light intensity measurement of step 100 in the analytical time interval t of the following cycle is performed continuously, and simultaneously, the processes of the detecting and counting of signals of light-emitting particles from the light intensity data acquired in the analytical time interval t of the completed cycle are performed in the computer 18. Thereby, the detecting and counting of light-emitting particles will be achieved in real time.
- a particle detection rate V is computed with Expression (3) from the time T to reach the end particle count and the end particle count XE, and the light-emitting particle concentration is determined from the particle detection rate V, using the relation of Expression (4).
- the cross sectional area S of the passing region of the light detection region in Expression (1) - (4) may be computed theoretically based on the wavelength of excitation light or detected light, the numerical aperture of a lens and the adjustment condition of the optical system
- the cross sectional area S may be determined experimentally, for example, from the number of light-emitting particles, detected by performing the light intensity measurement, the detecting and counting of light-emitting particles as explained above for a solution having a known light-emitting particle concentration (a control solution) under the same conditions as the measurement of a sample solution to be tested, and the light-emitting particle concentration of the control solution.
- the average of computed Ss may be employed as the cross sectional area S of the light detection region.
- the cross sectional area S of the light detection region may be given by an arbitrary method, for instance, using FCS and FIDA, instead of the above-mentioned method.
- the optical analysis device of this embodiment there may be previously memorized in a storage apparatus of the computer 18 the information on the relations (Expression (14)) between concentrations C and light-emitting particle numbers N of various standard light-emitting particles for assumed moving patterns of the light detection region, so that a user of the device can appropriately use the memorized information on the relation in conducting an optical analysis.
- the analytical time interval t may not be a fixed value but may be modified according to the detecting condition of the light-emitting particles.
- Fig. 8 (A) shows in the form of a flow chart the processes of the light intensity measurement of a sample solution and the detecting and counting of light-emitting particles, designed so as to include a process (step 20') of modifying the analytical time interval t according to the condition of detecting light-emitting particles, and Fig. 8 (B) shows the process of calculating the analytical time interval t in step 20' in the form of a flow chart.
- the same processes as in Fig. 4 are provided with the same step numbers.
- the processes in the illustrated example are designed to execute the processing cycles of the light intensity measurement and the detecting and counting of light-emitting particles only a predetermined number of times N (referred to as "number of times of scheduled updating" in the following.) in one measurement from its start until the number of light-emitting particles reaches the end particle count XE.
- the detecting and counting of light-emitting particles are performed in the beginning after the setting of the end particle count XE (step 10) and the memorizing of the start time Ts (step 25) for the initial setting, namely, when the execution times k of the processing cycle of the light intensity measurement and the detecting and counting of light-emitting particles is 0, the initial value to, arbitrarily settable, is given as the analytical time interval t (see Fig. 8 (B) steps 200, 210).
- the execution times k of the processing cycle increases by one (step 270), and the processes of the light intensity measurement and the detecting and counting of light-emitting particles for the analytical time interval t are performed (steps 30-50) similarly to the processes described in Fig. 4 .
- the particle detection rate v (step 54) and the measurement remaining time Tr (step 56) are computed sequentially.
- the total number of the detected light-emitting particles X (t n ) and/or the measurement end time TE or the measurement remaining time Tr are indicated on a display, such as a monitor, etc.
- step 50 the processes of the light intensity measurement and the detecting and counting of light-emitting particles are ended (step 50).
- its lower limit may be set, when the analytical time interval t is less than the lower limit tmin, the analytical time interval t may be set as the lower limit tmin (steps 250, 260).
- the analytical time interval t As described above, according to the manner in which the analytical time interval t is modified, the condition of detecting the light-emitting particles to be observation objects in the sample solution is reflected in the measurement remaining time Tr, and therefore, the analytical time interval t will be optimized according to the condition of detecting light-emitting particles.
- the scanning molecule counting method to scan the inside of a sample solution with a light detection region and detect light-emitting particles individually, by the manner of repeating the light intensity measurement and the detecting and counting of light-emitting particles until the number of signals from light-emitting particles reaches a predetermined number, the time taken for the light intensity measurement and the detecting and counting of light-emitting particles (the measuring time) will be increased or decreased in accordance with a light-emitting particle concentration in the sample solution. And by setting the predetermined number to be reached by the number of signals from light-emitting particles to the number which provides an accuracy requested in a result, it becomes possible to obtain an allowable or satisfiable result without taking the measuring time longer than needed.
- Detecting and counting of light-emitting particles were performed by the scanning molecule counting method with a solution in which fluorescent dye molecules were dissolved as a sample solution, and together with checking the feature of the scattering of the number of light-emitting particles, it was verified that, in accordance with the present invention, a light-emitting particle concentration was precisely detectable as short a time as possible with suppressing the scattering of the result irrespective of the light-emitting particle concentrations.
- sample solutions there were prepared solutions in which ATT0633 (sigma Aldrich (Sigma-Aldrich), Cat.No. 18620) was dissolved so as to be at a concentration of 100 ⁇ M, 10pM, 1pM and 100fM in a PBS buffer solution containing 0.05% Tween 20, respectively.
- ATT0633 Sigma Aldrich (Sigma-Aldrich), Cat.No. 18620
- a single molecule fluorescence measuring apparatus MF-20 (Olympus Corporation), equipped with the optical system of a confocal fluorescence microscope and a photon counting system, was used as the optical analysis device, and time series light intensity data (photon count data) were acquired for the above-mentioned respective sample solutions in accordance with the manner explained in the above-mentioned " (2) (ii)(a) Light Intensity Measurement of a Sample Solution”.
- a 633-nm laser light was used for excitation light, and, using a band pass filter, the light of the wavelength bands, 660 to 710 nm, was measured, and time series light intensity data was generated.
- the position of the light detection region in the sample solution was moved at the moving speed of 30 mm / second. Further, BIN TIME was set to 10 ⁇ seconds and measurements were performed 5 times for the respective solutions.
- the light intensity measurement was not performed every analytical time interval, but was performed for a sufficient time to be able to catch the feature of the scattering in the number of light-emitting particles (In actual, the measuring time was set to 2 seconds for the solutions of 100pM, 10pM and 1pM and to 20 seconds for the solution of 100fM.).
- the smoothing treatment was applied to the time series light intensity data acquired above and after determining the start points and the end points of pulse signals in the smoothed data, the fitting of a Gauss function to each pulse signal was carried out by the least square method, and a peak intensity, a pulse width (full width at half maximum) and a correlation coefficient (in the Gauss function) were determined. And, only the pulse signal satisfying the following conditions: 20 ⁇ sec . ⁇ pulse width ⁇ 400 ⁇ sec . Peak intensity > 1.0 pc / 10 ⁇ sec . Correlation coefficient >0.95 was judged as a signal corresponding to a light-emitting particle, while a pulse signal which did not satisfy the above-mentioned conditions was disregarded as noise.
- Fig. 9 (A) shows variations of the scatterings in the number of the detected light-emitting particles against the measuring time length in the scanning molecule counting method.
- the CV value was reduced as the measuring time became longer.
- the values of the three sample solutions it was confirmed that it took much time to make the CV value sufficiently smaller as the concentration became lower. Accordingly, it was shown that the measuring time taken for the scattering of the number of detected light-emitting particles to fall within an allowable range differs depending upon the light-emitting particle concentrations in sample solutions.
- Fig. 9 (B) shows variations of the scatterings of the measuring time (particle detection time) taken to acquire the respective numbers of detected light-emitting particles against the corresponding detected numbers.
- the light intensity measurement will be performed in the measuring time in accordance with a light-emitting particle concentration and it can be avoided to spend time for the measurement more than needed. It should be understood that, especially for a high light-emitting particle concentration, the measuring time can be shortened substantially.
- Fig. 10 shows a drawing in which the particle detecting rates, computed from the measuring time to 150 of the detected number in the above-mentioned respective sample solutions, are plotted against the corresponding concentrations.
- the particle detection rate is proportional to the dye concentration, suggesting that the relation of the above-mentioned Expression (4) is established.
- a light-emitting particle concentration in a sample solution can be determined based on the particle detecting rate or the measuring time taken to detect a predetermined number of light-emitting particles.
- the scanning molecule counting method by the manner of performing the light intensity measurement with moving a light detection region and the detection of a light-emitting particle, not for a certain fixed measuring time, but until the number of signals from light-emitting particles reaches a predetermined number, it becomes possible to optimize the measuring time with suppressing the scattering in a result small, and to complete the measurement for the detection of the number of light-emitting particles achieving an accuracy requested in a result as short a time as possible.
- the signal of a light-emitting particle is detected individually, the detection of a light-emitting particle is possible even when a light-emitting particle concentration in a sample solution is lower than the concentration range demanded by optical analysis techniques, such as FCS, and this feature is will be advantageous in conducting an analysis of a rare or expensive sample often used in the field of medical or biological research and development.
- the labor, time or expense in the trial and error for the measuring time can be reduced, and therefore, the expansion of the application area of the scanning molecule counting method is expected. For instance, it becomes unnecessary to set a long measuring time for a case of an extremely low light-emitting particle concentration because of the light-emitting particle concentration in a sample solution being unknown.
Landscapes
- Physics & Mathematics (AREA)
- General Physics & Mathematics (AREA)
- Analytical Chemistry (AREA)
- Health & Medical Sciences (AREA)
- Chemical & Material Sciences (AREA)
- Biochemistry (AREA)
- Life Sciences & Earth Sciences (AREA)
- General Health & Medical Sciences (AREA)
- Nuclear Medicine, Radiotherapy & Molecular Imaging (AREA)
- Immunology (AREA)
- Pathology (AREA)
- Optics & Photonics (AREA)
- Spectroscopy & Molecular Physics (AREA)
- Investigating, Analyzing Materials By Fluorescence Or Luminescence (AREA)
Applications Claiming Priority (2)
| Application Number | Priority Date | Filing Date | Title |
|---|---|---|---|
| JP2011009496 | 2011-01-20 | ||
| PCT/JP2012/051175 WO2012099234A1 (ja) | 2011-01-20 | 2012-01-20 | 単一発光粒子からの光の検出を用いた光分析方法及び光分析装置 |
Publications (2)
| Publication Number | Publication Date |
|---|---|
| EP2667183A1 true EP2667183A1 (de) | 2013-11-27 |
| EP2667183A4 EP2667183A4 (de) | 2017-05-10 |
Family
ID=46515851
Family Applications (1)
| Application Number | Title | Priority Date | Filing Date |
|---|---|---|---|
| EP12736506.2A Withdrawn EP2667183A4 (de) | 2011-01-20 | 2012-01-20 | Lichtanalyseverfahren und lichtanalysevorrichtung mit erkennung von licht aus einzelnen lichtemittierenden teilchen |
Country Status (5)
| Country | Link |
|---|---|
| US (1) | US9863806B2 (de) |
| EP (1) | EP2667183A4 (de) |
| JP (1) | JP5856983B2 (de) |
| CN (1) | CN103328955B (de) |
| WO (1) | WO2012099234A1 (de) |
Cited By (1)
| Publication number | Priority date | Publication date | Assignee | Title |
|---|---|---|---|---|
| EP3059577A4 (de) * | 2013-10-07 | 2017-05-31 | Olympus Corporation | Fotometrische analysevorrichtung mit erkennung einzelner lichtemittierender partikel, verfahren für fotometrische analyse und computerprogramm für fotometrische analyse |
Families Citing this family (10)
| Publication number | Priority date | Publication date | Assignee | Title |
|---|---|---|---|---|
| EP2749868B1 (de) | 2011-08-26 | 2019-02-27 | Olympus Corporation | Einzelpartikeldetektor mit optischer analyse, einzelpartikelnachweisverfahren damit und computerprogramm für einzelpartikelnachweis |
| EP2816344A4 (de) | 2012-02-17 | 2015-09-23 | Olympus Corp | Optische analysevorrichtung anhand eines einzelpartikeldetektionsverfahrens, optische analysemethode und computerprogramm zur optischen analyse |
| WO2013157283A1 (ja) * | 2012-04-18 | 2013-10-24 | オリンパス株式会社 | 標的粒子の検出方法 |
| KR102126032B1 (ko) * | 2013-07-31 | 2020-07-08 | 삼성전자주식회사 | 다채널 형광 검출 모듈 및 이를 포함하는 핵산 분석 시스템 |
| JP6157326B2 (ja) * | 2013-11-11 | 2017-07-05 | オリンパス株式会社 | 光検出を用いた単一発光粒子検出方法 |
| JP6228858B2 (ja) * | 2014-02-06 | 2017-11-08 | 日本電子株式会社 | 粒子解析装置、およびプログラム |
| JP7029903B2 (ja) * | 2017-08-09 | 2022-03-04 | シスメックス株式会社 | 試料処理装置、試料処理システム、および測定時間の算出方法 |
| LU100777B1 (de) * | 2018-04-23 | 2019-10-23 | Cytena Gmbh | Verfahren zum Untersuchen einer Flüssigkeit, die wenigstens eine Zelle und/oder wenigstens ein Partikel enthält |
| CN111157494A (zh) * | 2019-12-24 | 2020-05-15 | 新绎健康科技有限公司 | 一种用于对延迟发光进行控制和分析的方法及系统 |
| WO2025068668A1 (en) * | 2023-09-29 | 2025-04-03 | The University Of Sheffield | Single-molecule fluorescence detection system and method |
Family Cites Families (70)
| Publication number | Priority date | Publication date | Assignee | Title |
|---|---|---|---|---|
| US4251733A (en) | 1978-06-29 | 1981-02-17 | Hirleman Jr Edwin D | Technique for simultaneous particle size and velocity measurement |
| JPS63225145A (ja) | 1987-03-16 | 1988-09-20 | Sasakura Eng Co Ltd | 流体中の不純微粒子計測方法及び計測装置 |
| US4885473A (en) | 1988-04-29 | 1989-12-05 | Shofner Engineering Associates, Inc. | Method and apparatus for detecting particles in a fluid using a scanning beam |
| US4979824A (en) | 1989-05-26 | 1990-12-25 | Board Of Trustees Of The Leland Stanford Junior University | High sensitivity fluorescent single particle and single molecule detection apparatus and method |
| CA2035703A1 (en) * | 1991-01-22 | 1992-07-23 | Pedro Lilienfeld | System and method for determining and printing airborne particle concentration |
| JPH04337446A (ja) | 1991-05-15 | 1992-11-25 | Hitachi Ltd | 微粒子計測方法、定量方法および微粒子計測装置 |
| US5866336A (en) | 1996-07-16 | 1999-02-02 | Oncor, Inc. | Nucleic acid amplification oligonucleotides with molecular energy transfer labels and methods based thereon |
| EP0836090A1 (de) | 1996-10-12 | 1998-04-15 | Evotec BioSystems GmbH | Probenanalyseverfahren durch Bestimmung der spezifischen Helligkeitsverteilung von Teilchen |
| US6235471B1 (en) | 1997-04-04 | 2001-05-22 | Caliper Technologies Corp. | Closed-loop biochemical analyzers |
| DE19723999B4 (de) | 1997-06-06 | 2008-04-10 | Schwartz, Margit | Vorrichtung zur Messung von Partikelabmessungen in Fluiden |
| US6710871B1 (en) | 1997-06-09 | 2004-03-23 | Guava Technologies, Inc. | Method and apparatus for detecting microparticles in fluid samples |
| GB2326229A (en) | 1997-06-13 | 1998-12-16 | Robert Jeffrey Geddes Carr | Detecting and analysing submicron particles |
| SE9800360D0 (sv) | 1998-02-06 | 1998-02-06 | Goeteborg University Science I | Method, apparatus and flow cell for high sensitivity detection of fluorescent molecules |
| US20030036855A1 (en) | 1998-03-16 | 2003-02-20 | Praelux Incorporated, A Corporation Of New Jersey | Method and apparatus for screening chemical compounds |
| US6388788B1 (en) | 1998-03-16 | 2002-05-14 | Praelux, Inc. | Method and apparatus for screening chemical compounds |
| CA2324262C (en) | 1998-03-16 | 2010-05-25 | Praelux Incorporated | Confocal microscopy imaging system |
| DK1175602T3 (da) | 1999-04-29 | 2003-05-26 | Evotec Ag | Fremgangsmåde til karakterisering af fluorescente molekyler eller andre partikler, der anvender frembringerfunktioner |
| US6376843B1 (en) | 1999-06-23 | 2002-04-23 | Evotec Oai Ag | Method of characterizing fluorescent molecules or other particles using generating functions |
| AU780158B2 (en) | 1999-05-04 | 2005-03-03 | Mettler-Toledo Autochem, Inc. | Method and apparatus for particle assessment using multiple scanning beam reflectance |
| WO2000071991A1 (en) | 1999-05-25 | 2000-11-30 | Biometric Imaging, Inc. | Apparatus and method for optical detection in a limited depth of field |
| US8264680B2 (en) | 1999-05-28 | 2012-09-11 | Yokogawa Electric Corporation | Biochip reader and electrophoresis system |
| US6965113B2 (en) | 2000-02-10 | 2005-11-15 | Evotec Ag | Fluorescence intensity multiple distributions analysis: concurrent determination of diffusion times and molecular brightness |
| US20010035954A1 (en) | 2000-03-10 | 2001-11-01 | Rahn John Richard | Method and apparatus for measuring particle size distributions using light scattering |
| DE10035190C5 (de) | 2000-07-20 | 2009-07-16 | MAX-PLANCK-Gesellschaft zur Förderung der Wissenschaften e.V. | Verfahren und Vorrichtung zur Fluoreszenzmessung |
| DE10038528A1 (de) | 2000-08-08 | 2002-02-21 | Zeiss Carl Jena Gmbh | Verfahren und Anordnung zur Erhöhung der spektralen und räumlichen Detektorauflösung |
| US6947133B2 (en) | 2000-08-08 | 2005-09-20 | Carl Zeiss Jena Gmbh | Method for increasing the spectral and spatial resolution of detectors |
| AU2002211913A1 (en) | 2000-10-12 | 2002-04-22 | Amnis Corporation | Multipass cavity for illumination and excitation of moving objects |
| HU226937B1 (en) | 2000-11-17 | 2010-03-29 | Mta Szegedi Biolog Koezpont | Method and apparatus for determining polarization amount of material by a laser scanning microscope |
| EP1351048A4 (de) | 2000-12-14 | 2007-02-28 | Olympus Corp | Fluorometrisches analysegerät und fluorometrische analyse |
| US6782297B2 (en) * | 2001-05-24 | 2004-08-24 | Eric Paul Tabor | Methods and apparatus for data smoothing |
| US7668697B2 (en) | 2006-02-06 | 2010-02-23 | Andrei Volkov | Method for analyzing dynamic detectable events at the single molecule level |
| US6750963B2 (en) | 2002-05-21 | 2004-06-15 | Agilent Technologies, Inc. | Imaging systems for signals on a surface |
| WO2004042404A1 (en) | 2002-11-07 | 2004-05-21 | Erasmus Universiteit Rotterdam | Fret probes and methods for detecting interacting molecules |
| US7038848B2 (en) | 2002-12-27 | 2006-05-02 | Olympus Corporation | Confocal microscope |
| JP4315794B2 (ja) | 2002-12-27 | 2009-08-19 | オリンパス株式会社 | 共焦点顕微鏡 |
| JP2005098876A (ja) | 2003-09-25 | 2005-04-14 | Institute Of Physical & Chemical Research | 2成分相互作用分析方法 |
| AU2005290314A1 (en) | 2004-09-28 | 2006-04-06 | Singulex, Inc. | System and method for spectroscopic analysis of single particles |
| MX2007009124A (es) | 2005-01-31 | 2007-10-08 | Univ Illinois | Metodos y dispositivos para caracterizar particulas en medios transparentes y turbios. |
| JP4757103B2 (ja) | 2005-06-13 | 2011-08-24 | 学校法人関西文理総合学園 | 試料中のウイルスを検出する方法およびシステム |
| EP1906172A4 (de) | 2005-07-15 | 2014-01-08 | Olympus Corp | Lichtmessgerät |
| WO2007118209A2 (en) | 2006-04-07 | 2007-10-18 | Kim Laboratories | Apparatus and method for rapid detection of analytes |
| WO2007147159A2 (en) | 2006-06-16 | 2007-12-21 | Cornell Research Foundation, Inc. | Functional nucleic acid ligands to fluorescent proteins |
| WO2008007580A1 (fr) * | 2006-07-13 | 2008-01-17 | Olympus Corporation | Procédé d'analyse de particules fines |
| US20080052009A1 (en) | 2006-08-23 | 2008-02-28 | Washington, University Of | Method for deconvolving single-molecule intensity distributions for quantitative biological measurements |
| GB0618057D0 (en) | 2006-09-14 | 2006-10-25 | Perkinelmer Ltd | Improvements in and relating to scanning confocal microscopy |
| JP5473202B2 (ja) | 2006-10-13 | 2014-04-16 | 滋賀県 | 試料中の蛍光性物質を検出する方法およびシステム |
| JP4891057B2 (ja) | 2006-12-27 | 2012-03-07 | オリンパス株式会社 | 共焦点レーザー走査型顕微鏡 |
| WO2008080417A1 (en) | 2006-12-28 | 2008-07-10 | Flult Biosystems Gmbh | A method of determining characteristic properties of a sample containing particles |
| US7804594B2 (en) | 2006-12-29 | 2010-09-28 | Abbott Laboratories, Inc. | Method and apparatus for rapidly counting and identifying biological particles in a flow stream |
| WO2008099778A1 (ja) | 2007-02-14 | 2008-08-21 | Nikon Corporation | スリット走査共焦点顕微鏡 |
| JP2008292371A (ja) | 2007-05-25 | 2008-12-04 | Institute Of Physical & Chemical Research | 蛍光相関分光による複数成分相互作用の分析方法及び相互作用制御化合物のスクリーニング方法 |
| JP2009145242A (ja) | 2007-12-14 | 2009-07-02 | Olympus Corp | 光測定装置 |
| CA2709217C (en) * | 2007-12-19 | 2021-01-05 | Singulex, Inc. | Scanning analyzer for single molecule detection and methods of use |
| JP5139885B2 (ja) | 2008-05-21 | 2013-02-06 | 浜松ホトニクス株式会社 | 蛍光解析装置及び解析方法 |
| JP2009288161A (ja) | 2008-05-30 | 2009-12-10 | Olympus Corp | 光測定装置及び光測定方法 |
| EP2909604B1 (de) | 2008-10-23 | 2019-06-26 | M-I L.L.C. | Verfahren und vorrichtung zur messung der partikelgrössenverteilung in einer bohrflüssigkeit |
| US20100177190A1 (en) | 2008-12-16 | 2010-07-15 | Ann-Shyn Chiang | Microscopy system with revolvable stage |
| JP5265408B2 (ja) | 2009-02-18 | 2013-08-14 | オリンパス株式会社 | 相関分光分析方法及び相関分光分析装置 |
| JP2010276380A (ja) | 2009-05-26 | 2010-12-09 | Olympus Corp | 蛍光相関分光分析装置及び方法並びにそのためのコンピュータプログラム |
| JP2011002415A (ja) * | 2009-06-22 | 2011-01-06 | Olympus Corp | 蛍光相関分光装置 |
| JP5325679B2 (ja) | 2009-07-03 | 2013-10-23 | 富士フイルム株式会社 | 低コヒーレンス光源を用いた動的光散乱測定装置及び光散乱強度測定方法 |
| CN102869982B (zh) * | 2010-03-01 | 2014-04-30 | 奥林巴斯株式会社 | 光学分析装置、光学分析方法 |
| WO2012014778A1 (ja) | 2010-07-26 | 2012-02-02 | オリンパス株式会社 | 発光プローブを用いて溶液中の希薄粒子を検出する方法 |
| EP2615445B1 (de) | 2010-10-13 | 2014-05-21 | Olympus Corporation | Verfahren zum messen eines diffusionskennwerts eines teilchens |
| CN103477210B (zh) | 2011-04-13 | 2015-09-23 | 奥林巴斯株式会社 | 利用单个发光粒子检测的光分析装置、光分析方法以及光分析用计算机程序 |
| JP6013328B2 (ja) | 2011-04-18 | 2016-10-25 | オリンパス株式会社 | 標的粒子の定量方法 |
| CN103733049B (zh) | 2011-08-15 | 2016-01-20 | 奥林巴斯株式会社 | 利用单个发光粒子检测的光分析装置、光分析方法以及光分析用计算机程序 |
| EP2749868B1 (de) | 2011-08-26 | 2019-02-27 | Olympus Corporation | Einzelpartikeldetektor mit optischer analyse, einzelpartikelnachweisverfahren damit und computerprogramm für einzelpartikelnachweis |
| CN103765194B (zh) | 2011-08-30 | 2016-02-17 | 奥林巴斯株式会社 | 目标粒子的检测方法 |
| EP2840380A4 (de) | 2012-04-18 | 2015-11-25 | Olympus Corp | Einzelpartikeldetektor mit photoanalysis, einzelpartikelnachweisverfahren und computerprogramm für einzelpartikelnachweis |
-
2012
- 2012-01-20 EP EP12736506.2A patent/EP2667183A4/de not_active Withdrawn
- 2012-01-20 WO PCT/JP2012/051175 patent/WO2012099234A1/ja not_active Ceased
- 2012-01-20 CN CN201280005999.8A patent/CN103328955B/zh not_active Expired - Fee Related
- 2012-01-20 JP JP2012553778A patent/JP5856983B2/ja active Active
-
2013
- 2013-07-19 US US13/946,091 patent/US9863806B2/en active Active
Non-Patent Citations (2)
| Title |
|---|
| No further relevant documents disclosed * |
| See also references of WO2012099234A1 * |
Cited By (1)
| Publication number | Priority date | Publication date | Assignee | Title |
|---|---|---|---|---|
| EP3059577A4 (de) * | 2013-10-07 | 2017-05-31 | Olympus Corporation | Fotometrische analysevorrichtung mit erkennung einzelner lichtemittierender partikel, verfahren für fotometrische analyse und computerprogramm für fotometrische analyse |
Also Published As
| Publication number | Publication date |
|---|---|
| US9863806B2 (en) | 2018-01-09 |
| WO2012099234A1 (ja) | 2012-07-26 |
| CN103328955A (zh) | 2013-09-25 |
| US20130302906A1 (en) | 2013-11-14 |
| JPWO2012099234A1 (ja) | 2014-06-30 |
| JP5856983B2 (ja) | 2016-02-10 |
| CN103328955B (zh) | 2017-10-20 |
| EP2667183A4 (de) | 2017-05-10 |
Similar Documents
| Publication | Publication Date | Title |
|---|---|---|
| US9863806B2 (en) | Optical analysis method and optical analysis device using the detection of light from a single light-emitting particle | |
| EP2749868B1 (de) | Einzelpartikeldetektor mit optischer analyse, einzelpartikelnachweisverfahren damit und computerprogramm für einzelpartikelnachweis | |
| US9068944B2 (en) | Optical analysis device, optical analysis method and computer program for optical analysis using single light-emitting particle detection | |
| US9435727B2 (en) | Optical analysis device, optical analysis method and computer program for optical analysis using single light-emitting particle detection | |
| EP2522988B1 (de) | Vorrichtung für optische analyse, verfahren für optische analyse und computerprogramm für optische analyse | |
| EP2615445B1 (de) | Verfahren zum messen eines diffusionskennwerts eines teilchens | |
| US8680485B2 (en) | Optical analysis method using the detection of a single light-emitting particle | |
| US8958066B2 (en) | Optical analysis method using measurement of light of two or more wavelength bands | |
| EP2749867B1 (de) | Optisches analysegerät und verfahren mit einzelnachweis lichtemittierender teilchen | |
| US9188535B2 (en) | Single particle detection device, single particle detection method, and computer program for single particle detection, using optical analysis | |
| US9528923B2 (en) | Optical analysis device, optical analysis method and computer program for optical analysis using single light-emitting particle detection | |
| US9103718B2 (en) | Optical analysis device and optical analysis method using a wavelength characteristic of light of a single light-emitting particle |
Legal Events
| Date | Code | Title | Description |
|---|---|---|---|
| PUAI | Public reference made under article 153(3) epc to a published international application that has entered the european phase |
Free format text: ORIGINAL CODE: 0009012 |
|
| 17P | Request for examination filed |
Effective date: 20130711 |
|
| AK | Designated contracting states |
Kind code of ref document: A1 Designated state(s): AL AT BE BG CH CY CZ DE DK EE ES FI FR GB GR HR HU IE IS IT LI LT LU LV MC MK MT NL NO PL PT RO RS SE SI SK SM TR |
|
| DAX | Request for extension of the european patent (deleted) | ||
| RAP1 | Party data changed (applicant data changed or rights of an application transferred) |
Owner name: OLYMPUS CORPORATION |
|
| RIN1 | Information on inventor provided before grant (corrected) |
Inventor name: TANABE, TETSUYA |
|
| RA4 | Supplementary search report drawn up and despatched (corrected) |
Effective date: 20170406 |
|
| RIC1 | Information provided on ipc code assigned before grant |
Ipc: G02B 21/16 20060101ALI20170401BHEP Ipc: G01N 21/64 20060101AFI20170401BHEP Ipc: G02B 21/00 20060101ALI20170401BHEP |
|
| GRAP | Despatch of communication of intention to grant a patent |
Free format text: ORIGINAL CODE: EPIDOSNIGR1 |
|
| STAA | Information on the status of an ep patent application or granted ep patent |
Free format text: STATUS: GRANT OF PATENT IS INTENDED |
|
| INTG | Intention to grant announced |
Effective date: 20191009 |
|
| STAA | Information on the status of an ep patent application or granted ep patent |
Free format text: STATUS: THE APPLICATION IS DEEMED TO BE WITHDRAWN |
|
| 18D | Application deemed to be withdrawn |
Effective date: 20200220 |