US5455676A - Method of detecting a signal and modulation coefficient of a phase-modulated fiber-optic gyroscope based on a difference in the duration of multiple subwaves in a modulation period - Google Patents
Method of detecting a signal and modulation coefficient of a phase-modulated fiber-optic gyroscope based on a difference in the duration of multiple subwaves in a modulation period Download PDFInfo
- Publication number
- US5455676A US5455676A US08/201,459 US20145994A US5455676A US 5455676 A US5455676 A US 5455676A US 20145994 A US20145994 A US 20145994A US 5455676 A US5455676 A US 5455676A
- Authority
- US
- United States
- Prior art keywords
- increment
- sub
- phase
- modulation
- difference
- Prior art date
- Legal status (The legal status is an assumption and is not a legal conclusion. Google has not performed a legal analysis and makes no representation as to the accuracy of the status listed.)
- Expired - Fee Related
Links
- 238000000034 method Methods 0.000 title claims description 54
- 239000000835 fiber Substances 0.000 claims abstract description 74
- 238000005259 measurement Methods 0.000 claims abstract description 27
- 230000010354 integration Effects 0.000 claims description 21
- 230000018199 S phase Effects 0.000 claims description 20
- 230000002452 interceptive effect Effects 0.000 claims description 7
- 230000001902 propagating effect Effects 0.000 claims description 7
- YBJHBAHKTGYVGT-ZKWXMUAHSA-N (+)-Biotin Chemical compound N1C(=O)N[C@@H]2[C@H](CCCCC(=O)O)SC[C@@H]21 YBJHBAHKTGYVGT-ZKWXMUAHSA-N 0.000 claims description 4
- FEPMHVLSLDOMQC-UHFFFAOYSA-N virginiamycin-S1 Natural products CC1OC(=O)C(C=2C=CC=CC=2)NC(=O)C2CC(=O)CCN2C(=O)C(CC=2C=CC=CC=2)N(C)C(=O)C2CCCN2C(=O)C(CC)NC(=O)C1NC(=O)C1=NC=CC=C1O FEPMHVLSLDOMQC-UHFFFAOYSA-N 0.000 claims description 4
- 230000002463 transducing effect Effects 0.000 claims 2
- 238000001514 detection method Methods 0.000 abstract description 16
- 239000003990 capacitor Substances 0.000 description 22
- 230000035945 sensitivity Effects 0.000 description 16
- 230000008859 change Effects 0.000 description 13
- 230000001360 synchronised effect Effects 0.000 description 12
- 238000012544 monitoring process Methods 0.000 description 11
- 230000007423 decrease Effects 0.000 description 8
- 238000012545 processing Methods 0.000 description 8
- 230000000737 periodic effect Effects 0.000 description 7
- 238000012935 Averaging Methods 0.000 description 5
- 230000006872 improvement Effects 0.000 description 5
- 239000013307 optical fiber Substances 0.000 description 5
- 230000008901 benefit Effects 0.000 description 4
- 230000003287 optical effect Effects 0.000 description 4
- 238000004088 simulation Methods 0.000 description 4
- 238000006073 displacement reaction Methods 0.000 description 3
- 230000000630 rising effect Effects 0.000 description 3
- 230000007480 spreading Effects 0.000 description 3
- 238000006467 substitution reaction Methods 0.000 description 3
- 230000001052 transient effect Effects 0.000 description 3
- 230000003321 amplification Effects 0.000 description 2
- 230000008878 coupling Effects 0.000 description 2
- 238000010168 coupling process Methods 0.000 description 2
- 238000005859 coupling reaction Methods 0.000 description 2
- 230000000694 effects Effects 0.000 description 2
- 230000005684 electric field Effects 0.000 description 2
- 238000002474 experimental method Methods 0.000 description 2
- 238000010606 normalization Methods 0.000 description 2
- 238000003199 nucleic acid amplification method Methods 0.000 description 2
- 230000036961 partial effect Effects 0.000 description 2
- 230000010363 phase shift Effects 0.000 description 2
- 230000010287 polarization Effects 0.000 description 2
- 238000004804 winding Methods 0.000 description 2
- 206010035148 Plague Diseases 0.000 description 1
- 241000607479 Yersinia pestis Species 0.000 description 1
- 238000009825 accumulation Methods 0.000 description 1
- 230000009471 action Effects 0.000 description 1
- 238000004458 analytical method Methods 0.000 description 1
- 238000013459 approach Methods 0.000 description 1
- 238000004364 calculation method Methods 0.000 description 1
- 230000015556 catabolic process Effects 0.000 description 1
- 238000006243 chemical reaction Methods 0.000 description 1
- 230000000295 complement effect Effects 0.000 description 1
- 230000008602 contraction Effects 0.000 description 1
- 230000001276 controlling effect Effects 0.000 description 1
- 230000002596 correlated effect Effects 0.000 description 1
- 230000000875 corresponding effect Effects 0.000 description 1
- 230000003247 decreasing effect Effects 0.000 description 1
- 238000006731 degradation reaction Methods 0.000 description 1
- 230000001934 delay Effects 0.000 description 1
- 238000007599 discharging Methods 0.000 description 1
- 238000005516 engineering process Methods 0.000 description 1
- 230000002708 enhancing effect Effects 0.000 description 1
- 239000000284 extract Substances 0.000 description 1
- 230000036039 immunity Effects 0.000 description 1
- 230000001788 irregular Effects 0.000 description 1
- 238000004519 manufacturing process Methods 0.000 description 1
- 239000000463 material Substances 0.000 description 1
- 238000000691 measurement method Methods 0.000 description 1
- 230000002829 reductive effect Effects 0.000 description 1
- 230000002441 reversible effect Effects 0.000 description 1
- 238000005070 sampling Methods 0.000 description 1
- 230000000087 stabilizing effect Effects 0.000 description 1
- 230000036962 time dependent Effects 0.000 description 1
Images

Classifications
-
- G—PHYSICS
- G01—MEASURING; TESTING
- G01C—MEASURING DISTANCES, LEVELS OR BEARINGS; SURVEYING; NAVIGATION; GYROSCOPIC INSTRUMENTS; PHOTOGRAMMETRY OR VIDEOGRAMMETRY
- G01C19/00—Gyroscopes; Turn-sensitive devices using vibrating masses; Turn-sensitive devices without moving masses; Measuring angular rate using gyroscopic effects
- G01C19/58—Turn-sensitive devices without moving masses
- G01C19/64—Gyrometers using the Sagnac effect, i.e. rotation-induced shifts between counter-rotating electromagnetic beams
- G01C19/72—Gyrometers using the Sagnac effect, i.e. rotation-induced shifts between counter-rotating electromagnetic beams with counter-rotating light beams in a passive ring, e.g. fibre laser gyrometers
Definitions
- This invention relates to a new method of deducing an angular velocity signal of a phase-modulated fiber-optic gyroscope.
- a fiber-optic gyroscope obtains an angular velocity by dividing light beams emitted from a light source in halves, introducing the divided beams to both ends of a fiber coil, propagating the light beams clockwise and counterclockwise in the fiber coil, letting the clockwise beams and the counterclockwise beams interfere, measuring the intensity of the interfering beams by a photodiode and detecting a phase difference of the clockwise beams and counterclockwise beams.
- the angular velocity of the fiber coil is in proportion to the phase difference.
- the angular velocity is obtained from the phase difference .increment. ⁇ between the clockwise waves (CW) and the counterclockwise (CCW) waves.
- phase difference Without modulation, a small phase difference were not sensitively measured and the sign (positive or negative) of the phase difference could not be determined, because the phase difference was included in the form of cos .increment. ⁇ in the output signal of a photodetector.
- some form of modulation is applied to the light waves spreading in a fiber path. For example, phase-modulation, frequency modulation and phase shift modulation.
- a light source 111 emits light beams.
- the light beams ( waves ) enter an end of a single-mode fiber, pass through a first coupler and attain a polarizer P.
- the light waves are converted into linearly-polarized waves.
- the polarized waves are divided into halves by a second coupler.
- the divided waves are introduced to two ends of a fiber coil 112 of a single-mode fiber wound a plurality of turns around a bobbin.
- the divided, 5partial waves propagate clockwise and counterclockwise in the fiber coil. No phase difference occurs between the clockwise spreading waves and the counterclockwise spreading waves, when the fiber coil is at rest.
- the coupler combines the once divided clockwise and counterclockwise waves together.
- the combined waves pass reversely through the polarizer P and through the first coupler.
- the waves reach a photodetector 113 which converts the light power into an electric signal. Synchronous detection of the output of the photodetector originates a value which is proportional to the phase difference .increment. ⁇ .
- phase modulator 114 is constructed by winding a part of the fiber coil around a columnar or cylindrical vibrator having electrodes. Application of alternating voltage upon the electrodes induces vibrations of the piezoelectric column or cylinder. The fiber is subjected to a periodic expansion and shrink. The expansion and contraction of the fiber changes the phase of the light waves passing in the fiber due to the optoelastic effect.
- the phase modulator endows periodic changes of phase to the clockwise waves and the counterclockwise waves at different times.
- the phase changes given by the modulator to the CW waves and CCW waves do not cancel each other at the photodetector.
- the periodic phase changes survive the interference of the CW and CCW waves at the photodetector.
- the output of the photodetector includes a Fundamental component and all harmonies of the modulation frequency. Odd number harmonics contain the phase difference .increment. ⁇ in the form of sin .increment. ⁇ . Even number harmonies include the same phase difference .increment. ⁇ in the form of cos .increment. ⁇ .
- the coefficients of the n-th order harmonies are the n-th order Bessel function of ⁇ , i.e. the phase modulation depth.
- phase modulation method of a fiber-optic gyroscope gives the electric field E R (t) of the clockwise-propagation waves and E L (t) of the counterclockwise-propagation waves as follows;
- E R and E L are amplitudes of the clockwise light waves and the counterclockwise light waves
- ⁇ is the angular frequency of the phase modulation
- ⁇ is the angular frequency of the light
- .increment. ⁇ is Sagnac phase difference in proportion to the rotation of the fiber coil.
- “5426” is the phase difference induced from the time difference ⁇ of passing through the phase-modulator between the clockwise and counterclockwise waves.
- ⁇ is equal to the time for light to pass through the fiber coil.
- n is the refractive index of the core of the fiber
- L is the length of the optical fiber of the fiber coil.
- c is the velocity of light in vacuum.
- ⁇ c is the angular velocity of the fiber coil, i.e. the object of the measurement.
- the photodetector makes the CW waves and CCW waves interfere with each other and detects the intensity of the interfering Waves by converting the light power into an electric signal.
- the output of the photodetector is the square of the sum of the CW waves and CCW waves.
- the light frequency ⁇ is too high for the photodetector to detect it.
- the output of the photodetector gives a time average of the square of the sum regarding ⁇ .
- the output signal I(t) of the photodetector is given by the square of the sum of the electric fields of the CW and CCW waves.
- Bessel functions give a series of expansion of a cosine function and a sine function including variable t in the form of cosine or sine.
- Eq.(11) is a Bessel function representation of the output of the detector.
- the output contains a basic signal and all harmonies of the phase-modulation frequency ⁇ .
- the n-th order harmonies has the n-th order Bessel function J n ( ⁇ ) as the coefficient.
- ⁇ is a parameter of phase-modulation determined by the amplitude b of phase change and the phase delay o in the fiber coil.
- Eq.(11) teaches that all harmonies of the modulation frequency are included in the output of the photodetector as a series of Bessel function expansion.
- the basic (fundamental) component I( ⁇ ,t) with the frequency ⁇ is written as
- the basic component includes .increment. ⁇ in the form of sin .increment. ⁇ . Synchronous detection by cos( ⁇ t) results in a first order component.
- the angular velocity of the fiber coil is obtained from the basic component I( ⁇ ). This is an ordinary way for measuring the angular velocity by the phase-modulation method. Synchronous detection is the most popular technique for the phase-modulation method.
- the output of the synchronous detection (demodulation) fluctuates according to the variation of the gain of a signal processing circuit and the displacement of optics. Such factors change the basic component I( ⁇ ) even for the same .increment. ⁇ .
- the proportion constant between the basic component and the angular velocity is called a scale factor.
- the variation of output of the photodetector for the constant rotation is called a fluctuation of the scale factor. Since the scale factor is determined by various parameters, the scale factor fluctuates by many reasons. For example, the changes of gains of electric circuit or the displacement of optical parts induce the fluctuation of the scale factor.
- the light amplitude (E R and E L ) is changed by a misalignment of optics, by a variation of light power at the light source or by a degradation of sensitivity of the photodetector.
- the amplitude b of the phase modulation is also changed by the temperature dependence of the piezoelectricity of the piezoelectric oscillator. Various reasons cause the fluctuation of the scale factor.
- 7 and 9 apply a phase-modulation of triangle waves to the light signal.
- the triangle waves demand a high speed phase modulation, because a triangle wave is constructed by an assembly of many sine waves of higher frequencies.
- a cheap piezoelectric oscillator is inappropriate for the phase modulator because of the low speed action of piezoelectricity.
- 8 and ⁇ 10 employ the sine wave modulation.
- the phase modulator can be composed by a cheap piezoelectric device. However, they are perhaps annoyed with the complexity of the signal processing circuits. 8 divides the output of a photodetector into halves and modulates two partial outputs by two modulation signals with a phase difference of 90 degrees.
- One purpose of this invention is to provide a fiber-optic gyroscope which is immune from the problem of the instability oil the scale factor. Another purpose is to provide a fiber-optic gyroscope which is not afflicted with the fluctuation of the light power or the fluctuation of the gain of the electric circuits. Another purpose of this invention is to provide a totally new fiber-optic gyroscope based upon a new principle which measures lengths of time instead of the synchronous detection for obtaining the angular velocity.
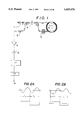
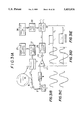
- FIG. 1 briefly shows the structure of a fiber-optic gyroscope of this invention.
- the configuration of optical parts is entirely as same as a conventional phase-modulation fiber-optic gyroscope.
- a light source (1) emits monochromatic light or quasi-monochromatic light.
- the light beams enter an end of an optical fiber (2).
- Light beams will often be called as "light waves”, because the light meanders according to the curves of the optical fiber.
- Light beams is a synonym for "light waves”.
- the light waves go through a first coupler (3) and a polarizer (4).
- the waves become linearly polarized beams.
- the linearly polarized beams are divided into halves by a second coupler (5).
- a fiber coil (6) is a sensor of angular velocity which is made by winding a single-mode fiber a plurality of times around a bobbin.
- the second coupler (5) combines two ends of the fiber coil (6).
- One half of the waves propagates clockwise in the fiber coil.
- the other half of the waves spreads counterclockwise in the fiber coil.
- the divided half waves are sometimes called a wave packet.
- a phase-modulator (7) is furnished at an end of the fiber coil (6).
- the clockwise propagation (CW) waves and the counterclockwise propagation (CCW) waves are phase-modulated by the phase-modulator (7) at different timing.
- the CW waves and CCW waves meet together at the second coupler (5).
- the waves pass through the polarizer (4) and the first coupler (3).
- Half of the combined waves reaches a photodetector (8).
- the photodetector (8) lets the CW beams and CCW beams interfere with each other and transduces the light power of the interfering beams into a photocurrent.
- the output photocurrent includes a basic component and all harmonics of the phase modulation frequency.
- An amplifier (9) converts the photocurrent to a voltage and amplifies the voltage.
- the signal voltage includes a DC (direct current) component and an AC ( alternating current) component.
- a capacitor (10) shuts off the DC component. Only the AC component passes through the capacitor (10).
- a zero-crossing detector (11) is a device which reverses its output at the time when the input signal changes its sign at a certain time. Namely the zero-crossing detector monitors the timing when tile input signal passes at OV upward or downward.
- a counter (12) counts the time of zero-crossing of the input signal. The counter counts tile timing from a negative voltage to a positive voltage and the timing from a positive voltage to a negative voltage. The counter can be adjusted to convert the sign of the output signal 13 at an arbitrary time of zero-crossing.
- FIGS. 2A and 2B shows the wave form of the AC component passing through the capacitor (10).
- Upper waves are the original AC components which are the input of the zero-crossing detector (11).
- Lower waves are the output of the zero-crossing detector (11).
- a period T o includes two waves.
- the zero-crossing detector (11) changes twice the output.
- Two time durations T 1 and T 2 can be defined by the zero-crossing detector (1).
- the first term T 1 is expressed by a positive value of the zero-crossing detector.
- the second term T 2 is expressed by a negative value.
- T 1 is a front half of a period T o .
- T 2 is a rear half of a period T o .
- T 1 +T 2 T o .
- At rest, T 1 -T 2 0.
- T 1 T 2 (FIG. 2A).
- the wave form of T 1 subwave is the same as that of T 2 subwave.
- the waves are symmetric. But the waves are not sine waves.
- the first duration time T 1 is no more equal to the second duration time T 2 .
- T 1 ⁇ T 2 when the coil is rotating.
- This invention takes an advantage of the inequality T 1 ⁇ T 2 for measuring the angular velocity ⁇ c.
- the method of this invention is quite novel, because it dispenses With synchronous detection, although it belongs to a category of the phase-modulation method.
- This invention has been originated from a profound consideration of the time-dependent change of tie phase modulated signal. Mathematical explanation will be useful for clarifying the principle of this invention.
- Eq. (9) includes all portions of the output of the photodetector.
- Eq.(11) shows the DC component and the AC component in the Bessel function expansion.
- the AC component is obtained by subtracting the DC part of Eq. (11from Eq. (9).
- the AC component I ao of the output of the photocurrent is given by
- the DC component of Eq. (11) is (E R 2+E L 2)/2 and E R E L J o ( ⁇ )cos .increment. ⁇ . Since Eq. (9) and Eq. (11) are equal, subtracting them from Eq. (9) gives the AC part I ao . cos ⁇ 2 b sin(o/2)cos( ⁇ t)+a .increment.o ⁇ includes a DC part, though it seems an AC part. Then the true AC component is obtained by subtracting J o ( ⁇ )cos .increment. ⁇ from cos ⁇ 2 b sin(o/2)cos( ⁇ t) +.increment. ⁇ . Eq. (15) is the result of the subtraction. Eq. (15) itself is novel.
- the harmonics have been used to be written by the form of the expansion of harmonics like Eq. (11).
- the AC part has never been written in an integral form such as Eq. (15).
- the time average of I ao is of course 0.
- I ao is not a simple sine function of time t.
- One period T includes two subwaves T 1 and T 2 .
- the subwaves are asymmetric for the front one and for the rear one, when the fiber coil is rotating.
- This invention utilizes the asymmetry of the subwaves in one period T.
- the asymmetry teaches the phase difference .increment. ⁇ and the angular speed ⁇ .
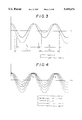
- the solid line curve shows the symmetric property at rest. It is testified by the invariance of I ao by substituting ⁇ t by ( ⁇ t+ ⁇ ).
- subwaves T 1 and T 2 are asymmetric (T 1 ⁇ T 2 ).
- the lower half of the first subwave T 1 becomes bigger.
- the lower half of the second subwave T 2 becomes smaller.
- the asymmetry will be bigger in proportion to .increment. ⁇ .
- the proportionality implies the possibility of obtaining a .increment. ⁇ .
- Halves of the subwaves are numbered for facilitating the explanation. "a” is the negative half of the first subwave. "b” is the positive half of the first subwave. “c” is the negative half of the second subwave. “d” is the positive half of the second subwave. The positive halves (b) and (d) scarcely vary for five cases.
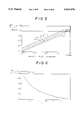
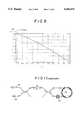
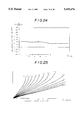
- FIG. 5 shows the result of numerical simulation for determining the relation between Sagnac's phase difference .increment. ⁇ and the time difference .increment.T.
- the abscissa is Sagnac's phase difference .increment. ⁇ in logarithmic scale.
- the unit is also radian.
- the scope of the value of ⁇ is 1 to 4. This is the result of numerical simulations.
- a scale factor is defined as the ratio of 2 ⁇ .increment.T/T(T 1 +T 2 ) to .increment. ⁇ .
- the scale factor is 2 ⁇ .increment.T/(T 1 40 T 2 ).increment. ⁇ .
- the scale factor 2 ⁇ .increment.T/(T 1 +T 2 ).increment. ⁇ changes as a function of ⁇ .
- the scale factor becomes bigger for a smaller ⁇ . Since the scale factor is defined as the ratio of .increment. T to .increment. ⁇ , the sensitivity is in proportion to the scale factor. The smaller ⁇ becomes, the larger the sensitivity rises. A smaller ⁇ ensures higher sensitivity. This property sharply contradicts prior phase-modulation gyroscopes in which a smaller ⁇ is annoyed with smaller sensitivity.
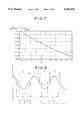
- FIG. 7 is an enlarged graph of the part of FIG. 6.
- the scope of variation of ⁇ is 2.5 to 3.5 in FIG. 7.
- the amplitude of light beams does not relate to the determination of the time durations T 1 and T 2 . Thus the following function W( ⁇ ) will be into consideration.
- a cosine function has a variable of ( ⁇ cos ⁇ +.increment. ⁇ ).
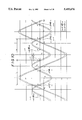
- FIG. 10 shows ⁇ cos ⁇ and cos( ⁇ cos ⁇ ) dotted lines in the variable range from - ⁇ to +(5/2) ⁇ .
- the abscissa is ⁇
- the ordinate is W.
- ( ⁇ cos ⁇ ) has two peaks in the range.
- cos( ⁇ cos ⁇ ) has four peaks in the range.
- cos( ⁇ cos ⁇ ) is asymmetric with regard to ⁇ axis.
- the asymmetry is important to understand the principal concept supporting This invention. If ⁇ is bigger than ⁇ /2, cos ⁇ is negative. If ⁇ is smaller than ⁇ /2, cos ⁇ is positive. In any eases the following argument is valid.
- a horizontal line W J is drawn in FIG. 10. The horizontal line crosses cos( ⁇ cos ⁇ ) once at every unit length of ⁇ /2. This is important. Crossing points are denoted by dots. We now consider a simplified equation.
- Eq. (21) signifies a plurality of solutions which can be expressed by C. All solutions of Eq. (21) in FIG. 10 are now clarified in every terminal of the length of ⁇ /2.
- the function cos( ⁇ cos ⁇ +.increment. ⁇ ) is a cosine function of ( ⁇ cos ⁇ +.increment. ⁇ ).
- the function cos( ⁇ cos ⁇ )+.increment. ⁇ deviates to the left in the regions of - ⁇ 0 and ⁇ 2 ⁇ for positive .increment. ⁇ .
- the same function deviates to the right in the other regions of 0 ⁇ and 2 ⁇ 3 ⁇ for positive .increment. ⁇ .
- the wave form of cos( ⁇ cos ⁇ +.increment. ⁇ ) displaces to the left in the regions of (2M-1) ⁇ 2M ⁇ , but displaces to the right in the other regions between 2M ⁇ (2M+1) ⁇ for .increment. ⁇ >0.
- the amount of the deviation is given by solving Eq. (18).
- This redundant expression includes some equivalent solutions which are separated only by 2 ⁇ which is a basic period of trigonometric functions. 1 is equivalent to 5. 2 is equivalent to 6. 3 is equivalent to 7. Four subregions form a period. It is tantamount to explain the solutions in any period staring from any subregion.
- time durations of half waves will be explained in one period consisting of 2, 3, 4 and 5.
- One period contains two upper half waves and two lower half waves.
- T 3 denotes the duration of the first (lower) half wave (from -A to +A).
- T 4 designates the duration of the second (upper) half wave (from +A to ⁇ -B).
- T 5 is the duration of the third (lower) half wave (from ⁇ -B to ⁇ +B).
- T 6 is defined as the duration of the fourth (upper) half wave (from ⁇ +B to 2 ⁇ -A). The differences of the crossing points determine the durations of the half waves.
- the first duration time T 1 is a sum of T 3 and T 4 , because the first wave consists of the first half wave and second half wave.
- the second duration time T 2 is a sum of T 5 and T 6 , because the second wave consists of the third half wave and fourth half wave.
- the first duration time T 1 and the second duration time T 2 are analytically determined by
- T 1 and T 2 The difference between T 1 and T 2 is denoted by .increment. T .
- the independent variable Since the independent variable has been ⁇ , a period has been 2 ⁇ so far.
- .increment.T should be 2(A-B)/ ⁇ , and (T 1 +T 2 ) should be 2 ⁇ / ⁇ in an actual time scale.
- the proportion constant ⁇ which is an angular frequency of the phase-modulation can be eliminated by dividing .increment. T by the total period T 1 +T 2 . This is a normalization of time difference.
- the normalized time difference .increment.T/(T 1 +T 2 ) is an odd function of .increment. ⁇ . Substitution of A and B will clarify the relation between .increment. ⁇ and .increment.T/(T 1 +T 2 ).
- Eq. (49) is an angular scale factor which is analytically acquired. This is a very simple expression.
- the variation of the scale factor must be considered as a function of ⁇ . Since ⁇ is the phase modulation coefficient, ⁇ is a parameter which can be arbitrarily determined. Selection of an optimum ⁇ requires the consideration about the stability of the sensitivity (scale factor).
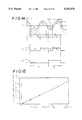
- FIG. 29 shows the relation between the scale factor and phase modulation ⁇ .
- This result teaches that a smaller ⁇ enhances the sensitivity or scale factor.
- the conventional phase-modulation method takes signals by synchronous detection of the modulation frequency.
- the tendency of this invention is a great contrast to the prior method.
- the highest sensitivity will be realized at the limit of ⁇ 0.
- .increment. ⁇ (2 -3/2 ⁇ ) ⁇ (T 1 -T 2 )/(T 1 +T 2 ) ⁇ .
- .increment. ⁇ (2 -3/2 ⁇ ) ⁇ 1+ ( ⁇ /32 ⁇ (T 1 -T 2 )/(T 1 +T 2 ) ⁇ .
- the next problem is the stability of sensitivity against the fluctuation of the phase-modulation coefficient ⁇ .
- the stability of sensitivity is satisfactory, because the change of the sensitivity is so small for the wide scope of ⁇ .
- the phase-modulation coefficient ⁇ depends on the amplitude of the driving voltage imposed on the piezoelectric oscillator or the property of the piezoelectric device. But ⁇ does not change much by the variation of the temperature or other external conditions. The influence of temperature upon ⁇ is negligible in many cases. However, if the temperature dependence of ⁇ should be suppressed at any rate, the following improvement will be able to monitor the variation of ⁇ due to the change of the external conditions.
- the monitoring method takes advantage of the difference between the upper half wave duration time Q 1 and the lower half Wave duration time Q 2 .
- the determination of the partial durations requires the start of measuring time both from the upward zero-crossing points and from the downward zero-crossing points.
- Q 1 and Q 2 are defined by
- Normalization by dividing the quantity by (Q 1 +Q 2 ) will eliminated the proportion constant ⁇ .
- the normalized difference (Q 2 -Q 1 )/(Q 1 +Q 2 ) is a function which monotonously increases from 0 to 1, while ⁇ increases from 0 to ⁇ .
- the deviation of ⁇ from the predetermined value can be monitored by the normalized difference (Q 2 -Q 1 )/(Q 1 +Q 2 ).
- the phase modulation constant can be monitored by the difference and can be adjusted to the predetermined value by the normalized difference. Therefore this method is self-consistent.
- the difference between T 1 and T 2 determines Sagnac's phase difference .increment. ⁇ .
- the other difference between Q 1 and Q 2 calibrates the phase-modulation coefficient ⁇ .
- FIG. 1 is a schematic view of a fiber-optic gyroscope of this invention.
- FIGS. 2A and 2B are wave forms of the AC (alternate current) component of the output of a photodetector of a phase-modulation fiber-optic gyroscope, when a fiber coil is at rest or in rotation.
- FIG. 8 is wave forms for showing the definition of the time lengths of half waves of the AC waves of the photodetector.
- FIG. 11 is a schematic view of a fundamental configuration of a phase-modulating fiber-optic gyroscope.
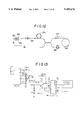
- FIG. 12 is a simplified view of a experimental gyroscope for confirming the function of this invention showing the structure of optics of a fiber-optic gyroscope without a photodiode.
- FIG. 13 is an experimental circuit for a zero-crossing detector.
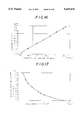
- FIG. 15 is a graph of the deviation (%) of tile AC component from the duty 50% as a function of angular velocity ⁇ c (deg/sec).
- FIG. 16 is a logarithmic representation between the output (D), and the angular velocity ( ⁇ ]c).
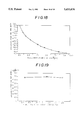
- FIG. 17 is a graph showing the relation between the phase-modulation voltage and the deviation of the AC output from the duty 50% at the angular velocity of 6 deg/sec.
- FIG. 18 is a graph representing the relation between the phase-modulation coefficient ⁇ and the deviation of the output from the duty 50% at the angular velocity of 6 deg/sec.
- FIG. 19 is a graph showing the relation between the light power and the deviation of the output duty from the duty 50% at the angular velocity of 6 deg/sec.
- FIG. 25 is a graph expressing the deviation of the AC component from the duty 50% for different ⁇ s as a function of .increment. ⁇ . That is, FIG. 25 shows a linear representation of theoretical linearity of scale factor in terms of Sagnac's phase difference.
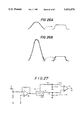
- FIGS. 26A and 26B are wave forms explaining the difference of the phase errors due to digitalization for a low signal level and for a high signal level an analog signal being digitalized.
- FIG. 27 is a drawing of an electric circuit for measuring the time a, zero-crossing.
- FIGS. 28A-28D are wave forms at terminals of the circuit of FIG. 27.
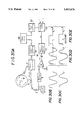
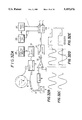
- FIG. 30A is a schematic view of a fiber-optic gyroscope of an embodiment using a common clock both for the phase modulation and for the measurement of the time durations T 1 and T 2 .
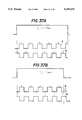
- FIGS. 30B-30E sow relationships of input ant output waves at rest and in rotation.
- FIG. 31A is a schematic view of a fiber-optic gyroscope of another embodiment using different clocks for the phase modulation and for time measurement of the time durations T 1 and T 2 .
- FIGS. 31B-31E show relationships of input and output waves at rest and in rotation.
- FIG. 32A is a schematic view of a fiber-optic gyroscope of another embodiment using two clocks with different phases for the measurement of the time durations T 1 and T 2 .
- FIGS. 32B-32E show relationships of input and output waves at rest and in rotation.
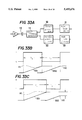
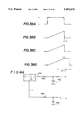
- FIG. 33A is a schematic view of an electric circuit and the wave forms of the circuit which originates a saw-wave in the term T 1 , T 2 or both in the terms T 1 and T 2 , and measures the time difference between T 1 and T 2 by the final voltages of the saw-waves.
- FIGS. 33B and 33C respectively show the saw wave generated at rest and in rotation relative to the input wave.
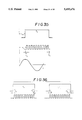
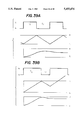
- FIG. 34A shows a schematic view of an electric circuit and FIGS. 34B-34D show wave forms of the circuit which generates a constant high voltage in either of terms T 1 and T 2 and a constant low voltage in another term, and measures the time difference between T 1 and T 2 by integrating the two-value signal.
- FIG. 35 is wave forms of the output of the zero-crossing detector, the clock signal and the phase-modulation wave for defining the initial gap e 1 and the final gap e 2 between the clock pulse and the timing pulse T 1 .
- FIG. 36 is explanatory figures for showing the random lengths of the gaps e 1 between the rising edge of T 1 pulse and the first clock pulse, and the random lengths of the gaps e 2 between the final clock and the falling edge of T 1 , values e 1 and e 2 varying at each period of T 1 .
- FIGS. 37A and 37B are wave forms showing the probability of higher precise measurement by two clock pulses with different phases.
- FIG. 38 is wave forms showing the measurement of the time length of pulse T 1 by saw-waves.
- FIGS. 39A and 39B are wave forms of the AC output, an integration of the AC waves with a shorter time constant, another integration of the AC signal with a longer time constant at rest (a) and in rotation (b).
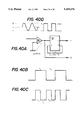
- FIG. 40A is a figure of an example of a zero-crossing detector circuit.
- FIGS. 40B, 40C and 40D show waveforms associated with the circuit of FIG. 40A.
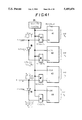
- FIG. 41 is a figure of a counting circuit for T 1 , T 2 , Q 1 and Q 2 .
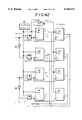
- FIG. 42 is a figure of a circuit measuring T 1 , T 2 , Q 1 and Q 2 more precisely the pulse widths of T 1 , T 1 , Q 1 and Q 2 by two counting pluses with different phases and by taking an average of the counts.
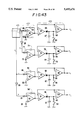
- FIG. 43 is a figure of a measuring circuit of T 1 , T 2 , Q 1 and Q 2 by generating saw-waves which are rising in proportion to time.
- FIG. 44 is a figure of measuring the time difference between T 1 and T 2 or the time difference between Q 1 and Q 2 by integrating the output of the zero-crossing detector 441.
- Sagnac's phase difference .increment. ⁇ should be estimated in a gyroscope having parts of ordinary parameters.
- the proportion constant of .increment. ⁇ to the angular velocity ⁇ o is calculated for a gyroscope with a fiber coil of a 50 m length (L) and of a 50 mm diameter (a), and a light source of a 0.84 ⁇ m wavelength.
- ⁇ o the angular velocity ⁇ o is assumed to be 0.05 deg/sec to 100 deg/see (8.73 ⁇ 10 -4 rad/sec to 1.7 rad/sec)
- the range of Sagnac's phase difference .increment. ⁇ is
- the range of .increment. ⁇ allows the gyroscope to approximate the time durations by Eq. (46) and Eq. (47).
- the detection of the minimum angular velocity 0.05 deg/sec demands a certain time resolution.
- the minimum .increment. ⁇ to be detected is 10 -4 rad(0.1 mrad).
- the current measurement technique can measure such a time without difficulty.
- This invention is of course applicable to the conventional phase-modulated fiber-optic gyroscope shown by FIG. 11.
- light beams emitted from a light source enter an end of an optical fiber.
- the light waves pass through a first coupler, a polarizer and a second coupler.
- the light waves are divided into two wave packets.
- One wave packet propagates in a fiber coil in the clockwise direction.
- the other wave packet propagates in the same fiber coil in the counterclockwise direction.
- the two wave packets assemble in the second coupler.
- the combined waves spread in the polarizer and the first coupler.
- the combined waves reach a photodetector.
- the waves interfer with each other at the photo detector.
- the photodetector transduces the light power into a photocurrent. This invention can be applied upon the output of the photodetector.
- a monolens light source 121 has a superluminescent diode (SLD) 122 and a photodiode for monitoring the light power of the SLD.
- SLD superluminescent diode
- the SLD emits light in both directions.
- the light beams emitted from the front end enter an end of a single-mode fiber (SM fiber) 124.
- SM fiber single-mode fiber
- the light power of the SLD is monitored by the rear photodiode.
- the driving current is controlled to maintain the light power of the SLD.
- the SLD package has three pins. One is a ground pin. Another is fan SLD driving pin. The third is an output of the rear, monitoring photodiode.
- This simple structure of a gyroscope has been invented by the Inventors of this invention.
- the CW waves and CCW waves return the light source.
- the returning light varies the driving current, driving voltage of the SLD or the photocurrent of the monitoring photodiode.
- the gyroscope dispenses with one coupler and a photodiode.
- the example utilizes a fiber-type polarizer as a polarizer 125.
- the fiber is wound around a bobbin with a radius of 75 min.
- a phase-modulator produced from PZT (a piezoelectric material 126) is provided in the vicinity of the fiber coil.
- a depolarizer 127 is fabricated by connecting a polarization maintaining fiber of a 1.5 m length to another polarization maintaining fiber of a 3 m length with principal axes inclining at 45 degrees.
- an auto power controlling circuit is constructed with the SLD, the monitoring photodiode m and the driving circuit.
- the signal is deduced by an AC coupling from the output of the monitoring photodiode.
- the AC component extracted out of the photocurrent is such a signal expressed by Eq. (16).
- 2.5 V of a DC bias is added to the AC component for improving the matching of the AC signal with the following digital signal processing circuit. Since the digital circuit is driven by a power supply of 5 V, superposition of 2.5 V lifts the zero-point up to 2.5 V, i.e. a half of the source voltage.
- FIG. 13 demonstrates an example of an electric circuit for digital processing the output AC signal.
- IR3C02 is an IC which drives the superluminescent diode (SLD).
- the driving IC controls the light lower of the SLD at a constant level by feeding back the photocurrent of the monitoring photodiode m.
- the monitoring photodiode has two roles. One is a monitor of the power of the SLD. The other is a photodetector of the returning light beams from the fiber coil.
- the AD component is extracted by a capacitor of 100 pF from the monitoring photodiode. Two resistors of 51 k ⁇ are connected In series between the source (5 V) and the ground (0 V).
- the middle point which is at 2.5 V is connected to a non-inversion input of ⁇ PC813 (an operational amplifier) and the capacitor via a 10 k ⁇ resistor for giving them the 2.5 V bias.
- the capacitor is coupled to an inversion input of ⁇ PC813 via a 1k ⁇ resistor.
- the AC signal of the capacitor is a small signal akin to a sine wave.
- ⁇ PC813 amplifies the small signal near to saturation.
- the amp. acts like a comparator.
- the amplified signal becomes a rectangular wave with a high level and a low level.
- the high level is around 5 V.
- the low level is nearly 0 V.
- the rectangular signal is frequency-divided to half by TC40HC163, a counter.
- the 1/2 frequency-divided signal is supplied to HP5335A, a universal counter.
- the universal counter measures the time durations of two waves included in one period of the phase-modulation. Then the duty ratio T 1 :T 2 is measured
- FIG. 14 exhibits the processing of the AC signal.
- FIG. 14(a) is an original AC signal from the AC coupling (the capacitor).
- the wave has similar upper half waves and lower half waves.
- the first interval T 1 is defined as a sum of the first lower half wave and the second upper half wave.
- the second interval T 2 is defined as a sum of the third lower half wave and the fourth upper half wave.
- the sum of T 1 and T 2 is equal to the period T o of the phase-modulation, because the AC component takes the form of cos( ⁇ cos ⁇ t) as a function of t.
- the second upper half wave is plane-symmetric with the fourth upper half wave, as explained before.
- the dotted line curve shows a wave form of the general case of a non-zero Sagnac phase difference (.increment. ⁇ 0).
- a positive .increment. ⁇ pushes down the lower half wave in T 1 and pulls up the other lower half Wave in T 2 .
- the T 1 lower half wave enlarges but the T 2 lower half wave diminishes.
- the upper half waves are left unchanged.
- the rectangular wave shown in FIG. 14(b) is obtained by amplifying the dotted curve with a large amplification ratio.
- the rectangular wave has only two levels. The upper level corresponds to the upper half waves.
- the lower level corresponds to the lower half waves.
- a counter divides the rectangular wave by frequency into 1/2 of the frequency.
- T L is equal to T 1 .
- T H is equal to T 2 .
- the deviation of duty from 50% is only half of the normalized difference of the durations T 1 and T 2 .
- the normalized difference is acquired by multiplying the deviation of duty from 50%.
- FIG. 15 exhibits the result of measurement of the deviations of duty from 50% in the 1/2 divided pulse signal as a function of angular velocity ⁇ o.
- the abscissa is the angular velocity in a linear scale.
- the ordinate is the deviation of duty in a linear scale.
- the light power at the light source is 1.5 mW.
- the angular velocity ⁇ o takes values from 0 to 30 deg/see.
- the result of the experiment clarifies an excellent linearity of this method as shown by the linearity of scale factor (linearity representation).
- FIG. 16 shows the same relation between the angular velocity and the deviation of duty from 50% in logarithmic scale.
- the abscissa is the angular velocity ⁇ o in logarithm.
- the ordinate is the deviation of duty (D-0.5) ⁇ 100% in logarithm.
- the logarithmic representation also demonstrates well the wide range of linearity between the deviation of duty (D-0.5) and the angular velocity ⁇ o.
- the abscissa is the modulation voltage which is calculated by measuring from the peak to bottom heights anti taking an average of the square of the heights.
- the ordinate is the deviation of duty.
- the scale factor SF i.e. the deviation of duty from 50% varies in accordance with the change of the phase modulation voltage in spite of the same a .increment. ⁇ .
- FIG. 18 is the graph of the same result as FIG. 17.
- the abscissa is the phase-modulation coefficient ⁇ instead of the voltage.
- ⁇ 2b sin ( ⁇ /2).
- 37 b" is a strength of the phase-modulation.
- ⁇ is the modulation frequency.
- ⁇ is the time in which light waves pass through the fiber coil.
- the modulation voltage is in proportion to the modulation coefficient.
- the proportion constant includes piezoelectric parameters which cannot be specified clearly without difficulty.
- This invention features the immunity of the scale factor from the fluctuation of the light power.
- Light power has no influence Upon the measurement of the time durations T 1 and T 2 . This fact enhances the stability of the scale factor to the greatest extent.
- FIG. 19 is the graph showing the experimental results of the deviation of duty as a function of the change of the power of the light source.
- the abscissa is the light power ( ⁇ W) at the light source.
- the angular speed is 6 deg/sec in common.
- the change of the light plower causes no variation of the deviation of duty, i.e. the scale factor.
- the scale factor is independent of the strength of the light power.
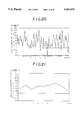
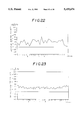
- the abscissa is the time.
- the ordinate is the deviation of duty from 50% in 1/1000 scale.
- the data of FIG. 20 and FIG. 21 are measured at the light power of 4 mW.
- the data of FIG. 22 are measured at the light power of 2 mW.
- the data of FIG. 23 and FIG. 24 are measured at 1.5 mW.
- FIG. 20, FIG. 22 and FIG. 23 taken an average of 100 data in every 7.2 sec. 80 average values are denoted in the figures.
- FIG. 21 and FIG. 24 demonstrate the result of taking an average of 1000 data in every 72 sec.
- the noise level is measured by the peak to peak (or peak to bottom) values.
- the root mean square (rms) of the noise is converted to the angular velocity (deg/sec).
- the noise level is 1.7 deg/sec for taking an average of 100 data in 7.2 sec. This is a big noise.
- the noise is 0.7deg/sec for the light power of 2.0 mW.
- the noise is reduced to 0.25 deg/sec by decreasing the light power to 1.5 mW.
- FIGS. 26A and 26B provide a relation between signal level and digitalized signal.
- the light signal from the optical parts includes noise.
- FIG. 26 demonstrates signals with small noise. The noise increases in proportion to the signal. The upper one has a small signal level. The noise is also small. The analog signal is converted into a digital signal without ambiguity. The lower one has a big signal level. The noise grows also. The large noise blurs the timing of zero-crossing due to the jitters at the analog-digital conversion.
- the fluctuation of the rising points or falling points causes errors in measuring the duration T 1 or T 2 . Since the S/N ratio is not changed in two cases, the noise growth incurs no serious problem in the conventional synchronous detection method. However, the large noise level causes difficulties in the method of this invention, because this method starts to count the time durations T 1 and T 2 from the zero-crossing points. The noise induces the fluctuation of the zero-crossing points. Thus too strong light source is disadvantageous for this invention in contradiction to the synchronous detection method. Then the light power shall be determined to an appropriate, not too strong power. Preferably the light power should be controlled by a feedback of the output of the monitoring photodiode.
- FIG. 27 is an example of the processing circuit.
- the front half part is similar to FIG. 13.
- a capacitor C cuts the DC component.
- An amplifier A plays a role of a zero-crossing detector by changing the quasi-sine wave to a rectangular, pulse wave.
- a counter 271 divides the rectangular, pulse wave by frequency into 1/2 frequency pulse waves. The frequency-division is done for two waves.
- One Q A is a signal pulse.
- the other Q B is a 50% duty, regular pulse.
- the former output Q A is integrated by a 13k ⁇ resistor and a 100 mF capacitor.
- the latter one Q B is also integrated by the similar circuit.
- An amplifier substitutes the integrated Q B from the integrated Q A .
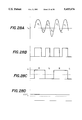
- FIGS. 28 A-D shows the wave forms at the parts of FIG. 27.
- FIG. 28A is the AC component.
- FIG. 28B is the rectangular wave form.
- FIG. 28C is the frequency-divided wave.
- FIG. 28D is the integrated wave.
- FIG. 30A is the schematic view of such a fiber-optic gyroscope having a counting circuit by clock pulses.
- the embodiment uses a fundamental clock both for the phase modulation clock and the counting clock.
- the fundamental clock (20) is frequency-divided into a phase-modulation clock (21) and a counting clock (22).
- a phase-modulator (7) is driven by the phase-modulation clock (21).
- the phase-modulator (7) oscillates in sin ⁇ t.
- a light source (1) emits light beams.
- the light waves travel through fiber couplers (3) and (5) and spread clockwise and counterclockwise in a fiber coil (6).
- the CCW and CW waves are modulated by phase at different times.
- the CW and CCW waves interfer at a photodetector (8), carrying the i influence of the phase modulation.
- the common clock type is also applicable to the gyroscope of FIG. 12 which does without a separated photodetector.
- FIGS. 30B and 30C are the wave forms of the photo current of the photodetector and the output of the zero-crossing detector at rest and in rotation, respectively.
- FIGS. 30D and 30E show the corresponding input and output waves, respectively.
- a clock signal is shown at the bottom of FIG. 30E for counting.
- the zero-crossing detector raises the output when the input crosses the 0-level upward at the first time, and drops the output when the input crosses the same level at the second time. Thus the output rises at the beginning of T 1 and fails at the beginning of T 2 in every period T o of the phase-modulation.
- the output takes the H-level (high voltage) in T 1 and the L-level (low voltage) in T 2 .
- the output of the zero-crossing detector will sometimes be called a "T 1 -T 2 pulse" for simplicity because it consists of the T 1 H-levels and the T 2 L-levels.
- the counting device (23) outputs T 1 and T 2 .
- the most precise measurement will be accomplished by the method of counting the durations by counting clock pulses.
- the error is 'smaller than one clock period (the inverse of the clock frequency). The higher the frequency of the clock pulse is, the more precise the measurement result becomes.
- FIGS. 30A-30E which makes use of a common fundamental clock for counting and modulating, the delay from the rise of T 1 pulse to the first counting clock pulse is always constant. The constant delay is likely to accumulate the error by the repetition of measurements.
- FIG. 35 clarifies the accumulation of errors.
- the bottom sine wave is the phase-modulation signal.
- the middle shows a clock signal for counting and the top shows the output of zero-crossing detector. The zero-crossing detector starts the T 1 pulse at the delay time e rs from the zero-cross of the sine wave.
- the counting device begins to count the clock pulses with a delay e 1 at the rise of T 1 and stops counting at the fall of T 1 .
- "e 2 " is a short fraction of time from the end of the clock pulse to the fall of T 1 .
- FIG. 31A gives an improvement for the problem.
- the gyroscope oscillates two different clocks for counting and modulating.
- a fundamental clock (25) for phase-modulation is frequency-divided into the phase-modulation clock (21) which drives the phase-moldulator (7).
- Another fundamental clock (26) for counting is Produced by another oscillator.
- the fundamental clock (26) for counting is frequency-divided into the counting clock (22).
- the counting clock is introduced into the counting device (23).
- the phase delay between two clocks is entirely at random.
- the delay e 1 from the rise of T 1 to the start of the first counting pulse becomes random in FIG. 35.
- the delay e 1 freely changes at every cycle of the phase-modulation.
- FIG. 35 The delay e 1 freely changes at every cycle of the phase-modulation.
- FIG. 36 shows the random e 1 and e 2 for different cycles.
- the delay e 1 is a probability variable in FIG. 31A.
- the errors due to the delay e 1 cancel each other.
- Summing and averaging of the counting data allow the gyroscope to enhance the accuracy. Since the delay e 1 varies at random, the error due to the delay decreases in accordance with an increase of the number of the data to be summed or averaged.
- FIGS. 31B-31E show relationships similar to those shown by FIGS. 30B-30E.
- FIGS. 32A-32E designates such an embodiment.
- Two basic clocks are produced by two oscillators. One is a basic clock for phase-modulation. The other is another basic clock for counting. The latter clock is frequency-divided into the counting clock (22).
- the counting clock is called clock A.
- the counting clock (22) is treated by a phase-shifter (27). Another phase-shifted clock is obtained. This is called clock B.
- the phase shift is around 180 degrees.
- Clock A and clock B have the same repetition rate (frequency) but have different phases.
- the length of T 1 (or T 2 ) is measured both by clock A and clock B. Average or sum of the count by clock A and the count by clock B gives a more precise length of T 1 (or T 2 ) than the single clock counting. Utilization of two kinds of clocks with different phases heightens the accuracy of time measurement.
- FIGS. 37A and 37B demonstrates the complementary function of clock A and clock B.
- the upper T 1 duration includes six clock pulses A and five clock pulses B. Thus the upper T 1 has a length of 5.5 clock pulses by averaging pulses A and pulses B. If T 1 were measured by a single clock, T 1 would be designated to five or six.
- T 1 ' pulse is slightly shorter than T 1 .
- Five clock pulses A are contained in T 1 '.
- Five clock pulses B are also contained in T 1 '.
- T 1 ' is identified with a 5 clock length.
- T 1 ' differs from T 1 only by half a clock pulse. In the multi-clock systems like that shown in FIG. 32A, the accuracy will be further improved by repeating counting of T 1 , and summing the counts or taking an average of the counts.
- the time duration T 1 or T 2 can be also measured by analog methods instead of the digital methods by clocks which have been explained so far. For example, a method which measures the time length by saw-wave generation is shown in FIG. 33A.
- the saw-wave generator (30) starts the generation of a saw-wave (or ramp wave) and raises the voltage in proportion to time during T 1 .
- the voltage at the fall of T 1 is held by a peak-hold circuit (31).
- the saw-wave generator (30) is reset then.
- the other saw-wave generator (32) starts the generation of another saw-wave and raises the voltage in the same proportion to time during T 2 .
- FIGS. 33B and 33C respectively show the wave generated at rest and in rotation relative to the input signals those figures showing saw-wave 1 (331) and saw-wave 2 (332) as well as first and second hold points (H1 and H2) relative to the falling edges of the input signal.
- FIG. 33A has two sets of a saw-wave generator and a peak-hold circuit for measuring both T 1 and T 2 .
- the difference (T 1 -T 2 ) gives the angular speed ⁇ o.
- one set of a saw-wave generator and a peak-hold circuit is also satisfactory to determine the time difference (T 1 -T 1 ).
- the saw-wave generator can be easily built up by resistors, capacitors and amplifiers.
- FIG. 38A demonstrates the wave forms at the zero-crossing detector, FIG. 38B output of the saw-wave generator, FIG. 38C input of the peak hold circuit and FIG.
- FIG. 34A Another analog method is shown in FIG. 34A.
- the zero-crossing detector (11) originates the T 1 -T 2 pulse wave which takes H-level in T 1 and L-level in T 2 .
- An integrating circuit (35) integrates the output of the zero-crossing detector (11).
- FIGS. 39A and 39B show wave forms at rest or in rotation, respectively.
- the first line is the output pulse (T 1 -T 2 pulse) wave of the zero-crossing detector.
- the second line is the integration of the T 1 -T 2 pulse by a shorter time constant.
- the third line is the integration of the T 1 -T 2 pulse by a longer time constant.
- the time constant is a standard of time length of the integration, i.e. the time of discharge.
- the product CR is the time constant. The integration differs according to the time constant.
- the integration by a shorter time constant yields a saw-wave (or triangle wave) of the same frequency of the phase-modulation.
- the amplitude decreases in reverse proportion to the time constant.
- the integration by a longer time constant produces a short, transient rise and a stationary DC voltage which is in proportion to the duty of the T 1 -T 2 pulse.
- the DC voltage is L-level.
- the final DC voltage is H-level.
- the circuit employs a long time constant.
- T 1 -T 2 pulse and the integrated DC voltage in three eases.
- T 1 T 1 .
- the integration is just half of H-level and L-level. 2 when the fiber coil is rotating counterclockwise, T 1 >T 2 .
- the integration is higher than the middle.
- T 1 ⁇ T 2 When the fiber coil is rotating clockwise, T 1 ⁇ T 2 .
- the integration is lower than the middle.
- the integration takes a value between L-level and H-level.
- the value notifies the angular speed of the fiber coil.
- the middle value means that the fiber coil is at rest.
- the deviation from the middle value gives the absolute value of the rotation speed.
- the direction of rotation (or the sign of .increment. ⁇ ) can be judged by the inequality of the integration to the middle value.
- the integration method also belongs to analog measurements which are immune from the difficulty of the fluctuation of the delay of the counting clock pulse. However, this method may incur a low accuracy, because all the scope of the angular velocity must be expressed by analog voltages between H-level and L-level. However, the preciseness of the analog method can be heightened by repeating thee same measurement a plenty of times, and summing the data or averaging the data in a sufficient time length.
- FIG. 40A is an example of the zero-crossing detector which is constructed with a comparator (36) and a D-flip-flop (37).
- a comparator 36)
- TC74HC74 is adopted as the D-flip-flop.
- the input signal is akin to a sine wave.
- the comparator (36) converts the upper half to H-level and the lower half to L-level by amplifying the input wave with a very large amplification ratio.
- a rectangular wave (B) is formed.
- the D-flip-flop (37) has a D-input, a clock input, an output Q and an inverse output -Q.
- the inverse output -Q is connected to the D-input.
- the output (B) of the comparator (36) is introduced into the clock input of the D-flip-flop (37). Since a D-flip-flop transfers the D-input to the Q-output at the rise of the clock input, then Q-output produces a pulse wave which rises at the first rise of (B) and falls at the second rise of (B). Thus (B) is simply frequency-divided by half.
- the pulse waves (A) and (B) are shown at FIGS. 40B and 40C at FIG. 40(B) is the T 1 -T 2 pulse.
- FIG. 40C is the original pulse wave.
- the zero-crossing detector makes both pulses shown in FIGS. 40B and 40C .
- FIG. 40B is used to determine the angular velocity.
- FIG. 40C is useful to adjust ⁇ .
- a zero-crossing detector consists of a comparator and a 1/2 frequency divider.
- FIG. 40D shows an input signal and associated square wave representation for the circuit of FIG. 40A.
- the comparator (36) reforms the quasi-sine wave into a rectangular, pulse wave which has twice as high frequency as the modulation frequency.
- the upper half waves are replaced by H-level.
- the lower half waves are replaced by L-level.
- H-level of output (B) represents the upper half waves T 4 and T 5 .
- L-level corresponds to T 3 and T 5 .
- the upper half waves, i.e. H-levels have the same length.
- the lower half waves, i.e. L-levels have different lengths.
- Signal (B) is useful to monitor or control the phase-modulation coefficient.
- the Q-input (A) of the D-flip-flop signifies T 1 by H-level and T 2 by L-level.
- the output (A) is the T 1 -T 2 pulse which has already been defined and repeatedly referred to.
- This definition is slightly different from Eq. (39) and Eq. (40).
- the difference results from the difference of the definition of zero-crossing points.
- FIG. 40 defines the zero-crossing point where the AC input crosses the 0 level upward.
- Eq. (39) and Eq. (40) define the same point where the AC input crosses the 0 level downward. Both definitions are allowable.
- FIG. 41 is a circuit of counter device.
- a counting clock (22) generates clock pulses for counting.
- the counting clock (22) is produced either by frequency-dividing the common fundamental clocks as shown in FIG. 30 or by frequency-dividing the independent fundamental clocks as shown in FIG. 31.
- the counting device treats with four signals A, -A, B and -B. "-" means an inverse. "-B” is an inverse of B.
- Inverters (38) and (39) make signal -A and signal -B from signal A and signal B.
- Four signals A, -A, B and -B are introduced into D-inputs of D-flip-flops (41), (42), (43) and (44).
- the counting clock pulses are led to clock-inputs of the same D-flip-flops.
- the counting clock (22) and signals A, -A, B and -B have no correlation in time. If two different kinds of signals were input in a counter IC, the lack of time correlation would cause instability Of the function of the counting IC.
- the D-flip-flops (45) to (48) are furnished to suppress the instability.
- the D-flip-flops synchronize the timing of the signals A, -A, B and -B with the counting clocks by connecting Q-inputs to En-inputs of counter Its (41), (42), (43) and (44).
- the circuit of FIG. 30 dispenses with D-flip-flops, because the clock pulses are correlated to signals A, -A, B and -B by the common fundamental clock generation.
- the counter circuit When the En-input (enable) is H-level, the counter circuit counts the number of clock pulses.
- the first counter (41) counts the number of clock pulses included in T 1 .
- the inverter (38) makes -A from A.
- Q-input of D-flip-flop (46) takes H-level in T 1 .
- the second counter (42) counts the number of clock pules included in T 2 .
- Signal B is an output of the comparator.
- Signal B contains T 4 and T 6 .
- the D-flip-flop (47) has a positive Q-output during T 4 and T 6 .
- the counter counts the number of clock pulses included in T 4 and T 6 .
- the output Q 1 signifies the time length T 4 +T 6 .
- the inverter (39) makes -B from B.
- Signal -B contains T 3 and T 5 .
- the counter counts the number of clock pulses included in T 3 and T 5 .
- the output Q 2 means T 5 +T 3 .
- FIG. 42 demonstrates another counting circuit for more precise measurement by making use of two clock pulses with different phases, as explained by FIG. 37.
- the counting clock (22) is now designated by clock A.
- Clock A is supplied to D-flip-flop (45), (46), (47) and (48) and counters (41), (42), (43) and (44).
- T 1 is the output of the counter (41).
- T 1 ' means the number of pulses of clock A in T 1 .
- An inverter (50) inverts clock A into clock B.
- Clock B deviates from clock A by 180 degrees of phase.
- Clock B is introduced into clock-input of counters (51), (52), (53) and (54).
- En-inputs of the counters (51), (52), (53) and (54) are connected to the Q-input of the same D-flip-flops (41), (42), (43) and (44).
- the counter (51) counts the pulses of clock B included in T 1 .
- the output is denoted by T 1 ".
- T 1 is calculated by taking an average of T 1 ' and T 1 ".
- T 1 (T 1 '+T 1 ")/2.
- T 2 , Q 1 , and Q 2 are also determined by averaging two counts by clock A and clock B.
- FIG. 43 is an electric circuit for the saw-wave generating method.
- the zero-crossing detector 431 originates signal A and signal B Inverters (38) and (39) make signal -A and-B.
- Signal A is integrated by a saw-wave generator 432.
- the output of the saw-wave generator is led to a peak-hold circuit 433 ( ⁇ PC814).
- the final voltage of the saw-wave is maintained by the peak-hold circuit.
- the voltage corresponds to T 1 .
- Other signals -A, B and -B are treated by similar saw-wave generators and peak-hold circuits.
- FIG. 43 shows four equivalent sets of devices.
- the saw-wave generator is built by resistors (61) and (63), an amplifier (62), and a capacitor (64).
- a current through the resistor (61) and the capacitor (64) reduces the output voltage of the amplifier (62).
- the fall of the voltage is in proportion to time.
- the current is integrated by the circuit whose time constant is the product of the resistor and the capacitor.
- a ramp wave (saw-wave) is generated.
- the peak-hold circuit comprises amplifiers (65) and (70), a diode (66), a capacitor (67), a resistor (68) and a reset switch (69).
- Inversion inputs of the amp. (65) and (70) are connected to the output of the amp. (70).
- the saw-wave generator is led to a non-inversion input of the amp. (65).
- the output Of the amp. (65) is connected via the diode (66) to the non-inversion input of the amp.(70).
- the output of the amp. (65) is equal to the non-inversion input.
- the voltage is kept by the diode (66) and the capacitor (67) because of the high input impedance of the amp. (70).
- the same voltage appears at the output of the amp. (70).
- the voltage is maintained.
- the voltage is in proportion to T 1 .
- the proportion constant is predetermined.
- Similar functions are done by other three sets of integration circuits and the peak-hold circuits.
- the outputs of the three are the voltages in proportion to T 2 , Q 1 and Q 2 .
- the output voltages of the peak-hold circuits are reset by discharging the capacitors by closing the reset switches.
- FIG. 44 shows another circuit which integrates signal A and signal B.
- the circuit corresponds to the integration circuit (35) in FIG. 34.
- Signal A (the T 1 -T 2 pulse) is integrated by a resistor (102) and a capacitor (103).
- Signal B is integrated by a resistor (104) and a capacitor (105).
- the voltage of the capacitor is in proportion to (T 1 -T 2 ).
- the voltage of the capacitor is in proportion to (Q 1 -Q 2 ).
- This invention measures the time lengths of T 1 and T 2 pulses for determining Sagnac's phase difference instead of synchronous detection.
- This invention succeeds in stabilizing the scale factors which fluctuate in prior phase-modulation gyroscopes in spite of various improvements. Since this invention measures the time lengths between the points at which the AC signal crosses the 0 level, it is fully immune from the fluctuation of the light power or the gain of the circuit.
- This invention allows a gyroscope to measure an angular velocity with high stability and high preciseness.
Landscapes
- Physics & Mathematics (AREA)
- Engineering & Computer Science (AREA)
- Optics & Photonics (AREA)
- Electromagnetism (AREA)
- Power Engineering (AREA)
- General Physics & Mathematics (AREA)
- Radar, Positioning & Navigation (AREA)
- Remote Sensing (AREA)
- Gyroscopes (AREA)
Applications Claiming Priority (4)
| Application Number | Priority Date | Filing Date | Title |
|---|---|---|---|
| JP5-061169 | 1993-02-24 | ||
| JP6116993 | 1993-02-24 | ||
| JP6013145A JPH06307875A (ja) | 1993-02-24 | 1994-01-10 | 信号検出方法及び位相変調度変動の検出方法 |
| JP6-013145 | 1994-01-10 |
Publications (1)
| Publication Number | Publication Date |
|---|---|
| US5455676A true US5455676A (en) | 1995-10-03 |
Family
ID=26348878
Family Applications (1)
| Application Number | Title | Priority Date | Filing Date |
|---|---|---|---|
| US08/201,459 Expired - Fee Related US5455676A (en) | 1993-02-24 | 1994-02-24 | Method of detecting a signal and modulation coefficient of a phase-modulated fiber-optic gyroscope based on a difference in the duration of multiple subwaves in a modulation period |
Country Status (6)
| Country | Link |
|---|---|
| US (1) | US5455676A (ja) |
| EP (1) | EP0612981A1 (ja) |
| JP (1) | JPH06307875A (ja) |
| KR (1) | KR940020121A (ja) |
| CA (1) | CA2116293A1 (ja) |
| NO (1) | NO940599L (ja) |
Cited By (10)
| Publication number | Priority date | Publication date | Assignee | Title |
|---|---|---|---|---|
| US5781296A (en) * | 1995-07-28 | 1998-07-14 | Tokimec Inc. | Closed loop type fiber optic gyroscope for measuring absolute rotation by delta serrodyne wave phase modulation |
| US5978084A (en) * | 1997-08-26 | 1999-11-02 | The Texas A&M University System | Open loop signal processing circuit and method for a fiber optic interferometric sensor |
| US6188811B1 (en) | 1998-10-31 | 2001-02-13 | The Texas A&M Universtiy System | Fiber optic current sensor |
| US6307632B1 (en) | 1999-03-24 | 2001-10-23 | The Texas A&M University System | Magnetic field integrated fiber optic sensor with improved sensitivity |
| US20040151415A1 (en) * | 2001-12-26 | 2004-08-05 | Erben Christoph Georg | Electro-optical modulators |
| US20100315621A1 (en) * | 2008-01-10 | 2010-12-16 | Kinichi Sasaki | Phase modulator, phase modulator assembly, and photosensor |
| US20110028591A1 (en) * | 2008-05-07 | 2011-02-03 | Anderson Kelly S | Antimicrobial nanoparticles |
| CN103926059A (zh) * | 2014-04-30 | 2014-07-16 | 电子科技大学 | 电光相位调制器调制系数的测量方法 |
| US20150345950A1 (en) * | 2013-01-10 | 2015-12-03 | Xiaotian Steve Yao | Non-interferometric optical gyroscope based on polarization sensing |
| US10139231B2 (en) * | 2015-03-27 | 2018-11-27 | Northrop Grumman Litef Gmbh | Phase modulator for fiber-optic gyroscopes controlled in a zero-mean manner and a fiber-optic gyroscope |
Families Citing this family (5)
| Publication number | Priority date | Publication date | Assignee | Title |
|---|---|---|---|---|
| US7333209B2 (en) * | 2005-11-09 | 2008-02-19 | Honeywell International, Inc. | Fiber optic gyroscope asynchronous demodulation |
| US7710576B2 (en) * | 2008-03-10 | 2010-05-04 | Honeywell International Inc. | Method and apparatus for monitoring angle random walk of a fiber optic gyroscope |
| US8149417B2 (en) | 2010-01-27 | 2012-04-03 | Honeywell International Inc. | Synchronous radiation hardened fiber optic gyroscope |
| US9857176B2 (en) * | 2013-06-20 | 2018-01-02 | Tubitak (Turkiye Bilimsel Ve Teknolojik Arastirma Kurumu) | Dynamically monitoring the instantaneous zero rotation rate voltage of interferometric fiber optic gyroscope (IFOG) |
| WO2019236746A1 (en) | 2018-06-05 | 2019-12-12 | Tm Ip Holdings, Llc | Transpositional modulation and demodulation |
Citations (12)
| Publication number | Priority date | Publication date | Assignee | Title |
|---|---|---|---|---|
| JPS6078314A (ja) * | 1983-10-04 | 1985-05-04 | Sumitomo Electric Ind Ltd | 光フアイバジヤイロ |
| JPS60135816A (ja) * | 1983-12-26 | 1985-07-19 | Sumitomo Electric Ind Ltd | 光フアイバジヤイロ |
| JPS61117410A (ja) * | 1984-11-14 | 1986-06-04 | Agency Of Ind Science & Technol | 光フアイバジヤイロ |
| JPS61124817A (ja) * | 1984-11-21 | 1986-06-12 | Agency Of Ind Science & Technol | 位相変調方式光フアイバジヤイロ |
| JPS61147106A (ja) * | 1984-12-21 | 1986-07-04 | Agency Of Ind Science & Technol | 位相変調方式光フアイバジヤイロ |
| JPS61284607A (ja) * | 1985-06-11 | 1986-12-15 | Agency Of Ind Science & Technol | 光フアイバジヤイロ |
| JPS6280512A (ja) * | 1985-10-04 | 1987-04-14 | Agency Of Ind Science & Technol | 光フアイバジヤイロ |
| JPS62212514A (ja) * | 1986-03-14 | 1987-09-18 | Agency Of Ind Science & Technol | 光フアイバジヤイロ |
| JPS63138208A (ja) * | 1986-12-01 | 1988-06-10 | Agency Of Ind Science & Technol | 位相変調方式光フアイバジヤイロ |
| US4779975A (en) * | 1987-06-25 | 1988-10-25 | The Board Of Trustees Of The Leland Stanford Junior University | Interferometric sensor using time domain measurements |
| US4869592A (en) * | 1988-01-27 | 1989-09-26 | Bergh Ralph A | Method and apparatus for obtaining a digital measure of absolute rotation |
| JPH03118415A (ja) * | 1989-10-02 | 1991-05-21 | Hitachi Ltd | 干渉測定方法、干渉センサ、干渉センサ回路、干渉センサlsi、および、光ファイバジャイロ装置 |
-
1994
- 1994-01-10 JP JP6013145A patent/JPH06307875A/ja active Pending
- 1994-02-22 NO NO940599A patent/NO940599L/no unknown
- 1994-02-22 EP EP94301229A patent/EP0612981A1/en not_active Withdrawn
- 1994-02-23 CA CA002116293A patent/CA2116293A1/en not_active Abandoned
- 1994-02-23 KR KR1019940003158A patent/KR940020121A/ko not_active Ceased
- 1994-02-24 US US08/201,459 patent/US5455676A/en not_active Expired - Fee Related
Patent Citations (12)
| Publication number | Priority date | Publication date | Assignee | Title |
|---|---|---|---|---|
| JPS6078314A (ja) * | 1983-10-04 | 1985-05-04 | Sumitomo Electric Ind Ltd | 光フアイバジヤイロ |
| JPS60135816A (ja) * | 1983-12-26 | 1985-07-19 | Sumitomo Electric Ind Ltd | 光フアイバジヤイロ |
| JPS61117410A (ja) * | 1984-11-14 | 1986-06-04 | Agency Of Ind Science & Technol | 光フアイバジヤイロ |
| JPS61124817A (ja) * | 1984-11-21 | 1986-06-12 | Agency Of Ind Science & Technol | 位相変調方式光フアイバジヤイロ |
| JPS61147106A (ja) * | 1984-12-21 | 1986-07-04 | Agency Of Ind Science & Technol | 位相変調方式光フアイバジヤイロ |
| JPS61284607A (ja) * | 1985-06-11 | 1986-12-15 | Agency Of Ind Science & Technol | 光フアイバジヤイロ |
| JPS6280512A (ja) * | 1985-10-04 | 1987-04-14 | Agency Of Ind Science & Technol | 光フアイバジヤイロ |
| JPS62212514A (ja) * | 1986-03-14 | 1987-09-18 | Agency Of Ind Science & Technol | 光フアイバジヤイロ |
| JPS63138208A (ja) * | 1986-12-01 | 1988-06-10 | Agency Of Ind Science & Technol | 位相変調方式光フアイバジヤイロ |
| US4779975A (en) * | 1987-06-25 | 1988-10-25 | The Board Of Trustees Of The Leland Stanford Junior University | Interferometric sensor using time domain measurements |
| US4869592A (en) * | 1988-01-27 | 1989-09-26 | Bergh Ralph A | Method and apparatus for obtaining a digital measure of absolute rotation |
| JPH03118415A (ja) * | 1989-10-02 | 1991-05-21 | Hitachi Ltd | 干渉測定方法、干渉センサ、干渉センサ回路、干渉センサlsi、および、光ファイバジャイロ装置 |
Cited By (14)
| Publication number | Priority date | Publication date | Assignee | Title |
|---|---|---|---|---|
| US5781296A (en) * | 1995-07-28 | 1998-07-14 | Tokimec Inc. | Closed loop type fiber optic gyroscope for measuring absolute rotation by delta serrodyne wave phase modulation |
| US5978084A (en) * | 1997-08-26 | 1999-11-02 | The Texas A&M University System | Open loop signal processing circuit and method for a fiber optic interferometric sensor |
| US6188811B1 (en) | 1998-10-31 | 2001-02-13 | The Texas A&M Universtiy System | Fiber optic current sensor |
| US6307632B1 (en) | 1999-03-24 | 2001-10-23 | The Texas A&M University System | Magnetic field integrated fiber optic sensor with improved sensitivity |
| US20040151415A1 (en) * | 2001-12-26 | 2004-08-05 | Erben Christoph Georg | Electro-optical modulators |
| US8319958B2 (en) * | 2008-01-10 | 2012-11-27 | Kabushiki Kaisha Toshiba | Phase modulator, phase modulator assembly, and photosensor |
| US20100315621A1 (en) * | 2008-01-10 | 2010-12-16 | Kinichi Sasaki | Phase modulator, phase modulator assembly, and photosensor |
| US20110028591A1 (en) * | 2008-05-07 | 2011-02-03 | Anderson Kelly S | Antimicrobial nanoparticles |
| US20150345950A1 (en) * | 2013-01-10 | 2015-12-03 | Xiaotian Steve Yao | Non-interferometric optical gyroscope based on polarization sensing |
| US9823075B2 (en) * | 2013-01-10 | 2017-11-21 | Xiaotian Steve Yao | Non-interferometric optical gyroscope based on polarization sensing |
| US10451420B2 (en) * | 2013-01-10 | 2019-10-22 | Xiaotian Steve Yao | Non-interferometric optical gyroscope based on polarization sensing |
| US11268811B2 (en) | 2013-01-10 | 2022-03-08 | NuVision Photonics, Inc. | Non-interferometric optical gyroscope based on polarization sensing |
| CN103926059A (zh) * | 2014-04-30 | 2014-07-16 | 电子科技大学 | 电光相位调制器调制系数的测量方法 |
| US10139231B2 (en) * | 2015-03-27 | 2018-11-27 | Northrop Grumman Litef Gmbh | Phase modulator for fiber-optic gyroscopes controlled in a zero-mean manner and a fiber-optic gyroscope |
Also Published As
| Publication number | Publication date |
|---|---|
| JPH06307875A (ja) | 1994-11-04 |
| NO940599L (no) | 1994-08-25 |
| KR940020121A (ko) | 1994-09-15 |
| CA2116293A1 (en) | 1994-08-25 |
| NO940599D0 (no) | 1994-02-22 |
| EP0612981A1 (en) | 1994-08-31 |
Similar Documents
| Publication | Publication Date | Title |
|---|---|---|
| US5455676A (en) | Method of detecting a signal and modulation coefficient of a phase-modulated fiber-optic gyroscope based on a difference in the duration of multiple subwaves in a modulation period | |
| US6046810A (en) | Kerr effect compensator for a fiber optic gyroscope | |
| JP4130730B2 (ja) | 光ファイバジャイロスコープ | |
| US5090810A (en) | Ring resonator gyroscope controlling two servo control loops based on the output of a single interference detector | |
| EP0830570B1 (en) | Proper frequency tracker for fiber optic sensing coil | |
| EP0990117B1 (en) | Fiber optic gyroscope vibration error compensator | |
| EP1314002B1 (en) | Dsp signal processing for open loop fiber optic sensors | |
| JP5362180B2 (ja) | 光ファイバ・ジャイロスコープの非同期復調 | |
| US5018859A (en) | Fiber optic gyroscope balanced plural serrodyne modulators phase difference control | |
| US4872754A (en) | Constant frequency digital closed-loop optical fiber gyro | |
| US4717256A (en) | Fiber optic rate sensor | |
| EP0416531A2 (en) | Serrodyne resonator fiber optic gyroscope and method for operating it | |
| US5018860A (en) | Fiber optic gyroscope balanced plural serrodyne generators combined signal phase difference control | |
| RU2194245C2 (ru) | Способ фазовой модуляции лучей кольцевого интерферометра волоконно-оптического гироскопа | |
| RU2626019C1 (ru) | Способ повышения точности волоконно-оптического гироскопа с закрытым контуром | |
| RU2441202C2 (ru) | Способ устранения зоны нечувствительности в волоконно-оптическом гироскопе | |
| RU2194246C1 (ru) | Способ обработки сигнала кольцевого интерферометра волоконно-оптического гироскопа | |
| EP0412468B1 (en) | Synthetic serrodyne controller for fiber optic gyroscope | |
| EP0206970A1 (en) | Rotation induced phase modulation in passive sagnac interferometers | |
| KR970007041B1 (ko) | 환형 레이저 자이로스코프 시스템 및 그 측정방법 | |
| EP0585954B1 (en) | Optical fiber gyroscope | |
| JPH05288557A (ja) | 光ファイバジャイロ | |
| Stubbe et al. | A pseudo-heterodyne fiber optical gyro, using integrated optics | |
| JPH05196470A (ja) | 光ファイバジャイロ | |
| JPH05215558A (ja) | 光ファイバジャイロの同期検波方式 |
Legal Events
| Date | Code | Title | Description |
|---|---|---|---|
| AS | Assignment |
Owner name: SUMITOMO ELECTRIC INDUSTRIES, LTD., JAPAN Free format text: ASSIGNMENT OF ASSIGNORS INTEREST;ASSIGNORS:NISHIURA, YOZO;NISHI, YASUHIKO;REEL/FRAME:006897/0479 Effective date: 19940217 |
|
| FEPP | Fee payment procedure |
Free format text: PAYOR NUMBER ASSIGNED (ORIGINAL EVENT CODE: ASPN); ENTITY STATUS OF PATENT OWNER: LARGE ENTITY |
|
| REMI | Maintenance fee reminder mailed | ||
| LAPS | Lapse for failure to pay maintenance fees | ||
| FP | Lapsed due to failure to pay maintenance fee |
Effective date: 19991003 |
|
| STCH | Information on status: patent discontinuation |
Free format text: PATENT EXPIRED DUE TO NONPAYMENT OF MAINTENANCE FEES UNDER 37 CFR 1.362 |