US8095322B2 - Systems and methods for determining cross-talk coefficients in PCR and other data sets - Google Patents
Systems and methods for determining cross-talk coefficients in PCR and other data sets Download PDFInfo
- Publication number
- US8095322B2 US8095322B2 US12/163,445 US16344508A US8095322B2 US 8095322 B2 US8095322 B2 US 8095322B2 US 16344508 A US16344508 A US 16344508A US 8095322 B2 US8095322 B2 US 8095322B2
- Authority
- US
- United States
- Prior art keywords
- cross
- talk
- pcr
- data set
- acquisition range
- Prior art date
- Legal status (The legal status is an assumption and is not a legal conclusion. Google has not performed a legal analysis and makes no representation as to the accuracy of the status listed.)
- Active, expires
Links
Images




Classifications
-
- C—CHEMISTRY; METALLURGY
- C12—BIOCHEMISTRY; BEER; SPIRITS; WINE; VINEGAR; MICROBIOLOGY; ENZYMOLOGY; MUTATION OR GENETIC ENGINEERING
- C12Q—MEASURING OR TESTING PROCESSES INVOLVING ENZYMES, NUCLEIC ACIDS OR MICROORGANISMS; COMPOSITIONS OR TEST PAPERS THEREFOR; PROCESSES OF PREPARING SUCH COMPOSITIONS; CONDITION-RESPONSIVE CONTROL IN MICROBIOLOGICAL OR ENZYMOLOGICAL PROCESSES
- C12Q1/00—Measuring or testing processes involving enzymes, nucleic acids or microorganisms; Compositions therefor; Processes of preparing such compositions
- C12Q1/68—Measuring or testing processes involving enzymes, nucleic acids or microorganisms; Compositions therefor; Processes of preparing such compositions involving nucleic acids
- C12Q1/6844—Nucleic acid amplification reactions
- C12Q1/6851—Quantitative amplification
Definitions
- the present invention relates generally to systems and methods for processing data representing sigmoid-type or growth curves such as Polymerase Chain Reaction (PCR) curves, and more particularly to systems and methods for determining cross-talk characteristics of PCR detection systems.
- PCR Polymerase Chain Reaction
- PCR Polymerase Chain Reaction
- the Polymerase Chain Reaction is an in vitro method for enzymatically synthesizing or amplifying defined nucleic acid sequences.
- the reaction typically uses two oligonucleotide primers that hybridize to opposite strands and flank a template or target DNA sequence that is to be amplified. Elongation of the primers is catalyzed by a heat-stable DNA polymerase. A repetitive series of cycles involving template denaturation, primer annealing, and extension of the annealed primers by the polymerase results in an exponential accumulation of a specific DNA fragment.
- Fluorescent probes are typically used in the process to facilitate detection and quantification of the amplification process.
- FIG. 1 a A set of typical real-time PCR curves is shown in FIG. 1 a , where fluorescence intensity values are plotted vs. cycle number for a typical PCR process.
- the amplification is usually measured in thermocyclers which include components and devices for measuring fluorescence signals during the amplification reaction.
- An example of such a thermocycler is the Roche Diagnostics LightCycler (Cat. No. 20110468).
- the amplification products are, for example, detected by means of fluorescent labelled hybridization probes which emit fluorescence signals when they are bound to the target nucleic acid or in certain cases also by means of fluorescent dyes that bind to double-stranded DNA.
- the PCR curves include a baseline region 5 and a plateau region 6 . The region between the baseline region 5 and the plateau region 6 is typically referred to as the growth region.
- Typical PCR detection systems for analyzing radiation emissions from PCR experiments include two or more filters that are each operable to isolate a wavelength range for further analysis.
- each optical filter typically allows substantially all radiation in a defined wavelength range to pass.
- the probes or markers typically emit with partially overlapping wavelength bands, and a filter's band pass typically includes a region of this overlap such that each detection channel will typically receive signal emitted from other probes.
- Such cross-talk signals tend to affect the real signal of interest. Accordingly, it is desirable to correct for such cross-talk signals in each detection channel.
- One traditional way of doing this is to determine quantitative cross-talk coefficients that can be used to correct for cross-talk signals in each detection channel.
- the cross-talk coefficients are typically calculated using a ratio of the average plateau values of a basis and cross-talk signal; conventional methods rely exclusively on the plateau region which contains less than 10% of the data. Also, during PCR, the plateau region signal is generated when the chemistry is in an unstable state. For this reason, a baseline signal threshold is typically employed for target identification. Therefore, the conventional methods use a noisy signal to determine cross-talk coefficients with limited information that does not include data from the true signal acquisition region on the curve. Further, incorrect assumptions used in conventional crosstalk models have also been found to induce errors as a function of the data acquisition curve. Thus, the conventional method of calculating cross-talk coefficients may be satisfactory providing that (1) a plateau exists, (2) the plateau is flat, and (3) there is minimum noise in the plateau. However, there are many data sets where this will not be the case.
- the present invention provides systems and methods for determining cross-talk coefficients in curves, such as sigmoid-type or growth curves, and PCR curves in particular.
- the present invention also provides systems and methods for applying the cross-talk coefficients to produce cross-talk corrected data sets using a linear subtractive model.
- cross-talk signal coefficients are determined by minimizing the sum of the squares of the difference between a basis signal (times a gain and optionally plus a linear term) and a cross-talk signal.
- This technique has been shown to be superior to conventional techniques that use a ratio of the average plateau values of a basis and cross-talk signal.
- this technique analyzes data across the entire signal acquisition range to determine cross-talk coefficients. For example, all data across the acquisition range may be used, or portions of data across the entire acquisition range may be used. Analyzing across all of the signal curve data provides for a more robust cross-talk correction across the entire data acquisition range.
- a method for determining cross-talk coefficients for a Polymerase Chain Reaction (PCR) optical detection system having at least two optical elements, each optical element operable to isolate a different specific electromagnetic wavelength range.
- the method typically includes acquiring, for each optical element, a PCR data set over an acquisition range of a PCR growth process, and simultaneously acquiring, for each other optical element, a cross-talk data set over the acquisition range.
- the method further typically includes determining cross-talk coefficients using the PCR and cross-talk data sets.
- the acquisition range includes a baseline region, a growth region and a plateau region.
- determining the cross-talk coefficients includes minimizing a sum of the squares between each PCR data set and cross-talk data set over the acquisition range.
- the cross-talk coefficients are applied to a PCR data set to produce a cross-talk corrected PCR data set.
- a linear subtractive model is used to apply the cross-talk coefficients.
- a computer readable medium includes or stores code for controlling a processor to determine cross-talk coefficients for a Polymerase Chain Reaction (PCR) optical detection system having at least two optical elements, each optical element operable to isolate a different specific electromagnetic wavelength range.
- the code typically includes instructions to receive, for each optical element, a PCR data set acquired over an acquisition range of a PCR growth process, and simultaneously receive, for each other optical element, a cross-talk data set for each filter acquired over the acquisition range.
- the code also typically includes instructions to determine cross-talk coefficients using the PCR and cross-talk datasets.
- the acquisition range includes a baseline region, a growth region and a plateau region.
- the code to determine the cross-talk coefficients includes code to determine cross-talk coefficients by minimizing a sum of squares between each PCR data set and cross-talk data set over the acquisition range.
- a kinetic Polymerase Chain Reaction (PCR) system typically includes an optical detection module having at least two optical elements, each optical element operable to isolate a different specific electromagnetic wavelength range, wherein the optical detection module is typically adapted to acquire, for each optical element, a PCR data set over an acquisition range of a PCR growth process, and simultaneously acquire, for each other optical element, a cross-talk data set over the acquisition range.
- the system also typically includes an intelligence module adapted to process the acquired PCR data sets and cross-talk data sets to determine cross-talk coefficients.
- the acquisition range includes a baseline region, a growth region and a plateau region.
- the intelligence module determines the cross-talk coefficients by minimizing a sum of squares between each PCR data set and cross-talk data set over the acquisition range.
- a nucleic acid melting analysis system typically includes an optical detection module having at least two optical elements, each optical element operable to isolate a different specific electromagnetic wavelength range.
- the optical detection module is adapted to acquire, for each optical element, a melting data set over a temperature acquisition range, and simultaneously acquire, for each other optical element, a cross-talk data set over the temperature acquisition range.
- the optical detection module is also typically adapted to determine cross-talk coefficients by minimizing a sum of squares between each melting data set and cross-talk data set over the acquisition range.
- a method for determining cross-talk coefficients for an optical detection system having at least two optical elements, each optical element operable to isolate a different specific electromagnetic wavelength range.
- the method typically includes acquiring, for each optical element, a first data set over an acquisition range of a growth process, simultaneously acquiring, for each other optical element, a cross-talk data set over the acquisition range, and determining cross-talk coefficients using the first and cross-talk data sets over the acquisition range.
- the growth process in certain aspects, is one of a PCR process, a bacterial process, an enzymatic process or a binding process.
- FIG. 1 a illustrates a set of typical real-time PCR curves, where fluorescence intensity values are plotted vs. cycle number for a typical PCR process.
- FIG. 1 b illustrates a process for determining cross-talk coefficients for a detection system that analyzes PCR amplification processes using two or more detection channels.
- FIG. 2 illustrates a specific two-channel case: the FAM signal and its cross-talk into the HEX channel for a two channel detection system.
- FIG. 3 illustrates overlap of two dye spectra in two filter ranges.
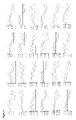
- FIG. 4 shows 24 individual residual plots when FAM and HEX channels were tested using the conventional method with target in the FAM channel and no target in the HEX channel.
- FIG. 5 shows the twenty-four plots of FIG. 24 end-to-end.
- FIG. 6 shows a superposition of all twenty-four plots of FIG. 4 .
- FIGS. 7-9 show the end-to-end residual plots for a data set processed according to embodiments of the present invention.
- FIGS. 10-12 show the superimposed residual plots corresponding to plots shown in FIGS. 7-9 , respectively.
- FIG. 13 shows a data set for a PCR experiment of an HIV assay with the target in the FAM filter and no target in the HEX filter.
- FIG. 14 shows a crosstalk data set for the HEX channel corresponding to the HIV assay of FIG. 13 .
- FIGS. 15 , 16 , and 17 show the cross-talk corrected signal in the HEX channel using the conventional method, and two embodiments of the present invention, respectively.
- the present invention provides systems and methods for determining cross-talk coefficients and for producing cross-talk corrected data sets using the cross-talk coefficients, particularly for PCR detection systems and PCR data sets, and nucleic acid melting data sets.
- the present invention also provides systems and methods for applying the cross-talk coefficients to produce cross-talk corrected data sets using a linear subtractive model.
- data for a typical PCR growth curve can be represented in a two-dimensional coordinate system, for example, with PCR cycle number defining the x-axis and an indicator of accumulated polynucleotide growth defining the y-axis.
- the indicator of accumulated growth is a fluorescence intensity value as the use of fluorescent markers is perhaps the most widely used labeling scheme. However, it should be understood that other indicators may be used depending on the particular labeling and/or detection scheme used.
- Examples of other useful indicators of accumulated signal growth include luminescence intensity, chemiluminescence intensity, bioluminescence intensity, phosphorescence intensity, charge transfer, voltage, current, power, energy, temperature, viscosity, light scatter, radioactive intensity, reflectivity, transmittance and absorbance.
- the definition of cycle can also include time, process cycles, unit operation cycles and reproductive cycles.
- a PCR detection system includes detectors for analyzing radiation emissions from PCR experiments.
- the detection system includes two or more optical elements that are each operable to isolate a wavelength range for further analysis. These optical elements are usually selected to match the emission characteristics of the fluorescent probes or markers used in PCR amplification processes, e.g., isolate radiation within the emission band of a particular dye.
- the optical elements include one or more optical filters that allow substantially all radiation in a defined wavelength range to pass. Other optical elements might include diffraction gratings.
- Each optical element defines a detection channel, e.g., a wavelength range that is received by a detector element.
- step 110 for each detection channel, an experimental data set representing one or more PCR curves is received or otherwise acquired.
- data is acquired across the entire acquisition range of the detection system, e.g., across the baseline region, the transition region and the plateau region.
- An example of a plotted PCR data set (set of one or more PCR data curves) is shown in FIG. 2A , where the y-axis and x-axis represent fluorescence intensity and cycle number, respectively, for a PCR curve.
- the data set should include data that is equally spaced along an axis. However, there may be one or more missing data points.
- step 120 simultaneously with step 110 , for each other channel, a cross talk data set is acquired over the acquisition range.
- step 130 the data sets are processed to determine cross talk coefficients as will be described in more detail below.
- a sum of the squares between each PCR data set and cross talk data set is minimized as will be described below.
- a sum of the absolute values of the difference between the PCR data set and the cross-talk data set is minimized.
- the data set may be provided to the intelligence module in real time as the data is being collected, or it may be stored in a memory unit or buffer and provided to the intelligence module after the experiment has been completed.
- the data set may be provided to a separate system such as a desktop computer system or other computer system, via a network connection (e.g., LAN, VPN, intranet, Internet, etc.) or direct connection (e.g., USB or other direct wired or wireless connection) to the acquiring device, or provided on a portable medium such as a CD, DVD, floppy disk or the like.
- the data set includes data points having a pair of coordinate values (or a 2-dimensional vector).
- the pair of coordinate values typically represents the cycle number and the fluorescence intensity value.
- the determined cross-talk coefficients may be applied to the original or a new PCR data set to produce a cross-talk corrected data set in step 140 .
- the cross-talk coefficients and/or cross-talk corrected PCR data set or other data may be stored to a memory unit, provided to a different system, e.g., over a network connection or via a portable storage medium, or displayed on a display device such as a monitor or printer.
- cross-talk coefficients are typically calculated as follows:
- the detection system consists of two unique light spectra filters each of which passes about 95% of one dye spectra and about 5% of the other dye spectra. Each filter is typically optimized to pass light from only one dye. The light passed by each of the filters is considered to be channel one and two respectively.
- cross-talk coefficients are determined by using optimization techniques similar to linear regression. Defining “Signal” as the basis signal and “XTSignal” as the cross-talk signal, subscript i as the cycle number, q as the multiplicative gain, r and s as the offset and slope, three exemplary embodiments can be described by the following equations:
- a sum of the absolute values of the difference between the PCR data set and the cross-talk data set is minimized.
- minimization methods may be used, such as for example, Levenberg-Marquardt methods, Linear Programming methods, Nelder-Mead methods, gradient descent methods, sub-gradient methods, simplex methods, ellipsoid methods, bundle methods, Newton's method, quasi-Newton methods, interior point methods and other methods as would be apparent to one skilled in the art.
- One advantage of these various embodiments is that data across the entire signal acquisition range is used to determine cross-talk coefficients. For example, all data across the acquisition range may be used, or portions of data across the entire acquisition range may be used. This provides for crosstalk coefficients that average out systematic data acquisition errors.
- conventional methods rely exclusively on the plateau region which contains less than 10% of the data.
- the embodiments of the present invention also provide additional advantages for assays such as PCR. During PCR, the plateau region signal is generated when the majority of the probes have been consumed. For this reason, a baseline signal threshold is typically employed for target identification. Therefore, the conventional methods use a noisy signal to determine cross-talk coefficients with limited information that does not include data from the true signal acquisition point on the curve.
- a background and/or baseline subtraction is performed on the data sets representing all signals (basis signal and cross-talk signals) prior to determining the cross-talk coefficients.
- a background subtraction is typically done by subtracting a buffer signal unique for each channel.
- a baseline subtraction is typically done by defining a baseline (e.g., slope and intercept) and subtracting this baseline from all signal values (basis signal and crosstalk signal).
- the baseline can be defined by specifying a baseline start and stop value and performing a linear regression between these endpoints, or by curve fitting a function (such as a double sigmoid function) and using the slope and intercept parameters from this function as the baseline.
- outlier points or “spikes” are removed from the data sets (signals) before determining cross-talk coefficients.
- the FAM to HEX cross-talk coefficient is determined to be 0.01549.
- Table 1 A summary of the FAM to HEX cross-talk coefficient for the methods of equations (1)-(3) is shown in Table 1 below:
- Equation 1 which is perhaps most similar to the Conventional Method, produces a nearly identical cross-talk coefficient, whereas the Equations 2 and 3 differ, since they include a linear term.
- Equation (1) does not use the diagonal elements (a 11 , a 22 , a 33 , a 44 ), so these cells are marked as “-”.
- Equation (1) does not use the diagonal elements (a 11 , a 22 , a 33 , a 44 ), so these cells are marked as “-”.
- any difference in applying the conventional method vs. the methods of Equations (1)-(3), in this particular example, would be due to the mathematical application of the cross-talk coefficients, not the coefficients themselves. It should be noted, however, that there are many examples where the cross-talk coefficients are very different when the current method is compared with Equations (1)-(3).
- the set of equations (4) can be solved by matrix inversion to yield the dye signal c i , which is defined as the cross-talk corrected signal.
- c i which is defined as the cross-talk corrected signal.
- cross-talk coefficients are applied using a subtractive linear model to produce cross-talk corrected data sets.
- f 2C f 2 ⁇ ( a 21 f 1 +a 23 f 3 +a 24 f 4 )
- f 3C f 3 ⁇ ( a 31 f 1 +a 32 f 2 +a 34 f 4 )
- f 4C f 4 ⁇ ( a 41 f 1 +a 42 f 2 +a 43 f 3 ) (6)
- f i is the measured fluorescence in channel (i)
- f iC is the cross-talk corrected signal in channel (i).
- the coefficients a IJ denote the cross talk coefficients from channel (J) to channel (I). This model makes no assumptions on the parsing of the basis signal amongst different channels.
- f i is the measured fluorescence in channel (i)
- f iC is the cross-talk corrected signal in channel (i).
- Equation (7) uses a gain and linear term, r and s
- the coefficients a IJ denote the cross talk coefficients from channel (J) to channel (I). Equation
- equations (6)-(8) may be modified by first subtracting a background or baseline from both the basis and cross-talk signals.
- the spectra 10 represents dye 1 (FAM) and the spectra 20 represents dye 2 (HEX). It is desired to remove the cross-talk, represented by the overlap region in the FAM and HEX dyes.
- c 1 f 1 ⁇ ( 1 - a 12 ) - a 12 ⁇ f 2 1 - a 12 - a 21 ( 9 )
- c 2 f 2 ⁇ ( 1 - a 21 ) - a 21 ⁇ f 1 1 - a 12 - a 21 ( 10 )
- Equation (11) overcomes two problems associated with equation (9), namely the (1 ⁇ a 12 ) multiplier to f 1 , which causes cross-talk over-compensation, is no longer present, and an incorrect denominator is no longer present.
- FIG. 4 shows the 24 individual residual plots
- FIG. 5 shows the twenty-four plots end-to-end.
- FIG. 6 shows a superposition of all twenty-four plots.
- the majority of the graphs show that the residuals decrease substantially from cycle 1 to cycle 60 , indicating a non-optimal cross-talk implementation.
- FIGS. 7-9 show the end-to-end residual plots for Equations (1)-(3), respectively.
- FIGS. 10-12 show the superimposed residual plots of Equations (1)-(3). Comparing FIG. 6 with FIGS. 10-12 , it is apparent that range of the residuals using the techniques of the present invention are advantageously smaller than the conventional method.
- the trend lines of the superimposed plots have slopes and intercepts much closer to the goal of zero.
- the FAM and HEX cross-talk was about 2%.
- these plots show a more optimal correction, indicating the robustness of the techniques of the present invention.
- the superiority of the techniques of the present invention will become even more apparent in examples where there are more dyes present and the cross-talk is in the range of 2-20%.
- FIGS. 13 and 14 A PCR experiment of an HIV assay with the target in the FAM filter and no target in the HEX filter is shown in FIGS. 13 and 14 for the FAM and HEX filters respectively.
- FIGS. 15 , 16 , and 17 show the cross-talk corrected signal in the HEX channel using the conventional method, Equation (1) and Equation (3), respectively. It is seen that the over correction of the signals is greatly reduced using either of the latter two methods.
- cross-talk coefficient determination processes may be implemented in computer code running on a processor of a computer system.
- the code includes instructions for controlling a processor to implement various aspects and steps of the processes.
- the code is typically stored on a hard disk, RAM or portable medium such as a CD, DVD, etc.
- the processes may be implemented in a PCR device such as a thermocycler including a processor executing instructions stored in a memory unit coupled to the processor. Code including such instructions may be downloaded to the PCR device memory unit over a network connection or direct connection to a code source or using a portable medium as is well known.
- cross-talk coefficient determination and cross-talk correction processes of the present invention can be coded using a variety of programming languages such as C, C++, C#, Fortran, VisualBasic, etc., as well as applications such as Mathematica® which provide pre-packaged routines, functions and procedures useful for data visualization and analysis. Another example of the latter is MATLAB®.
Landscapes
- Chemical & Material Sciences (AREA)
- Life Sciences & Earth Sciences (AREA)
- Organic Chemistry (AREA)
- Engineering & Computer Science (AREA)
- Zoology (AREA)
- Wood Science & Technology (AREA)
- Proteomics, Peptides & Aminoacids (AREA)
- Health & Medical Sciences (AREA)
- Molecular Biology (AREA)
- Bioinformatics & Cheminformatics (AREA)
- Immunology (AREA)
- Microbiology (AREA)
- Biophysics (AREA)
- Analytical Chemistry (AREA)
- Physics & Mathematics (AREA)
- Chemical Kinetics & Catalysis (AREA)
- Biochemistry (AREA)
- Biotechnology (AREA)
- General Engineering & Computer Science (AREA)
- General Health & Medical Sciences (AREA)
- Genetics & Genomics (AREA)
- Measuring Or Testing Involving Enzymes Or Micro-Organisms (AREA)
- Investigating, Analyzing Materials By Fluorescence Or Luminescence (AREA)
- Apparatus Associated With Microorganisms And Enzymes (AREA)
- Radio Transmission System (AREA)
- Cable Transmission Systems, Equalization Of Radio And Reduction Of Echo (AREA)
- Mobile Radio Communication Systems (AREA)
Priority Applications (1)
| Application Number | Priority Date | Filing Date | Title |
|---|---|---|---|
| US12/163,445 US8095322B2 (en) | 2007-06-29 | 2008-06-27 | Systems and methods for determining cross-talk coefficients in PCR and other data sets |
Applications Claiming Priority (2)
| Application Number | Priority Date | Filing Date | Title |
|---|---|---|---|
| US94706507P | 2007-06-29 | 2007-06-29 | |
| US12/163,445 US8095322B2 (en) | 2007-06-29 | 2008-06-27 | Systems and methods for determining cross-talk coefficients in PCR and other data sets |
Publications (2)
| Publication Number | Publication Date |
|---|---|
| US20090035779A1 US20090035779A1 (en) | 2009-02-05 |
| US8095322B2 true US8095322B2 (en) | 2012-01-10 |
Family
ID=39846613
Family Applications (1)
| Application Number | Title | Priority Date | Filing Date |
|---|---|---|---|
| US12/163,445 Active 2029-10-14 US8095322B2 (en) | 2007-06-29 | 2008-06-27 | Systems and methods for determining cross-talk coefficients in PCR and other data sets |
Country Status (8)
| Country | Link |
|---|---|
| US (1) | US8095322B2 (de) |
| EP (1) | EP2160594B1 (de) |
| JP (1) | JP5400768B2 (de) |
| CN (1) | CN101688841B (de) |
| AT (1) | ATE518966T1 (de) |
| CA (1) | CA2691907C (de) |
| ES (1) | ES2370678T3 (de) |
| WO (1) | WO2009003645A1 (de) |
Cited By (1)
| Publication number | Priority date | Publication date | Assignee | Title |
|---|---|---|---|---|
| US9139872B2 (en) | 2012-06-28 | 2015-09-22 | Samsung Electronics Co., Ltd. | Method and apparatus for analyzing nucleic acid by compensating for crosstalk in polymerase chain reaction data and other data |
Families Citing this family (17)
| Publication number | Priority date | Publication date | Assignee | Title |
|---|---|---|---|---|
| US20090181391A1 (en) * | 2007-11-01 | 2009-07-16 | Zymo Research Corporation | Methods for analysis of dna methylation percentage |
| CN102046807B (zh) * | 2008-04-24 | 2014-11-26 | 3M创新有限公司 | 利用小波变换分析核酸扩增曲线 |
| WO2010085548A2 (en) * | 2009-01-22 | 2010-07-29 | Li-Cor, Inc. | Single molecule proteomics with dynamic probes |
| CN102482720B (zh) * | 2009-09-10 | 2014-10-08 | 3M创新有限公司 | 对多重核酸扩增中的光谱串扰的补偿 |
| JP2015225032A (ja) * | 2014-05-29 | 2015-12-14 | 株式会社日立ハイテクノロジーズ | 核酸増幅分析装置 |
| US9945788B2 (en) * | 2015-02-06 | 2018-04-17 | Life Technologies Corporation | Methods and systems for determining optical regions of interest |
| CN108351918B (zh) * | 2015-11-20 | 2021-09-17 | Seegene株式会社 | 对目标分析物的数据集的校准方法 |
| JP7470095B2 (ja) * | 2018-07-10 | 2024-04-17 | ジェン-プローブ・インコーポレーテッド | 核酸を検出および定量するための方法およびシステム |
| CN109859188B (zh) * | 2019-01-31 | 2021-04-06 | 领航基因科技(杭州)有限公司 | 一种基于均值漂移算法的荧光串扰校正方法及其应用 |
| US11188778B1 (en) * | 2020-05-05 | 2021-11-30 | Illumina, Inc. | Equalization-based image processing and spatial crosstalk attenuator |
| CN112289389B (zh) * | 2020-11-05 | 2022-08-30 | 中南大学 | 一种影响靶向治疗药物疗效的评估模型 |
| JP2024522640A (ja) * | 2021-06-25 | 2024-06-21 | エフ. ホフマン-ラ ロシュ アーゲー | 高感度で温度多重化pcrを行うための方法 |
| EP4374343B1 (de) | 2021-07-19 | 2025-12-03 | Illumina, Inc. | Intensitätsextraktion mit interpolation und anpassung für basisanrufe |
| CN116399836A (zh) * | 2022-11-23 | 2023-07-07 | 上海交通大学 | 基于交替梯度下降算法的串扰荧光光谱分解方法 |
| EP4481058A1 (de) * | 2023-06-23 | 2024-12-25 | QIAGEN GmbH | Verfahren, verwendung und vorrichtung zur signalerfassung in einem prozess unter verwendung von fluoreszenz bei verschiedenen wellenlängen |
| EP4735870A1 (de) * | 2023-06-30 | 2026-05-06 | Life Technologies Corporation | Automatische einstellung der spektralen farbstoffmatrix zur verringerung von spektralem übersprechen in multiplexierten qpcr-tests |
| CN117434044B (zh) * | 2023-12-19 | 2024-03-08 | 鲲鹏基因(北京)科技有限责任公司 | 一种pcr仪荧光串扰系数标定方法及装置与应用 |
Citations (8)
| Publication number | Priority date | Publication date | Assignee | Title |
|---|---|---|---|---|
| US5606164A (en) * | 1996-01-16 | 1997-02-25 | Boehringer Mannheim Corporation | Method and apparatus for biological fluid analyte concentration measurement using generalized distance outlier detection |
| US20020042051A1 (en) * | 1999-04-27 | 2002-04-11 | Carl T. Wittwer | Automated analysis of real-time nucleic acid amplification |
| WO2002086416A2 (en) | 2001-04-25 | 2002-10-31 | Amnis Corporation | Method and apparatus for correcting crosstalk and spatial resolution for multichannel imaging |
| US20040259260A1 (en) | 2002-12-20 | 2004-12-23 | Applera Corporation | Reducing effects of spectral nonuniformity |
| US20070143385A1 (en) | 2005-12-20 | 2007-06-21 | Roche Molecular Systems, Inc. | PCR elbow determination by use of a double sigmoid function curve fit with the Levenberg-Marquardt algorithm and normalization |
| US20070148632A1 (en) | 2005-12-20 | 2007-06-28 | Roche Molecular Systems, Inc. | Levenberg-Marquardt outlier spike removal method |
| US20070166744A1 (en) * | 2005-12-19 | 2007-07-19 | Roche Molecular Systems, Inc. | Analytical method and instrument |
| US20080018898A1 (en) * | 2006-06-28 | 2008-01-24 | Applera Corporation | Minimizing Effects of Dye Crosstalk |
Family Cites Families (1)
| Publication number | Priority date | Publication date | Assignee | Title |
|---|---|---|---|---|
| US6518068B1 (en) * | 1999-07-21 | 2003-02-11 | Tropix, Inc. | Luminescence detection workstation |
-
2008
- 2008-06-27 AT AT08773727T patent/ATE518966T1/de active
- 2008-06-27 US US12/163,445 patent/US8095322B2/en active Active
- 2008-06-27 ES ES08773727T patent/ES2370678T3/es active Active
- 2008-06-27 JP JP2010513758A patent/JP5400768B2/ja active Active
- 2008-06-27 CA CA2691907A patent/CA2691907C/en active Active
- 2008-06-27 CN CN2008800225224A patent/CN101688841B/zh active Active
- 2008-06-27 WO PCT/EP2008/005255 patent/WO2009003645A1/en not_active Ceased
- 2008-06-27 EP EP08773727A patent/EP2160594B1/de active Active
Patent Citations (8)
| Publication number | Priority date | Publication date | Assignee | Title |
|---|---|---|---|---|
| US5606164A (en) * | 1996-01-16 | 1997-02-25 | Boehringer Mannheim Corporation | Method and apparatus for biological fluid analyte concentration measurement using generalized distance outlier detection |
| US20020042051A1 (en) * | 1999-04-27 | 2002-04-11 | Carl T. Wittwer | Automated analysis of real-time nucleic acid amplification |
| WO2002086416A2 (en) | 2001-04-25 | 2002-10-31 | Amnis Corporation | Method and apparatus for correcting crosstalk and spatial resolution for multichannel imaging |
| US20040259260A1 (en) | 2002-12-20 | 2004-12-23 | Applera Corporation | Reducing effects of spectral nonuniformity |
| US20070166744A1 (en) * | 2005-12-19 | 2007-07-19 | Roche Molecular Systems, Inc. | Analytical method and instrument |
| US20070143385A1 (en) | 2005-12-20 | 2007-06-21 | Roche Molecular Systems, Inc. | PCR elbow determination by use of a double sigmoid function curve fit with the Levenberg-Marquardt algorithm and normalization |
| US20070148632A1 (en) | 2005-12-20 | 2007-06-28 | Roche Molecular Systems, Inc. | Levenberg-Marquardt outlier spike removal method |
| US20080018898A1 (en) * | 2006-06-28 | 2008-01-24 | Applera Corporation | Minimizing Effects of Dye Crosstalk |
Non-Patent Citations (3)
| Title |
|---|
| Huang, W. et al., "Filter Matrix Estimation in Automated DNA Sequencing," IEEE Transactions on Biomedical Engineering, Apr. 1998, vol. 45, No. 4, pp. 422-428. |
| International Search Report mailed on Oct. 31, 2008, for PCT Application No. PCT/EP2008/005255 filed on Jun. 27, 2008, 4 pages. |
| Li et al., "An estimate of the crosstalk matrix in four-dye fluorescence-based DNA sequencing," Electrophoresis, 1999, vol. 20, pp. 1433-1442. |
Cited By (1)
| Publication number | Priority date | Publication date | Assignee | Title |
|---|---|---|---|---|
| US9139872B2 (en) | 2012-06-28 | 2015-09-22 | Samsung Electronics Co., Ltd. | Method and apparatus for analyzing nucleic acid by compensating for crosstalk in polymerase chain reaction data and other data |
Also Published As
| Publication number | Publication date |
|---|---|
| CA2691907C (en) | 2013-08-06 |
| EP2160594A1 (de) | 2010-03-10 |
| EP2160594B1 (de) | 2011-08-03 |
| JP5400768B2 (ja) | 2014-01-29 |
| CN101688841B (zh) | 2011-12-07 |
| CN101688841A (zh) | 2010-03-31 |
| ATE518966T1 (de) | 2011-08-15 |
| HK1140261A1 (en) | 2010-10-08 |
| JP2010531649A (ja) | 2010-09-30 |
| WO2009003645A1 (en) | 2009-01-08 |
| ES2370678T3 (es) | 2011-12-21 |
| CA2691907A1 (en) | 2009-01-08 |
| US20090035779A1 (en) | 2009-02-05 |
Similar Documents
| Publication | Publication Date | Title |
|---|---|---|
| US8095322B2 (en) | Systems and methods for determining cross-talk coefficients in PCR and other data sets | |
| US8219324B2 (en) | Real-time PCR elbow calling by equation-less algorithm | |
| US7680868B2 (en) | PCR elbow determination by use of a double sigmoid function curve fit with the Levenburg-Marquardt algorithm and normalization | |
| US7668663B2 (en) | Levenberg-Marquardt outlier spike removal method | |
| EP2904110B1 (de) | Universelles verfahren zur bestimmung von echtzeit-pcr-zyklus-grenzwerten | |
| US20090119020A1 (en) | Pcr elbow determination using quadratic test for curvature analysis of a double sigmoid | |
| EP3090372B1 (de) | Erkennung und korrektur von sprüngen in echtzeit-pcr-signalen | |
| US20070073490A1 (en) | Ct determination by cluster analysis with variable cluster endpoint | |
| US20220389495A1 (en) | Methods and systems for multiplex analysis | |
| KR102326604B1 (ko) | 신호 변화량 데이터 세트를 이용한 샘플 내 타겟 분석물질 검출 방법 | |
| US7844403B2 (en) | Temperature step correction with double sigmoid Levenberg-Marquardt and robust linear regression | |
| US7991562B2 (en) | PCR elbow determination using curvature analysis of a double sigmoid | |
| US8219366B2 (en) | Determination of elbow values for PCR for parabolic shaped curves | |
| KR102165933B1 (ko) | 둘 이상의 데이터 세트를 이용한 비정상적인 시그널의 검출 | |
| KR101771402B1 (ko) | 핵산 정량 방법 | |
| US20240352508A1 (en) | Methods, systems and compositions for detection of multiple analytes | |
| HK1140261B (en) | Systems and methods for determining cross-talk coefficients in pcr and other data sets |
Legal Events
| Date | Code | Title | Description |
|---|---|---|---|
| AS | Assignment |
Owner name: ROCHE MOLECULAR SYSTEMS, INC., CALIFORNIA Free format text: ASSIGNMENT OF ASSIGNORS INTEREST;ASSIGNORS:KURNIK, RONALD T;SANE, ADITYA P;ELKIN, CHRISTOPHER;REEL/FRAME:021318/0639;SIGNING DATES FROM 20080725 TO 20080730 Owner name: ROCHE MOLECULAR SYSTEMS, INC., CALIFORNIA Free format text: ASSIGNMENT OF ASSIGNORS INTEREST;ASSIGNORS:KURNIK, RONALD T;SANE, ADITYA P;ELKIN, CHRISTOPHER;SIGNING DATES FROM 20080725 TO 20080730;REEL/FRAME:021318/0639 |
|
| STCF | Information on status: patent grant |
Free format text: PATENTED CASE |
|
| FPAY | Fee payment |
Year of fee payment: 4 |
|
| MAFP | Maintenance fee payment |
Free format text: PAYMENT OF MAINTENANCE FEE, 8TH YEAR, LARGE ENTITY (ORIGINAL EVENT CODE: M1552); ENTITY STATUS OF PATENT OWNER: LARGE ENTITY Year of fee payment: 8 |
|
| MAFP | Maintenance fee payment |
Free format text: PAYMENT OF MAINTENANCE FEE, 12TH YEAR, LARGE ENTITY (ORIGINAL EVENT CODE: M1553); ENTITY STATUS OF PATENT OWNER: LARGE ENTITY Year of fee payment: 12 |