US9483049B2 - Anomaly detection and diagnosis/prognosis method, anomaly detection and diagnosis/prognosis system, and anomaly detection and diagnosis/prognosis program - Google Patents
Anomaly detection and diagnosis/prognosis method, anomaly detection and diagnosis/prognosis system, and anomaly detection and diagnosis/prognosis program Download PDFInfo
- Publication number
- US9483049B2 US9483049B2 US13/384,463 US201013384463A US9483049B2 US 9483049 B2 US9483049 B2 US 9483049B2 US 201013384463 A US201013384463 A US 201013384463A US 9483049 B2 US9483049 B2 US 9483049B2
- Authority
- US
- United States
- Prior art keywords
- anomaly
- data
- observation data
- anomaly detection
- level
- Prior art date
- Legal status (The legal status is an assumption and is not a legal conclusion. Google has not performed a legal analysis and makes no representation as to the accuracy of the status listed.)
- Expired - Fee Related, expires
Links
Images




Classifications
-
- G—PHYSICS
- G05—CONTROLLING; REGULATING
- G05B—CONTROL OR REGULATING SYSTEMS IN GENERAL; FUNCTIONAL ELEMENTS OF SUCH SYSTEMS; MONITORING OR TESTING ARRANGEMENTS FOR SUCH SYSTEMS OR ELEMENTS
- G05B23/00—Testing or monitoring of control systems or parts thereof
- G05B23/02—Electric testing or monitoring
- G05B23/0205—Electric testing or monitoring by means of a monitoring system capable of detecting and responding to faults
- G05B23/0218—Electric testing or monitoring by means of a monitoring system capable of detecting and responding to faults characterised by the fault detection method dealing with either existing or incipient faults
- G05B23/0224—Process history based detection method, e.g. whereby history implies the availability of large amounts of data
- G05B23/0227—Qualitative history assessment, whereby the type of data acted upon, e.g. waveforms, images or patterns, is not relevant, e.g. rule based assessment; if-then decisions
-
- G—PHYSICS
- G06—COMPUTING OR CALCULATING; COUNTING
- G06F—ELECTRIC DIGITAL DATA PROCESSING
- G06F18/00—Pattern recognition
- G06F18/20—Analysing
- G06F18/21—Design or setup of recognition systems or techniques; Extraction of features in feature space; Blind source separation
- G06F18/213—Feature extraction, e.g. by transforming the feature space; Summarisation; Mappings, e.g. subspace methods
- G06F18/2137—Feature extraction, e.g. by transforming the feature space; Summarisation; Mappings, e.g. subspace methods based on criteria of topology preservation, e.g. multidimensional scaling or self-organising maps
-
- G—PHYSICS
- G06—COMPUTING OR CALCULATING; COUNTING
- G06F—ELECTRIC DIGITAL DATA PROCESSING
- G06F2218/00—Aspects of pattern recognition specially adapted for signal processing
- G06F2218/12—Classification; Matching
Definitions
- the present invention relates to an anomaly detection and diagnosis/prognosis method for detecting anomaly in plants and facilities at an early stage, and an anomaly detection and diagnosis/prognosis system thereof.
- Power companies utilize waste heat of gas turbines or the like to provide local heating water or provide high-pressure and low-pressure steam to plants.
- Petrochemical companies operate gas turbines and the like as power-supply facilities. In various plants and facilities utilizing gas turbines and the like, the discovery of anomaly of such devices at an early stage is extremely important in minimizing damages to the society.
- SmartSignal Corporation provides a service of anomaly detection mainly targeting engines.
- Past data are stored in a database (DB), and the similarity between the observation data and past learning data are computed via a unique method to thereby compute an estimate value via linear coupling of data having high similarity so as to output the degree of deviation of the estimate value and the observation data.
- General Electric Company teaches detecting anomaly via k-means clustering as taught in patent literature 3.
- a system for detecting anomaly by monitoring observation data and comparing the same with a threshold value set in advance is well known.
- the threshold value is set by focusing on the physical quantity of the target of measurement which are the respective observation data, so that the system can be classified as a design-based anomaly detection.
- anomaly that is not intended by design cannot be detected easily, and anomaly may be missed.
- the threshold values set in advance may not be appropriate due to influences such as the operation environment of the facility, the change in status through years of operation, operation conditions, and influence of replacement of components.
- an estimate value is computed via linear coupling of data having high similarity with observation data targeting learning data, and the degree of deviation of the estimate value and observation data is output, so that if appropriate learning data is prepared, it is possible to consider the influence of the operation environment of the facility, the change in status through years of operation, operation conditions, and influence of replacement of components.
- explanation is required regarding why anomaly is included in the observation data. It is extremely difficult to explain anomaly in anomaly detection within feature space having subtle physical significance, such as the k-means clustering performed by General Electric Corporation. Cases that are difficult to explain may be handled as erroneous detection. Conventionally, design-based anomaly detection and case-based anomaly detection are operated independently without mutual interconnection.
- the object of the present invention is to solve the problems of the prior art mentioned above by providing a method for interconnecting design-based anomaly detection and case-based anomaly detection.
- the present invention enables to construct a rule that can be referred to as the determination conditions of anomaly detection based on case-based anomaly detection via multivariate analysis, and to apply the rule to the design-based anomaly detection.
- the invention enables appropriate execution of the setting and control of threshold values.
- the present invention provides an anomaly detection method and anomaly detection system capable of performing highly sensitive, early and clearly visible anomaly detection.
- the present invention provides a method to control design-based anomaly detection targeting individual sensor signals by the case-based anomaly detection via multivariate analysis targeting multi-dimensional sensor signals.
- the case-based anomaly detection performs selection of sensor signals and setting of threshold values according to various types of anomalies. Specifically, the system performs anomaly detection (characteristic conversion), evaluation of level of effect of each signal, construction of determination conditions (rules), and selection and display of sensor signals corresponding to the anomaly.
- the design-based anomaly detection targeting individual sensor signals performs anomaly detection based on the above case-based anomaly detection.
- the present system performs setting and control of thresholds, display of thresholds and anomaly detection.
- the case-based anomaly detection performs modeling of the learning data via a subspace classifier, and detects an anomaly candidate based on the distance relationship of observation data and subspace.
- k-number of highest data having a high similarity with respect to the individual data included in the learning data are obtained for each observation data, and a subspace is generated based thereon.
- the number k is not a fixed value, and is set to an appropriate value for each observation data, by selecting a learning data in which the distance from the observation data is within a predetermined range, and gradually increasing the number of learning data from a minimum number to a selected number so as to select the data in which the projection distance is minimum.
- the method for performing anomaly detection is realized via a program, and the program is provided to customers through media or on-line service.
- the present invention enables to clarify the points of observation of the observation data, according to which the anomaly explaining performance is improved significantly. Specifically, the individual sensor signals are displayed and threshold values thereof are set, so that the correspondence with individual sensor signals representing physical quantities is clear, and the physical meaning thereof can be comprehended easily. A multivariate analysis method with a heavy calculation load can be implemented, and highly sensitive anomaly predictor detection is enabled. The present invention enables to detect the smallest anomalies at an early stage.
- anomalies can be discovered at an early stage and with high accuracy not only in facilities using gas turbines and steam turbines but also in other facilities such as water wheels in hydroelectric power plants, atomic reactors in atomic power plants, windmills in wind power plants, engines of aircrafts and heavy equipments, railway vehicles and rails, escalators, elevators, MRI and other medical equipment, manufacturing and inspecting devices for semiconductors and flat panel displays and so on, and the present invention enables to also discover device level or component level anomalies such as the deterioration or end of life of mounted batteries and the like.
- FIG. 1 shows an example of multi-dimensional time-series signals as target in an anomaly detection system according to the present invention.
- FIG. 3 is a typical example of case-based anomaly detection.
- FIG. 4 is an explanatory view of various characteristic conversions used in case-based anomaly detection.
- FIG. 5 is a configuration diagram of an anomaly detection system according to the present invention.
- FIG. 6 is an explanatory diagram of role-sharing.
- FIG. 7 shows an example of observation signals, and illustrates the result of anomaly detection via certain threshold values in an individual detection method.
- FIG. 8 is an explanatory view of case-based anomaly detection method using a plurality of classifiers.
- FIG. 9 is a view showing the result of case-based anomaly detection.
- FIG. 10 shows an example for controlling threshold values via individual detection so that the result approximates the result of case-based anomaly detection.
- FIG. 11 shows an example of selecting observation signals and controlling threshold values based on the result of case-based anomaly detection.
- FIG. 12 shows an operation flowchart according to the present invention.
- FIG. 13 shows an operation flowchart according to the present invention.
- FIG. 14 shows another example of level of effect according to the present invention.
- FIG. 15 is an explanatory view of one method of subspace classifier according to the present invention.
- FIG. 16 is a configuration diagram of the periphery of the processor executing the present invention.
- FIG. 17 is a view showing an overall configuration of the present invention.
- FIG. 18 illustrates a network of sensor signals according to the present invention.
- FIG. 19 shows the configuration of anomaly detection and cause diagnosis/prognosis according to the present invention.
- FIG. 20 is a view illustrating one example of component information according to the present invention.
- FIG. 21 is a view showing one example of a graphic user interface GUI according to the present invention.
- FIG. 22 is an explanatory view of (a) the method of similarity computation of residual time-series pattern of the art of detecting a predictor of occurrence of anomaly via a residual time-series pattern and (b) residual signals of observation data corresponding to (a).
- FIG. 1 illustrates one example of sensor signals as the target of the anomaly detection system according to the present invention.
- the varieties of sensor signals are determined based on the scale of the facility or the social damage when the facility fails.
- the target signals are multi-dimensional, time-series sensor signals related for example to the power-generation voltage, the exhaust-gas temperature, the cooling water temperature, the cooling water pressure and the operation time.
- the installation environment and the like are also monitored.
- sampling timings of the sensors from tens of ms to tens of seconds.
- FIG. 2 illustrates a method for detecting anomaly using multi-dimensional time-series sensor signals as input.
- Multi-dimensional time-series sensor signals are processed from various viewpoints based on the knowledge on what is defined as anomaly. For example, sensor signals are differentiated at the filter processing section of the drawing so as to capture the time variation of the signals. In another example, signals within a predetermined period may be added via integral processing. Furthermore, the process may focus on the frequency of the signals to perform processes such as a Fourier transform or a wavelet transform.
- threshold values are set according to the threshold processing shown in the same drawing (for example, a maximum threshold and a minimum threshold are set), and determination is performed on whether anomaly exists or not.
- Filter processing can be varied for each sensor signal or can be the same for all signals. Although not shown, it is also possible to perform normalization (canonicalization) of the sensor signals.
- the threshold values are set based on the knowledge of design.
- the threshold values are set considering the desirable or ideal physical quantities that the sensor signals represent, the operation status of the facility, the environment and the history thereof.
- This method relates to a so-called design-based anomaly detection.
- design-based anomaly detection is easily understood by designers and service providers. Since the threshold values are based on physical phenomenon, they are visible and therefore easy to set up. In other words, since the target of threshold values is the number of rotation or the pressure to which the design criteria can be applied, and since they are not closely related to other sensor signals and can be considered independently and individually, the phenomenon is easily understood and the possible range, the maximum value and the minimum value of the signals can be set up easily based on the design criteria.
- the above method has a drawback in that the anomaly astride a plurality of sensor signals cannot be identified easily.
- Another drawback is that anomaly unintended by the designer cannot be detected. Many of the actual anomalies are not intended by the designer, and in that sense, the design-based anomaly detection method has problems. Of course, it is possible to accumulate sensor signals and to handle the signals statistically. However, such method cannot consider the behavior of other signals and thus the method is considered to have a low detection limit.
- FIG. 3 illustrates a case-based method for detecting anomaly.
- Multivariate analysis is performed to multi-dimensional time-series sensor signals to extract outliers from normal data.
- Selection of learning data (completeness evaluation) and anomaly diagnosis/prognosis may be performed using event data (such as alarm information) other than sensor data. Further, a more robust anomaly detection can be realized via identification using a plurality of classifiers.
- FIG. 4 illustrates an example of a characteristic conversion for deleting the dimension of multi-dimensional time-series signals used in FIG. 3 .
- Methods other than the principal component analysis is applicable, such as an independent component analysis, a non-negative matrix factorization, a projection to latent structure algorithm, canonical correlation analysis and so on.
- the method view and functions of the methods are illustrated in FIG. 4 .
- the principal component analysis is called PCA, which performs linear transformation of a multi-dimensional time-series signal of M dimensions to an r-dimensional multi-dimensional time-series signal having r-number of dimensions, and creates an axis where the variation is maximum. It can also adopt a Karhunen-Loeve transform.
- the number of dimensions r is determined based on a cumulative contribution ratio obtained by aligning eigenvalues calculated via principal component analysis in descending order and dividing the eigenvalues added from the largest values by the total value of all eigenvalues.
- the independent component analysis is called ICA, which is an effective method for exposing nongaussian.
- the non-negative matrix factorization is called NMF, which resolves the sensor signals given in matrix into non-negative components.
- the unsupervised methods are effective transform techniques according to the present embodiment having a small number of anomaly cases and therefore cannot be utilized. An example of linear transformation is illustrated here. Nonlinear transformation is also applicable.
- the above-mentioned characteristic conversion including canonicalization in which values are normalized via reference residual, is performed by arranging learning data and monitored data and performing the conversion simultaneously.
- learning data and monitored data can be handled equally.
- sensor signals are converted via characteristic conversion, the case-based anomaly detection is confusing for designers and service providers. Since the data are related with other sensor signals and are not independent and individual, the phenomenon is difficult to understand.
- the present method has an advantageously high sensitivity since outliers are extracted through comparison with normal data.
- FIG. 5 illustrates an anomaly detection method according to the present invention.
- the upper section illustrates the design-based anomaly detection regarding individual sensor signals shown in FIG. 2
- the lower section illustrates the case-based anomaly detection through multivariate analysis of multi-dimensional sensor signals.
- the case-based anomaly detection is used to control the design-based anomaly detection.
- the case-based anomaly detection via multivariate analysis also enters event data. It performs mode decomposition of sensor signals. Clustering is the decomposition of sensor data into clusters. The points of the method are as follows.
- the case-based anomaly detection via multivariate analysis of multi-dimensional sensor signals selects sensor signals and sets threshold values according to various types of anomalies. Specifically, anomaly detection (characteristic conversion), evaluation of level of effect of each signal, construction of determination conditions (rules) according to various types of anomalies, and selection and display of sensor signals corresponding to the anomaly are performed.
- Design-based anomaly detection for individual sensor signals performs anomaly detection after the above process has been performed. Specifically, setting and control of thresholds, display of thresholds, and anomaly detection and display are performed.
- FIG. 6 summarizes the basic concepts of the present invention. These concepts and operations are described in further detail in the following.
- FIG. 7 illustrates an example of a sensor signal for design-based anomaly detection, a set threshold, and the result of anomaly detection.
- the threshold is provided by the designer. Since the sensor signal and the threshold satisfy a one-to-one relationship, they are easily comprehensible. The timing of anomaly detection is somewhat slow. A quicker detection leads to prevention maintenance, and early replacement of parts causing failure becomes possible. The reason why the threshold value is not appropriate is that the influence of work environment of the facility, the change in status due to the number of years of operation, the operation conditions and the influence of replacement of components are beyond the range of assumption of the designer.
- FIG. 8 illustrates a case-based anomaly detection method.
- reference number 11 denotes a multi-dimensional time-series signal acquisition unit
- 12 denotes a characteristic extraction
- 13 denotes a classifier
- 14 denotes fusion (global anomaly measure)
- 15 denotes a learning data mainly composed of normal cases.
- the multi-dimensional time-series signals entered through the multi-dimensional time-series signal acquisition unit 11 has dimensions deleted via the characteristic extraction, selection and conversion unit 12 , identified via a plurality of classifiers 13 , and global anomaly measurement is determined via fusion (global anomaly measure) 14 .
- the learning data 15 mainly composed of normal cases is identified via multiple classifiers 13 and used for determination of global anomaly measure, and the learning data 15 itself mainly composed of normal cases is also subjected to selection, which is accumulated and updated to improve the accuracy.
- FIG. 8 illustrates a management PC through which the user enters the parameters.
- the parameters entered by the user are, for example, a data sampling interval, selection of observation data, and threshold values for anomaly determination.
- the sampling interval of data is for determining, for example, the seconds as the interval for acquiring the data.
- the selection of observation data is for determining which type of sensor signals should be mainly used.
- the anomaly determination threshold are threshold values in which the values of anomaly are thresholded described as computed residual or deviation from a model, outlier, discrepancy or misfit, or anomaly measurement.
- the plurality of classifiers 13 illustrated in FIG. 8 can have a number of classifiers (h 1 , h 2 , . . . ) prepared and capable of acquiring a majority thereof (fusion 14 ).
- an ensemble (group) learning using various classifier groups (h 1 , h 2 , . . . ) can be applied.
- the first classifier can adopt a projection distance method
- the second classifier can adopt a local subspace classifier
- the third classifier can adopt a linear regression.
- An arbitrary classifier can be applied if it is based on case-based data.
- FIG. 9 illustrates an example of the result of case-based anomaly detection.
- Sensor signals are the same as those shown in FIG. 7 , but the anomaly measurement calculated via multivariate analysis targeting multi-dimensional time-series sensor signals is displayed.
- the anomaly measurement is obtained via FIG. 15 described in detail later. According to this example, the timing of anomaly detection is much earlier than the design-based anomaly detection timing.
- FIG. 9 illustrates the level of effect of sensor signals with respect to anomaly. If the signal is deviated from an average value, the signal indicates anomaly. In the drawing, the third signal from the bottom shows anomaly. Individual observation shows which sensor is related to anomaly. However, in many cases, a plurality of sensor signals represent anomaly, so that the analysis thereof may apply extra strain on the system.
- FIG. 10 is an example having hastened anomaly detection by controlling threshold values in FIG. 8 . In this case, it can be said that appropriate anomaly detection is realized. However, since the setting of threshold values is performed manually and therefore artificial, the basis of setting is unclear.
- FIG. 11 utilizes the result of case-based anomaly detection and selects sensor signals using the level of effect of sensor signals to anomaly, and thereafter, controls threshold values to detect anomaly. It reflects the operation environment of the facility, the change in status due to operation years, the conditions of operation or the influence of replacement of components, wherein the basis of settings of threshold values is provided. The visibility of anomaly is also enhanced.
- FIGS. 12 and 13 illustrate the flow of the above operation.
- the discrepancy or misfit (similarity) of the observation data and the learning data is computed using the result of observation data, learning data and event analysis.
- Event data (such as alarm information) is used for example for selecting learning data.
- whether anomaly exists or not is determined based on the discrepancy or misfit (similarity) of observation data and learning data (threshold is set from the exterior). At the same time, the level of effect of anomaly is calculated.
- the identification of observation data is performed using the average of k-nearest neighbor data of each class and the distance of observation data (called LAC method).
- LAC method the distance of observation data
- the relevant sensor signal is selected based on the various anomaly and the level of effect of anomaly. In some cases, it is necessary to accumulate the various anomalies and anomaly influence rates as database.
- the result of detection of anomaly is used for controlling the threshold values with respect to each of the original sensor signals. In other words, the threshold values are controlled so that substantially same sensitivity is acquired.
- the graph illustrated in FIG. 11 is obtained. Erroneous detection may occur if the sensitivity is set so as not to overlook any anomaly, but the present embodiment assumes that such erroneous detection is okay. Similar threshold values are set to the selected plurality of sensor signals. At this time, the threshold values are determined so as to prevent the occurrence of erroneous detection as much as possible by adopting majority rule or the conjunction of the selected plurality of sensor signals for anomaly detection. Then, these logics are displayed together with the result of anomaly detection. The logics such as the majority rule and the conjunction of anomaly detection of the selected plurality of sensor signals are set as determination conditions (rules).
- Determination Conditions Conditions such as the majority rule or the conjunction of the result of threshold processing of selected sensor signals
- each sensor signal represents specific physical quantities such as the temperature or pressure of cooling water, the power generation current or the power generation voltage, by setting threshold values for each of the sensor signals, significant advantages are achieved since the designer can easily comprehend physical limits leading to anomaly, easily visually capture the anomalous phenomenon and easily correspond to the principle of operation or the physical phenomenon of the facility.
- the determination conditions (rules) obtained with respect to the individual sensor signals are externally displayed or output.
- the result of anomaly detection illustrated in FIG. 11 is also displayed on a monitor or the like.
- the result is often displayed via linear coupling of the plurality of sensor signals.
- interpretation of the result is difficult if the result is a linear coupling of the cooling water temperature and power generation current, for example.
- Linear coupling realizes a significant advantage in that the linkage between sensor signals can be recognized and a network can be constituted, however, there is a gap between linear coupling and the direct understanding by the maintenance engineers and customers. Therefore, it is important to derive and clarify the above-described determination conditions from the viewpoint of capturing an event easily through the variation of individual sensor signals or explaining an event based on a combination of a small number of sensor signals.
- the case-based anomaly detection through multivariate analysis targeting multi-dimensional sensor signals can be performed non-synchronously with the sampling of data since there is no need to realize constant linkage (synchronization), so that conversely, the sensitivity of anomaly detection can be further enhanced by adopting a complex anomaly detection method requiring a heavy operation load with respect to the data quantity that requires a long processing time of anomaly detection compared to the data sampling time.
- Desynchronization is important regarding a speedy sampling having a 1 ms cycle, for example.
- anomaly detection and sampling of data can be performed synchronously in detecting a degradation-type anomaly which requires anomaly detection in units of days where speedy processing is not required.
- FIG. 13 illustrates an example of the selected sensor signals. Further, threshold values th 1 _l, th 1 _u, th 2 _ 1 , th 2 _u, t 3 _u, th 4 _l and the like are set with respect to each of the selected sensor signals S 1 , S 2 , S 3 , S 4 and the like. In the present example, anomaly is detected through conjunction of the result of threshold processing of each of the selected sensor signals (binary logic). These are set as the determination conditions (rules) of anomaly detection.
- the threshold values th 1 _l, th 1 _u, th 2 _l, th 2 _u, t 3 _u, and th 4 _l are approximated to realize a detection ability similar to anomaly detection via multivariate analysis. They may not be completely consistent, but the values can be set so as not to miss any anomaly.
- the present embodiment aims at improving the sensitivity, the visibility of anomaly detection and facilitating interpretation thereof, but another problem arises in that it is necessary to cope with a variety of anomalies. It is possible that the plurality of sensor signals being selected varies according to the type of anomaly. Therefore, it may be possible to store the selection of sensor signals and set threshold values for each type of anomaly based on past events and to utilize the same. In this case, a plurality of selections and a plurality of threshold values are indicated. Such database composed of anomaly cases, level of effect of sensor signals and selection results may also be used as an effective material of determination in anomaly diagnosis/prognosis.
- FIG. 14 illustrates another example of evaluation of the level of effect.
- variation exists in signal A, and a predictor of anomaly has occurred.
- variation can be seen in other sensor signals such as signal B.
- signal B According to multivariate analysis, it is determined that the level of effect of signal B is high.
- canonicalization for normalizing the difference in scales of the signals via standard residual, it is not always possible to match the scales of the signals precisely. The reason is because the ON and OFF states of the signals exist in a mixture, and therefore, it becomes difficult to normalize the variation of the ON state.
- the selected sensor signals being adjusted by the factors indicate that there is a strong conjuncture when anomaly occurs, and thus, they are useful information.
- the target facility can be modeled by collecting such sensor signals for each case.
- FIG. 18 shows an example in which a network of sensor signals is created based on the level of effect information of each sensor signal to anomaly.
- basic sensor signals representing temperature, pressure and power
- weight can be added to sensor signals based on the ratio of level of effect of signals to anomaly.
- FIG. 15 acquires the residual from the model.
- FIG. 15 illustrates an example of a two class, two dimensional pattern. The subspace of each class, that is, the subspace represented by a one-dimensional straight line, is acquired.
- an eigenvalue decomposition of autocorrelation matrix of the data of each class is performed to obtain an eigenvector as basis. Eigenvectors corresponding to a few of the highest eigenvalues having a high value are used.
- an unknown pattern q latest observation pattern
- the system computes the length of orthogonal projection to subspace, or the projection distance to the subspace. Then, the system classifies the unknown pattern (latest observation pattern) q to a class in which the length of the orthogonal projection is maximum or the projection distance is short.
- the unknown pattern q (latest observation pattern) is classified into class A.
- a single class identification becomes an issue since a normal section is basically targeted, so that class A is set as the normal section and the distance from the unknown pattern q (latest observation pattern) to class A is computed and set as residual. Then, if the residual is high, the system determines that the value is an outlier.
- the influence thereof is lessened when dimension reduction is performed and a subspace is created. This is an advantage of applying a subspace classifier.
- the median point of each class is set as the origin.
- the method utilizes the eigenvector obtained by applying a KL expansion to the covariance matrix of each class as basis.
- the deflection level can be calculated.
- the deviation level can be determined based on the value of density.
- the CLAFIC method adopts a similarity scale since the length of the orthogonal projection is obtained.
- the present method computes the distance or the similarity in subspace so as to evaluate the degree of deviation.
- the classifier is based on distance, so that metric learning for learning distance functions or vector quantization for updating dictionary patterns can be applied as the learning method in the case where anomaly data can be utilized.
- a method called a local subspace classifier in which a k-number of multi-dimensional time-series signals close to the unknown pattern q (latest observation pattern) are obtained, a linear manifold is generated in which the nearest neighbor pattern of each class is set as the origin, and the unknown pattern is classified to the class where the projection distance to that linear manifold becomes minimum (refer to the area shown within the frame of the local subspace classifier of FIG. 8 ).
- the local subspace classifier is one type of subspace classifier.
- the reference character k refers to a parameter.
- anomaly detection a single class identification becomes an issue as mentioned earlier, so that the class A in which a great majority of data belongs is set as the normal section, and the distance from the unknown pattern q (latest observation pattern) to class A is computed and set as the residual.
- this method for example, it becomes possible to compute as an estimate value the orthogonal projection point from the unknown pattern q (latest observation pattern) to the subspace formed by using k-number of multi-dimensional time-series signals (the data set as estimate values illustrated within the frame of the local subspace classifier of FIG. 8 ). It is also possible to compute the estimate value of each signal by sorting the k-number of multi-dimensional time-series signals in the order closest from the unknown pattern q (latest observation pattern) and adding weight in inverse proportion to the distance thereof. The estimate values can also be computed in a similar matter through projection distance method and the like.
- a single type of parameter k is determined, but a more effective method can be obtained by performing the process while varying the parameters k a few times, since the target data can be selected with respect to similarity and a comprehensive determination can be realized based on these results. Furthermore, since the normal section is in a variety of states including the transition period between ON and OFF of the facility, so that whenever an observation data is entered, a learning data similar to the observation data is selected sequentially based on the distance from the observation data. Further, it is possible to gradually increase the number of learning data from the minimum number to a selected number, and to select the data in which the projection distance is minimum. This method can also be applied to the projection distance method. In that case, the clustering illustrated in FIG. 8 becomes unnecessary.
- a classifier such as a single class support vector machine can also be applied if the issue is considered as merely a single-class identification.
- kernelization such as a residual basis function for mapping the data in high-order space can be applied.
- the side closer to the origin is determined as the outlier, that is, abnormal.
- the support vector machine can cope with a high feature quantity dimension, but it has a drawback in that when the number of learning data is increased, the amount of calculation becomes enormous.
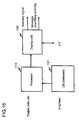
- FIG. 16 shows a hardware configuration of the anomaly detection system according to the present invention.
- the system enters a sensor data of an engine or the like set as target to a processor 119 for executing anomaly detection, where missing values or the like are restored, and the value is stored in a database DB 121 .
- the processor 119 utilizes the DB data composed of an acquired observation sensor data and learning data to execute anomaly detection.
- a display unit 120 includes various displays and outputs whether anomaly signals exist or not and a message for explaining anomaly as described later.
- the display unit can also display trend.
- the display unit can also display the result of interpretation of an event.
- Skilled engineers and the like can manipulate the database DB 121 .
- the database can teach and store anomaly cases and countermeasures thereto.
- the database stores (1) learning data (normal), (2) anomaly data and (3) contents of countermeasures. Since the database DB is designed to be manipulated by experienced engineers, a more refined and useful database can be acquired.
- the manipulation of data is performed by automatically moving the learning data (such as individual data and the median point position) when an alarm occurs or when parts are replaced. It is also possible to add the acquired data automatically. If anomalous data exists, it is possible to apply a method such as generalized vector quantization for moving data.
- FIG. 17 illustrates anomaly detection and diagnosis/prognosis after anomaly detection.
- anomaly detection is performed through characteristic extraction and classification 24 of time-series signals from the time-series signals output from the facility.
- the number of facilities can be more than one.
- a facility including a plurality of systems can be set as the target.
- supplemental information such as the maintenance event of each facility (such as an alarm or an operation record, specifically, the starting and stopping of the facility, the setting of operation conditions, various failure information, various alarm information, periodic inspection information, operation environments such as the set temperature, accumulated time of operation, components replacement information, adjustment information, cleaning information and so on) is acquired so as to detect anomaly with high sensitivity.
- predictor detection 25 discovers a predictor at an early stage, certain measures can be taken before the facility malfunctions and stops operation.
- Predictor detection is performed using a subspace classifier and the like and determination on whether a predictor exists is performed comprehensively by additionally adopting an event string matching, for example, and based on the predictor, anomaly diagnosis/prognosis is performed so as to specify failure candidate components and to estimate when the component malfunctions and stops.
- the arrangement of necessary components are performed at necessary timings in response thereto.
- the anomaly diagnosis/prognosis 26 can be classified into a phenomenon diagnosis/prognosis for specifying the sensor containing the predictor and a cause diagnosis/prognosis for specifying the component possibly causing failure.
- the anomaly detection section outputs a signal representing whether anomaly exists or not and also an information related to characteristic quantity with respect to the anomaly diagnosis/prognosis section.
- the anomaly diagnosis/prognosis section performs diagnosis/prognosis based on these information.
- FIG. 19 illustrates the configuration related to the section of anomaly detection and cause diagnosis/prognosis.
- FIG. 19 is composed of a sensor data acquisition section for acquiring data from a plurality of sensors, a learning data composed mainly of normal data, a model generation section for modeling learning data, an anomaly detection section for detecting whether anomaly exists or not in the observation data based on the similarity of observation data and modeled learning data, a level of effect evaluation section for evaluating the level of effect of each sensor signal, a sensor signal network generation section for creating a network diagram representing the relevance of each sensor signal, a relevance database composed for example of anomaly events, level of effect of each sensor signal and selection results, a design information database composed of design information of the facility, a cause diagnosis/prognosis section, a relevance database for storing the diagnosis/prognosis result, and an input/output.
- Information other than design information is included in the design information database, and in the example of an engine, it includes information on the year, the model, the components illustrated in FIG. 21 , bill of materials (BOM), past maintenance information (contents of on-call, sensor signal data when anomaly occurs, adjustment date, image data, abnormal noise information, replacement component information and so on), a cause diagnosis/prognosis tree (which is a simplified tree created by the designer, which is branched in correspondence to cases to specify units or components to be replaced), operation status information, inspection data taken at the time of shipping and installation.
- the component illustrated in FIG. 20 is information related to electric component blocks.
- the characteristics of this configuration is to tie the sensor signals and component information using the network representing the relevance of each sensor signal with the aim to support the diagnosis/prognosis of cause.
- the network representing the relevance of each sensor signal generated from the level of effect of sensor signals is used as the material of knowledge for cause diagnosis/prognosis.
- diagnosis/prognosis when a phenomenon occurs, a list of possible countermeasures is presented based on the connectivity among elements representing phenomenon, sections and treatments within a plurality of cases (ambiguous expression).
- a network representing relevance of the respective sensor signals is used to connect the phenomenon with a cable which is one of the components, so as to present a cable shield processing in the list of possible countermeasures.
- FIG. 21 illustrates one example of a graphical user interface (GUI).
- GUI graphical user interface
- Users enter necessary items regarding selection of sensor signals for eliminating sensor signals that vary monotonously or sensor signals with a small dispersion, selection of classifiers used for multivariate analysis (such as local subspace classifier or projection distance method), selection of identification parameters of the classifier, and selection of learning data from a plurality of learning data prepared in response to each season to cope with seasonal variation and the like.
- anomaly measurement or the result of evaluation of level of effect of each sensor signal are displayed as a result of multivariate analysis.
- the network relationship of each sensor signal is displayed (one example of which is shown in FIG. 18 ).
- a sensor signal to be focused and selected is selected based on the anomaly, and the result of selection is displayed. Further, the determination conditions (rules) with respect to individual sensor signals are displayed. Based on the determination conditions, the individual signal waveform and threshold values are displayed based on the determination conditions, and the result of anomaly detection with respect to the selected signal waveform are displayed. Lastly, the result of anomaly diagnosis/prognosis is displayed.
- FIG. 22 illustrates an explanatory view of the art of predictor detection when anomaly occurs via a residual time-series pattern.
- FIG. 22( a ) shows a method for calculating similarity of the residual time-series pattern
- FIG. 22( b ) shows residual signals of observation data corresponding to FIG. 22( a ) .
- Point “ 0 ” of space of FIG. 22( a ) corresponds to the normal median point of each observation data computed via the local subspace classifier shown in FIG. 8 , wherein the residual from the normal median point of sensor signal A, sensor signal B and sensor signal C at each point of time are shown as trajectory within the space.
- FIG. 22( a ) residual series of observation data at the elapse of time t ⁇ 1, time t and time t+1 are shown via arrows.
- the similarity of observation data and each anomaly event can be estimated by computing the inner product (A, B) of each residual. Further, it is also possible to divide the inner product (A, B) by the size (norm) and estimating the similarity based on angle ⁇ .
- FIG. 22( a ) shows the residual of anomaly case A, the residual of anomaly case B and the residual of anomaly case C.
- the data approximates anomaly case B at time t, but based on the trajectory, it is possible to predict the occurrence of anomaly case A, and not anomaly case B.
- the residual time-series trajectory data to the time when anomaly case occurs is stored in a database, and the similarity between a residual time-series pattern of observation data and the time-series pattern of trajectory data stored in the trajectory database is computed to detect a predictor of occurrence of anomaly.
- vector summation operation of each event of the composite event is performed so as to detect the predictor of occurrence of anomaly of a composite event (simulation of a composite event that has not occurred).
- FIG. 22( b ) shows the temporal development of residual signals of a plurality of observation data corresponding to sensor signals A, B, C and the like of FIG. 22( a ) .
- An anomaly occurs at time 11/17 at the upper section of FIG. 22( b ) in which the jacket water pressure drops, for example, wherein the predictor of occurrence of a specific anomaly can be detected by detecting the residual signals of observation data at time t ⁇ 1, t and t+1 and computing the similarity with the time-series pattern of trajectory data stored in the trajectory database.
- the present invention can be adopted as anomaly detection in plants and other facilities.
Landscapes
- Engineering & Computer Science (AREA)
- Physics & Mathematics (AREA)
- General Physics & Mathematics (AREA)
- Computer Vision & Pattern Recognition (AREA)
- Data Mining & Analysis (AREA)
- Theoretical Computer Science (AREA)
- Automation & Control Theory (AREA)
- Artificial Intelligence (AREA)
- Evolutionary Computation (AREA)
- Evolutionary Biology (AREA)
- General Engineering & Computer Science (AREA)
- Bioinformatics & Computational Biology (AREA)
- Bioinformatics & Cheminformatics (AREA)
- Life Sciences & Earth Sciences (AREA)
- Testing And Monitoring For Control Systems (AREA)
- Management, Administration, Business Operations System, And Electronic Commerce (AREA)
Applications Claiming Priority (3)
| Application Number | Priority Date | Filing Date | Title |
|---|---|---|---|
| JP2009206103A JP5363927B2 (ja) | 2009-09-07 | 2009-09-07 | 異常検知・診断方法、異常検知・診断システム、及び異常検知・診断プログラム |
| JP2009-206103 | 2009-09-07 | ||
| PCT/JP2010/060232 WO2011027607A1 (fr) | 2009-09-07 | 2010-06-16 | Procédé de diagnostic et de détection d'anomalie, système de diagnostic et de détection d'anomalie et programme de diagnostic et de détection d'anomalie |
Publications (2)
| Publication Number | Publication Date |
|---|---|
| US20120166142A1 US20120166142A1 (en) | 2012-06-28 |
| US9483049B2 true US9483049B2 (en) | 2016-11-01 |
Family
ID=43649157
Family Applications (1)
| Application Number | Title | Priority Date | Filing Date |
|---|---|---|---|
| US13/384,463 Expired - Fee Related US9483049B2 (en) | 2009-09-07 | 2010-06-16 | Anomaly detection and diagnosis/prognosis method, anomaly detection and diagnosis/prognosis system, and anomaly detection and diagnosis/prognosis program |
Country Status (4)
| Country | Link |
|---|---|
| US (1) | US9483049B2 (fr) |
| EP (1) | EP2477086A4 (fr) |
| JP (1) | JP5363927B2 (fr) |
| WO (1) | WO2011027607A1 (fr) |
Cited By (21)
| Publication number | Priority date | Publication date | Assignee | Title |
|---|---|---|---|---|
| US20180120472A1 (en) * | 2016-10-28 | 2018-05-03 | Korea Institute Of Geoscience And Mineral Resources | Apparatus and method for localizing underwater anomalous body |
| US10311703B1 (en) | 2018-02-09 | 2019-06-04 | Computational Systems, Inc. | Detection of spikes and faults in vibration trend data |
| US10737904B2 (en) | 2017-08-07 | 2020-08-11 | Otis Elevator Company | Elevator condition monitoring using heterogeneous sources |
| US20210042585A1 (en) * | 2018-06-14 | 2021-02-11 | Mitsubishi Electric Corporation | Abnormality detection device, abnormality detection method and computer readable medium |
| US11023284B2 (en) * | 2015-10-28 | 2021-06-01 | Qomplx, Inc. | System and method for optimization and load balancing of computer clusters |
| US11113395B2 (en) | 2018-05-24 | 2021-09-07 | General Electric Company | System and method for anomaly and cyber-threat detection in a wind turbine |
| US11216743B2 (en) | 2018-08-14 | 2022-01-04 | International Business Machines Corporation | Learning sparsity-constrained gaussian graphical models in anomaly detection |
| US20220035334A1 (en) * | 2020-07-29 | 2022-02-03 | Abb Schweiz Ag | Technologies for producing training data for identifying degradation of physical components |
| WO2022039575A1 (fr) * | 2020-08-21 | 2022-02-24 | (주)리얼타임테크 | Système de surveillance de processus en temps réel à base d'apprentissage profond et procédé associé |
| US11455554B2 (en) | 2019-11-25 | 2022-09-27 | International Business Machines Corporation | Trustworthiness of artificial intelligence models in presence of anomalous data |
| US20220334574A1 (en) * | 2019-09-27 | 2022-10-20 | Tata Consultancy Services Limited | Method and system for diagnosing anomaly in a manufacturing plant |
| US11630034B2 (en) * | 2021-12-29 | 2023-04-18 | Sichuan University | Method for diagnosing and predicting operation conditions of large-scale equipment based on feature fusion and conversion |
| US11740592B2 (en) | 2019-12-10 | 2023-08-29 | Canon Kabushiki Kaisha | Control method, control apparatus, mechanical equipment, and recording medium |
| US11748568B1 (en) | 2020-08-07 | 2023-09-05 | Amazon Technologies, Inc. | Machine learning-based selection of metrics for anomaly detection |
| US11790081B2 (en) | 2021-04-14 | 2023-10-17 | General Electric Company | Systems and methods for controlling an industrial asset in the presence of a cyber-attack |
| US11943242B2 (en) | 2021-03-31 | 2024-03-26 | Honda Motor Co. Ltd. | Deep automation anomaly detection |
| US12034741B2 (en) | 2021-04-21 | 2024-07-09 | Ge Infrastructure Technology Llc | System and method for cyberattack detection in a wind turbine control system |
| US12088473B2 (en) | 2019-10-23 | 2024-09-10 | Aryaka Networks, Inc. | Method, device and system for enhancing predictive classification of anomalous events in a cloud-based application acceleration as a service environment |
| US12265446B1 (en) | 2020-09-24 | 2025-04-01 | Amazon Technologies, Inc. | Multi-factor anomaly detection for application execution environments |
| US12510052B1 (en) | 2024-06-27 | 2025-12-30 | GE Vernova Renovables Espana, S.L. | System and method for optimizing control of a wind turbine |
| US12560150B2 (en) | 2021-10-07 | 2026-02-24 | GE Vernova Renovables Espana, S.L. | Systems and methods for controlling a wind turbine |
Families Citing this family (133)
| Publication number | Priority date | Publication date | Assignee | Title |
|---|---|---|---|---|
| JP5431235B2 (ja) | 2009-08-28 | 2014-03-05 | 株式会社日立製作所 | 設備状態監視方法およびその装置 |
| US8924162B2 (en) * | 2010-05-13 | 2014-12-30 | University Of Cincinnati | Turbine-to-turbine prognostics technique for wind farms |
| JP5547124B2 (ja) * | 2011-03-31 | 2014-07-09 | 公益財団法人鉄道総合技術研究所 | プログラム及び計測データ管理装置 |
| US20120283991A1 (en) * | 2011-05-06 | 2012-11-08 | The Board of Trustees of the Leland Stanford, Junior, University | Method and System for Online Detection of Multi-Component Interactions in Computing Systems |
| JP5553058B2 (ja) * | 2011-05-20 | 2014-07-16 | 日本電気株式会社 | 異常電波検出装置、異常電波検出方法および異常電波検出プログラム |
| JP5808605B2 (ja) * | 2011-08-17 | 2015-11-10 | 株式会社日立製作所 | 異常検知・診断方法、および異常検知・診断システム |
| US9659250B2 (en) | 2011-08-31 | 2017-05-23 | Hitachi Power Solutions Co., Ltd. | Facility state monitoring method and device for same |
| WO2013076927A1 (fr) * | 2011-11-24 | 2013-05-30 | パナソニック株式会社 | Appareil d'aide au diagnostic et procédé d'aide au diagnostic |
| JP5648157B2 (ja) | 2011-12-28 | 2015-01-07 | 株式会社日立ハイテクノロジーズ | 半導体製造装置 |
| JP5885563B2 (ja) * | 2012-03-30 | 2016-03-15 | 三菱電機株式会社 | プラント機器の経年劣化進行度合判定システム |
| CN102662390B (zh) * | 2012-04-26 | 2014-04-02 | 杭州电子科技大学 | 一种随机模糊故障特征融合的旋转机械设备故障诊断方法 |
| CN104487998B (zh) * | 2012-07-11 | 2018-04-27 | 株式会社日立制作所 | 类似故障事例检索装置以及检索方法 |
| JP5964450B2 (ja) * | 2012-11-29 | 2016-08-03 | 株式会社日立製作所 | ネットワークグラフ生成方法及び意思決定支援システム |
| JP6239230B2 (ja) * | 2012-12-05 | 2017-11-29 | 三菱日立パワーシステムズ株式会社 | タービンロータの製造方法 |
| JP6139149B2 (ja) * | 2013-01-29 | 2017-05-31 | 三菱重工業株式会社 | 解析方法および解析装置 |
| KR101554216B1 (ko) * | 2013-06-18 | 2015-09-18 | 삼성에스디에스 주식회사 | 시계열 형태의 센싱 데이터 배드 패턴 검증 방법 및 그 장치 |
| JP5530020B1 (ja) * | 2013-11-01 | 2014-06-25 | 株式会社日立パワーソリューションズ | 異常診断システム及び異常診断方法 |
| CN103617350B (zh) * | 2013-11-15 | 2016-09-28 | 杭州电子科技大学 | 一种基于诊断证据平滑更新的旋转机械设备故障诊断方法 |
| JP6216242B2 (ja) | 2013-12-13 | 2017-10-18 | 株式会社日立ハイテクノロジーズ | 異常検知方法およびその装置 |
| JP6364800B2 (ja) | 2014-02-10 | 2018-08-01 | オムロン株式会社 | 監視装置及び監視方法 |
| JP2015184942A (ja) | 2014-03-25 | 2015-10-22 | 株式会社日立ハイテクノロジーズ | 故障原因分類装置 |
| JP5751731B1 (ja) | 2014-05-23 | 2015-07-22 | 株式会社テイエルブイ | 蒸気使用設備の監視システム |
| US9984334B2 (en) | 2014-06-16 | 2018-05-29 | Mitsubishi Electric Research Laboratories, Inc. | Method for anomaly detection in time series data based on spectral partitioning |
| JP5943357B2 (ja) | 2014-09-17 | 2016-07-05 | インターナショナル・ビジネス・マシーンズ・コーポレーションInternational Business Machines Corporation | 検出装置、検出方法、およびプログラム |
| JP6547275B2 (ja) * | 2014-10-29 | 2019-07-24 | 株式会社リコー | 情報処理システム、情報処理装置、情報処理方法、及びプログラム |
| US20160291552A1 (en) * | 2014-11-18 | 2016-10-06 | Prophecy Sensors, Llc | System for rule management, predictive maintenance and quality assurance of a process and machine using reconfigurable sensor networks and big data machine learning |
| US10613046B2 (en) | 2015-02-23 | 2020-04-07 | Machinesense, Llc | Method for accurately measuring real-time dew-point value and total moisture content of a material |
| US20160313216A1 (en) | 2015-04-25 | 2016-10-27 | Prophecy Sensors, Llc | Fuel gauge visualization of iot based predictive maintenance system using multi-classification based machine learning |
| US10599982B2 (en) | 2015-02-23 | 2020-03-24 | Machinesense, Llc | Internet of things based determination of machine reliability and automated maintainenace, repair and operation (MRO) logs |
| US20160245279A1 (en) | 2015-02-23 | 2016-08-25 | Biplab Pal | Real time machine learning based predictive and preventive maintenance of vacuum pump |
| US10638295B2 (en) | 2015-01-17 | 2020-04-28 | Machinesense, Llc | System and method for turbomachinery preventive maintenance and root cause failure determination |
| US10648735B2 (en) | 2015-08-23 | 2020-05-12 | Machinesense, Llc | Machine learning based predictive maintenance of a dryer |
| US10481195B2 (en) | 2015-12-02 | 2019-11-19 | Machinesense, Llc | Distributed IoT based sensor analytics for power line diagnosis |
| US20160245686A1 (en) | 2015-02-23 | 2016-08-25 | Biplab Pal | Fault detection in rotor driven equipment using rotational invariant transform of sub-sampled 3-axis vibrational data |
| US10509695B1 (en) * | 2015-03-30 | 2019-12-17 | ThetaRay Ltd. | System and method for anomaly detection in dynamically evolving data using low rank matrix decomposition |
| JP6328071B2 (ja) * | 2015-03-31 | 2018-05-23 | 東芝メモリ株式会社 | 異常予兆検知システム及び半導体デバイスの製造方法 |
| JP5818337B1 (ja) * | 2015-04-13 | 2015-11-18 | 株式会社テイエルブイ | 蒸気使用設備の監視システム |
| JP6853617B2 (ja) * | 2015-07-14 | 2021-03-31 | 中国電力株式会社 | 故障予兆監視方法 |
| JP5845374B1 (ja) * | 2015-08-05 | 2016-01-20 | 株式会社日立パワーソリューションズ | 異常予兆診断システム及び異常予兆診断方法 |
| US11162912B2 (en) | 2015-09-11 | 2021-11-02 | KABUSHI Kl KAISHA TOSHIBA | Electronic apparatus, index calculating method, and computer program product |
| US20170090866A1 (en) * | 2015-09-25 | 2017-03-30 | Robert L. Vaughn | Universal sensor and/or sensor cluster to provide a detection pattern |
| JP6655926B2 (ja) * | 2015-09-25 | 2020-03-04 | 三菱重工業株式会社 | 異常診断システム |
| JP6588814B2 (ja) | 2015-12-17 | 2019-10-09 | 株式会社東芝 | 異常診断装置及び方法 |
| JP2017117089A (ja) * | 2015-12-22 | 2017-06-29 | ローム株式会社 | センサノード、センサネットワークシステム、および監視方法 |
| WO2017111072A1 (fr) | 2015-12-25 | 2017-06-29 | Ricoh Company, Ltd. | Dispositif de diagnostic, programme informatique et système de diagnostic |
| JP6156566B2 (ja) * | 2015-12-25 | 2017-07-05 | 株式会社リコー | 診断装置、診断方法、プログラムおよび診断システム |
| JP6597453B2 (ja) * | 2016-03-30 | 2019-10-30 | 株式会社Ihi | 異常診断方法、異常診断装置、及び異常診断プログラム |
| US20170284903A1 (en) * | 2016-03-30 | 2017-10-05 | Sas Institute Inc. | Monitoring machine health using multiple sensors |
| JP6840953B2 (ja) | 2016-08-09 | 2021-03-10 | 株式会社リコー | 診断装置、学習装置および診断システム |
| KR101863781B1 (ko) * | 2016-09-08 | 2018-06-01 | 두산중공업 주식회사 | 로터 진동 이상 감지 장치 및 방법 |
| WO2018073960A1 (fr) * | 2016-10-21 | 2018-04-26 | 日本電気株式会社 | Procédé d'affichage, dispositif d'affichage et programme |
| CN106569487B (zh) * | 2016-11-16 | 2019-02-26 | 北京理工大学 | 一种基于观测器的伺服系统的故障检测方法 |
| JP6675297B2 (ja) * | 2016-12-09 | 2020-04-01 | Dmg森精機株式会社 | 情報処理方法、情報処理システム、および情報処理装置 |
| JP6621395B2 (ja) * | 2016-12-12 | 2019-12-18 | 三菱重工業株式会社 | 評価装置、評価方法、コンピュータプログラム、及び記録媒体 |
| FR3061324B1 (fr) * | 2016-12-22 | 2019-05-31 | Electricite De France | Procede de caracterisation d'une ou plusieurs defaillances d'un systeme |
| JP6616791B2 (ja) * | 2017-01-04 | 2019-12-04 | 株式会社東芝 | 情報処理装置、情報処理方法およびコンピュータプログラム |
| JP6648747B2 (ja) * | 2017-01-13 | 2020-02-14 | Jfeスチール株式会社 | 異常原因特定方法および異常原因特定装置 |
| JP6920828B2 (ja) * | 2017-02-17 | 2021-08-18 | 三菱パワー株式会社 | プラントの診断装置および診断方法 |
| WO2018178082A1 (fr) | 2017-03-28 | 2018-10-04 | Shell Internationale Research Maatschappij B.V. | Procédé, dispositif informatique et système permettant de fournir une visualisation de mesures de capteur |
| US10908983B2 (en) * | 2017-03-31 | 2021-02-02 | Cae Inc. | Method and system for preventing an anomaly in a simulator |
| KR101926257B1 (ko) | 2017-05-15 | 2018-12-06 | 두산중공업 주식회사 | 이상 신호 복원 시스템 및 방법 |
| US11549491B2 (en) | 2017-06-14 | 2023-01-10 | Kk Wind Solutions A/S | Independent monitoring system for a wind turbine |
| EP3699708B1 (fr) | 2017-10-16 | 2021-07-28 | Fujitsu Limited | Dispositif, procédé et programme de surveillance d'installations de production |
| US11232371B2 (en) | 2017-10-19 | 2022-01-25 | Uptake Technologies, Inc. | Computer system and method for detecting anomalies in multivariate data |
| US10503144B2 (en) * | 2017-10-24 | 2019-12-10 | Applied Materials, Inc. | Anomaly detection with correlation coeffiecients |
| JP6721563B2 (ja) | 2017-11-28 | 2020-07-15 | ファナック株式会社 | 数値制御装置 |
| CN108089126A (zh) * | 2017-12-04 | 2018-05-29 | 国网湖南省电力公司 | 调相机故障诊断方法、装置和设备 |
| US10921792B2 (en) | 2017-12-21 | 2021-02-16 | Machinesense Llc | Edge cloud-based resin material drying system and method |
| US11036715B2 (en) * | 2018-01-29 | 2021-06-15 | Microsoft Technology Licensing, Llc | Combination of techniques to detect anomalies in multi-dimensional time series |
| US11075925B2 (en) | 2018-01-31 | 2021-07-27 | EMC IP Holding Company LLC | System and method to enable component inventory and compliance in the platform |
| EP4708233A3 (fr) | 2018-02-08 | 2026-05-06 | GEOTAB Inc. | Surveillance télématique d'un état d'un composant de véhicule opérationnel |
| US11182987B2 (en) * | 2018-02-08 | 2021-11-23 | Geotab Inc. | Telematically providing remaining effective life indications for operational vehicle components |
| US20190272209A1 (en) * | 2018-03-05 | 2019-09-05 | Kabushiki Kaisha Toshiba | System and method of resolution prediction for multifunction peripheral failures |
| US10754708B2 (en) | 2018-03-28 | 2020-08-25 | EMC IP Holding Company LLC | Orchestrator and console agnostic method to deploy infrastructure through self-describing deployment templates |
| US10795756B2 (en) | 2018-04-24 | 2020-10-06 | EMC IP Holding Company LLC | System and method to predictively service and support the solution |
| US11086738B2 (en) * | 2018-04-24 | 2021-08-10 | EMC IP Holding Company LLC | System and method to automate solution level contextual support |
| CN109063886B (zh) * | 2018-06-12 | 2022-05-31 | 创新先进技术有限公司 | 一种异常检测方法、装置以及设备 |
| JP6636214B1 (ja) | 2018-06-18 | 2020-01-29 | 三菱電機株式会社 | 診断装置、診断方法及びプログラム |
| US10685283B2 (en) | 2018-06-26 | 2020-06-16 | Sas Institute Inc. | Demand classification based pipeline system for time-series data forecasting |
| US10560313B2 (en) | 2018-06-26 | 2020-02-11 | Sas Institute Inc. | Pipeline system for time-series data forecasting |
| JP7040668B2 (ja) * | 2018-08-30 | 2022-03-23 | 日本電気株式会社 | 異常検出装置、方法、プログラム |
| US11599422B2 (en) | 2018-10-16 | 2023-03-07 | EMC IP Holding Company LLC | System and method for device independent backup in distributed system |
| JP6950670B2 (ja) * | 2018-12-12 | 2021-10-13 | 横河電機株式会社 | 検出装置、検出方法、および、検出プログラム |
| WO2020122287A1 (fr) * | 2018-12-13 | 2020-06-18 | 주식회사 알고리고 | Appareil et procédé d'identification de données anormales à l'aide d'un changement de distribution minuscule |
| JP7229018B2 (ja) * | 2018-12-28 | 2023-02-27 | Pacraft株式会社 | 不健全性予見装置、不健全性予見方法、プログラム、及びコンピュータ読み取り可能な記録媒体 |
| FR3093493B1 (fr) * | 2019-03-04 | 2021-04-09 | Commissariat Energie Atomique | Procédé de détection d’anomalie de matériel roulant exploitant un signal de déformation d’un support de rail |
| CN109948503B (zh) * | 2019-03-13 | 2023-05-23 | 东北大学 | 基于共享子空间多视角非负矩阵分解的工业故障检测方法 |
| CN110046562B (zh) * | 2019-04-01 | 2021-01-26 | 湖南大学 | 一种风电系统健康监测方法及装置 |
| US10862761B2 (en) | 2019-04-29 | 2020-12-08 | EMC IP Holding Company LLC | System and method for management of distributed systems |
| JP7397276B2 (ja) * | 2019-05-21 | 2023-12-13 | ダイキン工業株式会社 | 機器管理システム |
| US11301557B2 (en) | 2019-07-19 | 2022-04-12 | Dell Products L.P. | System and method for data processing device management |
| GB2586659B (en) * | 2019-09-02 | 2021-09-08 | Imrandd Ltd | Inspection related systems and methods |
| CN110647837B (zh) * | 2019-09-19 | 2022-03-15 | 重庆工业职业技术学院 | 电梯曳引机特征数据收集分析方法和电梯曳引机 |
| US11526790B2 (en) | 2019-09-27 | 2022-12-13 | Oracle International Corporation | Univariate anomaly detection in a sensor network |
| CN110673578B (zh) * | 2019-09-29 | 2022-07-08 | 华北电力大学(保定) | 故障劣化程度确定方法、装置、计算机设备及存储介质 |
| US11060885B2 (en) | 2019-09-30 | 2021-07-13 | Oracle International Corporation | Univariate anomaly detection in a sensor network |
| US10954919B1 (en) * | 2019-10-02 | 2021-03-23 | General Electric Company | Machine-learning model-based analytic for monitoring wind farm power performance |
| US20220341393A1 (en) * | 2019-10-02 | 2022-10-27 | General Electric Company | System and method for fusing multiple analytics of a wind turbine for improved efficiency |
| JP7350601B2 (ja) * | 2019-10-04 | 2023-09-26 | エヌ・ティ・ティ・コミュニケーションズ株式会社 | 情報処理装置、情報処理方法及び情報処理プログラム |
| CN110836786B (zh) * | 2019-11-19 | 2020-10-23 | 北京瑞莱智慧科技有限公司 | 机械故障监测方法、装置、系统、介质和计算设备 |
| JP7541660B2 (ja) * | 2020-01-06 | 2024-08-29 | 日本電気通信システム株式会社 | 自律移動装置、学習装置、異常検知方法、及びプログラム |
| US11221934B2 (en) | 2020-01-10 | 2022-01-11 | International Business Machines Corporation | Identifying anomalies in data during data outage |
| JP7434917B2 (ja) * | 2020-01-21 | 2024-02-21 | 日本電気株式会社 | 信号検出装置、センサネットワークシステム、信号検出方法、及び信号検出プログラム |
| DE102020201239A1 (de) | 2020-01-31 | 2021-08-05 | Rolls-Royce Deutschland Ltd & Co Kg | Sensorsystem und Verfahren zum Erkennen eines Zustands zumindest einer Maschine |
| DE102020201599A1 (de) | 2020-02-10 | 2021-08-12 | Robert Bosch Gesellschaft mit beschränkter Haftung | Verfahren und Einrichtung zum Bestimmen einer Performanceeigenschaft eines Produkts |
| US11216247B2 (en) | 2020-03-02 | 2022-01-04 | Oracle International Corporation | Automatic asset anomaly detection in a multi-sensor network |
| WO2021176460A1 (fr) * | 2020-03-03 | 2021-09-10 | Telefonaktiebolaget Lm Ericsson (Publ) | Heuristique de seuillage adaptatif pour détection d'anomalie |
| JP7443832B2 (ja) * | 2020-03-05 | 2024-03-06 | 株式会社デンソー | セキュリティ管理装置 |
| DE102020202869A1 (de) | 2020-03-06 | 2021-09-09 | Robert Bosch Gesellschaft mit beschränkter Haftung | Vorverarbeitungsverfahren zur Bereitstellung homogener Datenblöcke |
| JP7452171B2 (ja) * | 2020-03-26 | 2024-03-19 | トヨタ自動車株式会社 | 異音の発生箇所特定方法 |
| JP7395409B2 (ja) * | 2020-04-03 | 2023-12-11 | 日立造船株式会社 | 異常検出装置、水門システムおよび異常検出方法 |
| JP7466652B2 (ja) * | 2020-07-28 | 2024-04-12 | 川崎重工業株式会社 | 状態監視装置、状態異常判別方法及び状態異常判別プログラム |
| CN111859815B (zh) * | 2020-07-31 | 2023-05-23 | 中国汽车工程研究院股份有限公司 | 一种电池报警特征数据的模式聚类方法与事故特征识别技术 |
| EP4137901A4 (fr) * | 2020-08-21 | 2024-04-24 | Realtimetech Co., Ltd. | Système de surveillance de processus en temps réel à base d'apprentissage profond et procédé associé |
| JP7395443B2 (ja) * | 2020-08-25 | 2023-12-11 | 日立造船株式会社 | 異常検出装置、水門システムおよび異常検出方法 |
| CN112098850B (zh) * | 2020-09-21 | 2024-03-08 | 山东工商学院 | 基于sdo算法的锂离子电池电压故障诊断方法及系统 |
| US11762956B2 (en) | 2021-02-05 | 2023-09-19 | Oracle International Corporation | Adaptive pattern recognition for a sensor network |
| JP7811936B2 (ja) * | 2021-03-29 | 2026-02-06 | 川崎重工業株式会社 | ロボット故障予兆検出装置及びロボット故障予兆検出方法 |
| JP7641538B2 (ja) * | 2021-04-05 | 2025-03-07 | 千代田化工建設株式会社 | 異常検知装置、異常検知プログラム、及び学習装置 |
| US11649804B2 (en) | 2021-06-07 | 2023-05-16 | General Electric Renovables Espana, S.L. | Systems and methods for controlling a wind turbine |
| US12180936B2 (en) | 2021-07-28 | 2024-12-31 | General Electric Renovables Espana, S.L. | Systems and methods for operating a wind farm |
| CN114328075B (zh) * | 2021-09-09 | 2026-04-21 | 广东电网有限责任公司广州供电局 | 一种智能配电房传感器多维数据融合异常事件检测方法、系统及计算机可读存储介质 |
| JP7717549B2 (ja) * | 2021-09-15 | 2025-08-04 | 株式会社東芝 | 監視装置、方法およびプログラム |
| JP2024047171A (ja) * | 2022-09-26 | 2024-04-05 | 川崎重工業株式会社 | 要因分析装置及び要因分析方法 |
| CN115687976B (zh) * | 2022-10-31 | 2025-09-02 | 中南大学 | 一种故障诊断方法、系统及存储介质 |
| US20240282153A1 (en) * | 2023-02-21 | 2024-08-22 | Caterpillar Inc. | Systems and methods for detecting machines engaged in anomalous activity |
| CN116032668B (zh) * | 2023-03-29 | 2023-09-15 | 广东维信智联科技有限公司 | 一种计算机网络数据安全保密系统 |
| CN116798150A (zh) * | 2023-06-26 | 2023-09-22 | 深圳市每开创新科技有限公司 | 无源电子锁的硬件维护方法、装置及存储介质 |
| JP7731940B2 (ja) * | 2023-07-11 | 2025-09-01 | 株式会社Screenホールディングス | 吐出圧力監視装置、吐出圧力監視方法、コンピュータプログラム、および塗布装置 |
| CN118673447B (zh) * | 2024-08-22 | 2024-12-27 | 西安尔吉环保科技有限公司 | 一种基于水土保持监督检查大数据的水土流失评估方法 |
| CN119022856B (zh) * | 2024-10-25 | 2025-02-11 | 河南交院工程技术集团有限公司 | 一种二维位移传感器数据有效性检测方法及系统 |
| CN119831398A (zh) * | 2024-12-02 | 2025-04-15 | 广州继善建筑技术有限公司 | 一种基于多传感器融合的建筑质量检测方法 |
| DE102025106898B3 (de) | 2025-02-24 | 2026-04-23 | Sew-Eurodrive Gmbh & Co Kg | Verfahren und System zur Bewertung einer technischen Anlage |
Citations (20)
| Publication number | Priority date | Publication date | Assignee | Title |
|---|---|---|---|---|
| JPH0545186A (ja) | 1991-08-16 | 1993-02-23 | Mitsubishi Electric Corp | 事例に基づく設備故障診断装置 |
| JPH06295271A (ja) | 1993-04-07 | 1994-10-21 | Fuji Photo Film Co Ltd | 画像合成出力装置 |
| JPH07110708A (ja) | 1993-10-13 | 1995-04-25 | Hitachi Ltd | 故障診断装置および方法 |
| US5414798A (en) * | 1988-06-17 | 1995-05-09 | Hitachi, Ltd. | Knowledge information generating system |
| JPH07160327A (ja) | 1993-12-06 | 1995-06-23 | Komatsu Ltd | 計測値判定方法 |
| JPH10283024A (ja) | 1997-04-04 | 1998-10-23 | Kawasaki Heavy Ind Ltd | 各種プラントの監視・診断方法 |
| JP2000259223A (ja) | 1999-03-12 | 2000-09-22 | Toshiba Corp | プラント監視装置 |
| US6216066B1 (en) | 1998-07-01 | 2001-04-10 | General Electric Company | System and method for generating alerts through multi-variate data assessment |
| US20020035447A1 (en) | 2000-09-20 | 2002-03-21 | Kazue Takahashi | Remote diagnosing system for semiconductor manufacturing equipment and a remote diagnosing method |
| JP2002099323A (ja) | 2000-09-22 | 2002-04-05 | Hitachi Ltd | 半導体製造装置のリモート診断システム及びリモート診断方法 |
| JP2002139377A (ja) | 2000-10-30 | 2002-05-17 | Hitachi Eng Co Ltd | 機器異常診断装置 |
| US6952662B2 (en) | 2000-03-30 | 2005-10-04 | Smartsignal Corporation | Signal differentiation system using improved non-linear operator |
| US6975962B2 (en) | 2001-06-11 | 2005-12-13 | Smartsignal Corporation | Residual signal alert generation for condition monitoring using approximated SPRT distribution |
| JP2006053818A (ja) | 2004-08-13 | 2006-02-23 | Kagawa Univ | データ処理方法及びデータ処理装置、並びに診断方法及び診断装置 |
| JP2006106870A (ja) | 2004-09-30 | 2006-04-20 | Toshiba Corp | プロセス管理装置 |
| JP2006343063A (ja) | 2005-06-10 | 2006-12-21 | Daikin Ind Ltd | 設備機器の異常予知システム、設備機器の異常予知装置および設備機器の異常予知方法 |
| US20070291991A1 (en) | 2006-06-16 | 2007-12-20 | National Institute Of Advanced Industrial Science And Technology | Unusual action detector and abnormal action detecting method |
| US20080082475A1 (en) * | 2006-09-12 | 2008-04-03 | International Business Machines Corporation | System and method for resource adaptive classification of data streams |
| JP2008256981A (ja) | 2007-04-05 | 2008-10-23 | Fuji Xerox Co Ltd | 故障診断システム |
| JP2009070071A (ja) | 2007-09-12 | 2009-04-02 | Toshiba Corp | 学習型プロセス異常診断装置、およびオペレータ判断推測結果収集装置 |
-
2009
- 2009-09-07 JP JP2009206103A patent/JP5363927B2/ja not_active Expired - Fee Related
-
2010
- 2010-06-16 US US13/384,463 patent/US9483049B2/en not_active Expired - Fee Related
- 2010-06-16 EP EP10813558.3A patent/EP2477086A4/fr not_active Withdrawn
- 2010-06-16 WO PCT/JP2010/060232 patent/WO2011027607A1/fr not_active Ceased
Patent Citations (24)
| Publication number | Priority date | Publication date | Assignee | Title |
|---|---|---|---|---|
| US5414798A (en) * | 1988-06-17 | 1995-05-09 | Hitachi, Ltd. | Knowledge information generating system |
| JPH0545186A (ja) | 1991-08-16 | 1993-02-23 | Mitsubishi Electric Corp | 事例に基づく設備故障診断装置 |
| JPH06295271A (ja) | 1993-04-07 | 1994-10-21 | Fuji Photo Film Co Ltd | 画像合成出力装置 |
| US5548597A (en) * | 1993-10-13 | 1996-08-20 | Hitachi, Ltd. | Failure diagnosis apparatus and a method thereof |
| JPH07110708A (ja) | 1993-10-13 | 1995-04-25 | Hitachi Ltd | 故障診断装置および方法 |
| US5621158A (en) | 1993-12-06 | 1997-04-15 | Komatsu Ltd. | Measurement value judging method |
| JPH07160327A (ja) | 1993-12-06 | 1995-06-23 | Komatsu Ltd | 計測値判定方法 |
| JPH10283024A (ja) | 1997-04-04 | 1998-10-23 | Kawasaki Heavy Ind Ltd | 各種プラントの監視・診断方法 |
| US6216066B1 (en) | 1998-07-01 | 2001-04-10 | General Electric Company | System and method for generating alerts through multi-variate data assessment |
| JP2000259223A (ja) | 1999-03-12 | 2000-09-22 | Toshiba Corp | プラント監視装置 |
| US6952662B2 (en) | 2000-03-30 | 2005-10-04 | Smartsignal Corporation | Signal differentiation system using improved non-linear operator |
| US20020035447A1 (en) | 2000-09-20 | 2002-03-21 | Kazue Takahashi | Remote diagnosing system for semiconductor manufacturing equipment and a remote diagnosing method |
| JP2002099323A (ja) | 2000-09-22 | 2002-04-05 | Hitachi Ltd | 半導体製造装置のリモート診断システム及びリモート診断方法 |
| JP2002139377A (ja) | 2000-10-30 | 2002-05-17 | Hitachi Eng Co Ltd | 機器異常診断装置 |
| US6975962B2 (en) | 2001-06-11 | 2005-12-13 | Smartsignal Corporation | Residual signal alert generation for condition monitoring using approximated SPRT distribution |
| JP2006053818A (ja) | 2004-08-13 | 2006-02-23 | Kagawa Univ | データ処理方法及びデータ処理装置、並びに診断方法及び診断装置 |
| US20070244841A1 (en) | 2004-08-13 | 2007-10-18 | National University Corporation Kagawa University | Method and Apparatus for Data Processing, and Method and Apparatus for Diagnosis |
| JP2006106870A (ja) | 2004-09-30 | 2006-04-20 | Toshiba Corp | プロセス管理装置 |
| JP2006343063A (ja) | 2005-06-10 | 2006-12-21 | Daikin Ind Ltd | 設備機器の異常予知システム、設備機器の異常予知装置および設備機器の異常予知方法 |
| US20070291991A1 (en) | 2006-06-16 | 2007-12-20 | National Institute Of Advanced Industrial Science And Technology | Unusual action detector and abnormal action detecting method |
| JP2007334756A (ja) | 2006-06-16 | 2007-12-27 | National Institute Of Advanced Industrial & Technology | 異常動作検出装置および異常動作検出方法 |
| US20080082475A1 (en) * | 2006-09-12 | 2008-04-03 | International Business Machines Corporation | System and method for resource adaptive classification of data streams |
| JP2008256981A (ja) | 2007-04-05 | 2008-10-23 | Fuji Xerox Co Ltd | 故障診断システム |
| JP2009070071A (ja) | 2007-09-12 | 2009-04-02 | Toshiba Corp | 学習型プロセス異常診断装置、およびオペレータ判断推測結果収集装置 |
Non-Patent Citations (8)
| Title |
|---|
| C. Byington et al., "Data Fusion for Developing Predictive Diagnostics for Electromechanical Systems," Jan. 1, 2001, URL://dsp-book.narod.ru/HMDF/2379ch23.pdf, XP055101037 (thirty-two (32) pages). |
| Corresponding International Search Report with English Translation dated Jul. 20, 2010 (four (4) pages). |
| E. Oja et al., "The Subspace Learning Algorithm as a Formalism for Pattern Recognition and Neural Networks," Neural Networks, 1988, vol. 1 (Jul. 24. 1988), pp. 1-277-1-284, XP032131419. |
| Japanese Office Action with English Translation dated Feb. 12, 2013 (eight (8) pages). |
| Partial Supplementary European Search Report issued in counterpart European Application No. 10813558.3 dated Dec. 18, 2015 (eight (8) pages). |
| Stephan W. Wegerich et al., "Nonparametric Modeling of Vibration Signal Features for Equipment Health Monitoring", Aerospace Conference, 2003, vol. 7, pp. 3113-3121. |
| Takekazu Kato et al., One Class Classifier Based on Proximity Between Pattens, IS-2-10, MIRU 2007, pp. 762-767. |
| Yoshiteru Ishida, "Sensor Diagnosis of Process Plants by an Immune-Based Model", Systems Control and Information, vol. 38, No. 1, Jan. 15, 1994. (eleven (11) pages). |
Cited By (28)
| Publication number | Priority date | Publication date | Assignee | Title |
|---|---|---|---|---|
| US11023284B2 (en) * | 2015-10-28 | 2021-06-01 | Qomplx, Inc. | System and method for optimization and load balancing of computer clusters |
| US20180120472A1 (en) * | 2016-10-28 | 2018-05-03 | Korea Institute Of Geoscience And Mineral Resources | Apparatus and method for localizing underwater anomalous body |
| US10737904B2 (en) | 2017-08-07 | 2020-08-11 | Otis Elevator Company | Elevator condition monitoring using heterogeneous sources |
| US10311703B1 (en) | 2018-02-09 | 2019-06-04 | Computational Systems, Inc. | Detection of spikes and faults in vibration trend data |
| DE102019100722A1 (de) | 2018-02-09 | 2019-08-14 | Computational Systems Inc. | Erkennung von Spitzen und Fehlern in Schwingungstrendddaten |
| DE102019100722B4 (de) | 2018-02-09 | 2022-02-03 | Computational Systems Inc. | Erkennung von Spitzen und Fehlern in Schwingungstrendddaten |
| US11113395B2 (en) | 2018-05-24 | 2021-09-07 | General Electric Company | System and method for anomaly and cyber-threat detection in a wind turbine |
| US20210042585A1 (en) * | 2018-06-14 | 2021-02-11 | Mitsubishi Electric Corporation | Abnormality detection device, abnormality detection method and computer readable medium |
| US11657121B2 (en) * | 2018-06-14 | 2023-05-23 | Mitsubishi Electric Corporation | Abnormality detection device, abnormality detection method and computer readable medium |
| US11216743B2 (en) | 2018-08-14 | 2022-01-04 | International Business Machines Corporation | Learning sparsity-constrained gaussian graphical models in anomaly detection |
| US20220334574A1 (en) * | 2019-09-27 | 2022-10-20 | Tata Consultancy Services Limited | Method and system for diagnosing anomaly in a manufacturing plant |
| US11625032B2 (en) * | 2019-09-27 | 2023-04-11 | Tata Consultancy Services Limited | Method and system for diagnosing anomaly in a manufacturing plant |
| US12309039B2 (en) | 2019-10-23 | 2025-05-20 | Aryaka Networks, Inc. | Efficient detection and prediction of data pattern changes in a cloud-based application acceleration as a service environment |
| US12284087B2 (en) | 2019-10-23 | 2025-04-22 | Aryaka Networks, Inc. | Correlation score based commonness indication associated with a point anomaly pertinent to data pattern changes in a cloud-based application acceleration as a service environment |
| US12088473B2 (en) | 2019-10-23 | 2024-09-10 | Aryaka Networks, Inc. | Method, device and system for enhancing predictive classification of anomalous events in a cloud-based application acceleration as a service environment |
| US11455554B2 (en) | 2019-11-25 | 2022-09-27 | International Business Machines Corporation | Trustworthiness of artificial intelligence models in presence of anomalous data |
| US11740592B2 (en) | 2019-12-10 | 2023-08-29 | Canon Kabushiki Kaisha | Control method, control apparatus, mechanical equipment, and recording medium |
| US20220035334A1 (en) * | 2020-07-29 | 2022-02-03 | Abb Schweiz Ag | Technologies for producing training data for identifying degradation of physical components |
| US12073182B2 (en) | 2020-08-07 | 2024-08-27 | Amazon Technologies, Inc. | Machine learning-based selection of metrics for anomaly detection |
| US11748568B1 (en) | 2020-08-07 | 2023-09-05 | Amazon Technologies, Inc. | Machine learning-based selection of metrics for anomaly detection |
| WO2022039575A1 (fr) * | 2020-08-21 | 2022-02-24 | (주)리얼타임테크 | Système de surveillance de processus en temps réel à base d'apprentissage profond et procédé associé |
| US12265446B1 (en) | 2020-09-24 | 2025-04-01 | Amazon Technologies, Inc. | Multi-factor anomaly detection for application execution environments |
| US11943242B2 (en) | 2021-03-31 | 2024-03-26 | Honda Motor Co. Ltd. | Deep automation anomaly detection |
| US11790081B2 (en) | 2021-04-14 | 2023-10-17 | General Electric Company | Systems and methods for controlling an industrial asset in the presence of a cyber-attack |
| US12034741B2 (en) | 2021-04-21 | 2024-07-09 | Ge Infrastructure Technology Llc | System and method for cyberattack detection in a wind turbine control system |
| US12560150B2 (en) | 2021-10-07 | 2026-02-24 | GE Vernova Renovables Espana, S.L. | Systems and methods for controlling a wind turbine |
| US11630034B2 (en) * | 2021-12-29 | 2023-04-18 | Sichuan University | Method for diagnosing and predicting operation conditions of large-scale equipment based on feature fusion and conversion |
| US12510052B1 (en) | 2024-06-27 | 2025-12-30 | GE Vernova Renovables Espana, S.L. | System and method for optimizing control of a wind turbine |
Also Published As
| Publication number | Publication date |
|---|---|
| WO2011027607A1 (fr) | 2011-03-10 |
| US20120166142A1 (en) | 2012-06-28 |
| EP2477086A4 (fr) | 2016-05-04 |
| EP2477086A1 (fr) | 2012-07-18 |
| JP2011059790A (ja) | 2011-03-24 |
| JP5363927B2 (ja) | 2013-12-11 |
Similar Documents
| Publication | Publication Date | Title |
|---|---|---|
| US9483049B2 (en) | Anomaly detection and diagnosis/prognosis method, anomaly detection and diagnosis/prognosis system, and anomaly detection and diagnosis/prognosis program | |
| JP5538597B2 (ja) | 異常検知方法及び異常検知システム | |
| JP5501903B2 (ja) | 異常検知方法及びそのシステム | |
| JP5301310B2 (ja) | 異常検知方法及び異常検知システム | |
| JP5808605B2 (ja) | 異常検知・診断方法、および異常検知・診断システム | |
| KR101316486B1 (ko) | 이상 검지 방법 및 시스템 | |
| JP2011145846A (ja) | 異常検知方法、異常検知システム、及び異常検知プログラム | |
| JP5439265B2 (ja) | 異常検知・診断方法、異常検知・診断システム、及び異常検知・診断プログラム | |
| JP5431235B2 (ja) | 設備状態監視方法およびその装置 | |
| JP5530020B1 (ja) | 異常診断システム及び異常診断方法 | |
| JP5778305B2 (ja) | 異常検知方法及びそのシステム | |
| JP5498540B2 (ja) | 異常検知方法及びシステム | |
| JP2012137934A (ja) | 異常検知・診断方法、異常検知・診断システム、及び異常検知・診断プログラム並びに企業資産管理・設備資産管理システム | |
| JP2015088154A (ja) | ヘルスマネージメントシステム及びヘルスマネージメント方法 | |
| JP2014056598A (ja) | 異常検知方法及びそのシステム | |
| CN117932322A (zh) | 一种面粉设备故障诊断方法及系统 | |
| Mishra et al. | Hybrid models for rotating machinery diagnosis and prognosis: estimation of remaining useful life | |
| CN121456548A (zh) | 基于动态耦合梯度分析的航空装备故障诊断方法及系统 |
Legal Events
| Date | Code | Title | Description |
|---|---|---|---|
| AS | Assignment |
Owner name: HITACHI, LTD., JAPAN Free format text: ASSIGNMENT OF ASSIGNORS INTEREST;ASSIGNORS:MAEDA, SHUNJI;SHIBUYA, HISAE;SIGNING DATES FROM 20111222 TO 20111227;REEL/FRAME:028189/0284 |
|
| STCF | Information on status: patent grant |
Free format text: PATENTED CASE |
|
| MAFP | Maintenance fee payment |
Free format text: PAYMENT OF MAINTENANCE FEE, 4TH YEAR, LARGE ENTITY (ORIGINAL EVENT CODE: M1551); ENTITY STATUS OF PATENT OWNER: LARGE ENTITY Year of fee payment: 4 |
|
| FEPP | Fee payment procedure |
Free format text: MAINTENANCE FEE REMINDER MAILED (ORIGINAL EVENT CODE: REM.); ENTITY STATUS OF PATENT OWNER: LARGE ENTITY |
|
| LAPS | Lapse for failure to pay maintenance fees |
Free format text: PATENT EXPIRED FOR FAILURE TO PAY MAINTENANCE FEES (ORIGINAL EVENT CODE: EXP.); ENTITY STATUS OF PATENT OWNER: LARGE ENTITY |
|
| STCH | Information on status: patent discontinuation |
Free format text: PATENT EXPIRED DUE TO NONPAYMENT OF MAINTENANCE FEES UNDER 37 CFR 1.362 |
|
| FP | Lapsed due to failure to pay maintenance fee |
Effective date: 20241101 |