EP0412692A1 - Analyse graphique et dynamique de données de réseau - Google Patents
Analyse graphique et dynamique de données de réseau Download PDFInfo
- Publication number
- EP0412692A1 EP0412692A1 EP90308264A EP90308264A EP0412692A1 EP 0412692 A1 EP0412692 A1 EP 0412692A1 EP 90308264 A EP90308264 A EP 90308264A EP 90308264 A EP90308264 A EP 90308264A EP 0412692 A1 EP0412692 A1 EP 0412692A1
- Authority
- EP
- European Patent Office
- Prior art keywords
- nodes
- user
- node
- display
- displaying
- Prior art date
- Legal status (The legal status is an assumption and is not a legal conclusion. Google has not performed a legal analysis and makes no representation as to the accuracy of the status listed.)
- Granted
Links
- 238000013507 mapping Methods 0.000 claims abstract 2
- 238000000034 method Methods 0.000 claims description 6
- 230000008859 change Effects 0.000 abstract description 2
- 230000009471 action Effects 0.000 description 6
- 239000003086 colorant Substances 0.000 description 6
- 238000013523 data management Methods 0.000 description 6
- 238000012360 testing method Methods 0.000 description 5
- 238000012545 processing Methods 0.000 description 4
- 238000011179 visual inspection Methods 0.000 description 4
- 239000010432 diamond Substances 0.000 description 3
- 230000006870 function Effects 0.000 description 3
- 230000008569 process Effects 0.000 description 3
- 238000004904 shortening Methods 0.000 description 3
- 230000001680 brushing effect Effects 0.000 description 2
- 238000004891 communication Methods 0.000 description 2
- 230000001934 delay Effects 0.000 description 2
- 230000000881 depressing effect Effects 0.000 description 2
- 229910003460 diamond Inorganic materials 0.000 description 2
- 206010065042 Immune reconstitution inflammatory syndrome Diseases 0.000 description 1
- XUIMIQQOPSSXEZ-UHFFFAOYSA-N Silicon Chemical compound [Si] XUIMIQQOPSSXEZ-UHFFFAOYSA-N 0.000 description 1
- 239000000872 buffer Substances 0.000 description 1
- 238000010586 diagram Methods 0.000 description 1
- 230000010006 flight Effects 0.000 description 1
- 230000007774 longterm Effects 0.000 description 1
- 238000007726 management method Methods 0.000 description 1
- 230000007246 mechanism Effects 0.000 description 1
- 230000005012 migration Effects 0.000 description 1
- 238000013508 migration Methods 0.000 description 1
- 229910052710 silicon Inorganic materials 0.000 description 1
- 239000010703 silicon Substances 0.000 description 1
Images











Classifications
-
- H—ELECTRICITY
- H04—ELECTRIC COMMUNICATION TECHNIQUE
- H04L—TRANSMISSION OF DIGITAL INFORMATION, e.g. TELEGRAPHIC COMMUNICATION
- H04L41/00—Arrangements for maintenance, administration or management of data switching networks, e.g. of packet switching networks
- H04L41/22—Arrangements for maintenance, administration or management of data switching networks, e.g. of packet switching networks comprising specially adapted graphical user interfaces [GUI]
-
- H—ELECTRICITY
- H04—ELECTRIC COMMUNICATION TECHNIQUE
- H04L—TRANSMISSION OF DIGITAL INFORMATION, e.g. TELEGRAPHIC COMMUNICATION
- H04L41/00—Arrangements for maintenance, administration or management of data switching networks, e.g. of packet switching networks
- H04L41/12—Discovery or management of network topologies
-
- H—ELECTRICITY
- H04—ELECTRIC COMMUNICATION TECHNIQUE
- H04M—TELEPHONIC COMMUNICATION
- H04M3/00—Automatic or semi-automatic exchanges
- H04M3/22—Arrangements for supervision, monitoring or testing
- H04M3/36—Statistical metering, e.g. recording occasions when traffic exceeds capacity of trunks
-
- H—ELECTRICITY
- H04—ELECTRIC COMMUNICATION TECHNIQUE
- H04Q—SELECTING
- H04Q3/00—Selecting arrangements
- H04Q3/0016—Arrangements providing connection between exchanges
- H04Q3/002—Details
-
- H—ELECTRICITY
- H04—ELECTRIC COMMUNICATION TECHNIQUE
- H04Q—SELECTING
- H04Q3/00—Selecting arrangements
- H04Q3/0016—Arrangements providing connection between exchanges
- H04Q3/0062—Provisions for network management
-
- H—ELECTRICITY
- H04—ELECTRIC COMMUNICATION TECHNIQUE
- H04Q—SELECTING
- H04Q2213/00—Indexing scheme relating to selecting arrangements in general and for multiplex systems
- H04Q2213/13525—GUI - graphical user interface, inc. for service creation
-
- Y—GENERAL TAGGING OF NEW TECHNOLOGICAL DEVELOPMENTS; GENERAL TAGGING OF CROSS-SECTIONAL TECHNOLOGIES SPANNING OVER SEVERAL SECTIONS OF THE IPC; TECHNICAL SUBJECTS COVERED BY FORMER USPC CROSS-REFERENCE ART COLLECTIONS [XRACs] AND DIGESTS
- Y10—TECHNICAL SUBJECTS COVERED BY FORMER USPC
- Y10S—TECHNICAL SUBJECTS COVERED BY FORMER USPC CROSS-REFERENCE ART COLLECTIONS [XRACs] AND DIGESTS
- Y10S715/00—Data processing: presentation processing of document, operator interface processing, and screen saver display processing
- Y10S715/974—Slider control as on-screen object in operator interface
Definitions
- the invention relates to dynamic graphic arrangements and more particularly relates to an arrangement which displays directed data between pairs of nodes in a network map.
- a displayed map is often employed to depict a plurality of nodes interconnected via respective links representing a particular relationship between respective pairs of the nodes.
- the nodes may represent switches in a telephone network with the links representing the level and direction of the data between respective pairs of the switches. (In certain network systems, data is often referred to as "traffic".)
- the nodes may represent financial entities (e.g., banks) with the links representing the level and direction of the flow of money from one financial entity to another.
- Displayed maps are thus useful in depicting and analyzing the level and direction of the flow of traffic among a plurality of nodes.
- Such maps lose their usefulness when the number of displayed links is large, as would be the case in large networks.
- the displayed links become extremely dense, or cluttered, thereby making it virtually impossible to ascertain underlying patterns in the traffic. Accordingly, the informative value of a map displaying an appreciable number of nodes and links is limited as a result of such clutter.
- the limitation inherent in a map displaying a large network comprising an appreciable number of nodes and links is obviated by displaying, in accordance with the invention, a number of tools which the user may operate to control the parameters that are used in displaying such links.
- the user may dynamically reduce in real time such displayed clutter by controlling the length of the displayed links interconnecting the network nodes.
- the length of a link may be controlled by displaying the link as two half-line segments and reducing each half-line segment by a selected ratio.
- the user may further reduce clutter by dynamically erasing from the display those links whose level of data flow falls outside of a selected range of link statistics. Accordingly, the user may rapidly adjust the length of displayed links and range of link statistics until the map reveals useful underlying patterns in the links that remain on the display.
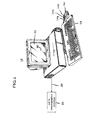
- Computer 10 depicted in FIG. 1 operates under a predetermined operating system--illustratively the UNIX operating system.
- Computer 10 which may be, for example, the IRIS workstation available from Silicon Graphics, Inc. of Mountain View, California, includes a screen 11, keyboard 13 and mouse 14 as well as other internal components not explicity shown in the FIG., such as a hard disk drive.
- the keyboard and mouse more particularly, provide a mechanism for the user to input information and instructions to the computer.
- the user may invoke a particular task identified on the screen by operating mouse 14 in a conventional manner to cause screen cursor 40 to point at that task.
- the user may then invoke the task by operating a respective one of the mouse keys, or buttons, 14a through 14c, as will be discussed below.
- Central data management system is of the type which, from time to time, polls a plurality of network nodes, one by one, to collect specific data relating to their operation.
- network nodes could be, for example, airline terminals, in which the collected data could relate to passenger counts, average delays, etc.; banks, in which the collected data could relate to financial transactions; telephone switching centers, in which the collected data could relate to telephone calls; and so on.
- Such data could also be long term data relating to, for example, population and migration patterns.
- computer 10 may obtain from computer 30 via line 20 a copy of the collected data for display on screen 11.
- the AT&T network comprises a plurality of network nodes, or switching centers.
- Each such switching center is arranged to accumulate statistics associated with the telephone calls that it processes.
- the statistics include, for example, (a) the number of calls that are blocked, or overflowed ("toc"); and (b) the average holding times of telephone calls ("hold”).
- the switching centers accumulate the statistics on a five minute interval basis, and then supply the statistics to central data management system 30, thereby making a copy of the statistics available to computer 10 for display on screen 11, as will now be discussed.
- the data that computer 10 collects from data management system 30 is identified by the day of the year that the switching centers accumulated the data, and is stored in similarly named directories contained in the memory of computer 10.
- computer 10 After computer 10 is turned on and has performed some initial tasks, including the "booting" of the operating system from the computer 10 hard disk unit, computer 10 displays the well-known Unix system prompt.
- a command to access a particular data directory that is, the user enters "cd" followed by the corresponding date.
- the user enters via keyboard 13 the following command: cd November 18
- the user enters via keyboard 13 the letter "S" to initiate processing of the well-known S language software.
- S language is used for internal database management.
- the S language is disclosed in the text titled The New S Language, authored by R. A. Becker, J. M. Chambers and A. R. Wilks, and published by Wadsworth & Brooks/Cole, Pacific Grove, California (1988).
- the user desires a map displaying the data relating to the number of calls blocked (toc) for a particular hour, for example, the 13th hour, of the selected day. It is to be understood, of course, that the following discussion pertains equally well to the other categories of statistics, as will be shown below. Accordingly, to select data, or statistics, relating to the number of calls that were blocked for the 13th hour of the selected date, the user next enters via keyboard 13 the following command:
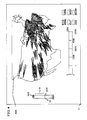
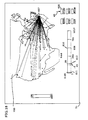
- Computer 10 responsive to the latter command unloads from its memory the pertinent data and displays the data in the form of a map, as shown in FIG. 2.
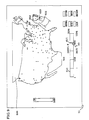
- computer 10 In displaying map 600 on screen 11, computer 10 displays an outline of the U. S. (as well as portions of Canada and Mexico) and then displays within that outline the various network nodes positioned at their respective locations within the U.S., in which each node is represented by a symbol having a somewhat diamond shape. Computer 10 also displays on screen 11 lines representing the links, or communication paths, interconnecting respective pairs of the nodes experiencing overflow.
- the line between a pair of nodes is actually formed from a number of segments--illustratively two half-line segments--in which each segment is displayed a particular color to represent the number, or level, of the calls that are sent by one node to the other mode of a respective pair of nodes and which are blocked at the other node. That is, the colored half-line segments represent the direction and level of data relating to blocked calls accumulated by respective ones of the network nodes during the 13th hour of the selected data, as will be pointed out below.
- Computer 10, in accord with the invention also displays on screen 11 a number of tools which the user may operate to control the parameters which computer 10 employs to map the desired data on screen 11.
- the user may operate slider bar 606 of tool 605 (hereinafter size tool 605) to adjust the length of each half-line segment. That is, the user may shorten each of the displayed half-line segments by pointing mouse cursor 40 to the slider bar 606, depressing button 14a, and sliding the cursor downward in the conventional manner from LONG to SHORT.
- Computer 10, responsive thereto shortens each of the half-line segments commensurate with the position of slider bar 606 on size tool 605.
- points to and the variants of that term will be taken to mean the action of moving mouse screen cursor 40 to an object or symbol displayed on screen 11, and is meant to include other terms that are understood by the art and which define similar functions. For example, it includes moving a screen cursor to the location if displayed text or to an entry in a menu of displayed entries (items) and operating, for example, an enter key; "touching" a touch sensitive panel overlaying screen 11; or even identifying particular displayed text or a menu of entries using terminal buttons, for example, computer keyboard buttons.)
- the user may also establish a data threshold by operating slider bar tool 610 (hereinafter threshold tool 610). That is, the user may erase from screen 11 those line segments representing data values which are below a desired threshold, or which are not within a range of thresholds set by the user operating tool 610. It is seen from the FIG. 2 that tool 610 ranges from--illustratively 0--to-- illustratively 53348--, meaning that all half-line segments, or links, representing data values between 0 and 53348 (the minimum and maximum data values) are displayed on screen 11, as based on the values of the lower and upper thresholds of tool 610.
- the user may establish an upper threshold by pointing to slider bar 612 and moving it to the left using mouse cursor 40 in the conventional manner.
- computer 10 displays on screen 11 the value of the upper threshold, as will be shown below.
- each half-line segment is displayed in a particular color to represent its respective data value.
- a half-line segment is displayed as one of--illustratively five- colors matching the color legend 651 through 655 making up threshold tool 610.
- the five colors 651 through 655 of the legend are--illustratively gray, cyan, green, yellow and red.
- the "Normal” tool 615 is used to display those half-line segments whose associated data values correspond with the current threshold (or range of thresholds) established using tool 610.
- the "Extend” tool 620 is used in the instance where one of two half-line segments making up a link has been erased from the screen as a result of the user operating threshold tool 610 and the user desires to ascertain which one of the nodes that the remaining half-line segment extends to. The user solves this problem by pointing to Extend tool 620, as will be shown below.
- computer 10 deactivates all of the displayed nodes and erases from screen 11 their associated half-line segments, as will be shown below.
- the user may thereafter reactive the hodes by pointing to "Reset” tool 625.
- the user may magnify a particular area of the displayed map by pointing to "Zoom” tool 635. Specifically, the user may magnify an area of the map by (a) pointing to Zoom tool 635 and operating mouse button 14a; (b) then pointing to one corner of the area to be magnified, for example, the upper left-hand corner and depressing button 14a; (c) then moving the mouse cursor diagonally to the opposite corner (for example, the lower right-hand corner) and releasing button 14a. Thereafter, the user may restore the magnified area to its original displayed size by pointing to "Unzoom" tool 640 and operating button 14a.
- the user is also provided with several other tools not explicitly shown in the FIG.
- the user may deactivate one or more nodes and their associated links by operating mouse button 14b while pointing to the nodes, one at a time.
- the deactivated nodes are displayed in a particular color, for example, cyan. Thereafter, the user may reactive a deactivated node by point to its cyan colored symbol and operating mouse button 14a.
- the user may reactivate all nodes having an inactive status by operating tool 625, as will be shown below.
- Another tool not explicity shown in the FIG. allows the user to display the identity of a node.
- the user does this by marking the node as being a so-called current node, that is, by moving mouse cursor 40 to a point which is within the vicinity of a node.
- computer 10 displays on screen 11 the identify of the current node.
- Computer 10 continues to display such identity as long as mouse cursor 40 remains positioned within the vicinity of the current node.
- a node is made the anchor node by positioning mouse cursor 40 within the vicinity of the node that is to be so marked and operating mouse button 14c.
- Computer 10 responsive to that action displays the identity of the anchor node as well as the level of data exchanged between the anchor and current nodes.
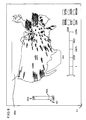
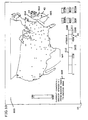
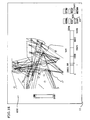
- the user may employ size tool 605 in the manner discussed above to adjust the length of each half-line segment by a selected ratio as a means of reducing some of the clutter resulting from the displaying of a large number of links, as shown in FIG. 3. It seen from the FIG. that the user has moved slider bar 606 downward some distance "a" through the range of values presented by tool 605, thereby causing the length of the half-line segments to be reduced by a commensurate amount. It can also seen from the FIG. that as a result of shortening the length of the half-line segments, or links, the clutter presented thereby has been reduced somewhat, but not markedly. At this point, the user may further advance slider bar 606 downward, thereby further shortening the length of the half-line segments, or links, as shown in FIG. 4.
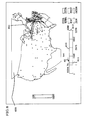
- the user may further shorten the half-line segments, as shown in FIG. 5.
- a visual inspection of the FIG. virtually confirms the user's suspicion that a problem exists in the Northeast. (It is seen from FIG. 5, that as a display expedient, a portion of the Northeast, namely New Jersey, southern New York and eastern Pennsylvania are shown detached from the U. S. mainland.) It is noted that if the user continues to operate tool 605 so as to position slider bar 606 at the bottom of the scale, then the half-line segments will be
- the user may then go on to employ one or more of the other aforementioned tools to further reduce the clutter in the Northeast region of the map to reveal which of the nodes in that region is experiencing the highest level of congestion.
- the one tool which proves to be the most effective in reducing clutter in a displayed map is threshold tool 610. Therefore, the user operating that tool in the manner discussed above may cause the tool to rapidly traverse the full range of thresholds to obtain a quick overview of which of the nodes, or node, is experiencing the various levels of overflow.
- the user may quickly traverse through the range of thresholds of tool 610 by continuously operating mouse button 14a and pointing to slider bar 611 and "dragging" it to the right using cursor 40 in the conventional manner.
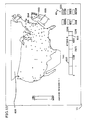
- computer 10 dynamically updates the map display in real time to show only those half-line segments whose respective data values meet the current threshold values that are being displayed on screen 11, as shown in FIG. 7.
- slider bar 606 of tool 605 has been returned to its original position, thereby restoring the full length of each displayed half-line segments.
- the user has moved slider bar 611 to the right to a point establishing a lower threshold value of 254.365.
- computer 10 has erased from screen 11 those half-line segments whose data values are below the current value of the lower threshold, thereby eliminating a considerable amount of the displayed clutter and thereby revealing the node pairs experiencing the highest level of blocked calls.
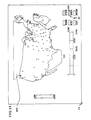
- the user may further reduce the remnants of the clutter by further moving slider bar 611 to the right over the range of thresholds, as shown in FIG. 8. It is seen from FIG. 8 that the remnants of the clutter are further reduced and that at least one of the displayed links, such as link 650 and the links collectively designated 651, respectively, are half links, meaning that the data values of the half-line segments associated with segments 650 and 651 are below the lower threshold of 3204.78.
- map 600 is still not at a point where it reveals which pair of nodes is experiencing the highest level of overflow. Accordingly, the user may further raise the lower boundary of threshold tool 610, and reveal those nodes, as shown in FIG. 9.
- a link such as link 653, is formed from two half-line segments.
- One half-line segment starting from node 654 is indicative of the fact that at least 38,961.8 of the calls that node 654 sent to node 655 during the selected hour were blocked at node 655.
- the other half-line segment starting from node 655 is indicative of the fact that at least 38,961.8 of the calls that node 655 sent to node 654 during the selected hour were blocked at node 654.
- threshold tool 610 the user has reduced the clutter in map 600 to a single link, thereby identifying the possible link experiencing the highest level of blocked calls.
- the user may further raise the boundary of the lower threshold by moving slider bar 611 to the right, in the manner discussed above.
- the lower threshold is raised to a point where one of the two-half line segments forming link 653 is erased from screen 11, as shown in FIG. 10. It is seen from the FIG. that the user has set the lower threshold to a value of 47389.6, thereby indicating that at least 47,389.6 of the calls sent from node 654 to node 655 were blocked during the selected hour.
- node 654 As a result thereof, computer 10 now displays node 655 in the color magenta and displays the current node, node 654, in the color yellow. Computer 10 also displays the identity and statistics associated with those nodes. It is seen from the FIG. that node 654, marked the anchor node, is located in Newark, New Jersey, and node 655, marked the current node, is located in Camden, New Jersey.
- An important aspect of the invention is that the numerical statistics to and from the anchor node are displayed on screen 11, thereby providing the user with a graphical method to access the statistics. Accordingly, the screen now shows at 699 that there were 53,348 blocked calls from Newark to Camden and 46,595 from Camden to Newark.
- the user may extend link 653 to node 655, in the manner discussed above, even though the half-line segment that was erased from the screen has a data value below the current value of the lower threshold, as shown in FIG. 11. It is seen from FIG. 11, that computer 10 has extended link 653 as directed by the user and now displays "Extend" tool 620 in the color red.
- FIG. 12 illustrates map 600 as it was originally brought up on screen 11 with the exception that the user has deactivated the links associated with the nodes collectively designated 657. It is noted that the nodes which have been deactivated are displayed in the color cyan to indicate their inactive status. To reactivate a deactivated node, the user points to the deactivated node and operates mouse button 14a. The user may globally reactive all such nodes and their associated links by operating Reset tool 625, as mentioned above.
- the user may employ the "brush" to activate a node.
- the user may invert map 600 after it is first brought up on the screen.
- computer 10 places all of the displayed nodes in an inactive (deactivated) status, as shown in FIG. 13.
- the user may then reactivate a node by "brushing.”
- the user reactivates a node by pointing to the node while operating mouse button 14a.
- An illustrative example of reactivating one or more nodes is shown in FIG. 14 in connection with node 658.
- the user may magnify a particular area of a displayed map using "Zoom" tool 635 in the manner discussed above.
- An illustrative example of magnifying a particular area of map 600 is shown in FIG. 15. Thereafter, the user may restore map 600 to its original state by pointing to "Unzoom" tool 645 and operating mouse button 14a.
- each of the links illustrated in map 700 is indicative of the average holding time (seconds) of telephone calls exchanged between a respective pair of nodes. Further, each link is formed from two-half line segments to illustrate the direction of the associated statistic. It can be appreciated from a visual inspection of the FIG. that the density of the links is quite high. This is due to the fact that the AT&T network is large and, therefore, is constantly processing telephone calls.
- computer 10 extends the half-line segments to the appropriate node, even though the data values associated with the extended segments fall outside of the range of thresholds established by the user, as shown in FIG. 18. It is seen from FIG. 18 that computer 10 has extended the half-line segments to node 657. As such, the user may possibly suspect that as a result of a problem associated with nodes 654 and 655, the network is experiencing a large number of short holding times into node 657.
- our invention may be used with virtually any type of statistic that involves links in a network.
- our invention is appropriate for analyzing airline data, such as, for example, data associated with the number of passengers or average delays of airline flights.
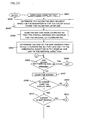
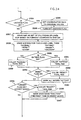
- the program uses a plurality of storage elements, one for each node, to record the status of each node, and mark each one of the nodes "active".
- the program then proceeds to block 2002 where it uses the value of the statistic to calculate and record in another plurality of storage elements the color that each half- line segment will be displayed on screen 11. It is noted that the displayed color of each segment is determined by the values of breakpoints (shown in FIG. 2), and the value of the statistic.
- the display may be achieved with various maps and locations of the nodes, in which a map is drawn by a series of straight line segments displayed on screen 11, and in which each segment is determined by the x (horizontal) and y (vertical) coordinates of its end points.
- the program determines the overall minimum and maximum values of the aforementioned coordinates to set the boundary for map 600.
- the program then proceeds to block 2004 where it ensures that the map, when drawn on the screen, has the appropriate aspect ratio. (The map coordinates are assumed to be commensurate with each other, meaning that one unit in the x direction should occupy the same length on the display as one unit in the y direction.)
- the program begins the main loop of the program. Specifically, if the program finds that buttons 14a and 14b are both operated, then the program exits at block 2006. Otherwise, the program proceeds to block 2007, where it clears the display screen.
- the display is "double buffered", meaning that two copies of the screen image are maintained. A so-called “front” copy is displayed on the screen while a second, or “back”, copy is “manipulated” in memory.
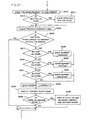
- the computer interchanges the front and back copies, making the former back copy visible (block 2097) and making it appear to the user as an instantaneous change in the display.
- the program determines whether cursor 40 is pointing at a region of screen 11 that is displaying the map or tools and proceeds to block 2010 if it finds that to be the case. Otherwise, it proceeds to block 2050 via block 2009 to avoid performing the more specific tests of determining the position of cursor 40.
- the program determines whether cursor 40 is in the rectangular region that is displaying the map and proceeds to block 2012 if it finds that to be the case. Otherwise, the program proceeds to block 2027 via block 2011, thereby avoiding all tests concerned with determining the proximity of the cursor to nodes on the map.
- the program compares the distance from cursor 40 to all nodes on the map to determine which of the nodes is nearest to cursor 40. The program then proceeds to block 2013.
- Blocks 2013 and 2014 represent a routine in which the program eliminates any previous anchor node if button 14c is found to be operated. At block 2015, the program eliminates the previous current node.
- the program finds that the distance from cursor 40 to the nearest node is greater than some predetermined tolerance (for example, 0.5 inches), then the program proceeds from 2016 to block 2027. Otherwise, the program executes blocks 2017 through 2022, in which the state of each of the buttons 14a, 14b, and 14c is interrogated to determine if the nearest node should be marked as the anchor or current node, or is to be made active or inactive.
- some predetermined tolerance for example, 0.5 inches
- the program marks the nearest node as being the current node and displays the identity of that node in the manner shown above.
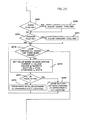
- the program determines if there is an anchor node (which would have been set in some prior execution of step 2018). The program proceeds to block 2026 if it finds that to be the case and displays the current values of the two directional statistics between the current and anchor nodes.
- the program determines if there is an anchor node and, if so, displays the identity of that node, as shown above.
- the program determines if button 14a is operated. If it is, then the user may be trying to manipulate one of the tools. Accordingly, the program proceeds to execute blocks 2032 through 2049 to determine what function it should perform. Otherwise, the program proceeds to block 2030 where it checks to see if cursor 40 has been moved out of the displayed rectangular map region. If the program finds the latter to be the case, then it proceeds to block 2031 where it eliminates any previous current node.
- the program tests to see if cursor 40 is pointing at tool 605, and if so, proceeds to block 2033 to set a variable flag to indicate the fraction of the way that the cursor is vertically positioned up slider 606 (from 0, if the cursor is at the bottom, to 1, if the cursor is at the top).
- Blocks 2034 through 2045 represent a routine which checks the position of cursor 40 to see if it is pointing at one of the tools 615, 620, 625, 630, 635, or 640. If the program finds that cursor 40 is pointing to one of these tools, then the program sets a respective flag indicative of that fact. The program thereafter tests the states of the flags to control the drawing of map 600 on screen 11.
- Blocks 2046 through 2049 represent a routine which deals with tool 610. That is, if the program finds that cursor 40 is pointing at slider tool 610, then, at block 2047, it determines if cursor 40 is closer to the lower threshold 611 or upper threshold 612 and adjusts the appropriate threshold at blocks 2048 and 2049. The program sets the threshold using linear interpolation between the breakpoints.
- the program tests the state of the "zoom" flag that may have been set at block 2043. If the program finds that the flag was set, then the user must (a) position cursor 40 at some point on the map display, (b) depress button 14a, (c) move to another position on map 600, and (d) release button 14a.
- the program uses the two positions to determine the location of each of the two opposite corners of a rectangle that that will be magnified to fill the region of screen that is occupied by map 600. Once again, the program ensures that the distance occupied by one unit in the x direction is identical to that occupied by one unit in the y direction.
- the program sets the lower and upper coordinate limits for the map region so that only the selected portion of the map is displayed. (It is noted that on many computer systems, the system graphics software or hardware will automatically clip (suppress) any graphics that are displayed outside of this specified set of limits).
- the program turns off the "zoom" flag.
- the program determines if the "unzoom” flag is set. (The program sets the "unzoom” flag at block 2045). If the program finds the "unzoom” flag set, then, at blocks 2055 and 2056, the program resets the coordinate limits of the map to their original values as determined at block 2003 and then resets the "unzoom” flag.
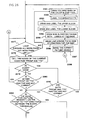
- the program draws the map by drawing a series of connnected line segments or filled polygons clipping any lines or polygons outside of the coordinate limits, and then proceeds to block 2058 where it draws and labels the boxes for the 6 tools 615-640.
- the program tests the state of the "extend” flag (which may have been set at either block 2035 or 2037).
- the program at blocks 2060 or 2061 colors the appropriate tool 615 or 620 red based on the state of the "extend” flag.
- the program then proceeds to block 2062 where it checks to see if the "reset” flag is set (the "reset” flag may have been set at block 2039). If the program finds that the "reset” flag is set, then it proceeds to block 2063 where it colors tool 625 red. The program then proceeds to block 2064 to mark all nodes active, as was done at block 2001.
- the program at block 2065 tests to see if the "turnoff" flag is set (as would be the case at block 2041). If the program finds that flag set, then it proceeds to block 2066 where it colors tool 630 red. The program then proceeds to block 2067 where it scans through all nodes and marks each node inactive. (The program performs this latter action only for the first time that the "turnoff" flag is set and will only perform the action once again if the "turnoff" flag is reset).
- Blocks 2068 through 2071 represent a routine which tests the "zoom” and “unzoom” flags and which colors in boxes 635 and 640 if appropriate.
- the program at block 2072 starts a loop through all displayed nodes. When all of the displayed nodes have been processed, the program proceeds to block 2077.
- the program sets the color based upon the status of the node being processed.
- the program tests the node status and if it is found to be active, then, at block 2076, the program displays the node as an appropriately colored diamond outline; otherwise the program displays the node as a filled diamond at block 2075.
- the program at block 2077 begins a loop through all node pairs mentioned above, each node pair corresponds to two half-line segments drawn on screen 11. Blocks 2078 through 2089 of the loop determine whether the half-line segments should be actually displayed. Thereafter, the program proceeds to block 2091 when it has processed all node pairs.
- the program at block 2078 names the two nodes of the node pair that the program is processing as the "from" node and the "to" node, respectively.
- the program at blocks 2079 through 2081 suppresses the half-line segments associated with all inactive nodes.
- the program at block 2079 determines if the "turnoff" flag is set (invert mode), and if so, does not display the half-line segments if it finds that both the "from” and "to" nodes are inactive and neither node is current (as tested at block 2081). (This action is shown by returning control of the program to block 2077.)
- the program finds that the "turnoff" flag is not set then neither half-line segment is displayed if either of the "from” or "to” node is inactive and not current (as tested at block 2080). In the latter case, control of the program is returned to block 2077.
- Blocks 2082 through 2089 represent a routine which displays the half-line segments that are brought up on screen 11.
- segment 1 the half-line segment representing the flow of data from the "from" node to the "to” node is identified as segment 1.
- segment 2 The associated half-line segment, which represents the opposite flow of data is identified as segment 2.
- the program tests the statistic associated with segment 1 to see if has a value that lies between the lower and upper thresholds established by tool 610. If so, the program proceeds to block 2084 to display segment 1. If not, then segment 1 may still be displayed if the data value for segment 2 lies between the thresholds and the extend flag is on. This is action is determined at block 2083.
- the program sets the color for displaying segment 1 based on the determination made at block 2002.
- segment 1 is displayed from the "from” node a fraction f/2 of the way to the "to” node (where fraction “f” is set at block 2033). Since "f" may vary between 0 and 1, the line may be displayed at most to the midpoint between the "from” and "to” nodes.
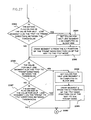
- the program at blocks 2086 through 2089 conditionally displays segment 2 as was similarly done for segment 1 at blocks 2082 through 2085. However, in doing so, the program interchanges the roles of segments 1 and 2. The program then proceeds to block 2090 after completing the foregoing task.
- the program returns to block 2077 to process the next node pair.
- the program then proceeds to block 2091 when it has completed processing the node pairs.
- the program at blocks 2091 through 2094 displays tool 610 on screen 11.
- the program displays the colored segments 651 through 655, and at block 2092 labels, underneath the tool, the positions that delimit the ends of the colored bars with the appropriate values of the displayed statistic.
- the program then proceeds to block 2093 where it displays upper slider 612 and labels it with the value of the upper threshold.
- the program then proceeds to block 2094 to display lower slider 611 and label that slider with the value of the lower threshold, as shown in the above FIGs.
- the program displays the outline of size slider tool 605 and labels the endpoints thereof in the manner shown above.
- the program displays the horizontal slider line 606 across tool 605 a fraction "f" of the way from bottom to top.
- the program then proceeds to block 2097 where it makes the current "picture” visible by interchanging the front and back buffers, as discussed above.
- the program then proceeds to block 2098 where it returns to block 2005, thereby completing one cycle of the main display loop.
- the latter tool may be arranged so that the user may input via the keyboard the minimum and maximum values of the threshold tool, and, alternatively, input the values of the thresholds themselves.
- our invention could be employed to analyze other types of data, such as, for example, non-directed data, which may or may not be time-varying.
- the scale 612 of tool 610 could be divided into any number of segments, each having a different color.
- the displayed links, or partial lines could vary in thickness based on the data values associated with their respective nodes.
Landscapes
- Engineering & Computer Science (AREA)
- Computer Networks & Wireless Communication (AREA)
- Signal Processing (AREA)
- Human Computer Interaction (AREA)
- Processing Or Creating Images (AREA)
- Controls And Circuits For Display Device (AREA)
- User Interface Of Digital Computer (AREA)
- Monitoring And Testing Of Exchanges (AREA)
- Numerical Control (AREA)
- Management, Administration, Business Operations System, And Electronic Commerce (AREA)
- Information Retrieval, Db Structures And Fs Structures Therefor (AREA)
Applications Claiming Priority (2)
| Application Number | Priority Date | Filing Date | Title |
|---|---|---|---|
| US39055089A | 1989-08-07 | 1989-08-07 | |
| US390550 | 1989-08-07 |
Publications (2)
| Publication Number | Publication Date |
|---|---|
| EP0412692A1 true EP0412692A1 (fr) | 1991-02-13 |
| EP0412692B1 EP0412692B1 (fr) | 1994-10-12 |
Family
ID=23542926
Family Applications (1)
| Application Number | Title | Priority Date | Filing Date |
|---|---|---|---|
| EP90308264A Expired - Lifetime EP0412692B1 (fr) | 1989-08-07 | 1990-07-27 | Analyse graphique et dynamique de données de réseau |
Country Status (6)
| Country | Link |
|---|---|
| US (1) | US5136690A (fr) |
| EP (1) | EP0412692B1 (fr) |
| JP (1) | JPH0736106B2 (fr) |
| CA (1) | CA2017974C (fr) |
| DE (1) | DE69013269T2 (fr) |
| ES (1) | ES2060960T3 (fr) |
Cited By (18)
| Publication number | Priority date | Publication date | Assignee | Title |
|---|---|---|---|---|
| EP0507457A1 (fr) * | 1991-03-07 | 1992-10-07 | Loral Aerospace Corporation | Système et méthode de commande d'une matrice de commutation multi-point |
| EP0535270A1 (fr) * | 1990-08-07 | 1993-04-07 | DIGITAL SYSTEMS INTERNATIONAL, Inc. | Système de surveillance d'opérations |
| AU651384B2 (en) * | 1991-11-01 | 1994-07-21 | Digital Systems International, Inc. | Operations monitoring system |
| EP0613270A3 (en) * | 1993-02-22 | 1996-10-30 | Hewlett Packard Co | Network analysis method. |
| WO1996024210A3 (fr) * | 1995-02-02 | 1996-11-07 | Cabletron Systems Inc | Procede et appareil d'etude des tendances de comportement d'un reseau et de prediction du comportement futur de reseaux de telecommunications |
| EP0761059A1 (fr) * | 1994-05-24 | 1997-03-12 | Executone Information Systems, Inc. | Appareil pour superviser un systeme automatique de repartition d'appels telephoniques |
| EP0738990A3 (fr) * | 1995-04-18 | 1997-05-14 | At & T Corp | Système d'affichage d'information graphique tridimensionelle |
| WO1997024855A3 (fr) * | 1995-12-29 | 1997-11-20 | Mci Communications Corp | Terminal a acces eloigne |
| EP0880291A1 (fr) * | 1997-05-23 | 1998-11-25 | France Telecom | Représentation graphique d'un réseau |
| WO1999004533A1 (fr) * | 1997-07-16 | 1999-01-28 | Optimal Networks Corporation | Interface utilisateur designee diagramme a rebond servant a effectuer l'exploration graphique d'une information de trace de paquets |
| GB2361383A (en) * | 2000-04-13 | 2001-10-17 | 3Com Corp | Graphically distinguishing a path between two points on a network |
| WO2001047183A3 (fr) * | 1999-12-22 | 2002-11-07 | Celeritas Technologies L L C | Systeme de gestion de reseau geographique |
| FR2883446A1 (fr) * | 2005-03-17 | 2006-09-22 | Evolium Sas Soc Par Actions Si | Station de travail pour l'analyse et l'optimisation d'un reseau de telecommunication mobile cellulaire |
| US7295669B1 (en) | 1999-01-21 | 2007-11-13 | Avaya Technology Corp. | Call center telephone and data flow connection system |
| US7447509B2 (en) | 1999-12-22 | 2008-11-04 | Celeritasworks, Llc | Geographic management system |
| WO2008142648A3 (fr) * | 2007-05-21 | 2009-04-30 | Rutherford-Smith William Ernes | Agencement géospatial de données |
| US8224867B2 (en) | 1999-12-22 | 2012-07-17 | Celeritasworks, Llc | Spatial data portal |
| EP2775691A3 (fr) * | 2011-07-30 | 2014-12-24 | Huawei Technologies Co., Ltd. | Gestion et la présentation de consommation d'énergie de station |
Families Citing this family (123)
| Publication number | Priority date | Publication date | Assignee | Title |
|---|---|---|---|---|
| CA2017969C (fr) * | 1989-08-07 | 1999-04-20 | Richard Alan Becker | Dispositif graphique dynamique pour afficher des donnees serie spatiales et temporelles |
| US5276789A (en) * | 1990-05-14 | 1994-01-04 | Hewlett-Packard Co. | Graphic display of network topology |
| US5226120A (en) * | 1990-05-21 | 1993-07-06 | Synoptics Communications, Inc. | Apparatus and method of monitoring the status of a local area network |
| US5270919A (en) * | 1990-06-04 | 1993-12-14 | At&T Bell Laboratories | Network planning tool |
| US5768552A (en) * | 1990-09-28 | 1998-06-16 | Silicon Graphics, Inc. | Graphical representation of computer network topology and activity |
| US5228119A (en) * | 1990-09-28 | 1993-07-13 | Temple University | Multi-dimensional graphing in two-dimensional space |
| JPH04275684A (ja) * | 1991-03-01 | 1992-10-01 | Fuji Xerox Co Ltd | 図形情報データベース構築方法およびその方法が適用される装置 |
| US5500934A (en) * | 1991-09-04 | 1996-03-19 | International Business Machines Corporation | Display and control system for configuring and monitoring a complex system |
| US5644692A (en) * | 1991-12-06 | 1997-07-01 | Lucent Technologies Inc. | Information display apparatus and methods |
| CA2082848C (fr) * | 1991-12-06 | 2000-12-19 | Stephen G. Eick | Appareil et methodes d'affichage de l'information |
| US6061062A (en) * | 1991-12-20 | 2000-05-09 | Apple Computer, Inc. | Zooming controller |
| US5812654A (en) * | 1992-01-27 | 1998-09-22 | Sprint Communications Co. L.P. | Telecommunications network routing |
| US5734709A (en) * | 1992-01-27 | 1998-03-31 | Sprint Communications Co. L.P. | System for customer configuration of call routing in a telecommunications network |
| US5675733A (en) * | 1992-11-30 | 1997-10-07 | International Business Machines Corporation | Statistical analysis and display of reception status of electronic messages |
| JPH06169311A (ja) * | 1992-11-30 | 1994-06-14 | Fujitsu Ltd | 伝送ネットワークの伝送経路追跡システム |
| US5437009A (en) * | 1993-02-18 | 1995-07-25 | Bell Communications Research, Inc. | Method and system for displaying status information of communications networks |
| US5535403A (en) * | 1993-04-12 | 1996-07-09 | International Business Machines Corporation | Method and apparatus for displaying clusters on a computer network |
| US5517193A (en) * | 1993-04-30 | 1996-05-14 | International Business Machines Corporation | Meteorological workstation |
| CA2127764A1 (fr) * | 1993-08-24 | 1995-02-25 | Stephen Gregory Eick | Affichage des resultats d'une consultation |
| US5404396A (en) * | 1993-08-27 | 1995-04-04 | Telefonaktiebolaget Lm Ericsson | Feature interaction manager |
| US5596703A (en) * | 1993-10-22 | 1997-01-21 | Lucent Technologies Inc. | Graphical display of relationships |
| US5581797A (en) * | 1993-10-22 | 1996-12-03 | Lucent Technologies Inc. | Method and apparatus for displaying hierarchical information of a large software system |
| US5539872A (en) * | 1993-11-30 | 1996-07-23 | At&T Corp. | Automated selection of a screen display to be presented in a computer system in response to a user inquiry |
| ATE197213T1 (de) * | 1994-07-22 | 2000-11-15 | Koninkl Kpn Nv | Verfahren zur erzeugung von verbindungen in einem kommunikationsnetzwerk |
| US6226785B1 (en) * | 1994-09-30 | 2001-05-01 | Apple Computer, Inc. | Method and apparatus for storing and replaying creation history of multimedia software or other software content |
| CA2156556C (fr) * | 1994-11-18 | 1998-12-15 | David B. Smith | Methode de facturation pour segments d'appel de communication ou il n'y a pas de communication |
| US5689645A (en) * | 1994-12-01 | 1997-11-18 | Hewlett-Packard Co. | Persistence specification system and method for producing persistent and transient submaps in a management station for a data communication network |
| US5623541A (en) * | 1995-02-17 | 1997-04-22 | Lucent Technologies Inc. | Apparatus to manipulate and examine the data structure that supports digit analysis in telecommunications call processing |
| US5809282A (en) * | 1995-06-07 | 1998-09-15 | Grc International, Inc. | Automated network simulation and optimization system |
| US5703938A (en) * | 1995-08-28 | 1997-12-30 | Mct Communications Corp. | Method of optimizing access trunk configurations and system therefor |
| US5966163A (en) | 1995-10-20 | 1999-10-12 | Scientific-Atlanta, Inc. | Providing constant bit rate upstream data transport in a two way cable system by scheduling preemptive grants for upstream data slots using selected fields of a plurality of grant fields |
| US6230203B1 (en) | 1995-10-20 | 2001-05-08 | Scientific-Atlanta, Inc. | System and method for providing statistics for flexible billing in a cable environment |
| JPH09153059A (ja) * | 1995-11-30 | 1997-06-10 | Matsushita Electric Ind Co Ltd | 履歴表示装置 |
| US5793362A (en) * | 1995-12-04 | 1998-08-11 | Cabletron Systems, Inc. | Configurations tracking system using transition manager to evaluate votes to determine possible connections between ports in a communications network in accordance with transition tables |
| US6023280A (en) * | 1996-02-28 | 2000-02-08 | Lucent Technologies Inc. | Calculation and visualization of tabular data |
| US7028088B1 (en) | 1996-04-03 | 2006-04-11 | Scientific-Atlanta, Inc. | System and method for providing statistics for flexible billing in a cable environment |
| US5805166A (en) * | 1996-08-23 | 1998-09-08 | Intenational Business Machines Corp. | Segmented status area for dynamically reporting status in a data processing system |
| US5935210A (en) * | 1996-11-27 | 1999-08-10 | Microsoft Corporation | Mapping the structure of a collection of computer resources |
| US5936622A (en) * | 1997-01-16 | 1999-08-10 | International Business Machines Corporation | Method and computer program product for displaying visual threshold setting indicators and threshold activation indicators |
| US6272150B1 (en) | 1997-01-17 | 2001-08-07 | Scientific-Atlanta, Inc. | Cable modem map display for network management of a cable data delivery system |
| US6324267B1 (en) | 1997-01-17 | 2001-11-27 | Scientific-Atlanta, Inc. | Two-tiered authorization and authentication for a cable data delivery system |
| US6286058B1 (en) | 1997-04-14 | 2001-09-04 | Scientific-Atlanta, Inc. | Apparatus and methods for automatically rerouting packets in the event of a link failure |
| US5909217A (en) * | 1997-09-30 | 1999-06-01 | International Business Machines Corporation | Large scale system status map |
| US6021215A (en) * | 1997-10-10 | 2000-02-01 | Lucent Technologies, Inc. | Dynamic data visualization |
| US6154212A (en) * | 1997-11-06 | 2000-11-28 | Lucent Technologies Inc. | Method and apparatus for constructing network interfaces |
| US6188403B1 (en) * | 1997-11-21 | 2001-02-13 | Portola Dimensional Systems, Inc. | User-friendly graphics generator using direct manipulation |
| US6356285B1 (en) | 1997-12-17 | 2002-03-12 | Lucent Technologies, Inc | System for visually representing modification information about an characteristic-dependent information processing system |
| US6166742A (en) * | 1998-06-13 | 2000-12-26 | Lucent Technologies, Inc. | Wavelet-assisted volume ray casting |
| EP1114373A2 (fr) | 1998-09-18 | 2001-07-11 | i2 TECHNOLOGIES, INC. | Systeme et procede d'affichage d'informations logistiques associees a la production-distribution |
| US6947905B1 (en) | 1998-09-18 | 2005-09-20 | I2 Technologies Us, Inc. | System and method for displaying planning information associated with a supply chain |
| US6564368B1 (en) * | 1998-10-01 | 2003-05-13 | Call Center Technology, Inc. | System and method for visual application development without programming |
| US6714217B2 (en) * | 1998-12-18 | 2004-03-30 | Sprint Communication Company, L.P. | System and method for providing a graphical user interface to, for building, and/or for monitoring a telecommunication network |
| US6486896B1 (en) * | 1999-04-07 | 2002-11-26 | Apple Computer, Inc. | Scalable scroll controller |
| US6895088B1 (en) * | 1999-05-21 | 2005-05-17 | Sprint Communications Company L.P. | System and method for controlling a call processing system |
| US6583794B1 (en) | 1999-07-01 | 2003-06-24 | Smart Money | Interface system for information mapping |
| US6633312B1 (en) * | 1999-10-19 | 2003-10-14 | Nortel Networks Limited | Method and apparatus for selecting network entities |
| US6938207B1 (en) | 2000-07-19 | 2005-08-30 | International Business Machines Corporation | Method and system for indicating document traversal direction in a hyper linked navigation system |
| US7003559B1 (en) | 2000-10-23 | 2006-02-21 | Hewlett-Packard Development Company, L.P. | System and method for determining probable network paths between nodes in a network topology |
| BR0114774A (pt) * | 2000-10-23 | 2004-07-27 | Steven W Statham | Recuperação de dados relacionados com um centro telefônico |
| US8605089B1 (en) * | 2001-02-12 | 2013-12-10 | Microsoft Corporation | Data visualization using association networks |
| US7200122B2 (en) * | 2001-09-06 | 2007-04-03 | Avaya Technology Corp. | Using link state information to discover IP network topology |
| US7069343B2 (en) * | 2001-09-06 | 2006-06-27 | Avaya Technologycorp. | Topology discovery by partitioning multiple discovery techniques |
| US7096294B2 (en) * | 2001-11-02 | 2006-08-22 | American Megatrends, Inc. | Method and computer program product for graphically providing interrupt request (IRQ) routing information |
| US7571239B2 (en) | 2002-01-08 | 2009-08-04 | Avaya Inc. | Credential management and network querying |
| US20060015942A1 (en) | 2002-03-08 | 2006-01-19 | Ciphertrust, Inc. | Systems and methods for classification of messaging entities |
| US8578480B2 (en) | 2002-03-08 | 2013-11-05 | Mcafee, Inc. | Systems and methods for identifying potentially malicious messages |
| US7693947B2 (en) * | 2002-03-08 | 2010-04-06 | Mcafee, Inc. | Systems and methods for graphically displaying messaging traffic |
| US8561167B2 (en) | 2002-03-08 | 2013-10-15 | Mcafee, Inc. | Web reputation scoring |
| US7222308B2 (en) * | 2002-07-31 | 2007-05-22 | Sap Aktiengesellschaft | Slider bar scaling in a graphical user interface |
| US7426577B2 (en) * | 2003-06-19 | 2008-09-16 | Avaya Technology Corp. | Detection of load balanced links in internet protocol netwoks |
| US7318199B2 (en) * | 2003-09-11 | 2008-01-08 | Oracle International Corporation | Algorithm for automatic layout of objects in a database |
| US7382371B1 (en) * | 2003-11-10 | 2008-06-03 | Compuware Corporation | Visual landscape for multi-tiered application environment component interactions |
| JP4730684B2 (ja) * | 2004-03-16 | 2011-07-20 | イマジニアリング株式会社 | ユーザインターフェースが進化するデータベースシステムおよび当該データベースシステムを利用したWebブラウザ |
| US20060048077A1 (en) * | 2004-08-31 | 2006-03-02 | International Business Machines Corporation | Method, system, program product and user interface for displaying a topology |
| US8635690B2 (en) | 2004-11-05 | 2014-01-21 | Mcafee, Inc. | Reputation based message processing |
| US7903798B1 (en) * | 2005-04-05 | 2011-03-08 | At&T Intellectual Property Ii, L.P. | Method and apparatus for monitoring blocked calls in a communication network |
| US7506274B2 (en) * | 2005-05-18 | 2009-03-17 | Microsoft Corporation | System and method for interactively displaying multi-dimensional data |
| US20070097883A1 (en) * | 2005-08-19 | 2007-05-03 | Yigong Liu | Generation of a network topology hierarchy |
| US8214497B2 (en) | 2007-01-24 | 2012-07-03 | Mcafee, Inc. | Multi-dimensional reputation scoring |
| US7779156B2 (en) * | 2007-01-24 | 2010-08-17 | Mcafee, Inc. | Reputation based load balancing |
| US8763114B2 (en) | 2007-01-24 | 2014-06-24 | Mcafee, Inc. | Detecting image spam |
| JP2010521859A (ja) * | 2007-03-15 | 2010-06-24 | コーニンクレッカ フィリップス エレクトロニクス エヌ ヴィ | 画像を編集するための方法及び装置 |
| US20090113295A1 (en) * | 2007-10-30 | 2009-04-30 | Halpern Arieh S | Graphical display for physiological patient data |
| US8185930B2 (en) | 2007-11-06 | 2012-05-22 | Mcafee, Inc. | Adjusting filter or classification control settings |
| US8791948B2 (en) | 2007-11-09 | 2014-07-29 | Ebay Inc. | Methods and systems to generate graphical representations of relationships between persons based on transactions |
| US8775475B2 (en) * | 2007-11-09 | 2014-07-08 | Ebay Inc. | Transaction data representations using an adjacency matrix |
| US8046324B2 (en) | 2007-11-30 | 2011-10-25 | Ebay Inc. | Graph pattern recognition interface |
| US8599203B2 (en) * | 2007-12-20 | 2013-12-03 | Yahoo! Inc. | Systems and methods for presenting visualizations of media access patterns |
| US8612864B2 (en) * | 2008-02-22 | 2013-12-17 | Applied Materials, Inc. | User interface with visualization of real and virtual data |
| US8589503B2 (en) | 2008-04-04 | 2013-11-19 | Mcafee, Inc. | Prioritizing network traffic |
| US8514226B2 (en) * | 2008-09-30 | 2013-08-20 | Verizon Patent And Licensing Inc. | Methods and systems of graphically conveying a strength of communication between users |
| US8665274B2 (en) * | 2008-10-01 | 2014-03-04 | International Business Machines Corporation | Method and system for generating and displaying an interactive dynamic view of bi-directional impact analysis results for multiply connected objects |
| US8711148B2 (en) * | 2008-10-01 | 2014-04-29 | International Business Machines Corporation | Method and system for generating and displaying an interactive dynamic selective view of multiply connected objects |
| US8194075B2 (en) * | 2008-10-01 | 2012-06-05 | International Business Machines Corporation | Method and system for generating and displaying an interactive dynamic list view of multiply connected objects |
| US8711147B2 (en) | 2008-10-01 | 2014-04-29 | International Business Machines Corporation | Method and system for generating and displaying an interactive dynamic graph view of multiply connected objects |
| US8669982B2 (en) * | 2008-10-01 | 2014-03-11 | International Business Machines Corporation | Method and system for generating and displaying an interactive dynamic culling graph view of multiply connected objects |
| US20110143768A1 (en) * | 2009-12-14 | 2011-06-16 | Lane Sean L | Methods and apparatus related to region-specific mobile device and infrastructure detection, analysis and display |
| US8621638B2 (en) | 2010-05-14 | 2013-12-31 | Mcafee, Inc. | Systems and methods for classification of messaging entities |
| US9122877B2 (en) | 2011-03-21 | 2015-09-01 | Mcafee, Inc. | System and method for malware and network reputation correlation |
| US9553948B2 (en) * | 2011-05-05 | 2017-01-24 | Vmware, Inc. | User interface for managing monitoring profiles |
| US20130103698A1 (en) * | 2011-10-21 | 2013-04-25 | Carsten Schlipf | Displaying items in sorted order, and displaying each item in manner corresponding to or based on item's relevance score |
| USD673967S1 (en) | 2011-10-26 | 2013-01-08 | Mcafee, Inc. | Computer having graphical user interface |
| USD674404S1 (en) | 2011-10-26 | 2013-01-15 | Mcafee, Inc. | Computer having graphical user interface |
| USD674403S1 (en) * | 2011-10-26 | 2013-01-15 | Mcafee, Inc. | Computer having graphical user interface |
| USD677687S1 (en) | 2011-10-27 | 2013-03-12 | Mcafee, Inc. | Computer display screen with graphical user interface |
| US8931043B2 (en) | 2012-04-10 | 2015-01-06 | Mcafee Inc. | System and method for determining and using local reputations of users and hosts to protect information in a network environment |
| JP6221323B2 (ja) | 2013-04-22 | 2017-11-01 | カシオ計算機株式会社 | グラフ表示装置およびその制御プログラム |
| JP6010513B2 (ja) * | 2013-09-20 | 2016-10-19 | 日本電信電話株式会社 | 監視装置 |
| JP6287412B2 (ja) | 2014-03-19 | 2018-03-07 | カシオ計算機株式会社 | 図形描画装置、図形描画方法およびプログラム |
| USD752085S1 (en) * | 2014-05-08 | 2016-03-22 | Express Scripts, Inc. | Display screen with a graphical user interface |
| US9785773B2 (en) * | 2014-07-03 | 2017-10-10 | Palantir Technologies Inc. | Malware data item analysis |
| JP6394163B2 (ja) | 2014-08-07 | 2018-09-26 | カシオ計算機株式会社 | グラフ表示装置、グラフ表示方法およびプログラム |
| JP5758534B1 (ja) * | 2014-09-09 | 2015-08-05 | インテグラート株式会社 | シミュレーションシステム、シミュレーション方法及びシミュレーションプログラム |
| JP6252414B2 (ja) * | 2014-09-16 | 2017-12-27 | カシオ計算機株式会社 | 図形表示装置、図形表示方法およびプログラム |
| US10102369B2 (en) | 2015-08-19 | 2018-10-16 | Palantir Technologies Inc. | Checkout system executable code monitoring, and user account compromise determination system |
| US10289266B2 (en) * | 2017-07-20 | 2019-05-14 | Vmware, Inc. | Providing data visualization |
| USD836664S1 (en) * | 2017-09-27 | 2018-12-25 | Adp, Llc | Display screen with graphical user interface |
| USD837251S1 (en) * | 2017-09-27 | 2019-01-01 | Adp, Llc | Display screen with graphical user interface |
| USD836125S1 (en) * | 2017-09-27 | 2018-12-18 | Adp, Llc | Display screen with graphical user interface |
| EP3785016A4 (fr) | 2018-04-26 | 2022-02-09 | Becton, Dickinson and Company | Transformation biexponentielle pour trieurs de particules |
| USD999229S1 (en) * | 2018-07-11 | 2023-09-19 | Thomson Reuters Enterprise Centre Gmbh | Display screen or portion thereof with graphical user interface |
| USD1096778S1 (en) * | 2023-03-10 | 2025-10-07 | Evernorth Strategic Development, Inc. | Display screen having a graphical user interface |
| USD1102445S1 (en) * | 2023-07-14 | 2025-11-18 | Express Scripts Strategic Development, Inc. | Display screen with a graphical user interface |
Citations (1)
| Publication number | Priority date | Publication date | Assignee | Title |
|---|---|---|---|---|
| US4456788A (en) * | 1982-12-01 | 1984-06-26 | Gte Business Communication Systems Inc. | Telecommunication trunk circuit reporter and advisor |
Family Cites Families (10)
| Publication number | Priority date | Publication date | Assignee | Title |
|---|---|---|---|---|
| US3815986A (en) * | 1972-05-22 | 1974-06-11 | P Darbee | Dynamic graphic display system |
| JPS57169785A (en) * | 1981-04-13 | 1982-10-19 | Nissan Motor | Travelling guidance system for car |
| US4601021A (en) * | 1982-04-12 | 1986-07-15 | Tektronix, Inc. | Highlighting and classifying segments on a CRT display |
| US4464543A (en) * | 1982-12-01 | 1984-08-07 | Gte Business Communication Systems Inc. | Network control center call trace |
| US4455455A (en) * | 1982-12-01 | 1984-06-19 | Gte Business Communication Systems Inc. | Internodal conference call administrator |
| JPS62276693A (ja) * | 1986-05-26 | 1987-12-01 | ホーチキ株式会社 | 火災報知設備の表示装置 |
| JPS6324494A (ja) * | 1986-07-17 | 1988-02-01 | 富士通株式会社 | 警報システムにおける異常表示方法 |
| US4811240A (en) * | 1986-12-22 | 1989-03-07 | International Business Machines Corporation | System for creating and controlling interactive graphic display screens |
| JPH0677193B2 (ja) * | 1987-07-17 | 1994-09-28 | 富士通株式会社 | パイプライン系統図の色変え方式 |
| WO1989007377A1 (fr) * | 1988-01-29 | 1989-08-10 | Network Equipment Technologies, Inc. | Unite de controle d'etat et de topologie de reseaux de communication |
-
1990
- 1990-05-31 CA CA002017974A patent/CA2017974C/fr not_active Expired - Fee Related
- 1990-07-27 DE DE69013269T patent/DE69013269T2/de not_active Expired - Lifetime
- 1990-07-27 ES ES90308264T patent/ES2060960T3/es not_active Expired - Lifetime
- 1990-07-27 EP EP90308264A patent/EP0412692B1/fr not_active Expired - Lifetime
- 1990-08-07 JP JP2207727A patent/JPH0736106B2/ja not_active Expired - Lifetime
-
1991
- 1991-03-21 US US07/672,740 patent/US5136690A/en not_active Expired - Lifetime
Patent Citations (1)
| Publication number | Priority date | Publication date | Assignee | Title |
|---|---|---|---|---|
| US4456788A (en) * | 1982-12-01 | 1984-06-26 | Gte Business Communication Systems Inc. | Telecommunication trunk circuit reporter and advisor |
Non-Patent Citations (4)
| Title |
|---|
| AT&T TECHNOLOGY, vol. 2, no. 3, 1987, pages 30-37, Short Hills, NJ, US; W.B. WHITTEN, II: "Advanced interfaces speed delivery of services" * |
| DATA COMMUNICATIONS, vol. 15, no. 8, July 1936, pages 106-123, New York, US; L. MANTELMAN: "AI carves inroads: Network design, testing, and management" * |
| JAPAN TELECOMMUNICATION REVIEW, vol. 27, no. 2, April 1985, pages 88-94, Tokyo, JP; T. GOTO et al.: "Aiming toward traffic information processing integration - Advanced traffic observation and management information collecting system (ATOMICS) establishment" * |
| PROCEEDINGS OF THE IEEE NINTH COMMUNICATIONS SYMPOSIUM, Whistler Mountain, British Columbia, 10th - 13th September 1985, pages 199-206; R.S. GILBERT et al.: "CNMGRAF - graphic presentation services for network management" * |
Cited By (34)
| Publication number | Priority date | Publication date | Assignee | Title |
|---|---|---|---|---|
| EP0535270A1 (fr) * | 1990-08-07 | 1993-04-07 | DIGITAL SYSTEMS INTERNATIONAL, Inc. | Système de surveillance d'opérations |
| EP0507457A1 (fr) * | 1991-03-07 | 1992-10-07 | Loral Aerospace Corporation | Système et méthode de commande d'une matrice de commutation multi-point |
| AU651384B2 (en) * | 1991-11-01 | 1994-07-21 | Digital Systems International, Inc. | Operations monitoring system |
| EP0613270A3 (en) * | 1993-02-22 | 1996-10-30 | Hewlett Packard Co | Network analysis method. |
| EP0761059A1 (fr) * | 1994-05-24 | 1997-03-12 | Executone Information Systems, Inc. | Appareil pour superviser un systeme automatique de repartition d'appels telephoniques |
| WO1996024210A3 (fr) * | 1995-02-02 | 1996-11-07 | Cabletron Systems Inc | Procede et appareil d'etude des tendances de comportement d'un reseau et de prediction du comportement futur de reseaux de telecommunications |
| US5987442A (en) * | 1995-02-02 | 1999-11-16 | Cabeltron Systems, Inc. | Method and apparatus for learning network behavior trends and predicting future behavior of communications networks |
| EP0738990A3 (fr) * | 1995-04-18 | 1997-05-14 | At & T Corp | Système d'affichage d'information graphique tridimensionelle |
| US5751931A (en) * | 1995-04-18 | 1998-05-12 | Lucent Technologies Inc. | Three dimensional graphical display of information |
| US5850426A (en) * | 1995-12-29 | 1998-12-15 | Mci Communications Corporations | Remote access terminal |
| WO1997024855A3 (fr) * | 1995-12-29 | 1997-11-20 | Mci Communications Corp | Terminal a acces eloigne |
| US6304273B1 (en) | 1997-05-23 | 2001-10-16 | France Telecom | Process for depicting paths within a graphical representation of a network |
| FR2763775A1 (fr) * | 1997-05-23 | 1998-11-27 | France Telecom | Procede de visualisation de chemins au sein d'une representation graphique d'un reseau |
| EP0880291A1 (fr) * | 1997-05-23 | 1998-11-25 | France Telecom | Représentation graphique d'un réseau |
| AU727628B2 (en) * | 1997-07-16 | 2000-12-14 | Compuware Corporation | Bounce diagram: a user interface for graphical exploration of packet trace information |
| US6219050B1 (en) | 1997-07-16 | 2001-04-17 | Compuware Corporation | Bounce diagram: a user interface for graphical exploration of packet trace information |
| WO1999004533A1 (fr) * | 1997-07-16 | 1999-01-28 | Optimal Networks Corporation | Interface utilisateur designee diagramme a rebond servant a effectuer l'exploration graphique d'une information de trace de paquets |
| US7295669B1 (en) | 1999-01-21 | 2007-11-13 | Avaya Technology Corp. | Call center telephone and data flow connection system |
| US8452776B2 (en) | 1999-12-22 | 2013-05-28 | Celeritasworks, Llc | Spatial data portal |
| US9118579B2 (en) | 1999-12-22 | 2015-08-25 | Celeritas Works, LLC | Geographic management system |
| US7447509B2 (en) | 1999-12-22 | 2008-11-04 | Celeritasworks, Llc | Geographic management system |
| US7469247B2 (en) | 1999-12-22 | 2008-12-23 | Celeritasworks, Llc | Geographic management system |
| WO2001047183A3 (fr) * | 1999-12-22 | 2002-11-07 | Celeritas Technologies L L C | Systeme de gestion de reseau geographique |
| US8224867B2 (en) | 1999-12-22 | 2012-07-17 | Celeritasworks, Llc | Spatial data portal |
| US10187268B2 (en) | 1999-12-22 | 2019-01-22 | Celeritasworks, Llc | Geographic management system |
| US9363146B2 (en) | 1999-12-22 | 2016-06-07 | Celeritasworks, Llc | Geographic management system for determining and displaying network data and geospatial data |
| US6775243B1 (en) | 2000-04-13 | 2004-08-10 | 3Com Corporation | Graphically distinguishing a path between two points on a network |
| GB2361383B (en) * | 2000-04-13 | 2002-10-30 | 3Com Corp | Graphically distinguishing a path between two points on a network |
| GB2361383A (en) * | 2000-04-13 | 2001-10-17 | 3Com Corp | Graphically distinguishing a path between two points on a network |
| FR2883446A1 (fr) * | 2005-03-17 | 2006-09-22 | Evolium Sas Soc Par Actions Si | Station de travail pour l'analyse et l'optimisation d'un reseau de telecommunication mobile cellulaire |
| WO2008142648A3 (fr) * | 2007-05-21 | 2009-04-30 | Rutherford-Smith William Ernes | Agencement géospatial de données |
| US9046883B2 (en) | 2011-07-30 | 2015-06-02 | Huawei Technologies Co., Ltd. | Method and apparatus for station energy consumption management and presentation |
| EP2733889A4 (fr) * | 2011-07-30 | 2014-12-24 | Huawei Tech Co Ltd | Procédé et dispositif de gestion et de présentation de consommation d'énergie de station |
| EP2775691A3 (fr) * | 2011-07-30 | 2014-12-24 | Huawei Technologies Co., Ltd. | Gestion et la présentation de consommation d'énergie de station |
Also Published As
| Publication number | Publication date |
|---|---|
| ES2060960T3 (es) | 1994-12-01 |
| JPH0371193A (ja) | 1991-03-26 |
| DE69013269T2 (de) | 1995-05-24 |
| CA2017974C (fr) | 1998-06-16 |
| DE69013269D1 (de) | 1994-11-17 |
| CA2017974A1 (fr) | 1991-02-07 |
| EP0412692B1 (fr) | 1994-10-12 |
| US5136690A (en) | 1992-08-04 |
| JPH0736106B2 (ja) | 1995-04-19 |
Similar Documents
| Publication | Publication Date | Title |
|---|---|---|
| EP0412692B1 (fr) | Analyse graphique et dynamique de données de réseau | |
| US5623590A (en) | Dynamic graphics arrangement for displaying spatial-time-series data | |
| US4524414A (en) | Numerical controller | |
| US5642475A (en) | Apparatus and method for editing graphics or group graphics displayed on a screen and correlated to each other | |
| US5463731A (en) | Monitor screen graphic value indicator system | |
| US5302967A (en) | Figure processing apparatus and method aided by display with ruled lines | |
| JPH07160456A (ja) | 画像処理装置 | |
| JPH07318380A (ja) | データ計測支援装置およびデータ計測支援方法 | |
| JPH07129630A (ja) | 類似部品のcad図面作画方法 | |
| JP2820949B2 (ja) | 階層オブジェクト選択方法及びその装置並びに情報処理装置とcad装置 | |
| JP4732465B2 (ja) | スケールを変更できる表示を用いたワークステーション | |
| JPH06290163A (ja) | シミュレーション方法及びシステム | |
| EP0797162A2 (fr) | Interface utilisateur graphique et procédé d'affichage de segments de données dans une base de données informatique | |
| JP2841433B2 (ja) | マルチウィンドウ・システム | |
| JP3015230B2 (ja) | 表示領域指定装置 | |
| JPH02301819A (ja) | 学習機能付表示方式 | |
| JPH1049133A (ja) | データ表示方法 | |
| JP3080105B2 (ja) | 罫線選択装置 | |
| JPH01206424A (ja) | ファイルの表示方式 | |
| JP3578922B2 (ja) | 信号パターン作成システム | |
| JP3570773B2 (ja) | 図形処理装置 | |
| JPS6353587B2 (fr) | ||
| JP3144786B2 (ja) | 情報処理装置 | |
| Thalmann et al. | Elect/An Interactive Graphical System For The Automatic Generation Of Electoral Maps | |
| JPS6318407A (ja) | 数値制御装置の表示画面制御装置 |
Legal Events
| Date | Code | Title | Description |
|---|---|---|---|
| PUAI | Public reference made under article 153(3) epc to a published international application that has entered the european phase |
Free format text: ORIGINAL CODE: 0009012 |
|
| 17P | Request for examination filed |
Effective date: 19900808 |
|
| AK | Designated contracting states |
Kind code of ref document: A1 Designated state(s): DE ES FR GB IT NL SE |
|
| 17Q | First examination report despatched |
Effective date: 19930518 |
|
| RAP3 | Party data changed (applicant data changed or rights of an application transferred) |
Owner name: AT&T CORP. |
|
| GRAA | (expected) grant |
Free format text: ORIGINAL CODE: 0009210 |
|
| AK | Designated contracting states |
Kind code of ref document: B1 Designated state(s): DE ES FR GB IT NL SE |
|
| ITF | It: translation for a ep patent filed | ||
| ET | Fr: translation filed | ||
| REF | Corresponds to: |
Ref document number: 69013269 Country of ref document: DE Date of ref document: 19941117 |
|
| REG | Reference to a national code |
Ref country code: ES Ref legal event code: FG2A Ref document number: 2060960 Country of ref document: ES Kind code of ref document: T3 |
|
| EAL | Se: european patent in force in sweden |
Ref document number: 90308264.2 |
|
| PLBE | No opposition filed within time limit |
Free format text: ORIGINAL CODE: 0009261 |
|
| STAA | Information on the status of an ep patent application or granted ep patent |
Free format text: STATUS: NO OPPOSITION FILED WITHIN TIME LIMIT |
|
| 26N | No opposition filed | ||
| REG | Reference to a national code |
Ref country code: GB Ref legal event code: IF02 |
|
| PGFP | Annual fee paid to national office [announced via postgrant information from national office to epo] |
Ref country code: FR Payment date: 20090716 Year of fee payment: 20 Ref country code: ES Payment date: 20090724 Year of fee payment: 20 |
|
| PGFP | Annual fee paid to national office [announced via postgrant information from national office to epo] |
Ref country code: NL Payment date: 20090730 Year of fee payment: 20 Ref country code: SE Payment date: 20090715 Year of fee payment: 20 Ref country code: DE Payment date: 20090722 Year of fee payment: 20 Ref country code: GB Payment date: 20090720 Year of fee payment: 20 |
|
| PGFP | Annual fee paid to national office [announced via postgrant information from national office to epo] |
Ref country code: IT Payment date: 20090723 Year of fee payment: 20 |
|
| REG | Reference to a national code |
Ref country code: NL Ref legal event code: V4 Effective date: 20100727 |
|
| REG | Reference to a national code |
Ref country code: GB Ref legal event code: PE20 Expiry date: 20100726 |
|
| REG | Reference to a national code |
Ref country code: ES Ref legal event code: FD2A Effective date: 20100728 |
|
| EUG | Se: european patent has lapsed | ||
| PG25 | Lapsed in a contracting state [announced via postgrant information from national office to epo] |
Ref country code: NL Free format text: LAPSE BECAUSE OF EXPIRATION OF PROTECTION Effective date: 20100727 Ref country code: ES Free format text: LAPSE BECAUSE OF EXPIRATION OF PROTECTION Effective date: 20100728 |
|
| PG25 | Lapsed in a contracting state [announced via postgrant information from national office to epo] |
Ref country code: GB Free format text: LAPSE BECAUSE OF EXPIRATION OF PROTECTION Effective date: 20100726 |
|
| PG25 | Lapsed in a contracting state [announced via postgrant information from national office to epo] |
Ref country code: DE Free format text: LAPSE BECAUSE OF EXPIRATION OF PROTECTION Effective date: 20100727 |