EP0439157A2 - Spektralanalysator zur gleichzeitigen Anzeige von Breit- und Schmalbandübertragungscharakteristiken - Google Patents
Spektralanalysator zur gleichzeitigen Anzeige von Breit- und Schmalbandübertragungscharakteristiken Download PDFInfo
- Publication number
- EP0439157A2 EP0439157A2 EP91100854A EP91100854A EP0439157A2 EP 0439157 A2 EP0439157 A2 EP 0439157A2 EP 91100854 A EP91100854 A EP 91100854A EP 91100854 A EP91100854 A EP 91100854A EP 0439157 A2 EP0439157 A2 EP 0439157A2
- Authority
- EP
- European Patent Office
- Prior art keywords
- band
- display
- width
- narrow
- spectrum
- Prior art date
- Legal status (The legal status is an assumption and is not a legal conclusion. Google has not performed a legal analysis and makes no representation as to the accuracy of the status listed.)
- Granted
Links
- 238000001228 spectrum Methods 0.000 title claims abstract description 282
- 230000005540 biological transmission Effects 0.000 title claims description 53
- 238000005259 measurement Methods 0.000 claims abstract description 130
- 239000003550 marker Substances 0.000 claims abstract description 93
- 230000015654 memory Effects 0.000 claims description 108
- 230000010355 oscillation Effects 0.000 claims description 7
- 238000010408 sweeping Methods 0.000 claims description 4
- 230000002093 peripheral effect Effects 0.000 claims description 3
- 230000006870 function Effects 0.000 description 8
- 239000013078 crystal Substances 0.000 description 7
- 230000003247 decreasing effect Effects 0.000 description 3
- 238000010276 construction Methods 0.000 description 2
- 238000000034 method Methods 0.000 description 2
- 230000002123 temporal effect Effects 0.000 description 2
- 230000002411 adverse Effects 0.000 description 1
- 238000007796 conventional method Methods 0.000 description 1
- 230000003287 optical effect Effects 0.000 description 1
- 230000004044 response Effects 0.000 description 1
Images





Classifications
-
- G—PHYSICS
- G01—MEASURING; TESTING
- G01R—MEASURING ELECTRIC VARIABLES; MEASURING MAGNETIC VARIABLES
- G01R23/00—Arrangements for measuring frequencies; Arrangements for analysing frequency spectra
- G01R23/16—Spectrum analysis; Fourier analysis
- G01R23/165—Spectrum analysis; Fourier analysis using filters
-
- G—PHYSICS
- G01—MEASURING; TESTING
- G01R—MEASURING ELECTRIC VARIABLES; MEASURING MAGNETIC VARIABLES
- G01R23/00—Arrangements for measuring frequencies; Arrangements for analysing frequency spectra
- G01R23/16—Spectrum analysis; Fourier analysis
- G01R23/18—Spectrum analysis; Fourier analysis with provision for recording frequency spectrum
Definitions
- the present invention relates generally to a waveform analyzer such as a spectrum analyzer and a network analyzer, and more particularly to a spectrum analyzer wherein an input signal is continuously frequency-converted to detect a spectrum of the input signal, and the spectrum is displayed with the magnitude thereof plotted on the ordinate and with the frequency thereof plotted on the abscissa and to a network analyzer wherein an input signal is continuously supplied to a device under tested with a variable frequency to detect an output signal of the device under tested, and the output signal is displayed with the magnitude thereof plotted on the ordinate and with the frequency thereof plotted on the abscissa.
- This invention also relates to a spectrum analyzer wherein a spectrum measured in a certain band width is displayed on a first display unit as a wide-band spectrum, a desired part of the wide-band spectrum is designated by a zone marker, and the designated part is enlarged and displayed on a second display unit as a narrow-band spectrum.
- a spectrum analyzer wherein a spectrum measured in a certain band width is displayed on a first display unit as a wide-band spectrum, a desired part of the wide-band spectrum is designated by a zone marker, and the designated part is enlarged and displayed on a second display unit as a narrow-band spectrum.
- This invention also relates to a network analyzer wherein a transmission characteristic measured in a certain band width is displayed on a first display unit as a wide-band transmission characteristic, a desired part of the wide-band transmission characteristic is designated by a zone marker, and the designated part is enlarged and displayed on a second display unit as a narrow-band transmission characteristic.
- a transmission characteristic measured in a certain band width is displayed on a first display unit as a wide-band transmission characteristic
- a desired part of the wide-band transmission characteristic is designated by a zone marker
- the designated part is enlarged and displayed on a second display unit as a narrow-band transmission characteristic.
- Prior Art 1 Published Unexamined Japanese Patent Application No. 59-95472 (hereinafter referred to as Prior Art 1) in which such techniques are applied to an oscilloscope.
- the movement speed is decreased by the degree corresponding to the amplified variable DC level at the time of enlargement (i.e. corresponding to the above-mentioned ratio).
- the knob on the panel for moving a cursor is operated (adjusted) by a predetermined degree, in order to move the cursor to a predetermined display point, while observing the display. Consequently, a signal (corresponding to the above-mentioned variable DC level) for moving the cursor is, in fact, output by a predetermined amount.
- the ratio (movement speed) between the degree of this operation (adjustment) and the actual movement distance of the cursor on the display is kept at a predetermined value, irrespective of the non-enlargement time or enlargement time.
- the operation of moving the waveform or cursor on the display is made easier.
- a conventional spectrum analyzer is disclosed in U.S. Patent No. 4,264,958 (hereinafter referred to as Prior Art 2).
- This spectrum analyzer employs a technique of so-called zoom function.
- the frequency of a point designated by a marker or a peak point of the spectrum is used as a center frequency, and the band width is narrowed.
- the narrowed band width is measured and enlarged for display.
- the device of Prior Art 1 is designed for measurement of a waveform in a time region, with use of an oscilloscope. If the waveform is enlarged for display, the measurement resolution is increased. Thus, the function itself of keeping the movement speed on the display at a constant value is effective.
- a spectrum analyzer has not only the same display function as an oscilloscope, but also has a measuring unit for detecting the level of a spectrum in a frequency region.
- the display resolution based on frequency is increased, even if the movement speed on the CRT display is unchanged like the oscilloscope.
- the measurement resolution of the measuring unit since the measurement resolution of the measuring unit must be increased in accordance with the enlarged width, it is necessary to set the measurement resolution and sweep time of the measuring unit in accordance with the band width for enlarged measurement display and under optimal error-free conditions.
- the measurement resolution and the sweep time of the measuring unit have the relationship: when the frequency is swept at a higher speed than the speed required when the measuring unit detects the level at a predetermined frequency resolution (hereinafter called “resolution”), the error increases, while the frequency is swept at a lower speed, the measurement precision is better but longer time is consumed.
- resolution a predetermined frequency resolution
- a wide-band spectrum and a narrow-band spectrum are measured and displayed and observation and operation can be carried out with a measurement resolution of the band width of each spectrum and, simultaneously, the condition changed for measurement in one band is reflected on the condition for measurement in another band.
- the conventional devices are inconvenient when the spectrum analyzer is used to alternately measure and display the wide-band spectrum and narrow-band spectrum and set and control the conditions therefor. There is a strong demand that these problems be solved urgently in the spectrum analyzer and the network analyzer.
- an object of the present invention to provide a new and improved spectrum analyzer having a function of simultaneously displaying wide- and narrow-band spectra, which analyzer can enhance the operability and observation property in measuring and observing the wide-band spectrum and narrow-band spectrum alternately.
- a spectrum analyzer comprising: measuring means for alternately outputting wide-band spectrum data and narrow-band spectrum data relating to a signal to be measured; waveform memory means for storing the wide-band spectrum data and narrow-band spectrum data output alternately from the measuring means; display means having a first display area for displaying the wide-band spectrum data stored in the waveform memory means and a second display area for enlarging and displaying the narrow-band spectrum data stored in the waveform memory means; and parameter setting means comprising:
- the spectrum analyzer of the present invention is basically provided with first display change means for associating wide-band spectrum display with narrow-band spectrum display, and second display change means for associating, inversely, the narrow-band spectrum display with the wide-band spectrum display. Additionally, the spectrum analyzer has measuring control means for setting a measuring unit in optimal conditions for the wide-band spectrum display and narrow-band spectrum display.
- a spectrum measured at a certain band width is displayed as a wide-band spectrum.
- a desired part of the wide-band spectrum is designated by a zone marker, and the designated part is enlarged and displayed as a narrow-band spectrum.
- This spectrum analyzer comprises:
- a network analyzer comprising: measuring means for alternately outputting wide-band transmission characteristic data and narrow-band transmission characteristic data relating to a device under tested according to a test signal which is trackinged; waveform memory means for storing the wide-band transmission characteristic data and narrow-band transmission characteristic data output alternately from the measuring means; display means having a first display area for displaying the wide-band transmission characteristic data stored in the waveform memory means and a second display area for enlarging and displaying the narrow-band transmission characteristic data stored in the waveform memory means; and parameter setting means comprising:
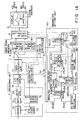
- Fig. 1A shows the structure of an embodiment of this invention applied to a spectrum analyzer
- Fig. 2 shows an example of a console panel 1 of this invention which includes a display.
- the display screen of a display 2 includes a BG (Background Measurement) area 2a for display of a wide-band spectrum, and an FG (Forward Ground Measurement) area 2b for display of a narrow-band spectrum.
- BG Background Measurement
- FG Forward Ground Measurement
- a BG setting unit 4 a zone marker setting unit 5 and an FG setting unit 6 are designed such that an operator can set the units 4, 5 and 6 at desired values by means of their corresponding knobs.
- the number of display points P in the abscissa (frequency axis) on the display screen is 500.
- the center frequency and band width varied by the FG center setting section 6a and FG span setting section 6b are reflected on the center position Zc and width Zs of the zone marker 3 displayed on the BG area 2a.
- the console panel 1 having the above structure, enables the following operations to be carried out.
- the zone marker 3 When observing the wide-band spectrum of the BG area 2a during measurement, the zone marker 3 can be set with the set resolution corresponding to the band width, thereby selecting and displaying the narrow-band spectrum.
- the selected narrow-band spectrum on the FG area 2b is observed and the center frequency and band width thereof are varied on an as needed basis, they can be varied with the set resolution corresponding to the band width.
- the zone marker 3 can be displayed with the varied center frequency and band width of the narrow-band spectrum.
- the wide-band spectrum display on the BG area 2a and the narrow-band spectrum display on the FG area 2b can be alternately observed and controlled smoothly.
- Fig. 1A shows the structure of an embodiment of the invention.
- a measuring unit 7 detects a spectrum of a signal to be measured in a frequency region, and outputs a signal representing a level of the spectrum corresponding to the frequency.
- a mixer 7b converts an input signal into an intermediate frequency signal, while the mixer 7b receives a signal from a local oscillator 7a.
- the intermediate frequency signal is selected and analyzed by a variable band-width BPF (band-pass filter) 7c.
- the analyzed intermediate frequency signal is detected by a detector 7d, and an output from the detector 7d is converted into a digital signal by an A/D converter 7e.
- the digital signal is processed into spectrum data having a desired band by a data processor 7f.
- the spectrum data is output from the processor 7f.
- a sweep signal generator 7g sweeps an oscillation frequency of the local oscillator 7a, with a predetermined frequency as a center frequency, over a predetermined band width and for a predetermined sweep time.
- the band of the variable band-width BPF 7c determines the measurement resolution of the spectrum analyzer, when a signal is selected and analyzed on a frequency basis.
- the band of the BPF 7c i.e. the measurement resolution, is variable.
- a measuring controller 7h controls the respective parts so that the measurement band width, sweep time and resolution band width (RBW), which are controlled as stated above, may satisfy the relationship represented by formula (1), thereby bringing the error of spectrum measurement to an optimal value for the measuring device.
- K a constant.
- K is set to a value between 2 and 5.
- factors other than constant K are determined, taking into account the influence on the error by mainly the local oscillator 7a and BPF 7c, where the measurement is performed with desired band width and measurement resolution.
- the measurement error of the entire measurement device is influenced by the factors other than the above factors, e.g. time response and noise of each part.
- the constant K is set to a value, such that the error of the entire measurement device is decreased.
- Fig. 1B shows a specific example of the BPF 7c, which is a single-stage filter circuit. Actually, a plurality of such filter circuits are constructed in a multiple stage (e.g. 4 to 6 stages). The combination of the filter circuits changes the RBW.
- the filter circuit shown in Fig. 1B comprises: a first amplifier 18 having a low output impedance and receiving an input signal to be filtered; a second amplifier 27 having a high input impedance and sending out a filtered output signal; an LC parallel resonance circuit (25, 26) connected between the input terminal of the second amplifier and a base potential; a first Q variable resistor 19 which may be connected in series between the output of the first amplifier and the LC parallel resonance circuit; a crystal resonator which may be connected in series between the output of the first amplifier and the LC parallel resonance circuit; a parallel circuit (20, 22) of the crystal resonator and a capacitance element, wherein a voltage having a phase opposite to the phase of the voltage applied to an end of the crystal resonator is applied to the other end of the crystal resonator through the capacitance element; a second Q variable resistor 24 connected between an end of the parallel circuit and the base potential; and a change-over switch 23 for enabling the first Q variable resistor 19 or the parallel circuit
- the filter circuit is applicable to a band-width variable band-pass filter circuit.
- the filter circuit comprises a wide band-pass filter having a large frequency band width for receiving an unknown signal, and a narrow band-pass filter for receiving a signal of a desired frequency in a narrow band. Either the wide band-pass filter or the narrow band-pass filter is selected by the switch 23, depending on the object to be analyzed.
- a switch 28 stops the input/output of the crystal resonator when the LC filter is operated, thereby preventing the influence of the crystal resonator. Specifically, when the LC circuit is operated, a signal from the crystal resonator may adversely affect the characteristic of the LC filter, resulting in a failure to attain its inherent characteristic. This problem can be solved by the use of the switch 28.
- the switches 23 and 28 are supplied with change-over signals from the measuring controller 7h shown in Fig. 1A.
- the circuit scale can be halved substantially, compared to the prior art, with the performance of the analyzer unchanged.
- a waveform memory unit 8 comprises a BG waveform memory 8a and an FG waveform memory 8b for storing, respectively, the levels of a wide band spectrum and a narrow band spectrum at addresses associated with measurement frequencies.
- the addresses of the BG waveform memory 8a and the FG waveform memory 8b are associated with display points on the abscissa on the screen of the display 2.
- the number of addresses of each memory is equal to the number of the display points. Accordingly, when the spectra are displayed, the narrow band spectrum is made larger than the wide band spectrum in accordance with the band ratio therebetween. Thus, the reading resolution in relation to respective frequencies is enhanced.
- a display controller 9 enables the wide band spectrum and narrow band spectrum stored in the BG waveform memory 8a and FG waveform memory 8b to be displayed on the areas 2a and 2b of the display 2.
- the display controller 9 displays a zone marker 3 for selecting a narrow band in a wide band spectrum displayed on the area 2a.
- a BG/FG switch controller 10 sweeps the wide band spectrum and narrow band spectrum alternately on the measuring controller 7h, and outputs a start signal to be measured.
- switches S1 and S2 are controlled such that the switches are brought to the m-side at the time of wide band spectrum measurement and to the n-side at the time of narrow band spectrum measurement.
- a parameter setting unit 100 constitutes a main part of this embodiment of the invention.
- the function blocks of the unit 100 are shown in detail in Fig. 3.
- the structure of the unit 100 will now be described by referring mainly to Fig. 1, as well as Fig. 3.
- a first display change section 14 receives zone marker position information C4 and zone marker width information D4 from a zone setting memory 12.
- the first display change section 14 finds, by arithmetic operation, a center frequency (center information A4) or band width (span information B4) of narrow band spectrum display.
- the found information A4 or B4 is stored in an FG setting memory 13.
- the first display change section 14 comprises an FG center calculation section 14a and an FG span calculation section 14b.
- the arithmetic operation is started by trigger signals J and K from a zone setting section 5 and trigger signals S and T from a BG setting section 4.
- a second display change section 15 receives center information A3 and span information B5 for narrow band spectrum display from the FG setting memory 13.
- the second display change section 15 finds, by arithmetic operation, a position (position information C3) and a width (width information D3) of wide band spectrum display.
- the found information C3, D3 is stored in the zone setting memory 12.
- the second display change section 15 comprises a zone position calculation section 15a and a zone width calculation section 15b.
- the arithmetic operation is started by trigger signals Q and R from an FG setting section 6.
- the zone setting memory 12 comprises a zone position memory 12a for storing the position information of the zone marker and a zone width memory 12b for storing width information.
- the zone position memory 12a receives position information C1 from the zone setting section 5 or position information C3 from the second display change section 15.
- the zone width memory 12b receives width information D1 from the zone setting section 5 or width information D3 from the second display change section 15.
- the memories 12a and 12b store such information each time they receive it, and therefore the stored information is always updated.
- the stored information is sent to the display controller 9 as position information C2 and width information D2.
- the zone marker is set on the wide band spectrum display.
- the FG setting memory 13 comprises an FG center memory 13a and an FG span memory 13b for storing center information and span information relating to narrow-band spectrum display.
- the FG center memory 13a receives center information A1 from the FG setting section 6 or center information A4 from the first display change section 14.
- the FG span memory 13b receives span information B1 from the FG setting section 6 or span information B4 from the first display change section 14.
- the memories 13a and 13b store such information each time they receive it, and the stored information is always updated.
- the latest stored center information and span information is sent to the switch S2 and the display controller 9 as center information A2 and span information B2, and similarly sent to the second display change section 15 as center information A3 and span information B3.
- the measuring unit 7 performs narrow-band spectrum measurement under such conditions, and the FG waveform memory 8b stores spectrum data.
- the display controller 9 enables the display 2 to display the narrow-band spectrum.
- the latest zone marker is set on the wide-band spectrum display of the display 2.
- the BG setting memory 11 stores center information g1 and span information H1 relating to wide-band spectrum display, which information is delivered from the BG setting section 4.
- the memory 11 outputs the information G1, H1 to the first display change section 14, second display change section 15 and display controller 9.
- the BG setting memory 11 includes a BG center memory 11a and a BG span memory 11b.
- the measuring controller 7h, display controller 9, first display change section 14 and second display change section 15 are constituted by a microcomputer and its peripheral circuits (CPU, ROM, RAM, etc.).
- Sections [I] to [VIII] in the following description correspond to the information items to be set.
- the initial conditions for setting operations are determined as follows: (Initial conditions for wide-band spectrum display) Value (Hz) of center frequency: Bco Value (Hz) of span: Bso (Initial conditions for narrow-band spectrum display) Value (Hz) of center frequency: Fco Value (Hz) of span: Fso (Initial conditions for marker zone) Value (number of points) of position: Zco Value (number of points) of width: Zso Number of points on the abscissa of the display screen of display 2: 500
- Fig. 4A show initial display screens for wide-band spectrum display and narrow-band spectrum display before the position of the zone marker is changed.
- Fig. 5A show initial display screens for wide-band spectrum display and narrow-band spectrum display before the width of the zone marker is changed.
- the upper screen in Fig. 5B shows an example of narrow-band spectrum display in which the band width has been changed.
- the width Zs1 of the zone marker may be set to zero.
- Fs1 0.
- the lower screen and upper screen in Fig. 5C show examples of wide-band spectrum display and narrow-band spectrum display in this case.
- the zone marker indicates a one-point frequency.
- the entire abscissa represents frequency Fco.
- the upper screen in Fig. 5C displays the measured temporal variation of the magnitude of the spectrum at a single frequency Fco.
- the upper screen of Fig. 5C shows the display in the time region.
- the sweep time may be set so as to attain a sweep speed which allows display in accordance with the temporal change of magnitude of the spectrum.
- Fig. 6A show initial display screens for wide-band spectrum display and narrow-band spectrum display before the center frequency of the narrow-band spectrum is changed.
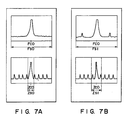
- Fig. 7A show initial display screens for wide-band spectrum display and narrow-band spectrum display before the center frequency of narrow-band spectrum is changed.
- Fig. 8A show initial display screens for wide-band spectrum display and narrow-band spectrum display before the center frequency of the wide-band spectrum is changed.
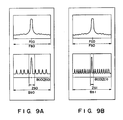
- Fig. 9A show initial display screens for wide-band spectrum display and narrow-band spectrum display before the band width of the wide-band spectrum is changed.
- the zone marker position on the wide-band spectrum display is changed, as shown in the lower screen of Fig. 9B.
- the narrow-band spectrum display is unchanged, as shown in the upper screens of Figs. 9A and 9B.
- the zone marker position and the point of width of the marker are changed by frequency span setting for wide-band spectrum, the frequency of the marker is unchanged.
- Fig. 10A show initial display screens for wide-band spectrum display and narrow-band spectrum display before the center frequency of the wide-band spectrum is changed.
- Fig. 11A show initial display screens for wide-band spectrum display and narrow-band spectrum display before the band width of the wide-band spectrum is changed.
- the constructions of the BG setting memory 11, zone setting memory 12 and FG setting memory 13 can be modified in accordance with the types of circuits connected to these memories. Only if the first and second display change sections It is sufficient if the memories are constructed so as to realize the flow of signals, which enables the first and second display change sections to fully perform the above functions.
- Each of the BG setting section 4, zone setting section 5 and FG setting section 6 may comprise one or two setting sections, and these sections may be switched and commonly used. Any type of setting section may be used, if it can convert the operator's action to an electric signal and can output a signal matching the associated circuit.
- the setting section may comprise an encoder with a knob, and an interface circuit.
- the narrow-band spectrum display and wide-band spectrum display may be effected on the same area of the display.
- Color display makes clearer the displayed data.
- the first display change section allows the operator to change mainly the position and width of the zone marker while observing the wide-band spectrum display, with fineness corresponding to the band width of wide-band spectrum measurement.
- the measurement conditions (center frequency and band width) on narrow-band spectrum display are automatically changed.
- the second display change section allows the operator to change mainly the measurement conditions (center frequency and band width) on narrow-band spectrum display while observing the narrow-band spectrum display, with a display mode which can easily be observed. That is, the conditions can be changed with fineness corresponding to the band width of narrow-band spectrum measurement.
- the change of the center frequency and band width is automatically reflected on the change in display position and width of the zone marker for wide-band spectrum display.
- the measuring controller when the measurement band width is changed by the output from the first and second display change sections, the measurement conditions (sweep time, measurement resolution) are automatically controlled to reduce measurement error. Therefore, precise measurement is ensured, in addition to the above-mentioned high operability and easy observation.
- Fig. 12 shows the structure of another embodiment of the invention applied to a network analyzer.
- the test signal from the tracking generator 101 is supplied to the mixer 7b which output an IF signal having an IF frequency f IF via a device under tested (DUT) 102 such as an amplifier, for example.
- DUT device under tested
- the display 2 displays a frequency-level characteristic such as a peak level at the frequency ft in the test signal since the mixer 7b receives a trackinged signal.
- Fig. 13 shows a display example for explaining the operation of Fig. 12. That is, in the network analyzer, the lower screen of Fig. 13 which is the wide-band sweeping (BG) is seen as a small dip, the upper screen of Fig. 13 which is the narrow-band sweeping (FG) is actually seen as a large dip enlarged the small dip using a enlarged display with the zone marker.
- BG wide-band sweeping
- FG narrow-band sweeping
Landscapes
- Physics & Mathematics (AREA)
- Mathematical Physics (AREA)
- General Physics & Mathematics (AREA)
- Measurement Of Resistance Or Impedance (AREA)
- Spectrometry And Color Measurement (AREA)
Applications Claiming Priority (2)
| Application Number | Priority Date | Filing Date | Title |
|---|---|---|---|
| JP15434/90 | 1990-01-25 | ||
| JP2015434A JP2891497B2 (ja) | 1990-01-25 | 1990-01-25 | スペクトラムアナライザ |
Publications (3)
| Publication Number | Publication Date |
|---|---|
| EP0439157A2 true EP0439157A2 (de) | 1991-07-31 |
| EP0439157A3 EP0439157A3 (en) | 1992-05-13 |
| EP0439157B1 EP0439157B1 (de) | 1997-10-08 |
Family
ID=11888694
Family Applications (1)
| Application Number | Title | Priority Date | Filing Date |
|---|---|---|---|
| EP91100854A Expired - Lifetime EP0439157B1 (de) | 1990-01-25 | 1991-01-23 | Spektralanalysator zur gleichzeitigen Anzeige von Breit- und Schmalbandübertragungscharakteristiken |
Country Status (4)
| Country | Link |
|---|---|
| US (1) | US5075618A (de) |
| EP (1) | EP0439157B1 (de) |
| JP (1) | JP2891497B2 (de) |
| DE (1) | DE69127836T2 (de) |
Cited By (6)
| Publication number | Priority date | Publication date | Assignee | Title |
|---|---|---|---|---|
| EP0473949A3 (en) * | 1990-09-04 | 1992-08-19 | Rohde & Schwarz Gmbh & Co. Kg | Analysator, especially network analysator for the frequency selective measurement and display of frequency dependant measuring parameters |
| WO1997017617A1 (en) * | 1995-11-07 | 1997-05-15 | Emscan Corporation | Method and apparatus for high-speed scanning of electromagnetic emission levels |
| EP0981054A3 (de) * | 1998-08-10 | 2001-08-22 | Sony/Tektronix Corporation | Breitband-Signalanalysator |
| EP2128634A1 (de) * | 2008-05-26 | 2009-12-02 | Sistemas Integrados de Servicios de Telecontrol, S.L. | Rundfunk- und/oder Fernsignal-Meßgerät |
| EP2667203A1 (de) * | 2012-05-22 | 2013-11-27 | Tektronix, Inc. | Automatische Leistungs-Erkennung innerhalb eines Bandes aber außerhalb eines Bereichs in einem Prüf- und messinstrument für den Frequenzbereich |
| EP2743709A1 (de) * | 2012-12-11 | 2014-06-18 | Tektronix Inc. | Echtzeit-Spektrumanalysator mit Zoomanzeige |
Families Citing this family (34)
| Publication number | Priority date | Publication date | Assignee | Title |
|---|---|---|---|---|
| US5579463A (en) * | 1990-03-30 | 1996-11-26 | Anritsu Corporation | Waveform display apparatus of frequency sweep type for facilitating display of a high definition waveform |
| WO1991015776A1 (fr) * | 1990-03-30 | 1991-10-17 | Anritsu Corporation | Dispositif d'affichage de forme d'onde pour faciliter l'observation simple d'une forme d'onde fine |
| US5210483A (en) * | 1990-09-29 | 1993-05-11 | Anritsu Corporation | Burst signal spectrum measuring system with stepwise sweeping |
| US5394185A (en) * | 1993-01-08 | 1995-02-28 | Tektronix, Inc. | In-service CATV HUM measurement technique |
| US6229316B1 (en) * | 1995-09-08 | 2001-05-08 | Advantest Corporation | Measuring method by spectrum analyzer |
| US5684508A (en) * | 1995-11-21 | 1997-11-04 | Fluke Corporation | Method of displaying continuously acquired data as multiple traces on a fixed length display |
| US5898307A (en) * | 1996-04-10 | 1999-04-27 | Snap-On Technologies, Inc. | Independent cursor control in dual-trace engine analyzer scope |
| US5949495A (en) * | 1996-04-25 | 1999-09-07 | Tektronix, Inc. | Digital cursors for serial digital television waveform monitors |
| US6018246A (en) * | 1997-10-17 | 2000-01-25 | Hewlett-Packard Company | Network analyzer measurement method for high dynamic range devices |
| JP2002057651A (ja) * | 2000-08-11 | 2002-02-22 | Advantest Corp | 多重信号の物理量表示装置、方法、記録媒体 |
| US20030132944A1 (en) * | 2001-10-03 | 2003-07-17 | Sun Microsystems, Inc. | User control of generalized semantic zooming |
| JP4064129B2 (ja) * | 2002-03-14 | 2008-03-19 | リーダー電子株式会社 | 波形表示における波形表示位置調整装置 |
| US7302017B2 (en) * | 2002-06-18 | 2007-11-27 | General Dynamics C4 Systems, Inc. | System and method for adaptive matched filter signal parameter measurement |
| JP4103134B2 (ja) * | 2003-02-27 | 2008-06-18 | 横河電機株式会社 | 波形表示装置および波形表示方法 |
| US7107165B2 (en) * | 2003-11-19 | 2006-09-12 | Agilent Technologies, Inc. | Markers used in the calculation and display of band functions |
| JP4813774B2 (ja) * | 2004-05-18 | 2011-11-09 | テクトロニクス・インターナショナル・セールス・ゲーエムベーハー | 周波数分析装置の表示方法 |
| US7751470B2 (en) * | 2005-02-07 | 2010-07-06 | Tektronix, Inc. | Time correlation of signal power to distortion characteristics |
| JP4647570B2 (ja) * | 2006-10-04 | 2011-03-09 | セコム株式会社 | 盗撮検出装置 |
| JP5085105B2 (ja) * | 2006-11-24 | 2012-11-28 | テクトロニクス・インターナショナル・セールス・ゲーエムベーハー | シグナル・アナライザ |
| JP5220320B2 (ja) * | 2007-01-22 | 2013-06-26 | アンリツ株式会社 | 信号解析装置及び信号解析方法 |
| JP2009186323A (ja) * | 2008-02-06 | 2009-08-20 | Advantest Corp | 周波数特性測定装置 |
| US8464171B2 (en) * | 2009-06-26 | 2013-06-11 | Eppendorf Ag | Device for displaying a function chart |
| JP4929362B2 (ja) * | 2010-02-12 | 2012-05-09 | 株式会社東芝 | 電子機器、画像表示システム、および画像表示方法 |
| JP5620356B2 (ja) * | 2011-10-26 | 2014-11-05 | アンリツ株式会社 | 測定装置 |
| JP5632348B2 (ja) * | 2011-10-26 | 2014-11-26 | アンリツ株式会社 | 測定装置 |
| JP5620355B2 (ja) * | 2011-10-26 | 2014-11-05 | アンリツ株式会社 | 測定装置 |
| JP5632349B2 (ja) * | 2011-10-26 | 2014-11-26 | アンリツ株式会社 | 測定装置 |
| CN104303113A (zh) * | 2012-05-17 | 2015-01-21 | 三菱电机株式会社 | 伺服参数调整装置 |
| US9858240B2 (en) * | 2012-12-13 | 2018-01-02 | Tektronix, Inc. | Automatic center frequency and span setting in a test and measurement instrument |
| CN103901274A (zh) * | 2012-12-31 | 2014-07-02 | 特克特朗尼克公司 | 具有缩放显示的实时谱分析仪 |
| US10712367B2 (en) * | 2016-11-08 | 2020-07-14 | Rohde & Schwarz Gmbh & Co. Kg | Method for analyzing a signal as well as measurement and analyzing device |
| JP7074501B2 (ja) * | 2018-02-27 | 2022-05-24 | 日置電機株式会社 | 波形表示装置および波形表示方法 |
| CN110333071B (zh) * | 2019-06-28 | 2021-09-10 | 华北电力大学 | 一种利用窄带倒谱变换的机械振动信号处理方法 |
| CN117368571B (zh) * | 2023-12-08 | 2024-03-01 | 深圳市鼎阳科技股份有限公司 | 一种实时频谱分析仪及其数据处理方法 |
Family Cites Families (8)
| Publication number | Priority date | Publication date | Assignee | Title |
|---|---|---|---|---|
| US4264958A (en) | 1978-08-10 | 1981-04-28 | Hewlett-Packard Company | Video processor for a spectrum analyzer |
| US4321680A (en) * | 1980-04-22 | 1982-03-23 | Wavetek Rockland Inc. | Spectrum analyzer with frequency band selection |
| JPS5995472A (ja) * | 1982-11-25 | 1984-06-01 | Sony Tektronix Corp | 波形表示装置 |
| JPH0769364B2 (ja) * | 1987-03-06 | 1995-07-31 | アンリツ株式会社 | スペクトラムアナライザ |
| US4839582A (en) * | 1987-07-01 | 1989-06-13 | Anritsu Corporation | Signal analyzer apparatus with automatic frequency measuring function |
| JP2577566B2 (ja) * | 1987-07-01 | 1997-02-05 | アンリツ株式会社 | スペクトラムアナライザ |
| US4890236A (en) * | 1988-04-01 | 1989-12-26 | Hewlett-Packard Company | Method and apparatus for aiding manual instrument settings by displaying estimates of future measurement results |
| US4975636A (en) * | 1989-05-01 | 1990-12-04 | Hewlett-Packard Company | Method and apparatus for selecting and displaying a high resolution window from a main display |
-
1990
- 1990-01-25 JP JP2015434A patent/JP2891497B2/ja not_active Expired - Lifetime
-
1991
- 1991-01-22 US US07/644,220 patent/US5075618A/en not_active Expired - Lifetime
- 1991-01-23 DE DE69127836T patent/DE69127836T2/de not_active Expired - Fee Related
- 1991-01-23 EP EP91100854A patent/EP0439157B1/de not_active Expired - Lifetime
Cited By (9)
| Publication number | Priority date | Publication date | Assignee | Title |
|---|---|---|---|---|
| EP0473949A3 (en) * | 1990-09-04 | 1992-08-19 | Rohde & Schwarz Gmbh & Co. Kg | Analysator, especially network analysator for the frequency selective measurement and display of frequency dependant measuring parameters |
| WO1997017617A1 (en) * | 1995-11-07 | 1997-05-15 | Emscan Corporation | Method and apparatus for high-speed scanning of electromagnetic emission levels |
| US6268738B1 (en) | 1995-11-07 | 2001-07-31 | Emscan Corporation | Method and apparatus for high-speed scanning of electromagnetic emission levels |
| EP0981054A3 (de) * | 1998-08-10 | 2001-08-22 | Sony/Tektronix Corporation | Breitband-Signalanalysator |
| US6356067B1 (en) | 1998-08-10 | 2002-03-12 | Sony/Tektronix Corporation | Wide band signal analyzer with wide band and narrow band signal processors |
| EP2128634A1 (de) * | 2008-05-26 | 2009-12-02 | Sistemas Integrados de Servicios de Telecontrol, S.L. | Rundfunk- und/oder Fernsignal-Meßgerät |
| EP2667203A1 (de) * | 2012-05-22 | 2013-11-27 | Tektronix, Inc. | Automatische Leistungs-Erkennung innerhalb eines Bandes aber außerhalb eines Bereichs in einem Prüf- und messinstrument für den Frequenzbereich |
| US9207269B2 (en) | 2012-05-22 | 2015-12-08 | Tektronix, Inc. | Automatically detecting in-band but out-of-span power in a frequency-domain test and measurement instrument |
| EP2743709A1 (de) * | 2012-12-11 | 2014-06-18 | Tektronix Inc. | Echtzeit-Spektrumanalysator mit Zoomanzeige |
Also Published As
| Publication number | Publication date |
|---|---|
| DE69127836T2 (de) | 1998-05-20 |
| JPH03220464A (ja) | 1991-09-27 |
| EP0439157A3 (en) | 1992-05-13 |
| US5075618A (en) | 1991-12-24 |
| EP0439157B1 (de) | 1997-10-08 |
| JP2891497B2 (ja) | 1999-05-17 |
| DE69127836D1 (de) | 1997-11-13 |
Similar Documents
| Publication | Publication Date | Title |
|---|---|---|
| EP0439157B1 (de) | Spektralanalysator zur gleichzeitigen Anzeige von Breit- und Schmalbandübertragungscharakteristiken | |
| EP0664459B1 (de) | Anzeigevorrichtung zur einfachen Beobachtung von Signalverläufen bei hoher Auflösung | |
| US5579463A (en) | Waveform display apparatus of frequency sweep type for facilitating display of a high definition waveform | |
| US5617523A (en) | Waveform display apparatus for easily realizing high-definition waveform observation | |
| EP0297590B1 (de) | Signalanalysator mit automatischer Frequenzmesseinrichtung | |
| US5136267A (en) | Tunable bandpass filter system and filtering method | |
| EP0220895A2 (de) | Signalgeneratoren | |
| EP0297589B1 (de) | Signalanalysator mit analoger Teilabtastfunktion | |
| US5736845A (en) | Spectrum analyzer having image frequency eliminating device | |
| JPH0544989B2 (de) | ||
| JP3340654B2 (ja) | スペクトラムアナライザ | |
| JPH02280066A (ja) | 周波数掃引型スペクトラム・アナライザの実応答及びスプリアス応答識別方法 | |
| GB2231737A (en) | Frequency sweep generator linearization | |
| EP0368581A1 (de) | Verfahren zum Kompensieren von Frequenzfehlern in Rauschleistungsmessgeräten | |
| EP0217967B1 (de) | Vorrichtung und gerät zur signalmessung nach der frequenzüberlagerungsmethode mit mitteln zur automatischen korrektur der verstimmung | |
| JPH08233875A (ja) | イメージ周波数除去装置及びこれを用いたスペクトラムアナライザ | |
| US6418162B1 (en) | Frequency spectrum measurement apparatus | |
| JP2909688B2 (ja) | 波形解析装置 | |
| JP3901908B2 (ja) | 受信装置 | |
| JPH0619395B2 (ja) | スペクトラムアナライザ | |
| JPH0233762Y2 (de) | ||
| JP2832750B2 (ja) | 受信装置 | |
| JP3028388B2 (ja) | 電子回路の周波数特性測定装置 | |
| SU1264110A1 (ru) | Устройство дл определени расстройки контура резонансного датчика | |
| JPS639625B2 (de) |
Legal Events
| Date | Code | Title | Description |
|---|---|---|---|
| PUAI | Public reference made under article 153(3) epc to a published international application that has entered the european phase |
Free format text: ORIGINAL CODE: 0009012 |
|
| 17P | Request for examination filed |
Effective date: 19910123 |
|
| AK | Designated contracting states |
Kind code of ref document: A2 Designated state(s): DE FR GB |
|
| PUAL | Search report despatched |
Free format text: ORIGINAL CODE: 0009013 |
|
| AK | Designated contracting states |
Kind code of ref document: A3 Designated state(s): DE FR GB |
|
| 17Q | First examination report despatched |
Effective date: 19940118 |
|
| GRAG | Despatch of communication of intention to grant |
Free format text: ORIGINAL CODE: EPIDOS AGRA |
|
| GRAH | Despatch of communication of intention to grant a patent |
Free format text: ORIGINAL CODE: EPIDOS IGRA |
|
| GRAH | Despatch of communication of intention to grant a patent |
Free format text: ORIGINAL CODE: EPIDOS IGRA |
|
| GRAA | (expected) grant |
Free format text: ORIGINAL CODE: 0009210 |
|
| AK | Designated contracting states |
Kind code of ref document: B1 Designated state(s): DE FR GB |
|
| REF | Corresponds to: |
Ref document number: 69127836 Country of ref document: DE Date of ref document: 19971113 |
|
| ET | Fr: translation filed | ||
| PLBE | No opposition filed within time limit |
Free format text: ORIGINAL CODE: 0009261 |
|
| STAA | Information on the status of an ep patent application or granted ep patent |
Free format text: STATUS: NO OPPOSITION FILED WITHIN TIME LIMIT |
|
| 26N | No opposition filed | ||
| PGFP | Annual fee paid to national office [announced via postgrant information from national office to epo] |
Ref country code: FR Payment date: 20001211 Year of fee payment: 11 |
|
| PGFP | Annual fee paid to national office [announced via postgrant information from national office to epo] |
Ref country code: GB Payment date: 20010118 Year of fee payment: 11 |
|
| REG | Reference to a national code |
Ref country code: GB Ref legal event code: IF02 |
|
| PG25 | Lapsed in a contracting state [announced via postgrant information from national office to epo] |
Ref country code: GB Free format text: LAPSE BECAUSE OF NON-PAYMENT OF DUE FEES Effective date: 20020123 |
|
| GBPC | Gb: european patent ceased through non-payment of renewal fee |
Effective date: 20020123 |
|
| PG25 | Lapsed in a contracting state [announced via postgrant information from national office to epo] |
Ref country code: FR Free format text: LAPSE BECAUSE OF NON-PAYMENT OF DUE FEES Effective date: 20020930 |
|
| REG | Reference to a national code |
Ref country code: FR Ref legal event code: ST |
|
| PGFP | Annual fee paid to national office [announced via postgrant information from national office to epo] |
Ref country code: DE Payment date: 20030327 Year of fee payment: 13 |
|
| PG25 | Lapsed in a contracting state [announced via postgrant information from national office to epo] |
Ref country code: DE Free format text: LAPSE BECAUSE OF NON-PAYMENT OF DUE FEES Effective date: 20040803 |