EP2472247A1 - Dispositif de commande d'affichage - Google Patents
Dispositif de commande d'affichage Download PDFInfo
- Publication number
- EP2472247A1 EP2472247A1 EP10811722A EP10811722A EP2472247A1 EP 2472247 A1 EP2472247 A1 EP 2472247A1 EP 10811722 A EP10811722 A EP 10811722A EP 10811722 A EP10811722 A EP 10811722A EP 2472247 A1 EP2472247 A1 EP 2472247A1
- Authority
- EP
- European Patent Office
- Prior art keywords
- display
- unit
- microorganisms
- particles
- detection
- Prior art date
- Legal status (The legal status is an assumption and is not a legal conclusion. Google has not performed a legal analysis and makes no representation as to the accuracy of the status listed.)
- Withdrawn
Links
Images


Classifications
-
- C—CHEMISTRY; METALLURGY
- C12—BIOCHEMISTRY; BEER; SPIRITS; WINE; VINEGAR; MICROBIOLOGY; ENZYMOLOGY; MUTATION OR GENETIC ENGINEERING
- C12Q—MEASURING OR TESTING PROCESSES INVOLVING ENZYMES, NUCLEIC ACIDS OR MICROORGANISMS; COMPOSITIONS OR TEST PAPERS THEREFOR; PROCESSES OF PREPARING SUCH COMPOSITIONS; CONDITION-RESPONSIVE CONTROL IN MICROBIOLOGICAL OR ENZYMOLOGICAL PROCESSES
- C12Q1/00—Measuring or testing processes involving enzymes, nucleic acids or microorganisms; Compositions therefor; Processes of preparing such compositions
- C12Q1/02—Measuring or testing processes involving enzymes, nucleic acids or microorganisms; Compositions therefor; Processes of preparing such compositions involving viable microorganisms
- C12Q1/04—Determining presence or kind of microorganism; Use of selective media for testing antibiotics or bacteriocides; Compositions containing a chemical indicator therefor
- C12Q1/06—Quantitative determination
-
- G—PHYSICS
- G01—MEASURING; TESTING
- G01N—INVESTIGATING OR ANALYSING MATERIALS BY DETERMINING THEIR CHEMICAL OR PHYSICAL PROPERTIES
- G01N15/00—Investigating characteristics of particles; Investigating permeability, pore-volume or surface-area of porous materials
- G01N15/02—Investigating particle size or size distribution
- G01N15/0205—Investigating particle size or size distribution by optical means
- G01N15/0211—Investigating a scatter or diffraction pattern
Definitions
- the present invention relates to a display control device and, more specifically, to a display control device for displaying information related to environment.
- Patent Literature 1 discloses a pollution state display device that detects amount of dust in air by a dust sensor and giving stepwise display of degree of air pollution.
- the device according to Patent Literature 1 only displays the amount of dust as information related to environment. It is noted, however, that not only the amount of dust but also amount of microorganisms, temperature, humidity, climate, and weather may be used as indexes for determining the environmental state including risk of catching a cold or risk of mold development.
- the environmental status can be determined with high accuracy if these indexes are generally utilized. Therefore, there is a problem that a user cannot appropriately determine the environmental status from the display of the device of Patent Literature 1. Further, if the user does not have knowledge to determine the environmental status using these pieces of information as indexes, he/she cannot appropriately determine the environmental status.
- the present invention was made in view of the foregoing, and one of its objects is to provide a display control device that displays information related to environment in an easy-to-understand manner.
- the present invention provides a display control device, including: a first input unit for receiving an input of detection result related to amount of microorganisms in the air from a detection apparatus; and a computing device; wherein the computing device executes a computing process for obtaining a relative value of the amount of microorganisms detected by the detection apparatus with respect to a predetermined amount of microorganisms, and a display process for causing a display device to give a first display representing the amount of microorganisms detected by the detection apparatus in an area corresponding to the relative value, in a first display area representing the predetermined amount of microorganisms.
- a display control device includes: a first input unit for receiving an input of detection result related to amount of microorganisms in the air from a detection apparatus; and a computing device; wherein the computing device executes a process for determining a message to be displayed at least based on the detection result received by the first input unit, and a process for generating display data causing the display device to display an image including the message.
- the detection apparatus includes a light emitting element, a light receiving element having a light receiving direction at a prescribed angle to direction of irradiation of the light emitting element, and a processing device for processing amount of light received by the light receiving element as a detection signal; and the processing device includes an input unit for receiving an input of the amount of light received by the light receiving element as a detection signal, and a storage unit, and executes a process for comparing the detection signal with an arbitrary condition, for determining whether or not detected object is a microorganism, and a process for writing result of the determination in the storage unit.
- the first input unit includes a communication unit for communication with the detection apparatus; and the computing device includes a communication unit for communication with the display device.
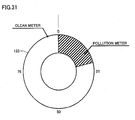
- the first input unit further receives an input of result of detection of amount of particles other than microorganisms in the air from the detection apparatus; the computing device further executes a computing process for obtaining relative value of the amount of particles detected by the detection apparatus with respect to a predetermined amount of the particles other than microorganisms; and in the first display, a total sum of the predetermined amount of the microorganisms and the predetermined amount of the particles other than microorganisms is represented in the first display area, and the amount of particles is represented in an area corresponding to the relative value of the amount of particles other than microorganisms in the first display area.
- the computing device causes the display device, by the display process, to give a second display representing amount of particles in the air in an area corresponding to relative values of the microorganisms and the particles other than microorganisms in a second display area representing total sum of the predetermined amounts, together with the first display.
- the display control device further includes a second input unit for receiving an input of information related to environment from another device; and the computing device causes the display device, by the display process, to give a third display representing the information related to environment, together with the first display.
- the display control device further includes a second input unit for receiving an input of information related to environment from another device; and in the process for determining a message to be displayed, the computing device determines a message to be displayed based on the detection result received by the first input unit and on the value received by the second input unit.
- the display control device further includes a storage device for storing at least correspondence relation between the detection result received by the first input unit and a message to be displayed.
- the image includes the message and the detection result received by the first input unit.
- the first input unit further receives input of detection result of amount of particles other than microorganism in the air from the detection apparatus.
- the user can easily grasp pieces of information of different types related to environment by the display.
- the air purifier functions as a display control device.
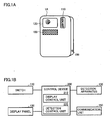
- an air purifier 1 serving as the display control device includes a switch 110 for accepting an operation instruction, a display panel 130 for displaying a detection result and others, and a detection apparatus 100 functioning as a microorganism sensor for detecting microorganisms from airborne particles, as will be described later.
- a detection apparatus 100 functioning as a microorganism sensor for detecting microorganisms from airborne particles, as will be described later.
- Air purifier 1 may further include a communication unit 150 for communication with other equipment.
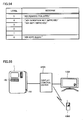
- air purifier 1 further includes a control device 200.
- Control device 200 includes a CPU (Central Processing Unit) and a memory, not shown. The CPU reads and executes a program or programs stored in the memory in accordance with an instruction signal from switch 110. Thus, display on display panel 130, control of detection apparatus 100, and control of communication unit 150 are realized.
- control device 200 includes a display control unit 210 for controlling display on display panel 130, and a detection control unit 220 for controlling detection apparatus 100.
- Display control unit 210 and detection control unit 220 may be functions realized mainly by the CPU as it executes programs, or they may be functions realized by hardware such as electric circuits.
- Detection apparatus 100 detects amount of airborne biological particles.
- biological particles are represented by microorganisms (including dead bodies) of bacteria or the like in the following description, the particles refer to any particles that perform vital action or a part or parts thereof, dead or alive, having the size small enough to be airborne, not limited to microorganisms.
- microorganisms including dead body
- pollen pollen
- mites mites and their dead bodies
- the term “microorganisms” represents the “particles of biological origin” including pollen and other particles.
- first to third examples will be referred to as examples of detection apparatus 100.
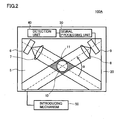
- Fig. 2 shows the first example of detection apparatus 100.
- detection apparatus 100A in accordance with the first example has a case 5 provided with an inlet 10 for introducing the air through the suction opening and an outlet, not shown, and also includes a sensor 20, a signal processing unit 30 and a detecting unit 40 which are located inside case 5.
- Detection apparatus 100A includes an introducing mechanism 50.
- Introducing mechanism 50 introduces the air through the suction opening into case 5 at a predetermined flow rate.
- introducing mechanism 50 may be a fan or a pump arranged outside case 5 as well as a drive mechanism for it, or the like. Further, it may be a thermal heater, a micro-pump or a micro-fan arranged in case 5 as well as a drive mechanism for it, or the like. Further, introducing mechanism 50 may have a configuration shared with an air introducing mechanism of the air cleaning device portion in the air purifier.
- Detection control unit 220 controls the drive mechanism included in introducing mechanism 50 to control the flow rate of the introduced air.
- the flow rate at which introducing mechanism 50 introduces the air is not restricted to a predetermined flow rate.
- Detection apparatus 100 converts a current signal provided from a light receiving element 9 into sizes of suspended particles in a manner to be described later, and therefore the flow rate must be controlled to fall within a range not exceeding an excessive value for allowing such conversion.
- the flow rate of the introduced air is in a range from 0.01 lit/min to 10 lit/min.
- Sensor 20 includes a light emitting element 6 that is a light source, a lens 7 that is arranged in a radiation direction of light emitting element 6 for changing the light beams radiated from light emitting element 6 into parallel light beams or light beams having a predetermined width, light receiving element 9, and a collecting lens 8 that is arranged in a light receiving direction of light receiving element 9 for condensing, on light receiving element 9, scattered light occurring from the parallel light beams due to suspended particles in the air.
- a light emitting element 6 that is a light source
- a lens 7 that is arranged in a radiation direction of light emitting element 6 for changing the light beams radiated from light emitting element 6 into parallel light beams or light beams having a predetermined width
- light receiving element 9 and a collecting lens 8 that is arranged in a light receiving direction of light receiving element 9 for condensing, on light receiving element 9, scattered light occurring from the parallel light beams due to suspended particles in the air.
- Light emitting element 6 includes a semiconductor laser or an LED (Light Emitting Diode) element.
- the wavelength may be in any of ultraviolet, visible and near-infrared ranges.
- Light receiving element 9 may be a conventional element such as a photodiode or an image sensor.
- Each of lens 7, which is a collimate lens, and collecting lens 8 may be made of plastic resin or glass.
- the width of the parallel light beams produced by lens 7 is not restricted to a specific value, but is preferably in a range from about 0.05 mm to about 5 mm.
- an optical filter for filtering out fluorescence that is emitted from suspended particles of biological origin is arranged before collecting lens 8 or light receiving element 9 so that the fluorescence may not enter light receiving element 9.
- Case 5 has a rectangular parallelepiped shape with the length of each side being 3mm to 500mm.
- case 5 has a rectangular parallelepiped shape in the present embodiment, the shape is not limited, and the case may have a different shape.
- at least the inner side is painted black or treated with black alumite. This prevents reflection of light from the inner wall surface as a cause of stray light.
- the material of case 5 is not specifically limited, preferably, plastic resin, metal such as aluminum or stainless steel or a combination of these may be used.
- Inlet 10 and outlet of case 5 have circular shape with the diameter of 1mm to 50mm. The shape of inlet 10 and outlet is not limited to a circle, and it may be an ellipse or a rectangle.
- Light emitting element 6 and lens 7 as well as light receiving element 9 and collecting lens 8 are arranged such that the radiation direction of the light beams emitted by light emitting element 6 and collimated by lens 7 keeps a predetermined angle ⁇ with respect to the direction in which light receiving element 9 can receive the light condensed by collecting lens 8. Further, they are angularly arranged such that the air moving from inlet 10 to the outlet may flow through a region 11 in Fig. 2 where the radiation region of the light emitted by light emitting element 6 and collimated by lens 7 overlaps a reception region where light receiving element 9 can receive the light condensed by collecting lens 8.
- Fig. 2 shows an example of the positional relationship where the angle ⁇ is about 60 degrees and region 11 is located in front of inlet 10. The angle ⁇ is not restricted to 60 degrees, and may be of another value.
- Light receiving element 9 is connected to signal processing unit 30, and provides a current signal proportional to an amount of the received light to signal processing unit 30.
- the light radiated from light emitting element 6 is scattered by the particles that are suspended in the air and are being moved in region 11 at a predetermined flow rate by introducing mechanism 50 from inlet 10 to the outlet.
- Signal processing unit 30 is connected to detecting unit 40, and provides a result of its processing performed on the pulse-like current signal to detecting unit 40. Based on the processing result provided from signal processing unit 30, detecting unit 40 performs the processing for detecting microorganisms from airborne particles and outputting the results of detection.
- a detection principle of detection apparatus 100A is described below.
- An intensity of the light scattered by the suspended particles in the air depends on the size and the refraction factor of the suspended particles. Since the microorganisms that are the suspended particles of biological origin have cells filled with liquid similar to water, the microorganisms can be approximated as transparent particles having the refraction factor close to that of the water. Assuming that the suspended particles of biological origin have the refraction factor close to that of the water, detection apparatus 100A utilizes the difference which appears in scattering intensity at a specific scattering angle of the radiated light between the suspended particles of biological origin and the dust particles of the same sizes, and thereby discriminates between the suspended particles of biological origin and the other suspended particles for detecting the former.
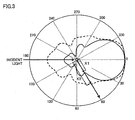
- Fig. 3 shows a simulation result in which scattering intensity is plotted with various scattering angles in connection with spherical particles of 1 micron in diameter, and particularly in connection with particles of 1.3 in refraction factor close to that of the water and those of 1.6 in refraction factor different from that of water.
- thick line represents a result of simulation relating to the scattering intensity of the particles of 1.3 in refraction factor
- dotted line represents a result of simulation relating to the scattering intensity of the particles of 1.6 in refraction factor.
- a discriminative difference is present between a scattering intensity X1 of the particles exhibiting the refraction factor of 1.3, i.e., the particles of biological origin and a scattering intensity X2 of the particles exhibiting the refraction factor of 1.6 that are assumed as representative dust.
- the scattering intensities at the scattering angle of 60 degrees of the spherical particles having a diameter of 1 micron can be determined such that the particles exhibiting the scattering intensities smaller than the boundary value are of biological origin, and the particles of larger scattering intensities are the dust particles.
- Detection apparatus 100A applies this principle to the suspended particles in the introduced air to discriminate between the suspended particles of biological origin and other particles. For this, boundary values for discriminating between the suspended particles of biological origin and the other suspended particles are set in advance in detection apparatus 100A for various particle sizes, respectively. Detection apparatus 100 measures the sizes of the suspended particles in the introduced air as well as the scattering intensities, and determines that these are the particles of biological origin when the measured scattering intensity is smaller than the boundary value already set with respect to the measured size, and otherwise determines that the particles are the dust particles.
- Detection apparatus 100A can detect the sizes of the suspended particles in the introduced air, using the following principle.
- the speed of the suspended particles in the air flowing at a certain speed decreases with increase in size of the suspended particles, as is well known.
- Light receiving element 9 of detection apparatus 100A receives the scattered light that is generated by the suspended particles when the suspended particles moving at a certain flow rate move across the light radiated from light emitting element 6. Accordingly, the current signal issued from light receiving element 9 takes a pulse-like form, of which pulse width correlates with the time for which the suspended particle moves across the radiated light.
- the pulse width of the issued current signal is converted into the size of the suspended particle.
- detection control unit 220 controls the flow rate of the air introduced by introducing mechanism 50 to attain an unexcessive speed so that the pulse width of the current signal provided from light receiving element 9 may reflect the size of the suspended particle.
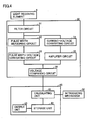
- FIG. 4 shows an example in which the functions of signal processing unit 30 are implemented by hardware configuration mainly of electric circuitry. However, at least part of the functions may be implemented by software configuration realized by a CPU, not shown, provided in signal processing unit 30, executing a predetermined program.
- the structure of detecting unit 40 is a software structure. However, a hardware structure such as an electric circuit may implement at least a part of such function.
- signal processing unit 30 includes a pulse width measuring circuit 32 connected to light receiving element 9, a pulse width-voltage conversion circuit 33 connected to pulse width measuring circuit 32, a current-voltage conversion circuit 34 connected to light receiving element 9, an amplifier circuit 35 connected to current-voltage conversion circuit 34 and a voltage comparison circuit 36 connected to pulse width-voltage conversion circuit 33 and amplifier circuit 35.
- a filter circuit 31 for removing signals of current values smaller than a preset value is arranged between light receiving element 9 on one side and pulse width measuring circuit 32 and current-voltage conversion circuit 34 on the other side. The provision of filter circuit 31 can reduce noise components in the detection signal of light receiving element 9 due to stray light.
- Detecting unit 40 includes a calculating unit 41, a storage unit 42 and an output unit 43 for outputting the result of detection.
- light receiving element 9 collects the light scattered by the suspended particles in region 11 shown in Fig. 2 .
- Light receiving element 9 provides the pulse-like current signal shown in Fig. 5 and corresponding to the amount of received light to signal processing unit 30.
- the current signal is provided to pulse width measuring circuit 32 and current-voltage conversion circuit 34 of signal processing unit 30.
- the signals of the current values smaller than the preset value are filtered out by filter circuit 31.
- Current-voltage conversion circuit 34 detects a peak current value H representing the scattering intensity from the current signal provided from light receiving element 9, and converts it into a voltage value Eh.
- Amplifier circuit 35 amplifies voltage value Eh with a preset amplification factor, and provides it to voltage comparison circuit 36.
- Pulse width measuring circuit 32 measures a pulse width W of the current signal provided from light receiving element 9.
- the method of measuring the pulse width or the value related to it by pulse width measuring circuit 32 is not restricted to a specific method, and may be a well-known signal processing method. By way of example, description will be made on a measuring method in the case where a differentiation circuit (not shown) is arranged in pulse width measuring circuit 32. When the pulse-like electric signal is applied, the differentiation circuit generates a certain voltage determined corresponding to the initial pulse signal, and this voltage will return to zero in response to a next pulse signal. Pulse width measuring circuit 32 measures a time between the rising and the falling of the voltage signal that occurs in the differentiation circuit, and can use it as the pulse width.
- pulse width W may be a width between peaks of a differentiation curve that is obtained using the differentiation circuit, as represented, e.g., by dotted line in Fig. 5 .
- pulse width W may be an interval between halves of the peak voltage values of the pulse waveform, i.e., may be a half-value width, and also may be an interval between the rising and falling of the pulse waveform.
- the signal indicative of pulse width W that is measured according to one of these or other methods is provided to pulse width-voltage conversion circuit 33.
- a voltage value Ew to be used as a boundary value of the scattering intensity for determining whether the suspended particles are of biological origin or not is set in advance for each pulse width W.
- Pulse width-voltage conversion circuit 33 converts pulse width W provided thereto into voltage value Ew according to the above setting.
- the correlation between pulse width W and voltage value Ew may be set as a function or a coefficient, and may also be set in a table.
- Voltage value Ew is output to voltage comparing circuit 36.
- Voltage value Ew that is the boundary value corresponding to pulse width W is experimentally determined in advance.
- one type of microorganism such as Escherichia coli, Bacillius subtilis or Penicillium is sprayed using a nebulizer in a vessel having the size of 1m 3 , and detection apparatus 100 measures the pulse width and the scattering intensity (peak voltage value) from the current signal provided from light receiving element 9.
- polystyrene particles having uniform sizes are used in place of dust, and detection apparatus 100 measures the pulse width and the scattering intensity (peak voltage value).
- FIG. 6 is a diagram prepared by plotting the scattering intensities (peak voltage values) with respect to the pulse widths, and particularly the scattering intensities that are obtained by detection apparatus 100 from the microorganisms and the polystyrene particles.
- the scattering intensities that are correlated to the pulse widths obtained from the polystyrene particles are plotted.
- the scattering intensities that are correlated to the pulse widths obtained primarily from the microorganisms are plotted. In practice, these plotted intensities partially overlap in these regions and are mixed with each other to some extent.
- regions 51 and 52 are experimentally obtained, the boundary between them is determined, e.g., as straight line 53.
- a function or a coefficient representing straight line 53 is set in pulse width-voltage conversion circuit 33.
- the correlation that is present between pulse width W and voltage value Ew and is represented by straight line 53 may be set in voltage comparison circuit 36 by detection control unit 220.
- communication unit 150 may read such information from a recording medium recording correlation between pulse width W and voltage value Ew, and the correlation may be set by detection control unit 220.
- communication unit 150 may receive the correlation from a PC connected to a dedicated line or other device communicating through the Internet or infrared ray, and the correlation may be set by detection control unit 220. Further, the correlation between pulse width W and voltage value Ew once set in voltage comparing circuit 36 may be updated by detection control unit 220.
- Voltage comparison circuit 36 makes a comparison between voltage value Eh that is provided from current-voltage conversion circuit 34 through amplifier circuit 35 and is indicative of the scattering intensity and voltage value Ew that is provided from pulse width-voltage conversion circuit 33 and is the boundary value corresponding to pulse width W. Based on this comparison, voltage comparison circuit 36 determines whether the suspended particles that cause the scattered light received by light receiving element 9 are of biological origin or not, i.e., are microorganisms or not.
- pulse width-voltage conversion circuit 33 converts pulse width r1 into a voltage value Y3 based on the correlation represented by straight line 53 that has been set.
- Voltage comparison circuit 36 receives peak voltage values Y2 and voltage value Y3, and makes a comparison between them. Since peak voltage value Y1 is smaller than voltage value Y3 that is the boundary value, it is determined that particle P1 is of biological origin, i.e., that it is a microorganism.
- pulse width-voltage conversion circuit 33 converts pulse width r2 into voltage value Y2 based on the correlation represented by straight line 53 that has been set.
- Voltage comparison circuit 36 receives peak voltage value Y4 and voltage value Y2, and makes a comparison between them. Since peak voltage value Y4 is larger than voltage value Y2 that is the boundary value, it is determined that particle P2 is not of biological origin.
- Voltage comparison circuit 36 performs the determination based on the light scattered by the suspended particle every time the particle moves across the light emitted by light emitting element 6, and provides the signal indicative of the determination result to detecting unit 40.
- Calculating unit 41 of detecting unit 40 accepts the input of the determination results provided from voltage comparison circuit 36, and successively stores them in storage unit 42.
- Calculating unit 41 performs calculation on the determination result that is obtained for a predetermined detection time and is stored in storage unit 42, and specifically it counts the input of signals indicative of the determination result that the suspended particle of the measurement target is a microorganism, and/or counts the input of signals indicative of the determination result other than the above.
- Calculating unit 41 reads the flow rate of the air introduced through introducing mechanism 50, and multiplies it by the above detection time to obtain a quantity Vs of the air introduced into case 5 for the above detection time. Calculating unit 41 obtains, as the measurement result, a concentration Ns/Vs of the microorganisms or a concentration Nd/Vs of the dust particles by dividing the result of the above counting, i.e., a number Ns of the microorganisms or a number Nd of the dust particles by air quantity Vs.
- the number of microorganisms Ns and the number of dust particles Nd counted in the detection time period as the results of detection, the calculated concentration of microorganisms Ns/Vs and the concentration of dust particles Nd/Vs are stored in storage unit 42.
- the results of detection are output by output unit 43 to display control unit 210.
- the timing of output from output unit 43 may be prescribed time interval set in advance, or timing requested by display control unit 210.
- the detection method in Fig. 7 is implemented by such operations that signal processing unit 30 and detecting unit 40 receive a control signal from an arithmetic unit such as a CPU which is included in detection apparatus 100A but is not shown in the figure, and thereby the various circuits and functions illustrated in Fig. 4 are implemented according to the received control signal.
- signal processing unit 30 and detecting unit 40 receive a control signal from an arithmetic unit such as a CPU which is included in detection apparatus 100A but is not shown in the figure, and thereby the various circuits and functions illustrated in Fig. 4 are implemented according to the received control signal.
- the suspended particles carried by the moving air move across the light radiated from light emitting element 6.
- the current signal that is caused by the scattered light generated by the suspended particles is provided from light receiving element 9 to signal processing unit 30 through filter circuit 31 at a step (which will be simply expressed as "S" hereinafter) 101
- pulse width measuring circuit 32 detects a pulse width W of this pulse-like current signal at S03.
- pulse width-voltage conversion circuit 33 converts pulse width W detected at S03 into the boundary value, i.e., voltage value Ew based on the correlation that is set in advance.
- current-voltage conversion circuit 34 detects peak current value H indicative of the scattering intensity from the pulse-like current signal that is provided from light receiving element 9 in S01, and converts it into peak voltage value Eh.
- the order of steps S03 - S07 is not restricted to the above order.
- Amplifier circuit 35 amplifies voltage value Eh obtained at S07 at a preset amplification factor and, at S09, voltage comparison circuit 36 compares it with voltage value Ew obtained at S05.
- voltage comparison circuit 36 determines that the suspended particles that generate the scattered light detected as the current signal in question are of biological origin, and the signal indicative of the result thereof is provided to detecting unit 40.
- the peak voltage value is larger than the boundary value (NO at S11)
- voltage comparison circuit 36 determines that the suspended particles are not of biological origin, and provides the signal indicative of the result to detecting unit 40.
- storage unit 42 of detecting unit 40 stores the result of detection provided from voltage comparison circuit 36 at S13 or S 15.
- calculating unit 41 performs the operation on the determination results that are obtained for the predetermined detection time and are stored in storage unit 42, and specifically counts the inputs of the determination result indicating that the suspended particles are of biological origin and/or the inputs of the determination result indicating that they are not of biological origin.
- the result of the former counting is handled as number Ns of the microorganisms, and the result of the latter counting is handled as number Nd of the dust particles.
- calculating unit 41 multiplies the above detection time by the flow rate of the air to obtain quantity Vs of the air introduced into case 5 for the above detection time.
- concentration Ns/Vs of the microorganisms or concentration Nd/Vs of the dust particles are obtained as the detection value.
- the detection value obtained at S 19 is output at S21 from output unit 43 at prescribed timing, to display control unit 210.
- detection apparatus 100A can separate the microorganisms among the suspended particles in the air from the dust and can accurately detect them in real time.
- Fig. 8A illustrates the second example of detection apparatus 100.
- detection apparatus 100B in accordance with the second example has a case 5 with an inlet 10 for introducing air from the suction opening and an outlet 11, and includes a sensor 20 including the case 5, a signal processing unit 30 and a detecting unit 40.
- components denoted by the same reference characters as in detection apparatus 100A of the first example are substantially the same as those of detection apparatus 100A and, in the following, the difference from detection apparatus 100A will be mainly described.
- an introducing mechanism 50 is provided, which introduces air from the suction opening to case 5.
- the flow rate of air introduced by introducing mechanism 50 is 1L (liter)/min to 50m 3 /min.
- Sensor 20 includes a detecting mechanism, a collecting mechanism and a heating mechanism.
- Fig. 8A shows, as an example of the collecting mechanism, a collecting mechanism including a discharge electrode 17, a collecting jig 12, and a high-voltage power supply 2.
- Discharge electrode 17 is electrically connected to a negative electrode of high-voltage power supply 2.
- the positive electrode of high-voltage power supply 2 is grounded.
- particles suspended in the introduced air are negatively charged near discharge electrode 17.
- Collecting jig 12 has a support board 4 formed, for example, of a glass plate, having a conductive, transparent coating 3. Coating 3 is grounded.
- the negatively charged particles suspended in the air move toward collecting jig 12 because of electrostatic force, and are attracted and held by conductive coating 3, whereby the particles are collected on collecting jig 12.
- Support board 4 is not limited to a glass plate and it may be formed of ceramic, metal or other materials. Coating 3 formed on support board 4 is not limited to a transparent coating. As another example, support board 4 may include an insulating material such as ceramic, and a metal coating formed thereon. When support board 4 is of metal material, formation of a coating on its surface is unnecessary. More specifically, support board 4 can be a silicon board, a SUS (stainless used steel) board, a copper board, or the like.
- the detecting mechanism includes: a light emitting element 6 as a light source; a lens (or lenses) 7, provided in the direction of light irradiation by emitting element 6, for collimating the light beams from light emitting element 6 or to adjust the light beams to a prescribed width; an aperture 13; a light receiving element 9; a collecting lens (or lenses) 8, provided in the direction of light reception by light receiving element 9, for collecting fluorescence generated by irradiation of airborne particles collected on collecting jig 12 by the collecting mechanism with light from light emitting element 6 to light receiving element 9; and a filter (or filters) 14 for preventing entrance of irradiating light beam to light receiving element 9.
- Aperture 13 is provided as needed. Conventional configurations may be applied to these components.
- Light emitting element 6 may include a semiconductor laser or an LED device.
- Wavelength of light may be in ultraviolet range or visible range, provided that the light can excite and cause fluorescent emission from microorganisms.
- Preferable wavelength is 300nm to 450nm, with which tryptophan, NaDH, riboflavin and the like included in microorganisms and emitting fluorescence are efficiently excited, as disclosed in Japanese Patent Laying-Open No. 2008-508527 .
- As light receiving element 9 conventional photo-diode, image sensor or the like is used.
- Each of lens 7 and collecting lens 8 may be formed of plastic resin or glass.
- lens 7 and aperture 13 By a combination of lens 7 and aperture 13, light beams emitted from light emitting element 6 are collected on a surface of collecting jig 12, and form an irradiation region 15 on collecting jig 12.
- the shape of irradiation region 15 is not specifically limited, and it may have a circular, elliptical or rectangular shape.
- the size of irradiation region 15 is not specifically limited, preferably, the diameter of a circle, the longer side length of an ellipse or the length of one side of a rectangle is in the range of about 0.05mm to 50 mm.
- Filter 14 is formed of a single filer or a combination of different types of filters, and placed in front of collecting lens 8 or light receiving element 9. This prevents stray light derived from light emitted from light emitting element 6 and reflected by collecting jig 12 and case 5 from entering light receiving element 9 together with the fluorescence from particles collected by collecting jig 12.
- the heating mechanism includes a heater 91 electrically connected to detecting unit 40 and having its amount of heating (heating time, heating temperature) controlled by detecting unit 40.
- Suitable heater 91 includes a ceramic heater. While in the following description, heater 91 is assumed as a ceramic heater, it may be a different heater, such as an infrared heater, an infrared lamp, or the like.
- Heater 91 is provided at a position that can heat the airborne particles collected on collecting jig 12 and separated by some means or other at least at the time of heating from sensor equipment including light emitting element 6 and light receiving element 9.
- the heater is arranged on a side away from the sensor equipment such as light emitting element 6 and light receiving element 9, with collecting jig 12 placed in between.
- heater 91 is separated by collecting jig 12 from the sensor equipment including light emitting element 6 and light receiving element 9, whereby influence of heat on light emitting element 6, light receiving element 9 and the like can be prevented.
- heater 91 is surrounded by heat insulating material as shown in Fig. 8B .
- Suitable heat insulating material includes glass epoxy resin.
- filter 14 is placed in front of light receiving element 9 and serves to prevent entrance of stray light to light receiving element 9.
- Fig. 9A is a cross-sectional view of detection apparatus 100B viewed from the position of A-A of Fig. 8A in the direction of the arrow
- Fig. 9B is a cross-sectional view taken from the position of B-B of Fig. 9A in the direction of the arrow.
- collecting mechanism other than collecting jig 12 is not shown.
- Fig. 9A when viewed from the direction of arrow A (top surface) of Fig. 8A , light emitting element 6 and lens 7 are arranged at a right angle or approximately at a right angle to light receiving element 9 and collecting lens 8.
- the light from light emitting element 6, passing through lens 7 and aperture 13 and reflected from irradiation region 15 formed on the surface of collecting jig 12 proceeds in the direction along the incident light. Therefore, by such a structure, direct entrance of the reflected light to light receiving element 9 is avoided.
- the fluorescence emitted from the surface of collecting jig 12 is isotropic and, therefore, the arrangement is not limited to the above as long as the entrance of reflected light and stray light to light receiving element 9 can be prevented.
- collecting jig 12 is provided with a configuration for collecting fluorescence emitted from particles trapped on the surface corresponding to irradiation region 15 to light receiving element 9.
- a configuration corresponds, for example, to a spherical recess 51 shown in Fig. 9B .
- collecting jig 12 is provided inclined by an angle ⁇ in a direction to light receiving element 9 so that the surface of collecting jig 12 faces light receiving element 9.
- the fluorescence isotropically emitted from the particles in spherical recess 51 is reflected on the spherical surface and effectively collected in the direction to light receiving element 9, whereby the light receiving signal can be intensified.
- the size of recess 51 is not limited, preferably, it is made larger than irradiation region 15.
- light receiving element 9 is connected to signal processing unit 30 and outputs a current signal in proportion to the intensity of received light to signal processing unit 30. Therefore, fluorescence emitted from the particles that have been suspended in the introduced air, collected to the surface of collecting jig and irradiated with light from light emitting element 6, is received by light receiving element 9 and the intensity of received light is detected by signal processing unit 30.
- inlet 10 and outlet 11 of case 5 are provided with shutters 16A and 16B, respectively.
- Shutters 16A and 16B are connected to detecting unit 40 and have their opening/closing controlled. When shutters 16A and 16B are closed, air flow and entrance of external light to case 5 are blocked. Detecting unit 40 closes shutters 16A and 16B at the time of fluorescence measurement as will be described later, to block air flow and entrance of external light to case 5. Consequently, at the time of fluorescence measurement, collection of airborne particles by the collecting mechanism is stopped. Further, since entrance of external light to case 5 is blocked, stray light in case 5 can be reduced. Provision of only one of shutters 16A and 16B, for example, only shutter 16B on the side of outlet 11 may suffice.
- light shielding portions 10A and 11A such as shown in Figs. 10A and 10B , may be provided on inlet 10 and outlet 11.
- light shielding portions 10A and 11A provided on inlet 10 and outlet 11 both have light shielding plates 10a and 10b overlapped alternately at an interval of about 4.5mm.
- Light shielding plates 10a and 10b have holes formed therein at portions not overlapping with each other, with the shape of holes corresponding to the shape of inlet 10 and outlet 11 (here, circular shape), such as shown in Figs. 10C and 10D , respectively.
- light shielding plate 10a has holes opened at the circumferential portions
- light shielding plate 10b has a hole opened at the center.
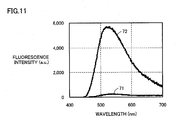
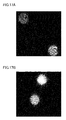
- Figs. 11 to 17 show specific results of measurement by the inventors. From the measurement results, the inventors found that the fluorescence intensity from dust did not change before and after heating, while fluorescence intensity emitted from microorganisms increased after heating.
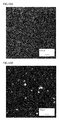
- Fig. 11 shows results of measurement of fluorescent spectra before (curve 71) and after (curve 72) heat treatment of Escherichia coli as biological particles at 200°C for 5 minutes. From the results of measurement shown in Fig. 11 , it can be seen that the fluorescence intensity from Escherichia coli increased significantly by the heat treatment. It is also apparent from the comparison between a fluorescent micrograph of Escherichia coli before heat treatment of Fig. 12A and a fluorescent micrograph of Escherichia coli after heat treatment of Fig. 12B that the fluorescence intensity from Escherichia coli increased significantly by the heat treatment.
- Fig. 13 shows results of measurement of fluorescent spectra before (curve 73) and after (curve 74) heat treatment of Bacillius subtilis as biological particles at 200°C for 5 minutes
- Fig. 14A is a fluorescent micrograph before heat treatment
- Fig. 14B is a fluorescent micrograph after heat treatment
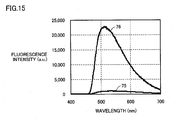
- Fig. 15 shows results of measurement of fluorescent spectra before (curve 75) and after (curve 76) heat treatment of Penicillium as biological particles at 200°C for 5 minutes
- Fig. 16A is a fluorescent micrograph before heat treatment and Fig. 16B is a fluorescent micrograph after heat treatment.
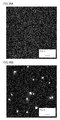
- 17A and 17B are fluorescent micrographs of cedar pollen as particles of biological origin before and after heat treatment, respectively, at 200°C for five minutes. As can be seen from these results, as in the case of Escherichia coli, the fluorescence intensity from particles of a different biological origin is also increased significantly by the heat treatment.
- Figs. 18A and 18B show results of measurement of fluorescent spectra before (curve 77) and after (curve 78) heat treatment of fluorescence-emitting dust at 200°C for 5 minutes
- Fig. 19A is a fluorescent micrograph before heat treatment
- Fig. 19B is a fluorescent micrograph after heat treatment.
- the above-described phenomenon verified by the inventors is applied. Specifically, dust, dust with microorganisms adhered, and microorganisms are suspended in the air. From the phenomenon described above, it follows that if collected particles include fluorescence-emitting dust, the fluorescent spectra measured before heat treatment include fluorescence from microorganisms and fluorescence from fluorescence-emitting dust and, therefore, it is impossible to distinguish microorganisms from, for example, dust of chemical fiber. By the heat treatment, however, the fluorescence intensity from only the microorganisms increases, while the fluorescence intensity from fluorescence-emitting dust does not change. Therefore, by measuring the difference of fluorescence intensity before heat treatment and fluorescence intensity after prescribed heat treatment, it is possible to find the amount of microorganisms.
- Fig. 21 is a block diagram showing a specific example of the functional configuration of detection apparatus 100B for detecting airborne microorganisms utilizing the principle above.
- Fig. 21 again shows an example in which the functions of signal processing unit 30 are implemented by hardware configuration mainly of electric circuitry. It is noted, however, that at least part of the functions may be implemented by software configuration realized by a CPU, not shown, provided in signal processing unit 30, executing a prescribed program. Further, in the example shown, detecting unit 40 is implemented by software configuration. At least part of the functions thereof may be realized by hardware configuration such as electric circuitry.
- signal processing unit 30 includes a current-voltage converting circuit 34 connected to light receiving element 9, and an amplifying circuit 35 connected to current-voltage converting circuit 34.
- Detecting unit 40 includes a control unit 49, a storage unit 42, and a clock generating unit 47. Further, detecting unit 40 includes: an input unit 44 for receiving input of information by receiving an input signal from switch 110 upon operation of switch 110; an external connection unit 46 performing processes required for exchanging data and the like with an external apparatus connected to communication unit 150; and a driving unit 48 for driving shutters 16A and 16B, introducing mechanism 50 and heater 91.
- Current-voltage converting circuit 34 detects a peak current value H representing the fluorescence intensity from the current signal input from light receiving element 9, and converts it to a voltage value Eh.
- the voltage value Eh is amplified by amplifying circuit 35 by a preset gain, and the result is output to detecting unit 40.
- Control unit 49 of detecting unit 40 receives the input of voltage value Eh from signal processing unit 30 and successively stores in storage unit 42.
- Clock generating unit 47 generates and outputs clock signals to control unit 49. With the timing based on the clock signals, control unit 49 outputs control signals for opening and closing shutters 16A and 16B to driving unit 48, to control opening/closing of shutters 16A and 16B. Further, control unit 49 is electrically connected to light emitting element 6 and light receiving element 9, and controls ON/OFF of these elements.
- Control unit 49 includes a calculating unit 41.
- Calculating unit 41 operates to calculate the amount of microorganisms suspended in the introduced air, using the voltage value Eh stored in storage unit 42. Specific operation will be described using a time chart of Fig. 22 , showing the flow of control by control unit 49. Here, as the amount of microorganisms, it is assumed that concentration of microorganisms suspended in the air introduced to case 5 is calculated.
- control unit 49 of detecting unit 40 when detection apparatus 100B is powered ON, control unit 49 of detecting unit 40 outputs a control signal to driving unit 48, to drive introducing mechanism 50. Further, at a time point T1 based on the clock signal from clock generating unit 47, control unit 49 outputs a control signal for opening (ON) shutters 16A and 16B to driving unit 48. Then, at time point T2 after the lapse of ⁇ T1 from T1, control unit 49 outputs a control signal for closing (OFF) shutters 16A and 16B to driving unit 48.
- shutters 16A and 16B are opened, and as introducing mechanism 50 is driven, external air is introduced through inlet 10 to case 5.
- Particles suspended in the air introduced to case 5 are negatively charged by discharge electrode 17, and by the air flow and an electric field formed between discharge electrode 17 and coating 3 on the surface of collecting jig 12, the particles are collected on the surface of collecting jig 12 for the time period ⁇ T1.
- shutters 16A and 16B are closed, so that the air flow in case 5 stops.
- collection of airborne particles by collecting jig 12 ends. Further, stray light from the outside is blocked.
- control unit 49 At time point T2 when shutters 16A and 16B are closed, control unit 49 outputs a control signal to light receiving element 9 to start reception of light (ON). At the same time (T2) or at T3 slightly after T2, it outputs a control signal to light emitting element 6 to start emission of light (ON). Thereafter, at time point T4 after the lapse of ⁇ T2, which is a predetermined measurement time for measuring fluorescence intensity, from time T3, control unit 49 outputs a control signal to light receiving element 9 to stop reception of light (OFF) and a control signal to light emitting element 6 to stop emission of light (OFF).
- the measurement time may be set in advance in control unit 49, or it may be input or changed by an operation of, for example, switch 110, by a signal from PC 300 connected to communication unit 150 through cable, or by a signal from a recording medium attached to communication unit 150.
- emission of light from light emitting element 6 starts.
- the light from light emitting element 6 is directed to irradiation region 15 on the surface of collecting jig 12, and fluorescence is emitted from collected particles.
- Fluorescence is received by light receiving element 9 for the predetermined measuring time ⁇ T2 from time T3, and a voltage value in accordance with the fluorescence intensity F1 is input to detecting unit 40 and stored in storage unit 42.
- a separate light emitting element such as an LED (not shown) may be provided, light emitted from this element and reflected from a reflection region (not shown), at which particles are not collected, on the surface of collecting jig 12 may be collected by a separate light receiving element (not shown), the intensity of received light may be used as a reference value I0 and the value F1/I0 may be stored in storage unit 42.
- the ratio to reference value I0 it becomes advantageously possible to compensate for the fluctuation of fluorescence intensity derived from environmental conditions such as moisture and temperature of light emitting element or light receiving element, or from variation in characteristics caused by deterioration or aging.
- control unit 49 At time point T4 (or a time point slightly later than T4) when emission of light by light emitting element 6 and reception of light by light receiving element 9 are stopped, control unit 49 outputs a control signal to heater 91 to start heating (ON). Thereafter, at time point T5 after the lapse of ⁇ T3, which is a predetermined heating time for the heat treatment, from the start of heating by heater 91 (from time point T4 or a time point slightly later than T4), control unit 49 outputs a control signal to heater 91 to stop heating (OFF).
- the time period ⁇ T3 of heating from T4 (or a time point slightly later than T4), heat treatment is done on the particles collected in irradiation region 15 on the surface of collecting jig 12, by heater 91.
- the heating temperature at this time is determined in advance.
- the particles collected on the surface of collecting jig 12 are heated by prescribed heat inputs.
- the time of heat treatment ⁇ T3 (that is, the heat input) may be set in advance in control unit 49, or it may be input or changed by an operation of, for example, switch 110, by a signal from PC 300 connected to communication unit 150 through cable, or by a signal from a recording medium attached to communication unit 150.
- the heated particles are subjected to cooling.
- introducing mechanism 50 may be used.
- external air may be taken in from an opening (not shown in Fig. 8A ) provided with an HEPA (High Efficiency Particulate Air) filter.
- HEPA High Efficiency Particulate Air
- a separate cooling mechanism such as a Peltier device may be used.
- control unit 49 outputs a control signal to end the operation of introducing mechanism 50, and at time T6, outputs a control signal to light receiving element 9 to start reception of light (ON). At the same time (T6) or at time T7 slightly later than T6, it outputs a control signal to light emitting element 6 to start emission of light (ON). Thereafter at time point T8 after the lapse of ⁇ T2 from T7, control unit 49 outputs a control signal to light receiving unit 9 to stop reception of light (OFF) and a control signal to light emitting element 6 to stop emission of light (OFF).
- the fluorescence for the measurement time ⁇ T2 is received by light receiving element 9.
- the voltage value corresponding to the fluorescence intensity F2 is input to detecting unit 40 and stored in storage unit 42.
- Calculating unit 41 calculates a difference between the stored fluorescence intensity F1 and fluorescence intensity F2 as an amount of increase ⁇ F.
- the amount of increase ⁇ F relates to the amount of microorganisms (the number or concentration of microorganisms).
- Calculating unit 41 stores beforehand the correspondence between the amount of increase ⁇ F and the amount of microorganisms (the concentration of particles) such as shown in Fig. 23 . Then, calculating unit 41 provides the concentration of microorganisms, obtained by using the amount of increase ⁇ F and the correspondence relation, as the concentration of microorganisms in the air introduced to case 5 in time period ⁇ T1.
- the correspondence relation between the amount of increase ⁇ F and the concentration of microorganisms is experimentally determined in advance.
- one type of microorganism such as Escherichia coli, Bacillius subtilis or Penicillium is sprayed using a nebulizer in a vessel having the size of 1m 3 . While the concentration of microorganisms is kept at N (particles/m 3 ), the microorganisms are collected using detection apparatus 100B by the method of detection described above for the time period ⁇ T1.
- the collected microorganisms are heated by a prescribed heat input (heating time ⁇ T3, prescribed heating temperature) using heater 91, cooled for a prescribed time period ⁇ T4, and the amount of increase ⁇ F of fluorescence intensity before and after heating is measured. Similar measurements are made for various concentrations of microorganisms, whereby the relation between the amount of increase ⁇ F and the microorganism concentration (particles/m 3 ) can be found as shown in Fig. 23 .
- the correspondence relation between the amount of increase ⁇ F and the concentration of microorganisms may be input by an operation of switch 110 or the like and stored in calculating unit 41.
- a recording medium having the correspondence relation recorded thereon may be attached to communication unit 150 and read by external connection unit 46 and stored in calculating unit 41. It may be input and transmitted by PC 300, received by external connection unit 46 through cable connected to communication unit 150, and stored in calculating unit 41. If communication unit 150 is adapted to infrared or Internet communication, the correspondence relation may be received by external connection unit 46 at communication unit 150 by such communication, and stored in calculating unit 41. Further, the correspondence relation once stored in calculating unit 41 may be updated by detecting unit 40.
- calculating unit 41 identifies a value corresponding to the increased amount ⁇ F1 from the correspondence relation shown in Fig. 22 , and thereby calculates the concentration N1 (particles/m 3 ) of microorganisms.
- calculating unit 41 defines some microorganism as standard microorganism and stores the correspondence relation between the amount of increase ⁇ F and the microorganism concentration. In this manner, microorganism concentration in various environments can be calculated as the microorganism concentration in equivalence of the standard microorganism, whereby environmental management becomes easier.
- the concentration of collected microorganisms calculated by calculating unit 41 is output from control unit 49 to display control unit 210.
- detection apparatus 100B utilizes difference in characteristics when heated between the fluorescence from microorganisms and the fluorescence from fluorescence-emitting dust, and based on the amount of increase after a prescribed heat treatment, microorganisms are detected. Specifically, detection apparatus 100B detects the microorganisms utilizing the phenomenon that when the collected microorganisms and dust are subjected to heat treatment, the fluorescence intensity from microorganisms increases whereas the fluorescence intensity from dust does not change. Therefore, even if fluorescence-emitting dust is suspended in the introduced air, it is possible to detect microorganisms separate from fluorescence-emitting dust on real-time basis with high accuracy.
- detection apparatus 100B is controlled in the manner as shown in Fig. 22 and thereby shutters 16A and 16B are closed at the transition from the collecting step by the collecting mechanism to the detection step by the detecting mechanism.
- shutters 16A and 16B are closed at the transition from the collecting step by the collecting mechanism to the detection step by the detecting mechanism.
- Fig. 24 illustrates the third example of detection apparatus 100.
- the third example of detection apparatus 100 is a modification of detection apparatus 100B.
- a detection apparatus 100C in accordance with the third example includes a detecting mechanism, a collecting mechanism and a heating mechanism.
- members denoted by the same reference characters as in detection apparatus 100A in accordance with the first example and detection apparatus 100B in accordance with the second example are substantially the same as the corresponding members. In the following, the difference over detection apparatus 100B will be mainly described.
- detection apparatus 100C is provided with a collection chamber 5A including at least a part of the collecting mechanism, and a detection chamber 5B including the detecting mechanism, sectioned by a partition wall 5C having a hole 5C'.
- collection chamber 5A a needle-shaped discharge electrode 17 and collecting jig 12 as the collecting mechanism are provided, and in detection chamber 5B, light emitting element 6, light receiving element 9 and collecting lens 8 as the detecting mechanism are provided.
- inlet 10 and outlet 11 are provided, respectively, for introducing air to collection chamber 5A. Further, as shown in Fig. 24 , a filter (pre-filter) 10B may be provided at inlet 10.
- Inlet 10 and outlet 11 may be provided with light shielding portions 10A and 11A such as shown in Figs. 10A and 10B similar to those of detection apparatus 100B, for intercepting entrance of external light while allowing air flow to/from collection chamber 5A.
- a fan 50A as the introducing mechanism is provided close to outlet 11.
- the air is introduced from the inlet to collection chamber 5A.
- the driving mechanism of fan 50A is controlled by detecting unit 40 such that flow rate of introduced air is regulated.
- the flow rate of air introduced by fan 50A is 1L (liter)/min to 50m 3 /min.
- fan 50A introduces air outside collection chamber 5A through inlet 10 and discharges air in collection chamber 5A through outlet 11 to the outside of collection chamber 5A as shown by a dotted line arrow in the figure.
- the collecting mechanism includes discharge electrode 17, collecting jig 12, and high-voltage power supply 2.
- Discharge electrode 17 is electrically connected to the positive electrode of high-voltage power supply 2.
- Collecting jig 12 is electrically connected to a negative electrode of high-voltage power supply 2.
- Collecting jig 12 is a support board formed, for example, of a glass plate, having a conductive, transparent coating, as in detection apparatus 100B.
- the coating side of collecting jig 12 is electrically connected to the negative electrode of high-voltage power supply 2.
- Particles suspended in the air introduced through inlet 10 by the driving of fan 50A are negatively charged near discharge electrode 17.
- the negatively charged particles move toward collecting jig 12 because of electrostatic force, and are attracted and held by conductive coating, whereby the particles are collected on collecting jig 12.
- needle-shaped electrode is used as discharge electrode 17, it is possible to have charged particles attracted and held in a very narrow area corresponding to irradiation region 15 (as will be described later) irradiated by the light emitting element of collecting jig 12 opposite to discharge electrode 17. Consequently, in the detecting step as will be described later, it is possible to efficiently detect the attracted microorganisms.
- the detecting mechanism included in detection chamber 5B includes: light emitting element 6 as a light source; light receiving element 9; and a collecting lens (or lenses) 8, provided in the direction of light reception by light receiving element 9, for collecting fluorescence generated by irradiation of airborne particles collected on collecting jig 12 by the collecting mechanism with light from light emitting element 6 to light receiving element 9. It may further include: a lens (or lenses) provided in a direction of light emission by light emitting element 6, for collimating the light beams from light emitting element 6 or to adjust the light beams to a prescribed width; an aperture; and a filter (or filters) for preventing entrance of irradiating light beam to light receiving element 9. Conventional configurations may be applied to these components.
- Collecting lens 8 may be formed of plastic resin or glass.
- At least the inner side of detection chamber 5B is painted black or treated with black alumite. This prevents reflection of light from the inner wall surface as a cause of stray light.
- the material of collection chamber 5A and detection chamber 5B is not specifically limited, preferably, plastic resin, metal such as aluminum or stainless steel, or a combination of these may be used.
- Inlet 10 and outlet 11 of case 5 have circular shape with the diameter of 1mm to 50mm. The shape of inlet 10 and outlet 11 is not limited to a circle, and it may be an ellipse or a rectangle.
- Light emitting element 6 is similar to that of detection apparatus 100B. Light beams emitted from light emitting element 6 are collected on a surface of collecting jig 12, and form irradiation region 15 on collecting jig 12.
- the shape of irradiation region 15 is not specifically limited, and it may have a circular, elliptical or rectangular shape. Though the size of irradiation region 15 is not specifically limited, preferably, the diameter of a circle, the longer side length of an ellipse or the length of one side of a rectangle is in the range of about 0.05mm to 50 mm.
- Light receiving element 9 is connected to signal processing unit 30 and outputs a current signal in proportion to the intensity of received light to signal processing unit 30. Therefore, fluorescence emitted from the particles that have been suspended in the introduced air, collected to the surface of collecting jig 12 and irradiated with light from light emitting element 6, is received by light receiving element 9 and the intensity of received light is detected by signal processing unit 30.
- a brush 60 for refreshing the surface of collecting jig 12 is provided at a position to touch the surface of collecting jig 12 in detection chamber 5B.
- Brush 60 is connected to a moving mechanism, not shown, controlled by detecting unit 40 and reciprocates on collecting jig 12 as represented by a double-sided arrow B in the figure. Consequently, dust and microorganisms deposited on collecting jig 12 are removed.
- heater 91 is arranged on that surface of collecting jig 12 which is away from discharge electrode 17, as shown in Fig. 24 .
- a unit including collecting jig 12 and heater 91 will be referred to as a collection unit 12A here.
- Collection unit 12A is connected to a moving mechanism, not shown, controlled by detecting unit 40, and moves as indicated by double-sided arrow A in the figure, that is, from collection chamber 5A to detection chamber 5B and from detection chamber 5B to collection chamber 5A, through hole 5C' formed in wall 5C.
- heater 91 may be arranged at a position allowing heating of airborne particles collected on collecting jig 12 and separated, at least at the time of heating, from the sensor equipment including light emitting element 6 and light receiving element 9 and, therefore, the heater may not be included in collection unit 12A and it may be provided at a different position.
- heater 91 may not be included in collection unit 12A but it may be fixed at a position, where collection unit 12A is set in collection chamber 5A, on a side of collecting jig 12 opposite to the sensor equipment including light emitting element 6 and light receiving element 9.
- heater 91 is separated by collecting jig 12 from the sensor equipment including light emitting element 6 and light receiving element 9, whereby influence of heat on light emitting element 6, light receiving element 9 and the like can be prevented.
- collection unit 12A may include at least collecting jig 12.
- a cover 65A having upward and downward projections is provided at an end portion farthest from wall 5C of collection unit 12A.
- an adapter 65B corresponding to cover 65A is provided on a surface of wall 5C facing collection chamber 5A, around hole 5C'.
- Adapter 65B has a recess that fits the projections of cover 65A. Therefore, cover 65A and adapter 65B are perfectly joined and cover hole 5C'. Specifically, when collection unit 12A moves in the direction of an arrow A' of Fig.
- detection apparatus 100C also, airborne microorganisms are detected utilizing the principle described with reference to Figs. 11 to 20 .
- the functional configuration of detection apparatus 100C is substantially the same as the functional configuration of detection apparatus 100B shown in Fig. 21 .
- driving unit 48 drives, in place of heater 91, introducing mechanism 50 and shutters 16A and 16B, fan 50A, heater 91, the mechanism, not shown, for reciprocating collection unit 12A and the mechanism, not shown, for reciprocating brush 60.
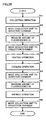
- control unit 49 for calculating the amount of microorganisms suspended in the air introduced to collection chamber 5A will be described with reference to the flowchart of Fig. 26 .
- concentration of microorganisms suspended in the air introduced to collection chamber 5A in a prescribed time period is calculated.
- step S31 when detection apparatus 100C is powered ON, at step S31, a collecting operation is done in collection chamber 5A, for the time period ⁇ T1 as a predetermined collection time.
- Specific operations at step S31 are as follows.
- Control unit 49 outputs a control signal to driving unit 48 so that fan 50A is driven to feed air to collection chamber 5A. Particles in the air introduced to collection chamber 5A are negatively charged by discharge electrode 17, and because of the air flow caused by fan 50A and the electric field formed between discharge electrode 17 and coating 3 on the surface of collecting jig 12, the particles are collected to a narrow area corresponding to irradiation region 15 on the surface of collecting jig 12.
- control unit 49 ends the collecting operation, that is, ends the driving of fan 50A.
- control unit 49 outputs a control signal to driving unit 48 to operate the mechanism for moving collection unit 12A, and collection unit 12A is moved from collection chamber 5A to detection chamber 5B.
- the detecting operation is done.
- control unit 49 causes light emitting element 6 to emit light, and causes light receiving element 9 to receive light, for a determined measurement time ⁇ T2.
- the light from light emitting element 6 is directed to irradiation region 15 on the surface of collecting jig 12, and fluorescence is emitted from collected particles.
- a voltage value in accordance with the fluorescence intensity F1 is input to detecting unit 40 and stored in storage unit 42. In this manner, an amount of fluorescence S31 before heating is measured.
- the measurement time ⁇ T2 may be set in advance in control unit 49, or it may be input or changed by an operation of, for example, switch 110, by a signal from PC 300 connected to communication unit 150 through cable, or by a signal from a recording medium attached to communication unit 150.
- a separate light emitting element such as an LED (not shown) may be provided, light emitted from this element and reflected from a reflection region (not shown), at which particles are not collected, on the surface of collecting jig 12 may be collected by a separate light receiving element (not shown), the intensity of received light may be used as a reference value I0 and the value F1/IO may be stored in storage unit 42.
- the ratio to reference value I0 it becomes advantageously possible to compensate for the fluctuation of fluorescence intensity derived from environmental conditions such as moisture and temperature of light emitting element or light receiving element, or from variation in characteristics caused by deterioration or aging.
- control unit 49 When the measuring operation at step S35 ends, at step S37, control unit 49 outputs a control signal to driving unit 48 so that the mechanism for moving collection unit 12A is moved, and collection unit 12A is moved from detection chamber 5B to collection chamber 5A.
- control unit 49 causes heater 91 to heat for the predetermined heating time ⁇ T3. The heating temperature at this time is determined beforehand.
- control unit 49 outputs a control signal to driving unit 48 to cause fan 50A to rotate in reverse direction for a prescribed cooling time.
- Collection unit 12A is cooled as external air is taken.
- Heating time ⁇ T3 the heating temperature and the cooling time may be set in advance in control unit 49, or may be input or changed by an operation of, for example, switch 110, by a signal from PC 300 connected to communication unit 150 through cable, or by a signal from a recording medium attached to communication unit 150.
- heater 91 is positioned at a distance separated from the sensor equipment including light emitting element 6 and light receiving element 9 and also separated by wall 5C and, therefore, influence of heat of light emitting element 6 and light receiving element 9 can be prevented.
- heater 91 Since heater 91 is in collection chamber 5A separated also by wall 5C and the like from the sensor equipment including light emitting element 6 and light receiving element 9 at the time of heating, heater 91 may not necessarily be positioned on the surface away from discharge electrode 17 of collection unit 12A, that is, the surface away from light emitting element 6 and light receiving element 9 when collection unit 12A moves to detection chamber 5B, but it may be on a surface close to discharge electrode 17.
- control unit 49 When the heating operation at step S39 and the cooling operation at step S41 end, at step S43, control unit 49 outputs a control signal to driving unit 48 so that the mechanism for moving collection unit 12A is operated, and collection unit 12A is moved from collection chamber 5A to detection chamber 5B.
- the detecting operation is done again.
- the detecting operation at step S45 is the same as the detecting operation at step S35.
- a voltage value at this step in accordance with the fluorescence intensity F2 is input to detecting unit 40 and stored in storage unit 42. In this manner, an amount of fluorescence S2 after heating is measured.
- a refreshing operation of collection unit 12A is done at step S47.
- control unit 49 outputs a control signal to driving unit 48 to move the mechanism for moving brush 60, so that brush 60 reciprocates on the surface of collection unit 12A for a prescribed number of times.
- control unit 49 outputs a control signal to driving unit 48 to move the mechanism for moving collection unit 12A, and collection unit 12A is moved from detection chamber 5B to collection chamber 5A.
- Calculating unit 41 calculates the difference between stored fluorescent intensities F1 and F2 as the amount of increase ⁇ F.
- the concentration of microorganisms obtained using the calculated amount of increase ⁇ F and the correspondence relation ( Fig. 23 ) between the amount of increase ⁇ F and the concentration of microorganisms (particle concentration) stored beforehand, is calculated as the concentration of microorganisms in the air introduced to collection chamber 5A in time period ⁇ T1.
- the calculated concentration of microorganisms among the collected particles is output from control unit 49 to display control unit 210.
- collection chamber 5A and detection chamber 5B are sectioned and collection unit 12A moves between the chambers for collection and detection. Therefore, it is possible to perform collection and detection continuously. Further, collecting jig 12 is heated in collection chamber 5A, cooled and thereafter moved to detection chamber 5B, as described above. Therefore, influence of heat on the sensors and the like in detection chamber 5B can be prevented.
- detection apparatus 100C when collection unit 12A moves from collection chamber 5A for the collecting step to detection chamber 5B for the detecting step, the cover provided on collection unit 12A closes hole 5C' of wall 5C. Therefore, entrance of external light to detection chamber 5B is blocked. Thus, stray light caused, for example, by scattering on airborne particles during fluorescence measurement can be reduced, and accuracy of measurement can be improved.
- collection chamber 5A and detection chamber 5B provided as chambers partitioned by wall 5C are shown in Fig. 24 , it is also possible to provide a collecting device and a detecting device as fully separated bodies, and to have collection unit 12A moved therebetween, or to have collection unit 12A set to each device, in detection apparatus 100C.
- heating of collecting jig 12 may be performed at a position outside the detecting device, separate from the sensor equipment including light emitting element 6 and light receiving element 9.
- heating may be performed in the heating device corresponding to collection chamber 5A as described above, or at a position not in the collecting device or in the detecting device (for example, during movement from the collecting device to the detecting device).
- Heater 91 may be included in collection unit 12A or may be provided at a position to perform heating outside of the detecting device. Further, the collecting device and the detecting device may be used not as a set but each as a single device corresponding to collection chamber 5A or a single device corresponding to detection chamber 5B. In that case, the device used is adapted to include functions corresponding to signal processing unit 30, detecting unit 40 and the like.
- one collection unit 12A is provided, and by reciprocation indicated by the double-sided arrow A, the unit moves to and from collection chamber 5A and detection chamber 5B.
- two or more collection units 12A may be provided on a turntable and moved between collection chamber 5A and detection chamber 5B as the table turns. In such a configuration, it is possible to position one of the plurality of collection units in collection chamber 5A and positioning another in detection chamber 5B, thereby to perform the collecting operation and the detecting operation in parallel. Such a configuration enables continuous collecting operations and continuous detecting operations in parallel.
- Display control unit 210 executes a process for displaying the results of detection received from detection apparatus 100 on display panel 130.
- Fig. 27 is a block diagram showing a specific example of functional configuration of display control unit 210 when display control unit 210 executes display control in accordance with the first example.
- the display control of the first example is for displaying pieces of information of different types related to environment in an easy-to-grasp manner.
- Fig. 27 shows an example in which the functions of display control unit 210 are mainly implemented by software configuration. It is noted, however, that at least part of these functions may be realized by hardware configuration such as electric circuits.
- display control unit 210 includes a detected value input unit 201 for receiving input of detection results from detection apparatus 100, a computing unit 202, a generating unit 203 and an output unit 204.
- Computing unit 202 stores in advance "total value” of each of microorganisms and dust to be used for arithmetic operation, and carries out an operation for obtaining "relative value” for the input results of detection.
- the “total value” represents a value as a preset reference for determining air pollution
- the “relative value” represents the ratio of the input result of detection to the “total value.”
- the "relative value” of microorganisms will also be referred to as “bacteria meter” and the “relative value” of dust will also be referred to as “dust meter.”
- the number of particles is handled as the results of detection.
- computing unit 202 stores the maximum values Nsmax and Ndmax of microorganisms and dust particles per prescribed volume (for example, the amount of air Vs introduced to case 5 per unit detection time described above). Then, by dividing the number Ns of microorganisms and the number Nd of dust particles per unit volume input as the results of detection by "total values Nsmax, Ndmax" as such, the ratio Ns/Nsmax of the number of microorganisms and the ratio Nd/Ndmax of the number of dust particles to the maximum value of particles per unit volume as "relative values" are obtained. Alternatively, assume that the concentration of particles is handled as the results of detection.
- computing unit 202 stores the maximum values of the concentration of microorganisms and concentration of dust particles in the air, and by dividing the concentration of microorganisms and the concentration of dust particles input as the results of detection by respective “total values” as such, obtains the ratio of the concentration of microorganisms and ratio of the concentration of dust particles to the maximum values of concentration.
- the "total value" of each of microorganisms and dust may be input through an operation of switch 110 or the like and stored in computing unit 202.
- information may be read by communication unit 150 from storage medium recording the total values and thereby the information may be stored in computing unit 202.
- Such information may be received by communication unit 150 from a PC connected to a dedicated line, or other equipment communicating through the Internet or infrared communication, and stored in computing unit 202.
- total values in accordance with prescribed conditions such as each environment (room) where air purifier 1 is installed, time of day, day of the week and so on may be stored, and the total values to be used may be selected by, for example, an operation of switch 110.
- Generating unit 203 determines amounts of display necessary for unified display of calculated bacteria meter and dust meter, and generates display data based on the amounts of display.
- the "amount of display” is represented as the ratio of each relative value to the entire display area that represents the total amount. Simply, the amount of display is obtained by multiplying the value (angle, length, number of segments or the like) representing the entire display area by each calculated relative value.
- Specific method of display may include display of bacteria meter and dust meter in a circle graph, as described later. The manner of display is not limited to the circle graph, and other form such as a bar graph or a segment display may be possible.
- the "amount of display” corresponds to the central angle
- the "amount of display” corresponds to the length
- the “amount of display” corresponds to the number of segments.
- Output unit 204 performs a process for outputting the display data generated by generating unit 203.
- output unit 204 realizes control for displaying on display panel 130 based on the generated display data.
- the bacteria meter and dust meter may be displayed in unified manner. More preferably, the ratio of total sum of microorganism particles and dust particles in the air to the total sum of "total values" of microorganisms and dust is additionally displayed.
- the "relative value" of the total sum of microorganism particles and dust particles will also be referred to as "pollution meter.”
- the remaining ratio other than the pollution meter represents, in computation, the ratio of air not containing microorganism particles or dust particles. Therefore, this ratio may be referred to as "clean meter” opposite to the "pollution meter.”
- the amount of display of the pollution meter may be determined by generating unit 203.
- the amount of display may be obtained as a sum of the amount of display of bacteria meter and the amount of display of dust meter determined by generating unit 203.
- the pollution meter and the clean meter are displayed. Further, the amount of display of pollution meter and the amount of display of clean meter are determined based on the sum of the amount of display of bacteria meter and the amount of display of dust meter.
- FIG. 28 the flow of display control by display control unit 210 will be described, assuming that specific display shown in Fig. 29 is given.
- the process shown in the flowchart of Fig. 28 is realized by a CPU, not shown, included in control device 200 reading and executing programs stored in the memory to invoke various functions shown in Fig. 27 .
- the relative value of dust particles (dust meter) to the stored "total value” of dust is calculated by computing unit 202 at S 107, and the angle ⁇ of a circle graph as the "amount of display" for displaying the dust meter in a circle graph is determined by generating unit 203 at S 109.
- the order of steps S 103 to S 109 is not limiting and the order may be changed.
- the display data is generated by generating unit 203. Specifically, the display data for realizing the display shown in Fig. 29 is generated.
- the circle graph representing the results of detection includes areas 131 and 133.
- Area 131 is for displaying the bacteria meter and the dust meter.
- Area 133 is for displaying the pollution meter and the clean meter.
- Areas 131 and 133 in its entirety, each correspond to the total sum of "total value" of microorganisms and dust. The positional relation between areas 131 and 133 with respect to the center of the circle may be reversed.
- Generating unit 203 realizes a manner of display (color, pattern) determined in advance for the bacteria meter in the area of angle ⁇ determined at S 105 from the start point (in Fig. 29 , the top position) of area 131, which is fixed in advance, as the area for the bacteria meter. Further, generating unit 203 realizes a manner of display determined in advance for the dust meter in the area of angle ⁇ determined at S 109 from the start point that corresponds to the end point of bacteria meter of area 131. Further, generating unit 203 realizes a manner of display determined in advance for the pollution meter in the area of angle ⁇ determined at S111 from the start point (in Fig. 29 , the top position) of area 133 that is the same as start point of area 131.
- the bacteria meter and the dust meter are displayed in this order from the start point (top position) of area 131.
- the order may be reversed.
- the order of pollution meter and the clean meter may also be reversed.
- the end point of bacteria meter is used as the start point for displaying the dust meter, that is, the bacteria meter and the dust meter are displayed successively without any gap between the bacteria meter and the dust meter. It is noted, however, that there may be some gap therebetween, or the display may be overlapped to some extent. The same applies to the pollution meter and the clean meter.
- each relative value is represented as percentage unit, and prescribed percentage values (0, 25, 50, 75) are displayed as indexes.
- the indexes may be displayed in smaller segments, or may not be displayed at all.
- the indexes may be displayed with scale markings.
- specific value of each relative value may be displayed in addition to the display shown in Fig. 29 .
- Captions "BACTERIA METER” and "DUST METER” on Fig. 29 may be additionally displayed.
- a process for output is executed by output unit 204 at S 115. If the output destination is display panel 130, the display of Fig. 29 is given on display panel 130 by the process at S 115.
- the user can grasp in a unified manner the results of detection of microorganisms and dust particles by detection apparatus 100.
- the bacteria meter is displayed in the area from the start point of area 131 fixed in advance to the angle ⁇ corresponding to the relative value
- the dust meter is displayed in the area from the end point of bacteria meter as the start point to the angle ⁇ corresponding to the relative value. Therefore, the user can grasp immediately and in a sensual manner the ratio of microorganisms and the ratio of dust particles in the air as a whole.
- the user can grasp immediately and in a sensual manner the ratio of the sum of microorganisms and the dust particles to the air as a whole.
- the ratio can be grasped more aptly as it is displayed as "pollution meter" in area 133 of the circular graph.
- the amount of microorganisms in the air serves as helpful information to determine the risk of catching a cold or risk of mold development, both of which are much related to microorganisms. Therefore, such display helps the user to determine the risk of catching a cold or risk of mold development.
- the above-described process is repeated at a prescribed interval in display control unit 210. Accordingly, the real-time results of detection of microorganisms and dust particles by detection apparatus 100 can be reflected on the display. If the circular graph shown in Fig. 29 is displayed continuously, display control unit 210 updates the display on display panel 130 every time the process described above is executed. As a result, the areas of bacteria meter and dust meter change, and the boundary between the pollution meter and clean meter moves accordingly.
- Display control unit 210 may additionally display other pieces of information.
- pieces of information related to humidity, temperature, weather or season may be displayed on an area 135 in the circular graph, as shown in Fig. 30 .
- the display is not limited to text display such as shown in Fig. 30 , and it may include an illustration, an animation, a specific color or pattern. Such display enables unified presentation of more information related to the environment.
- the user can grasp immediately more information related to the environment.
- Fig. 32 is a block diagram showing a specific example of functional configuration of display control unit 210 when display control unit 210 executes display control in accordance with the second example.
- the display control in accordance with the second example is for displaying messages related to the environment.
- Fig. 32 shows an example in which the functions of display control unit 210 are mainly implemented by software configuration. It is noted, however, that at least part of these functions may be realized by hardware configuration such as electric circuits.
- display control unit 210 includes detected value input unit 201 for receiving input of detection results from detection apparatus 100, computing unit 202, generating unit 203, output unit 204, an environmental value input unit 205 for receiving an environmental value received by communication unit 150 from other equipment, a condition storage unit 206 for storing conditions used for displaying messages and correspondence relations between the conditions and the messages as will be described later, and a determining unit 207 for determining and deciding the message to be displayed.
- the "message” refers to a message related to the environmental status, including information for presenting information related to mold development and information related to health such as a cold. Though it is assumed that the message is given as a character sequence in the following, the message may be given by an icon, an animation or voice.
- condition storage unit 206 Messages to be displayed in accordance with various conditions are stored in advance in condition storage unit 206.
- the messages may be input by an operation of switch 110 or the like and stored in condition storage unit 206 by the operation of display control unit 210.
- communication unit 150 may read such information from a recording medium recording the messages, and the information may be stored in condition storage unit 206 by the operation of display control unit 210.
- communication unit 150 may receive such information from other equipment using, for example, a PC connected to a dedicated line, through the Internet or infrared communication and the information may be stored in condition storage unit 206 by the operation of display control unit 210.
- the messages and the correspondence to the conditions stored in condition storage unit 206 may be updated by display control unit 210.
- Computing unit 202 is the same as computing unit 202 described in connection with the first example of display control, and it calculates the "relative values" of detection results with respect to the stored “total values.”
- Generating unit 203 is also the same as generating unit 203 described in connection with the first example of display control, and it determines amounts of display necessary for displaying the calculated bacteria meter and dust meter in unified manner, and generates the display data of bacteria meter and dust meter based on the amounts of display.
- environmental value input unit 205 receives a value representing temperature (room temperature) from a thermometer placed in a room, a value representing humidity from a hygrometer placed in the room, and pieces of information representing weather and season (for example, specific period of year such as rainy season) obtained through the Internet communication or data communication of terrestrial digital broadcast, from communication unit 150.
- a value representing temperature room temperature
- a value representing humidity from a hygrometer placed in the room
- pieces of information representing weather and season for example, specific period of year such as rainy season
- Condition storage unit 206 stores conditions to be used for displaying messages, constituted by combinations of the environmental values and the pieces of information obtained from the detected values. Further, specific messages corresponding to conditions are stored. Determining unit 207 refers to the stored conditions, specifies the condition from the above-described relative values from the input detected values and the environmental values, and determines a message that corresponds to the specified condition as the message to be displayed. In the embodiment, it is assumed that conditions defined by combinations of the calculated relative values and the environmental values are stored. The conditions defined by the combinations of detected values and environmental values may be stored.
- Generating unit 203 generates display data for displaying the determined message, in addition to the display of detection results (the bacteria meter and the dust meter). It is assumed that the display data for displaying the messages are stored message by message in advance. Based on the display of detection results, generating unit 203 determines the position for displaying the message, and embeds the display data for displaying the determined message on the determined position and thereby generates the display data for screen image display.
- Output unit 204 executes a process for outputting the display data generated by generating unit 203.
- output unit 204 realizes control for displaying on display panel 130 based on the generated display data.
- the result of detection is displayed in the similar manner as that described in connection with the first example of display control. Specifically, the pollution meter and the clean meter are displayed in addition to the bacteria meter and the dust meter.
- Fig. 33 is a flowchart representing the flow of display control in accordance with the second example.
- the flow of display control by display control unit 210 will be described, using Fig. 36A as a specific example of display.
- the process shown in the flowchart of Fig. 33 is realized by a CPU, not shown, included in control device 200 reading and executing programs stored in the memory to invoke various functions shown in Fig. 32 .
- determining unit 207 refers to the conditions and the correspondence relation with the messages stored in condition storage unit 206, and the message to be displayed is determined.
- display data is generated based on the amount of display determined at S109 and S111 and the message determined at S112. Specifically, display data for realizing the display of Fig. 36A is generated. Referring to Fig. 36A , the circular graph representing the results of detection is similar to the circular graph displayed in the first example of display control. In the second example of display control, areas 135 and 137 are additionally provided. Area 135 is for displaying the environmental value. Area 137 is for displaying the message.
- generating unit 203 determines the boundary position between the pollution meter and the clean meter, that is, a position close to the position of angle ⁇ from the display start position of bacteria meter, to be the area 137 for displaying the message.
- display data stored beforehand is embedded in this area.
- display data for displaying the environmental values received at S101 such as the temperature, humidity and weather is embedded.
- the display of environmental values are not limited to text display such as shown in Fig. 36A , and the display may include an illustration, an animation, a specific color or a pattern.
- the process for outputting to output unit 204 is executed at S115. If the output destination is display panel 130, the display of Fig. 36A is displayed on display panel 130 by the process of S115.
- the user can grasp the results of detection of microorganisms and dust particles by detection apparatus 100 in a unified manner.
- the bacteria meter is displayed in the area from the start point of area 131 fixed in advance to the angle ⁇ corresponding to the relative value
- the dust meter is displayed in the area from the end point of bacteria meter as the start point to the angle ⁇ corresponding to the relative value. Therefore, the user can grasp immediately and in a sensual manner the ratio of microorganisms and the ratio of dust particles in the air as a whole.
- the user can grasp immediately and in a sensual manner the ratio of the sum of microorganisms and the dust particles to the air as a whole.
- the ratio can be grasped more aptly as it is displayed as "pollution meter" in area 133 of the circular graph.
- the environmental status including risk of catching a cold or risk of mold development can easily be grasped by the displayed messages.
- the above-described process is repeated at a prescribed interval in display control unit 210. Accordingly, the real-time results of detection of microorganisms and dust particles by detection apparatus 100 can be reflected on the display. If the circular graph representing the results of detection is displayed continuously, display control unit 210 updates the display on display panel 130 every time the process described above is executed. As a result, the areas of bacteria meter and dust meter change, and the boundary between the pollution meter and clean meter moves accordingly. Further, the displayed message changes.
- condition storage unit 206 displays given when conditions of Fig. 34 are stored in condition storage unit 206 and correspondence between messages shown in Fig. 35 and respective conditions is established will be described, with reference to specific examples of display.
- the environmental values are used generally as described in the following, the environmental status can be determined with high accuracy, and appropriate message can be displayed. By the message, the user can grasp the environmental status, and can take necessary measures.
- Specific numerical values of conditional equations in Fig. 34 are examples only, and not limiting.
- determining unit 207 determines that the condition for determining a message is condition 1-1 at S112, and from the correspondence relation shown in Fig. 35 , determines the message "ROOM AIR POLLUTED" corresponding to condition 1-1 to be the message to be displayed.
- generating unit 203 When the condition is 1-1, generating unit 203 generates data for displaying the results of detection in areas 131 and 133 and for displaying the determined message "ROOM AIR POLLUTED" in area 137 near the boundary between the pollution meter and the clean meter as shown in Fig. 36A .
- output unit 204 outputs the display data as such to display panel 130 and by such display control, the image of Fig. 36A is displayed on display panel 130.
- Fig. 35 shows an example in which only the message "ROOM AIR POLLUTED” is shown as corresponding to condition 1-1.
- a plurality of messages may be prepared to correspond to condition 1-1, as in the case of condition 7-1.
- the plurality of messages may be displayed side by side as shown in Fig. 36B or may be displayed one by one (in rotation) at a prescribed time interval (of, for example, few seconds), on the area for displaying messages on the screen image.
- determining unit 207 determines that the condition for determining a message is both conditions 1-1 and 1-2 at S112.
- priority is set for preset conditions (or at least for conditions that may overlap). Therefore, in this situation, that is, when a plurality of conditions are specified by the environmental values, considering the priority, a condition having high priority is determined to be the condition for determining the message.
- the priority is higher if the condition can be an environmental factor of higher risk.
- determining unit 207 determines condition 1-2 to be the condition for determining the message. Further, from the correspondence relation shown in Fig. 35 , the message "PURIFY AIR IMMEDIATELY" corresponding to condition 1-2 is determined to be the message to be displayed.
- Fig. 36A If such a determination is made and the image of Fig. 36A has already been displayed on display panel 130 as the previous image at the timing of screen display, the display is continuously switched to the next results of detection and the next message by the process described above by display control unit 210. Specifically, the areas of bacteria meter and dust meter change in accordance with the results of detection and the position of boundary between the pollution meter and the clean meter changes accordingly. Further, the message “ROOM AIR POLLUTED" of Fig. 36A is switched to the message "PURIFY AIR IMMEDIATELY.”
- determining unit 207 determines that the condition for determining a message is condition 2 at S112, and from the correspondence relation shown in Fig. 35 , determines the message "MOLD DEVELOPMENT PROBABLE" corresponding to condition 2 to be the message to be displayed.
- generating unit 203 generates display data for displaying the determined message "MOLD DEVELOPMENT PROBABLE" near the boundary between the pollution meter and the clean meter displayed as results of detection.
- output unit 204 outputs the display data as such to display panel 130 and by such display control, the image of Fig. 37A is displayed on display panel 130.
- Fig. 35 shows an example in which only the message "MOLD DEVELOPMENT PROBABLE” is shown as corresponding to condition 2. However, a plurality of messages may be prepared to correspond to condition 2.
- a plurality of messages including "MOLD DEVELOPMENT PROBABLE” and “DEHUMIDIFY/REMOVE BACTERIA” are stored.
- the plurality of messages may be displayed side by side as shown in Fig. 37B or may be displayed one by one (in rotation) at a prescribed time interval, on the area for displaying messages on the screen image.
- determining unit 207 determines that the condition for determining a message is condition 3-1 at S112, and from the correspondence relation shown in Fig. 35 , determines the message "RISK OF MOLD DEVELOPMENT ELEVATED" corresponding to condition 3-1 to be the message to be displayed.
- determining unit 207 determines that the condition for determining a message is condition 3-2 at S112, and from the correspondence relation shown in Fig. 35 , determines the message "RISK OF MOLD DEVELOPMENT ELEVATED" corresponding to condition 3-2 to be the message to be displayed.
- generating unit 203 generates display data for displaying the determined message "RISK OF MOLD DEVELOPMENT ELEVATED" near the boundary between the pollution meter and the clean meter displayed as results of detection as shown in Fig. 38A .
- output unit 204 outputs the display data as such to display panel 130 and by such display control, the image of Fig. 38A is displayed on display panel 130.
- Fig. 35 shows an example in which only the message "RISK OF MOLD DEVELOPMENT ELEVATED” is shown as corresponding to conditions 3-1 and 3-2.
- a plurality of messages may be prepared to correspond to conditions 3-1 and 3-2.
- the plurality of messages may be displayed side by side as shown in Fig. 38B or may be displayed one by one (in rotation) at a prescribed time interval, on the area for displaying messages on the screen image.
- determining unit 207 determines that the condition for determining a message is condition 4 at S112 regardless of the value of bacteria meter or the weather, and from the correspondence relation shown in Fig. 35 , determines the message "RISK OF MOLD DEVELOPMENT ELEVATED" corresponding to condition 4 to be the message to be displayed.
- generating unit 203 If the condition is 4, at S113, generating unit 203 generates display data for displaying the determined message "RISK OF MOLD DEVELOPMENT ELEVATED" near the boundary between the pollution meter and the clean meter displayed as results of detection as shown in Fig. 39A .
- output unit 204 outputs the display data as such to display panel 130 and by such display control, the image of Fig. 39A is displayed on display panel 130.
- generating unit 203 generates display data for displaying a message "RAINY SEASON STARTED” indicating the rainy season in an area 139, for example, near the detection results. Display data for such a message is also stored in advance in generating unit 203 and, when condition 4 is determined, it is determined that such a message should be displayed together with the message from Fig. 35 .
- Fig. 35 shows an example in which only the message "RISK OF MOLD DEVELOPMENT ELEVATED” is shown as corresponding to condition 4.
- a plurality of messages may be prepared to correspond to condition 4.
- the plurality of messages may be displayed side by side as shown in Fig. 39B or may be displayed one by one (in rotation) at a prescribed time interval, on the area for displaying messages on the screen image.
- determining unit 207 determines that the condition for determining a message is condition 5-1 at S112, and from the correspondence relation shown in Fig. 35 , determines the message "WATCH OUT FOR CONTAGIOUS COLD" corresponding to condition 5-1 to be the message to be displayed.
- determining unit 207 determines that the condition for determining a message is condition 5-2 at S112, and from the correspondence relation shown in Fig. 35 , determines the message "WATCH OUT FOR FLU" corresponding to condition 5-2 to be the message to be displayed.
- generating unit 203 If the condition is 5-2, at S113, generating unit 203 generates display data for displaying the determined message "WATCH OUT FOR FLU" near the boundary between the pollution meter and the clean meter displayed as results of detection as shown in Fig. 40A .
- output unit 204 outputs the display data as such to display panel 130 and by such display control, the image of Fig. 40A is displayed on display panel 130.
- display data for displaying the message "WATCH OUT FOR CONTAGIOUS COLD" near the boundary between the pollution meter and the clean meter is generated.
- generating unit 203 also generates display data for additionally displaying the message "...
- Display data for such a message is also stored in advance in generating unit 203 and, when condition 5-1 or 5-2 is determined, it is determined that such a message should be displayed together with the message from Fig. 35 .
- Fig. 35 shows an example in which only the message "WATCH OUT FOR FLU” is shown as corresponding to condition 5-1.
- a plurality of messages may be prepared to correspond to condition 5-1.
- the plurality of messages may be displayed side by side as shown in Fig. 40B or may be displayed one by one (in rotation) at a prescribed time interval, on the area for displaying messages on the screen image.
- determining unit 207 determines that the condition for determining a message is condition 6-1 at S112, and from the correspondence relation shown in Fig. 35 , determines the message "WATCH OUT FOR ... COLD" corresponding to condition 6-1 to be the message to be displayed.
- determining unit 207 determines that the condition for determining a message is condition 6-2 at S112, and from the correspondence relation shown in Fig. 35 , determines the message "FLU ALARM" corresponding to condition 6-2 to be the message to be displayed.
- generating unit 203 If the condition is 6-2, at S113, generating unit 203 generates display data for displaying the determined message "FLU ALARM" near the boundary between the pollution meter and the clean meter displayed as results of detection as shown in Fig. 41A .
- output unit 204 outputs the display data as such to display panel 130 and by such display control, the image of Fig. 41A is displayed on display panel 130.
- display data for displaying the message "WATCH OUT FOR ... COLD" near the boundary between the pollution meter and the clean meter is generated. More preferably, if the condition is 6-1 or 6-2, generating unit 203 also generates display data for additionally displaying the message "...
- Fig. 35 shows an example in which only the message "FLU ALARM” is shown as corresponding to condition 6-2.
- a plurality of messages may be prepared to correspond to condition 6-2.
- the plurality of messages may be displayed side by side as shown in Fig. 41B or may be displayed one by one (in rotation) at a prescribed time interval, on the area for displaying messages on the screen image.
- determining unit 207 determines that the condition for determining a message is condition 7-1 at S112, and from the correspondence relation shown in Fig. 35 , determines the messages "MOLD DEVELOPMENT PROBABLE” and "WATCH OUT FOR SUMMER COLD" corresponding to condition 7-1 to be the messages to be displayed.
- determining unit 207 determines that the condition for determining a message is condition 7-2 at S112 regardless of the humidity, and from the correspondence relation shown in Fig. 35 , determines the message "WATCH OUT FOR SUMMER COLD" corresponding to condition 7-2 to be the message to be displayed.
- generating unit 203 generates display data for displaying the determined messages "MOLD DEVELOPMENT PROBABLE” and "WATCH OUT FOR SUMMER COLD" near the boundary between the pollution meter and the clean meter displayed as results of detection as shown in Figs. 42A and 42B .
- output unit 204 outputs the display data as such to display panel 130 and by such display control, the images of Figs. 42A and 42B are displayed on display panel 130.
- display data for displaying the determined message "WATCH OUT FOR SUMMER COLD" near the boundary between the pollution meter and the clean meter is generated.
- determining unit 207 determines that the condition for determining a message is condition 8 at S112, and from the correspondence relation shown in Fig. 35 , determines the messages "TAKE CARE TO PREVENT DRY THROAT" and "WATCH OUT FOR COLD" corresponding to condition 8 to be the messages to be displayed.
- generating unit 203 generates display data for displaying the determined messages "TAKE CARE TO PREVENT DRY THROAT” and "WATCH OUT FOR COLD" near the boundary between the pollution meter and the clean meter displayed as results of detection as shown in Figs. 43A and 43B .
- output unit 204 outputs the display data as such to display panel 130 and by such display control, the images of Figs. 43A and 43B are displayed on display panel 130.
- condition determination unit 207 may specify condition 2 or condition 3-1 or 3-2, if other conditions (room temperature, weather and the like) are satisfied, other than condition 4, as the condition for determining the message.
- condition 4 is determined in accordance with the priority set beforehand. As described above, the priority is higher if the condition can be an environmental factor of higher risk. More preferably, the time of year is given higher priority and if a condition is specified by the time of year, the condition for determining the message is determined, with the condition related to the time of year given higher priority. In the example above, of the specified conditions 2, 3-1, 3-2 and 4, the condition 4 determined by the season is determined to be the condition for determining the message.
- determining unit 207 may specify conditions 6-1 or 6-2 if other condition or conditions (season) are satisfied, in addition to condition 8.
- control unit 270 determines condition 6-1 or 6-1 as the condition for determining the message.
- determining unit 207 determines that the condition for determining a message is condition 9 at S112, and from the correspondence relation shown in Fig. 35 , determines the message "TAKE CARE TO PREVENT DRY THROAT" corresponding to condition 9 to be the message to be displayed.
- generating unit 203 If the condition is 9, at S113, generating unit 203 generates display data for displaying the determined message "TAKE CARE TO PREVENT DRY THROAT" near the boundary between the pollution meter and the clean meter displayed as results of detection as shown in Fig. 44 .
- output unit 204 outputs the display data as such to display panel 130 and by such display control, the image of Fig. 44 is displayed on display panel 130.
- determining unit 207 determines that the condition for determining a message is condition 10 at S112, and from the correspondence relation shown in Fig. 35 , determines the message "MOLD DEVELOPMENT PROBABLE" corresponding to condition 10 to be the message to be displayed.
- generating unit 203 If the condition is 10, generating unit 203 generates display data for displaying the determined message "MOLD DEVELOPMENT PROBABLE" near the boundary between the pollution meter and the clean meter displayed as results of detection as shown in Fig. 45A .
- output unit 204 outputs the display data as such to display panel 130 and by such display control, the image of Fig. 45A is displayed on display panel 130.
- Fig. 35 shows an example in which only the message "MOLD DEVELOPMENT PROBABLE” is shown as corresponding to condition 10. However, a plurality of messages may be prepared to correspond to condition 10.
- a plurality of messages including "MOLD DEVELOPMENT PROBABLE” and “DEHUMIDIFY/REMOVE BACTERIA” are stored.
- the plurality of messages may be displayed side by side as shown in Fig. 45B or may be displayed one by one (in rotation) at a prescribed time interval, on the area for displaying messages on the screen image.
- determining unit 207 determines that the condition for determining a message is condition 11-1 at S112, and from the correspondence relation shown in Fig. 35 , determines the message "WATCH OUT FOR ... COLD" corresponding to condition 11-1 to be the message to be displayed.
- determining unit 207 determines that the condition for determining a message is condition 11-2 at S112, and from the correspondence relation shown in Fig. 35 , determines the message "WATCH OUT FOR FLU" corresponding to condition 11-2 to be the message to be displayed.
- generating unit 203 generates display data for displaying the determined message "WATCH OUT FOR FLU" near the boundary between the pollution meter and the clean meter displayed as results of detection as shown in Fig. 46A .
- output unit 204 outputs the display data as such to display panel 130 and by such display control, the image of Fig. 46A is displayed on display panel 130.
- display data for displaying the message "WATCH OUT FOR ... COLD" near the boundary between the pollution meter and the clean meter is generated.
- Fig. 35 shows an example in which only the message "WATCH OUT FOR FLU” is shown as corresponding to condition 11-2. However, a plurality of messages may be prepared to correspond to condition 11-2.
- a plurality of messages including "WATCH OUT FOR FLU” and "WASH YOUR HANDS AND GARGLE” are stored.
- the plurality of messages may be displayed side by side as shown in Fig. 46B or may be displayed one by one (in rotation) at a prescribed time interval, on the area for displaying messages on the screen image.
- determining unit 207 determines that the condition for determining a message is condition 12-1 at S112, and from the correspondence relation shown in Fig. 35 , determines the message "CLEAN ENVIRONMENT" corresponding to condition 12-1 to be the message to be displayed.
- determining unit 207 determines that the condition for determining a message is condition 12-2 at S112, and from the correspondence relation shown in Fig. 35 , determines the message "VERY CLEAN ENVIRONMENT" corresponding to condition 12-2 to be the message to be displayed.
- generating unit 203 generates display data for displaying the determined message "VERY CLEAN ENVIRONMENT" near the boundary between the pollution meter and the clean meter displayed as results of detection as shown in Fig. 47A .
- output unit 204 outputs the display data as such to display panel 130 and by such display control, the image of Fig. 47A is displayed on display panel 130.
- determining unit 207 may specify conditions 11-1 or 11-2 if other condition or conditions (season) are satisfied, in addition to condition 9.
- control unit 270 determines condition 11-1 or 11-1 as the condition for determining the message.
- both the microorganisms and dust particles are detected by detection apparatus 100 and the total sum of these is used as the pollution meter. What is necessary is that at least the microorganisms are detected. In that case, the bacteria meter corresponds to the pollution meter. Such detection can also serve to determine environmental status with high accuracy and realize appropriate message display. Therefore, the user can grasp the environmental status and take necessary measure.
- determining unit 207 determines that the condition for determining a message is condition 1-1 at S112, and from the correspondence relation shown in Fig. 35 , determines the message "ROOM AIR POLLUTED" corresponding to condition 1-1 to be the message to be displayed.
- a message such as "BACTERIA FLOATING" indicating many microorganisms is preferably prepared correspondingly.
- generating unit 203 generates display data for displaying the determined message "BACTERIA FLOATING" near the boundary between the pollution meter and the clean meter displayed as results of detection as shown in Fig. 49A .
- output unit 204 outputs the display data as such to display panel 130 and by such display control, the image of Fig. 49A is displayed on display panel 130.
- a plurality of messages may be prepared to correspond to condition 1-1.
- a plurality of messages including "BACTERIA FLOATING”, “RUN ION GENERATOR” and “RUN AIR PURIFIER” are stored.
- the plurality of messages may be displayed side by side as shown in Fig. 49B or may be displayed one by one (in rotation) at a prescribed time interval, on the area for displaying messages on the screen image.
- determining unit 207 determines that the condition for determining a message is condition 3-1 at S112, and from the correspondence relation shown in Fig. 35 , determines the message "RISK OF MOLD DEVELOPMENT ELEVATED" corresponding to condition 3-1 to be the message to be displayed.
- determining unit 207 determines that the condition for determining a message is condition 3-2 at S112, and from the correspondence relation shown in Fig. 35 , determines the message "RISK OF MOLD DEVELOPMENT ELEVATED" corresponding to condition 3-2 to be the message to be displayed.
- generating unit 203 generates display data for displaying the determined message "RISK OF MOLD DEVELOPMENT ELEVATED" near the boundary between the pollution meter and the clean meter displayed as results of detection as shown in Fig. 50A .
- output unit 204 outputs the display data as such to display panel 130 and by such display control, the image of Fig. 50A is displayed on display panel 130.
- a plurality of messages may be prepared to correspond to conditions 3-1 and 3-2.
- a plurality of messages including "RISK OF MOLD DEVELOPMENT ELEVATED” and “DEHUMIDIFY/REMOVE BACTERIA” are stored.
- the plurality of messages may be displayed side by side as shown in Fig. 50B or may be displayed one by one (in rotation) at a prescribed time interval, on the area for displaying messages on the screen image.
- the state of air at present is displayed as the results of detection by detection apparatus 100 and as the message.
- the state may be compared with previous state of the air and the result of comparison may be displayed.
- Fig. 51 is a flowchart representing the flow of Modification 2 of the display control in accordance with the second example.
- the process shown in the flowchart of Fig. 51 is realized by a CPU, not shown, included in control device 200 reading and executing programs stored in the memory to invoke various functions shown in Fig. 32 .
- the initial setting may include setting of levels of pollution degree represented as relative values of the total sum of the amount of microorganisms and dust particles in the subsequent processes in the similar manner as described above. Further, the initial setting may include setting of time interval for detecting the state of air, and setting of the level for giving an alarm (hereinafter also referred to as alarm level) in the subsequent processes.
- detected value input unit 201 receives input of the results of detection from detection apparatus 100, and computing unit 202 calculates the relative values of the microorganisms with respect to the "total value” of microorganisms and the relative value of dust particles with respect to the “total value” of dust, and a level corresponding to the total sum is identified, whereby the level is detected.
- computing unit 202 stores beforehand the correspondence relation between the relative values and levels, such as the sum of relative values of microorganisms and dust particles up to 30% corresponds to "Level 0", 30% to 40% corresponds to "Level 1", 40% to 50% corresponds to "Level 2", 50% to 60% corresponds to "Level 3", 60% to 70% corresponds to "Level 4" and 70% and higher corresponds to "Level 5" and, by identifying the level corresponding to the calculated relative values, it can detect the level.
- determining unit 207 compares the set alarm level with the detected level. As a result, if the detected level is higher than the alarm level (YES at S305), generating unit 203 reads display data for displaying an alarm message stored in advance, and passes the data to output unit 204. Thus, the process for display takes place at output unit 204, and the alarm message is displayed.
- the alarm message here may be the same as that in accordance with the first example of display control.
- display control unit 210 may end the process without executing the process for displaying the alarm at step S307.
- a process for comparing the detected level with previous level and displaying the status in accordance with the result of comparison is executed.
- determining unit 207 stores the level detected at computing unit 202, and at S309, compares the level detected and stored previously with the level detected at S303. As a result, if the detected level is lower than the previous level, it is determined that the air state has been improved, and the process for improved state is executed.
- condition storage unit 206 Correspondence between the detected levels and messages used for respective processes are stored as conditions in condition storage unit 206.
- Fig. 52 shows specific examples of the correspondence between detected levels and messages for the process when the state has been improved.
- generating unit 203 refers to the correspondence shown in Fig. 52 , reads the display data for displaying the message corresponding to the detected level, and passes the data to output unit 204.
- the process for display is executed at output unit 204, and the message corresponding to the detected level of improved state is displayed.
- Fig. 53 shows specific examples of the correspondence between detected levels and messages for the process when the state has been worsened.
- generating unit 203 refers to the correspondence shown in Fig. 53 , reads the display data for displaying the message corresponding to the detected level, and passes the data to output unit 204.
- the process for display is executed at output unit 204, and the message corresponding to the detected level of worsened state is displayed.
- Fig. 54 shows specific examples of the correspondence between detected levels and messages for the process when the state has been maintained.
- generating unit 203 refers to the correspondence shown in Fig. 54 , reads the display data for displaying the message corresponding to the detected level, and passes the data to output unit 204.
- the process for display is executed at output unit 204, and the message corresponding to the detected level of maintained state is displayed.
- air purifier 1 shown in Fig. 1B may be realized by a plurality of devices.
- a display control device 210A corresponding to display control unit 210 is connected to air purifier 1 including detection apparatus 100.
- Display control device 210A has the results of detection by detection apparatus 100 (or results of detection and message) displayed on a television receiver (hereinafter denoted as TV) 130A or on a portable telephone 130B as a display device.
- TV television receiver
- display control device 210A of the modification is similar to the functional configuration of display control unit 210 shown in Figs. 27 and 32 . It is noted, however, that in display control device 210A, detected value input unit 201 communicates with output unit 43 of detection apparatus 100 to receive the results of detection. Further, output unit 204 outputs display data to TV 130A or portable telephone 130B in place of (or in addition to) display panel 130. An application (program) for displaying the results of detection is stored in advance in TV 130A and portable telephone 130B. When the display data is received from display control device 210A, a CPU, not shown, activates the application and causes these display devices to display the results of detection (or results of detection and message).
- output unit 204 of display control device 210A stores the information of output destination and other conditions related to output in advance, and outputs the display data to the output destination stored in advance in accordance with the conditions, at prescribed timing.
- the conditions related to output may include, for example, priority as the output destination when a plurality of different types of output destinations are stored.
- the condition may include the priority as to which of these is to be used as the output destination.
- Fig. 56 shows a process executed when, of TV 130A and portable telephone 130B as the output devices, higher priority as the output destination is set for TV 130A.
- output unit 204 determines whether or not the main power of TV 130A is ON or OFF.
- the method of determination is not specifically limited.
- a predetermined response request is output to TV 130A and if there is no response, it is determined that the main power is OFF.
- output unit 204 further determines whether or not TV 130A is currently displaying any image. The method similar to the above may be used for determination. If TV 130A is not displaying any image (NO at S203), at S205, output unit 204 transmits a predetermined control signal for starting display on TV 130A before outputting the display data and, at S207, outputs the display data generated at S113 to TV 130A. If TV 130A is displaying any image (YES at S203), the display data is output to TV 130A at S207, without transmitting the control signal.
- output unit 204 outputs the display data generated at S113 to portable telephone 130B stored as the output destination of second highest priority.
- the output here may use a method of writing the display data in a mail format stored in advance and sending the mail.
- the results of detection are displayed on the screen of TV 130A. Further, for a user not supposed to be near TV 130A, the results of detection (or the results of detection and message) are displayed not on the screen of TV 130A but on a screen of portable telephone 130B.
- a circle graph such as Fig. 10 or a message may be displayed superposed on a broadcast program, or the graph or message may be displayed on a display area different from the broadcast program.
- a plurality of air purifiers may be connected to display control device 210A, and the results of detection (or the results of detection and message) from the detection apparatus mounted in each air purifier may be displayed on TV 130A or portable telephone 130B as the display device.
- display control device 210A stores in advance identification information allowing identification of each detection apparatus, and outputs the identification information in relation with the display device to TV 130A or portable telephone 130B.
- TV 130A or portable telephone 130B also stores in advance identification information allowing identification of each detection apparatus, and based on the identification information related to the display data, displays the results of detection of each detection apparatus (air purifier).
- TV 130A stores correspondence between the pieces of identification information and the air purifiers in advance, and displays, together with the circle graph or message representing the results of detection, the information indicating the air purifier (in the example of Fig. 57 , the place of installment).
- the display in accordance with the modification it becomes possible to grasp the information presented in unified manner including information related to the ratio of microorganisms and dust particles in the air as a whole and the information related to humidity, temperature, weather or season, as well as the message related to the environmental status determined generally using such information, even at a location away from detection apparatus 100.
- control device 200 of air purifier 1 includes an output control unit in accordance with the manner of output in place of display control unit 210, and the output control unit executes a process for outputting the results of detection by detection apparatus 100 or the results of detection and the message by voice, music, light, vibration, or a combination of these.
- a program for causing a computer to execute the process of display control unit 210 or display control device 210A may be recorded on a computer readable recording medium such as a flexible disk, CD-ROM (Compact Disk-Read Only Memory), an ROM (Read Only Memory), an RAM (Random Access Memory) or a memory card attached to the computer, and provided as a program product.
- the program may be provided recorded on a recording medium such as a hard disk mounted inside the computer. Further, the program may be provided by downloading through a network.
- the program may be realized by calling and executing, from program modules provided as part of the operating system (OS) of a computer, necessary modules at prescribed timing in a prescribed sequence. In that case, the modules themselves are not included in the program itself, and the process is executed in cooperation with the OS.
- OS operating system
- the program may be provided incorporated in a part of another program.
- the program itself does not include any module included in said another program, and the process is executed in cooperation with said another program.
- the provided program product is executed, installed in a program storage unit such as the hard disk.
- the program product includes the program itself and the recording medium on which the program is recorded.
Landscapes
- Chemical & Material Sciences (AREA)
- Health & Medical Sciences (AREA)
- Life Sciences & Earth Sciences (AREA)
- Organic Chemistry (AREA)
- Immunology (AREA)
- Analytical Chemistry (AREA)
- Biochemistry (AREA)
- General Health & Medical Sciences (AREA)
- Physics & Mathematics (AREA)
- Engineering & Computer Science (AREA)
- Dispersion Chemistry (AREA)
- Zoology (AREA)
- Wood Science & Technology (AREA)
- Proteomics, Peptides & Aminoacids (AREA)
- General Physics & Mathematics (AREA)
- Pathology (AREA)
- Microbiology (AREA)
- Molecular Biology (AREA)
- Biotechnology (AREA)
- Biophysics (AREA)
- Toxicology (AREA)
- Bioinformatics & Cheminformatics (AREA)
- General Engineering & Computer Science (AREA)
- Genetics & Genomics (AREA)
- Apparatus Associated With Microorganisms And Enzymes (AREA)
- Indicating Measured Values (AREA)
- Measuring Or Testing Involving Enzymes Or Micro-Organisms (AREA)
Applications Claiming Priority (3)
| Application Number | Priority Date | Filing Date | Title |
|---|---|---|---|
| JP2009196932 | 2009-08-27 | ||
| JP2009196933 | 2009-08-27 | ||
| PCT/JP2010/063868 WO2011024672A1 (fr) | 2009-08-27 | 2010-08-17 | Dispositif de commande d'affichage |
Publications (2)
| Publication Number | Publication Date |
|---|---|
| EP2472247A1 true EP2472247A1 (fr) | 2012-07-04 |
| EP2472247A4 EP2472247A4 (fr) | 2013-03-06 |
Family
ID=43627777
Family Applications (1)
| Application Number | Title | Priority Date | Filing Date |
|---|---|---|---|
| EP10811722A Withdrawn EP2472247A4 (fr) | 2009-08-27 | 2010-08-17 | Dispositif de commande d'affichage |
Country Status (5)
| Country | Link |
|---|---|
| US (1) | US8872653B2 (fr) |
| EP (1) | EP2472247A4 (fr) |
| JP (1) | JPWO2011024672A1 (fr) |
| CN (1) | CN102639986A (fr) |
| WO (1) | WO2011024672A1 (fr) |
Families Citing this family (27)
| Publication number | Priority date | Publication date | Assignee | Title |
|---|---|---|---|---|
| CN102770525B (zh) * | 2010-02-26 | 2015-12-09 | 夏普株式会社 | 用于检测空中漂浮的生物粒子的检测设备和方法 |
| JP2012233796A (ja) * | 2011-05-02 | 2012-11-29 | Sharp Corp | 検出装置および検出方法 |
| JP5134146B1 (ja) * | 2011-09-09 | 2013-01-30 | シャープ株式会社 | 粒子検出装置 |
| JP5053453B1 (ja) * | 2011-09-09 | 2012-10-17 | シャープ株式会社 | 粒子検出装置 |
| JP5134131B1 (ja) * | 2011-09-09 | 2013-01-30 | シャープ株式会社 | 粒子検出装置 |
| JP5134130B1 (ja) * | 2011-09-09 | 2013-01-30 | シャープ株式会社 | 粒子検出装置 |
| JP5134147B1 (ja) * | 2011-09-09 | 2013-01-30 | シャープ株式会社 | 粒子検出装置 |
| CN103186700B (zh) * | 2011-12-28 | 2016-01-27 | 国际商业机器公司 | 基于环形角度的数据展示方法和系统 |
| JP2013169196A (ja) * | 2012-02-22 | 2013-09-02 | Sharp Corp | 検出装置および検出方法 |
| JP5925519B2 (ja) * | 2012-02-23 | 2016-05-25 | シャープ株式会社 | 粒子検出装置 |
| JP5748687B2 (ja) * | 2012-02-23 | 2015-07-15 | シャープ株式会社 | 粒子検出装置および空調機器 |
| JP5797162B2 (ja) * | 2012-06-29 | 2015-10-21 | シャープ株式会社 | 捕集部材清掃具、粒子検出装置および捕集部材清掃具の製造方法 |
| KR20140087729A (ko) * | 2012-12-31 | 2014-07-09 | 엘지전자 주식회사 | 포터블 디바이스 및 사용자 인터페이스 제어 방법 |
| JP6291740B2 (ja) * | 2013-07-26 | 2018-03-14 | セイコーインスツル株式会社 | 塵埃量検出装置および塵埃量検出装置の制御方法 |
| JP2015077102A (ja) * | 2013-10-17 | 2015-04-23 | シャープ株式会社 | 加熱冷却装置および検出装置 |
| JP6233711B2 (ja) * | 2014-04-25 | 2017-11-22 | パナソニックIpマネジメント株式会社 | 粒子測定装置 |
| KR101528773B1 (ko) * | 2014-05-16 | 2015-06-15 | 연세대학교 산학협력단 | 대기중의 바이오 입자 및 넌바이오 입자 실시간 검출장치 및 이를 이용한 검출방법 |
| JP2016109629A (ja) * | 2014-12-09 | 2016-06-20 | パナソニックIpマネジメント株式会社 | 粒子測定装置、空気清浄機、及び、粒子測定方法 |
| US10222360B1 (en) * | 2015-01-16 | 2019-03-05 | Airviz Inc. | Home air quality analysis and reporting |
| JP6475069B2 (ja) * | 2015-04-23 | 2019-02-27 | アズビル株式会社 | 粒子検出装置及び粒子の検出方法 |
| CN104857798A (zh) * | 2015-05-06 | 2015-08-26 | 京东方科技集团股份有限公司 | 显示装置 |
| CN106338105B (zh) * | 2015-07-08 | 2020-04-10 | 松下知识产权经营株式会社 | 吸气装置以及吸气方法 |
| DE102016215419A1 (de) * | 2016-08-17 | 2018-02-22 | Fraunhofer-Gesellschaft zur Förderung der angewandten Forschung e.V. | Messanordnung und Verfahren zum Lenken und Detektieren von Partikeln |
| US20180113297A1 (en) * | 2016-10-21 | 2018-04-26 | Tanner Research, Inc. | Active droplet transport defogging |
| EP3561491B1 (fr) * | 2016-12-21 | 2022-06-22 | LG Electronics Inc. | Dispositif de mesure pour détecter des microorganismes dans l'air |
| JP6837350B2 (ja) * | 2017-02-16 | 2021-03-03 | シャープ株式会社 | 情報システムおよびサーバ装置 |
| DE102018219891A1 (de) * | 2018-11-20 | 2020-05-20 | Robert Bosch Gmbh | Verfahren zum Betreiben eines Partikelsensors |
Family Cites Families (15)
| Publication number | Priority date | Publication date | Assignee | Title |
|---|---|---|---|---|
| JPH11166754A (ja) * | 1997-12-03 | 1999-06-22 | Matsushita Seiko Co Ltd | 花粉防止装置 |
| US6055052A (en) | 1998-01-26 | 2000-04-25 | Mie Corporation | System for, and method of, monitoring airborne particulate, including particulate of the PM2.5 class |
| JP2000283533A (ja) | 1999-03-31 | 2000-10-13 | Aiwa Co Ltd | 空気清浄装置及び空気の汚れ状態表示装置 |
| JP4726280B2 (ja) * | 2000-07-06 | 2011-07-20 | 株式会社堀場製作所 | 測定システムおよび測定器 |
| CN100510099C (zh) * | 2001-07-18 | 2009-07-08 | 朝日啤酒株式会社 | 微生物的检查装置及检查方法 |
| JP2003038163A (ja) * | 2001-07-26 | 2003-02-12 | Yamato Seisakusho:Kk | 微生物検出装置 |
| JP4448673B2 (ja) * | 2003-08-22 | 2010-04-14 | シスメックス株式会社 | 細菌分析装置および方法 |
| JP2005102645A (ja) * | 2003-10-01 | 2005-04-21 | Sysmex Corp | 微生物の殺菌処理効果測定方法 |
| CN100595564C (zh) | 2004-07-30 | 2010-03-24 | 百维吉伦特系统有限公司 | 病原体和粒子检测器系统和方法 |
| RU2007135288A (ru) * | 2005-02-23 | 2009-03-27 | Алфред Майкл ВИГВЕРИ (AU) | Система наблюдения для обнаружения микроорганизмов |
| US7518710B2 (en) * | 2005-07-14 | 2009-04-14 | Battelle Memorial Institute | Optical devices for biological and chemical detection |
| US20120120385A1 (en) | 2006-06-27 | 2012-05-17 | Jian-Ping Jiang | Pathogen detection by simultaneous size/fluorescence measurement |
| KR100821333B1 (ko) * | 2007-01-18 | 2008-04-11 | 삼성전자주식회사 | 미생물 또는 미세입자 실시간 검출 장치 및 그 방법 |
| JP5222050B2 (ja) | 2008-07-08 | 2013-06-26 | シャープ株式会社 | 空気調和機 |
| CN102770525B (zh) | 2010-02-26 | 2015-12-09 | 夏普株式会社 | 用于检测空中漂浮的生物粒子的检测设备和方法 |
-
2010
- 2010-08-17 WO PCT/JP2010/063868 patent/WO2011024672A1/fr not_active Ceased
- 2010-08-17 US US13/392,471 patent/US8872653B2/en not_active Expired - Fee Related
- 2010-08-17 EP EP10811722A patent/EP2472247A4/fr not_active Withdrawn
- 2010-08-17 CN CN2010800377277A patent/CN102639986A/zh active Pending
- 2010-08-17 JP JP2011528745A patent/JPWO2011024672A1/ja active Pending
Also Published As
| Publication number | Publication date |
|---|---|
| JPWO2011024672A1 (ja) | 2013-01-31 |
| CN102639986A (zh) | 2012-08-15 |
| EP2472247A4 (fr) | 2013-03-06 |
| US20120154348A1 (en) | 2012-06-21 |
| WO2011024672A1 (fr) | 2011-03-03 |
| US8872653B2 (en) | 2014-10-28 |
Similar Documents
| Publication | Publication Date | Title |
|---|---|---|
| US8872653B2 (en) | Display control device | |
| CN103645123B (zh) | 用于检测空中漂浮的生物粒子的检测设备和方法 | |
| JP2012072946A (ja) | 空気調和機 | |
| US10345216B2 (en) | Systems, devices, and methods for flow control and sample monitoring control | |
| US20120136584A1 (en) | Detection apparatus and detection method for detecting microorganisms | |
| JP2011083214A (ja) | 微生物検出装置および検出方法 | |
| JP2011097861A (ja) | 微生物検出装置および検出方法 | |
| JP5844071B2 (ja) | 検出装置および検出方法 | |
| JP2012047427A (ja) | 空気清浄機および空気清浄機における表示方法 | |
| JP2012251732A (ja) | 制御装置および制御方法 | |
| US20230064876A1 (en) | Near real-time, hands-off detection of airborne particulate contaminants and bioburden | |
| JP4690789B2 (ja) | 大気中微粒子測定装置 | |
| EP2818846A1 (fr) | Détecteur de particules et climatiseur | |
| JP5925519B2 (ja) | 粒子検出装置 | |
| WO2012029649A1 (fr) | Filtre à air, procédé d'affichage pour filtre à air et climatiseur | |
| WO2012165558A1 (fr) | Dispositif de commande et procédé de présentation | |
| JP2012127727A (ja) | 検出装置および検出方法 | |
| JP2012141277A (ja) | 検出装置および検出方法 | |
| JP5923016B2 (ja) | 微生物検出システム及び微生物の検出方法 | |
| JP2013195194A (ja) | 微小光量検出装置および微生物センサ | |
| JP2012251890A (ja) | 制御装置および提示方法 | |
| JP2013250135A (ja) | 検出装置および検出方法 |
Legal Events
| Date | Code | Title | Description |
|---|---|---|---|
| PUAI | Public reference made under article 153(3) epc to a published international application that has entered the european phase |
Free format text: ORIGINAL CODE: 0009012 |
|
| 17P | Request for examination filed |
Effective date: 20120326 |
|
| AK | Designated contracting states |
Kind code of ref document: A1 Designated state(s): AL AT BE BG CH CY CZ DE DK EE ES FI FR GB GR HR HU IE IS IT LI LT LU LV MC MK MT NL NO PL PT RO SE SI SK SM TR |
|
| DAX | Request for extension of the european patent (deleted) | ||
| A4 | Supplementary search report drawn up and despatched |
Effective date: 20130205 |
|
| RIC1 | Information provided on ipc code assigned before grant |
Ipc: C12M 1/34 20060101ALI20130130BHEP Ipc: G09G 5/36 20060101ALI20130130BHEP Ipc: G01N 15/02 20060101ALI20130130BHEP Ipc: G01N 15/00 20060101AFI20130130BHEP Ipc: C12Q 1/06 20060101ALI20130130BHEP Ipc: G01D 7/08 20060101ALI20130130BHEP Ipc: G09G 5/00 20060101ALI20130130BHEP |
|
| 17Q | First examination report despatched |
Effective date: 20131010 |
|
| STAA | Information on the status of an ep patent application or granted ep patent |
Free format text: STATUS: THE APPLICATION IS DEEMED TO BE WITHDRAWN |
|
| 18D | Application deemed to be withdrawn |
Effective date: 20140221 |