EP0268488A2 - Verfahren und Vorrichtung zur Anwendung eines elektrooptischen Detektors in einem mikrotomographischen System - Google Patents
Verfahren und Vorrichtung zur Anwendung eines elektrooptischen Detektors in einem mikrotomographischen System Download PDFInfo
- Publication number
- EP0268488A2 EP0268488A2 EP87310238A EP87310238A EP0268488A2 EP 0268488 A2 EP0268488 A2 EP 0268488A2 EP 87310238 A EP87310238 A EP 87310238A EP 87310238 A EP87310238 A EP 87310238A EP 0268488 A2 EP0268488 A2 EP 0268488A2
- Authority
- EP
- European Patent Office
- Prior art keywords
- detector
- electro
- image
- optic
- ray
- Prior art date
- Legal status (The legal status is an assumption and is not a legal conclusion. Google has not performed a legal analysis and makes no representation as to the accuracy of the status listed.)
- Granted
Links
Images







Classifications
-
- G—PHYSICS
- G01—MEASURING; TESTING
- G01T—MEASUREMENT OF NUCLEAR OR X-RADIATION
- G01T1/00—Measuring X-radiation, gamma radiation, corpuscular radiation, or cosmic radiation
- G01T1/29—Measurement performed on radiation beams, e.g. position or section of the beam; Measurement of spatial distribution of radiation
- G01T1/2914—Measurement of spatial distribution of radiation
- G01T1/2921—Static instruments for imaging the distribution of radioactivity in one or two dimensions; Radio-isotope cameras
- G01T1/2928—Static instruments for imaging the distribution of radioactivity in one or two dimensions; Radio-isotope cameras using solid state detectors
-
- G—PHYSICS
- G01—MEASURING; TESTING
- G01N—INVESTIGATING OR ANALYSING MATERIALS BY DETERMINING THEIR CHEMICAL OR PHYSICAL PROPERTIES
- G01N23/00—Investigating or analysing materials by the use of wave or particle radiation, e.g. X-rays or neutrons, not covered by groups G01N3/00 – G01N17/00, G01N21/00 or G01N22/00
- G01N23/02—Investigating or analysing materials by the use of wave or particle radiation, e.g. X-rays or neutrons, not covered by groups G01N3/00 – G01N17/00, G01N21/00 or G01N22/00 by transmitting the radiation through the material
- G01N23/04—Investigating or analysing materials by the use of wave or particle radiation, e.g. X-rays or neutrons, not covered by groups G01N3/00 – G01N17/00, G01N21/00 or G01N22/00 by transmitting the radiation through the material and forming images of the material
- G01N23/046—Investigating or analysing materials by the use of wave or particle radiation, e.g. X-rays or neutrons, not covered by groups G01N3/00 – G01N17/00, G01N21/00 or G01N22/00 by transmitting the radiation through the material and forming images of the material using tomography, e.g. computed tomography [CT]
-
- G—PHYSICS
- G01—MEASURING; TESTING
- G01N—INVESTIGATING OR ANALYSING MATERIALS BY DETERMINING THEIR CHEMICAL OR PHYSICAL PROPERTIES
- G01N2223/00—Investigating materials by wave or particle radiation
- G01N2223/40—Imaging
- G01N2223/419—Imaging computed tomograph
-
- Y—GENERAL TAGGING OF NEW TECHNOLOGICAL DEVELOPMENTS; GENERAL TAGGING OF CROSS-SECTIONAL TECHNOLOGIES SPANNING OVER SEVERAL SECTIONS OF THE IPC; TECHNICAL SUBJECTS COVERED BY FORMER USPC CROSS-REFERENCE ART COLLECTIONS [XRACs] AND DIGESTS
- Y10—TECHNICAL SUBJECTS COVERED BY FORMER USPC
- Y10S—TECHNICAL SUBJECTS COVERED BY FORMER USPC CROSS-REFERENCE ART COLLECTIONS [XRACs] AND DIGESTS
- Y10S378/00—X-ray or gamma ray systems or devices
- Y10S378/901—Computer tomography program or processor
Definitions
- Computerized tomography refers to the procedures used to generate two dimensional maps of some physical quantity in a planar section of a target by measuring and analyzing the attenuation of beams of penetrating radiation passed through the target along sets of coplanar rays.
- a complete apparatus must contain four elements: (1) a source of penetrating radiation, (2) detectors that measure the transmitted intensity of the radiation after passage through the target, and that can be calibrated to give the unattenuated intensity of radiation in the absence of the target, (3) a computational device to store and process the attenuation measurements, converting them into a digital map of attenuation coefficients in the observed plane of the target, and (4) a device to display the resultant image.
- Tomography can be practiced in many ways, but the broadest commercial usage is in medical radiology to provide diagnostic maps of bone and tissue structure in human patients (W. Swindell and H. H. Barett, "Computerized Tomography: Taking Sectional X-Rays", Physics Today, pp. 32-41,1977; C. C. Jaffe, “Medical Imaging”, American Scientist, 70, 576 (1982); and P. Alexander, "Array Processors in Medical Imaging", Computer, 16, (1983).
- Medical CT uses broad band bremsstrahlung radiation from X-ray tubes to produce penetrating radiation that is measured, typically, by scintillation crystals and photo-tubes.
- Measurements are stored in a programmable digital computer and analyzed using a method generically referred to as convolution (or filtered) back projection (referred to hereafter as FBP).
- FBP convolution (or filtered) back projection
- the density map derived from the analysis is displayed on a cathode ray tube as a two dimensional cross sectional image containing approximately 250 x 250 elements or pixels, with a resolution of about 1 millimeter, and 1 % accuracy in determination of X-ray attenuation coefficient.
- Medical procedures typically produce scans in only a limited number of adjacent body planes, typically one to twenty.
- special purpose tomography probes have been built using different types of ionizing radiation, such as gamma rays and electrons.
- An object of the present invention is to provide a method for using an imaging electro-optic detector in acquiring tomographic data.
- an electro-optic detector instead of conventional scintillation detectors spatial resolution and physical scale in reconstructed images can be significantly improved. Spatial resolution attainable using electro-optic detectors can be as small as .5 microns which is 100-1,000 times better than that achieved with scintillation detectors in conventional medical CT.
- Physical scale in the reconstructed image is increased by acquiring data in mulitiple stacked planes simultaneously. The number of resolution elements per plane is comparable to or significantly greater than that for conventional medical CT. Increasing the physical scale in this manner permits reconstruction of an object on a three dimensional network of points.
- the amount of data acquired and processed to reconstruct an object on a three dimensional grid containing N 3 points is much greater than in medical CT. Since the number of data points, N, acquired in a line across the image can be greater than 500, it is important to utilize data inversion techniques requiring N 2 rather than N 3 operations to reconstruct an image.
- N data points
- the methods described herein can be thought of as part of the operation of a three dimensional X-ray microscope.
- the present invention is an apparatus and a method for producing tomographic images of an object irradiated by a beam of collimated radiation transmitted in a plurality of rays through a set of coplanar sections of an object as viewed from a plurality of angles about a rotation axis.
- the apparatus includes an imaging electro-optic detector to record the transmitted radiation, wherein the electro-optic detector alters the image format, the format alteration being focused; means to determine and align the projected position of the rotation axis on the electro-optic detector; means to align the object with respect to the rotation axis; means to determine and assure spatial uniformity of detector response; means to reduce signal dependent backgrounds; means to determine the attenuation (projection coefficients) from the transmitted radition with respect to one or more reference calibration exposures; and means to compute a reconstructed image of the object's attenuation coefficients.
- This invention is broadly a method for using a new type of detector for computerized tomography.
- the detector can be used in a mode which increases spatial resolution in reconstructed images, below 10 microns.
- a particular form of the detector can be used to acquire data in multiple stacked planes, allowing the internal structure of a sample to be reconstructed on a three dimensional network of points.
- the device described herein functions as a three dimensional x-ray microscope.
- the detector is usable with any form of radiation which can be converted within the detector to more easily handle quanta which are used to form an image on a recording device within the detector.
- radiations which fulfill this requirement are ionizing radiations such as X-rays, gamma rays, neutrons and ultraviolet light. It should be noted that fluorescent conversion processes for visible light in which no ionized state is formed are included within the definition of radiations which can be used with the detector.
- the present invention will be illustrated using X-rays as the radiation detected, although any of the other allowable radiation forms can be used.
- Electro-optic radiation detectors can be broadly defined as position sensitive detectors which utilize components developed for the amplification and recording of optical images. Because of the imaging characteristics of this class of detectors, significantly higher spatial resolutions can be obtained than are possible with scintillation detectors used in conventional tomographic devices.
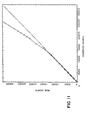
- the generic detector as depicted in Figure 1, consists of four elements: an energy converter, an optional gain element, a device to magnify or demagnify the image (i.e., an image format altering device) and a readout device.
- the function of the energy converter is to distribute the energy of the X-ray photon amongst numerous, more easily handled quanta. Typically, it is a phosphor screen which produces visible light. In some cases, it may be an electron emitting photocathode. Often, the quanta produced in the converter are still too few in number to be effectively recorded in the readout device; consequently, a gain element may be interposed.
- Typical gain elements are magnetic or electrostatically focused image intensifiers or microchannel plates.
- the format of the output from the gain element (or phosphor) must usually be altered before it is recorded with an imaging readout device. Format alteration is necessary because the image from the gain element or phosphor usually differs in size from the readout device. Hence it is usually necessary to couple the two via magnifying or reducing mechanisms. Magnification or demagnification of the image can be accomplished with either electron or light optics. Light optic format alterations can be accomplished using either lens or fiber optic coupling. With electron optics, format alterations can be obtained from electrostatic focusing in an image intensifier. Readout devices are the most diverse class of elements in electro-optic detectors. They range from a bewildering assortment of vacuum tubes, to solid state detector arrays, to resistive anode devices, several of which are listed in Figure 1.
- CCD solid state charge coupled devices
- CCD sensors have evolved to become the preeminent electro-optical sensor technology and in a preferred embodiment are used as readout devices.
- the most important aspect of CCD sensors for optical image detection is that they exhibit a readout and dark noise which is at least an order of magnitude lower than vidicons, isocons, orthocons and other electro-optic sensors.
- Commercially available CCD sensors have a readout noise of less than 50 electrons/pixel and a dark noise of less than 5 electrons/minute-pixel when operated at temperatures below -75°C. These low noise figures result in substantial improvements in detective quantum efficiency of electro-optic x-ray detectors constructed with CCD sensors.
- CCD sensors also exhibit the largest dynamic range (saturation signal/r.m.s.
- CCD sensors Accumulated charge is read out from CCD sensors by passing charge from pixel to pixel in a bucket brigade fashion to an onboard charge sensitive preamplifier. Noise in readout of the onboard preamplifier is substantially reduced through use of a double correlated sampling technique, which cannot be used with other electro-optical sensor technologies. Readout rate is limited by the requirement that the efficiency of transferring charge from pixel to pixel be greater than 99.99% (99.999% charge transfer efficiencies can be achieved on some chips). For most chips readout rates faster than 1-10 microseconds/pixel degrade the charge transfer efficiency. Since defect free CCD sensors containing 5 x 10 5 pixels have been manufactured and chips containing 5 x 10 7 pixels are being developed, readout time for CCD chips can vary from .1-10 sec.
- CCD detectors can operate in a time resolved mode which shifts either all columns or rows of pixels over one position without reading the entire device. In this mode it is possible to use a CCD sensor to record changes in x-ray signals with a temporal resolution of microseconds.
- the opening angle of the collimated X-ray beam is broad enough so that the fan of paths from source to detector completely encompasses the target.
- the range of impact parameters must span the diameter of the target and the angular rotations must span at least one half of a complete rotation.
- Fan beam collimation Another mode of operation for a tomographic scanner is shown in Figure 4.
- Collimated X-rays, or other penetrating radiation illuminate the target along two dimensional sets of plane parallel paths that are recorded by a panoramic detector. If a two dimensional imaging electro-optic detector is used, data in multiple stacked planes is measured simultaneously. Views from different angles are achieved by rotating the target (as shown in Fig.
- the intensity of the incident (lo) and detected (I D ) beam are related by attenuation along the path through the target.
- F(ti,t 2 ) is the linear attenuation coefficient in the target
- the integration over t 2 traverses the beam's path (see Figure 2).
- the quantity actually used in tomographic analysis is the optical depth or "projection" P( ⁇ ,t 1 ) defined as
- the apparatus makes panoramic measurements of transmitted radiation that can be used to obtain both l o and I D . This is achieved through use of a suitable calibration procedure. It is an object of the present invention to define calibration procedures for electro-optic detectors so that projections can be measured with sufficient accuracy for processing by reconstruction algorithms.
- inversion methods reconstruct the attenuation coefficient F(x,y) at a point as a linear weighted summation of the measured projection data where the weights w(x,y;(p m ,tn) depend on the position in the target and the orientation of the scan. Eq. 3 indicates that the scan data can be inverted to evaluate F(x,y) at any arbitrary point inside the target.
- Initial reconstruction methods for medical tomography used an interative procedure (see U.S. Pat. 3,778,614) to recover the attenuation coefficients F(x,y). Starting with an arbitrary initial trial solution, the method computationally derived values for projection data that would occur from the trial image. Differences between measured and derived projection data were used to correct the trial image successively until sufficient agreement was obtained between computed and observed projections.
- DFI Direct Fourier Inversion Methods
- the Fourier coefficients depend on the coordinate origin chosen for the spatial measurements. It is necessary to shift all transforms so that the origin corresponds to a common point. That origin is given by the point at which the rotation axis defining the view angles intercepts the target plane. Without the origin shift, the phases of the Fourier coefficients become scrambled in the inversion.
- the basic steps of the Direct Fourier Inversion Method are:
- the DFI method can produce acceptable images only for targets in which the attenuation coefficient varies smoothly.
- the direct Fourier inversion method as described in steps 1-6, produces unacceptable images for practical targets, such as are found in medical applications, where sharp density variations are encountered between bone and soft tissue.
- Problems pre viously encountered arise from inaccuracy in the interpolation procedure, and from the basic problem that Fourier analyses tend to produce oscillatory artifacts when they encounter sharp discontinuities. Taken together these problems introduce unacceptable distortion and artifacts into the reconstructed images.
- step (1) above we "pad" the projection data by adding additional data at impact parameters both smaller and larger than were actually observed. Since the target does not extend beyond the observed range of impact parameters, the values for the padded data do not need to be estimated; they are known exactly to be zero. Thus, by padding we are not introducing an approximation, we are using additional known information. We also use padding to assure that the number of data points in the projection are an integral power of 2, as required for optimum use of the FFT.
- Filtering essentially corresponds to averaging the reconstruction over length scales inversely proportional to the cutoff frequency. Viewed in this way it can readily be shown that filtering sacrifices resolution in order to improve the relative accuracy of values for the attenuation coefficient in the reconstruction.
- the choice of cutoff frequency S c can be chosen to adjust the degree of smoothing selectively.
- Noise in tomographic images arises from two sources: (1) noise in the data, and (2) noise amplification introduced by the inversion method.
- the basic data consist of measurements of the attenuation of a signal, typically an X-ray beam, passed through the target along many coplanar rays, (L. A. Shepp and B. F. Logan, "The Fourier Reconstruction of a Head Section", IEEE Trans. Nucl. Sci., Vol. NS-21, pp. 21-43,1974).
- Figure 2 defines Cartesian coordinates in the frame of the target and a scanning device oriented to view the target from an angle ç.
- (t 1 , t 2 ) define positions perpendicular to and along the path of the beam.
- the attenuation measurements must have adequate signal-to-noise, and geometrical coverage of the scan-beams must fill the ( ⁇ p, t) plane densely enough to give the desired resolution.
- Resolution in the reconstruction cannot exceed the pixel size A t, and the rotation between views ⁇ should be such that D ⁇ /2 ⁇ t, i.e. M ⁇ N/2.
- Data in this format can be used to reconstruct an image of the observed plane covering an area AD 2 on a grid of order NxN pixels each of size A t 2 .
- 2N 2 observations are used to map the target at N 2 points.
- this degree of coverage in ( ⁇ ,t 1 ) must be available to reconstruct the image with resolution A t.
- targets with known symmetry require fewer views, e.g., projections from a single view suffice to reconstruct images of rotationally symmetric targets.
- Ax is a spacing characteristic of the meaningful resolution allowed by the reconstruction.
- a x is given by the bandwidth used in the convolution step (D. A. Chesler, S. J. Reiderer, and N. J. Pelc, "Noise due to Photon Counting Statistics in Computed X-Ray Tomography", J. Comput. Asst. Tomagr., VI, 64-74, 1977.
- ⁇ x is approximately the inverse of the cutoff frequency used in filtering.
- ⁇ is the ratio between noise-to-signal in the data and reconstruction, where we assume that the measured projection data are all typical magnitude P containing noise that can be described as normally distributed with standard deviation ⁇ p , and where f,a f are the typical value of the reconstructed linear attenuation coefficient and its standard deviation.
- the detective quantum efficiency has been used for years by the electro-optics industry as a characterization of imaging devices. Its use as a measure of two dimensional X-ray detector efficiency has been discussed by Gruner and Milch [Transactions Amer. Crystallographic Assoc. V18, P149 (1982)]. It describes the added noise introduced by the detector relative to an ideal detector.
- the output statistics of the ideal detector are defined equal to the input signal statistics, i.e., in which case The degree to which is less than 1 indicates the fractional manner in which the detector is less than ideal.
- the electro-optic X-ray detector used in the microtomography system it is preferred that be greater than .05. It is more preferred that be greater than .5.
- Ni ma g e is in the range of 20 to 5,000. A more useful range of Ni ma g e lies between 100 and 1000.
- the maximum attainable resolution for the tomography system described herein is .5 microns and the minimum attainable resolution is approximately 5mm.
- a more preferred mode of operation of the instrument provides resolution (At) in the range of 1-100 microns.
- the linear X-ray absorption coefficient, ( F ) should be less than 4,000 or more preferably less than 200.
- the X-ray energy should in general be greater than 1 kev and more preferably greater than 5 kev.
- Sources of X-rays with energies greater than 1 to 5 kev include synchrotrons, rotating anodes, X-ray generators and X-ray tubes.
- the X-ray beam generated must be conditioned so that it is plane parallel with a predetermined spectral distribution. Parallelism of the rays is required due to the nature of the reconstruction algorithms which require that rays pass through only a single column of pixels in the sample.
- a principal ray passing through the sample must be parallel with any other ray through another point in the sample with an accuracy given by where a is the maximum angular deviation of two principal rays through different points in the sample, At is the minimum resolution element in the image and D is the distance the X-ray beam travels through the sample. Divergence of any two rays passing through the same point in the sample is limited by penumbral blurring of the shadow cast onto the detector. To maintain desired resolution, the divergence of the two rays through the same point in the sample must be such that where a' is the angular divergence of two rays through the same point in the sample and S is the distance from the sample to the first energy conversion element in the detector.
- collimation can be achieved by using either a monochrometer, physical collimator or distance to limit the angular beam spread through the sample. Collimation increases as the distance between sample and source is increased. If the effective source size at the X-ray generator is sg enera t or , the distance a sample must be placed away from the generator, dg enera t or , (determined from Equation 14) is
- Collimation can also be achieved by placing in the beam, either a grazing incidence X-ray mirror, layered synthetic multilayer monochrometer, flat crystal monochrometer or curved crystal monochrometer. Positioning of these X-ray optical elements should be such that both Eqs. 14 and 15 are satisfied and flux through the sample maximized to the greatest extent possible.
- Choice of collimation method used for rotating anodes and X-ray tubes is dictated by not only by these requirements but also by the degree of spectral purity required for accurate image reconstruction.
- Spectral purity in beams collimated with distance can be achieved by filtering of the radiation. For instance, a nickel filter can be used with a Cu X-ray tube to improve the spectral purity.
- the angular distribution of radiation emanating from the ring is sufficiently small that in many cases no additional collimation is required.
- Detector attributes which can significantly affect acquisition of accurate projection measurements are: (1) positional linearity (geometric linearity), (2) detector alignment (spatial orientation), (3) spatial resolution, (4) useful dynamic range of the detector, (5) signal dependent backgrounds in the recorded image, (6) spatial uniformity of detector response, (7) linearity of response vs. intensity, (8) sample alignment. Most of these detector attributes are of importance only for imaging detector systems and can be ignored in non-imaging detectors such as those used in medical CT.
- Imaging electro-optic detectors contain pixels arrayed in linear or planar fashion. Geometric distortions from true positional linearity of the pixels within the detector can introduce artifacts in reconstructed images. Artifacts are introduced from uncorrected positional non-linearities because .the impact parameters, t 1 , (see Figure 2) are systemmatically mismeasured. This mismeasurement occurs whenever a Cartesian grid imaged through an electro-optic detector deviates from linearity by more than 1 pixel position. For small deviations from true positional linearity a distortion map can be applied to correct the impact parameters so that data is acquired in a true Cartesian grid. The distortion map is applied as a mathematical interpolation between the measured points.
- the amount of interpolation required between points is determined from measurements of the distortion of a true Cartesian grid imaged through the electro-optic detector. This correction becomes impractical when the deviation from linearity exceeds 10 pixel positions across the detector surface. As such, it is preferred that deviations from true linearity be less than 10 pixels in the recorded image and this deviation be corrected with a distortion map. In a more preferred embodiment impact parameters are accurately measured at the detector surface and the maximum deviation from geometric linearity is less than 1 pixel in the recorded image with no distortion map being required to correct the data.
- the imaging electro-optic detector should be aligned so that the axis of the Cartesian grid of pixels in the detector are parallel and perpendicular to the axis of rotation within the tomography system.
- the axis of rotation within the tomography system can be either the sample axis of rotation or the axis of rotation of the source and detector.
- Angular misorientations between the system axis of rotation and a two dimensional imaging detector can be measured by comparing two images of a regular object separated by a 180° rotation. Differences in the line of centroids of the object taken in these two views determine the axis of rotation projected onto the detector.
- the axis of rotation should lie along either a row or column of pixels within the detector. Corrections for angular misalignment between detector and system axis of rotation should be made when the angular misalignment exceeds 8 A X/d radians where A X is the system resolution in pixels and d is the number of pixels across the maximum diameter of the object about the rotation axis. Corrections of angular misalignment are made by mathematically transforming the data array read from the detector with an angular rotation algorithm which aligns the axis of rotation or by physical rotation of the detector with respect to the axis of rotation. In the preferred embodiment, the detector is angularly aligned with the system axis of rotation so that the data does not have to be mathematically corrected.
- the angular misalignment is less than 2t/d, where t and d are referenced to a cartesian coordinate system.
- This correction can be done with an angular tilt stage which either moves the detector or rotation stage.
- the angular misalignment between the Cartesian grid of points on the detector and the system axis of rotation must be accurately measured.
- the rotation axis is not fixed in space as the sample turns.
- the apparent position of the rotation axis on the electro-optic detector will drift when measured for several angular rotations. This drift is usually due to imperfections in the rotation stage, which lead to wobble and tilt during angular rotation.
- a rotation stage is choosen which does not exhibit spatial drifts in the rotation axis; however this is not always possible.
- a mathematical transformation can be applied to the measurements. By measuring the rotation axis drift and angular misorientation it is possible to either mechanically or mathematically reduce the apparent maximum displacement of any point along the observed rotation axis to less than 4 A X, where A X is the resolution of the detector measured in pixels.
- the maximum uncorrected drift of any point along the rotation axis is less than A X.
- the angular misalignment is taken to be the average angular misalignment over a 180° rotation.
- rotation axis should be aligned along one of the pixel rows of columns near the center of the detector. Aligning the rotation axis near the detector edge severely restricts usable sample size. To move the rotation axis on the detector, either the detector or rotation stage can be physically translated.
- Spatial resolution of the detector is determined primarily by the format alteration technique used to couple the energy convertor plate and readout device of the electro-optic detector. Adjustability of the detector resolution through simple format alteration is a key advantage of electro-optic X-ray detectors over the more conventional scintillation detectors which have been used in medical tomography. Format alterations can be performed using either electron or light optics. Simplest of all format alteration techniques is a lens system which couples light from a phosphor screen directly onto a readout device with no intervening image intensifier. This system is well-suited for magnification of images formed at high resolution phosphor screens and can achieve spatial resolutions comparable to the wavelength of light (approximately .5 microns).
- FIG. 7 shows a schematic diagram of a high resolution cellular phosphor screen.
- High resolution is achieved with cellular phosphor screens because light emission is localized within the dimensions of a single phosphor cell. In flat phosphors light is not spatially localized and can propagate within the plane of the phosphor degrading spatial resolution.
- the limiting resolution is often determined by the numerical aperture of the relaying lens system which can be .6-.8, yielding ultimate spatial resolution of approximately .5 microns.
- Lower resolutions can be achieved by decreasing the magnification of the lens system and coarsest resolutions are achieved by using demagnifying rather than magnifying lens systems.
- These same principles apply to systems which use electron optics rather than light optic to alter the image format.
- the format alteration have a spatial resolution that is less than 5 pixels on the detector.
- the format alteration section is chosen to have a spatial resolution of less than 1 pixel on the detector.
- Focusing of the image format alteration device can also affect detector spatial resolution. Optimum resolution is obtained when images from the format alteration device are sharply focused on the electro-optic readout device.
- projection measurements can be analyzed for high contrast targets with spatial frequencies comparable to the expected spatial resolution.
- Simple useful high contrast targets are woven mesh metallic screens, which may be sequentially stacked with angular misorientations to increase spatial frequency of the pattern.
- the image from the format alteration device can be sharply focused.
- useful resolution of the tomographic scanner can be severely degraded.
- the image format alteration device must be carefully focused with respect to the electrooptic readout device prior to recording images of transmitted radiation which are used to obtain projection measurements.
- a more quantitative evaluation of the spatial resolution obtained from a focused electro-optic detector can be obtained by measuring the modulation-transfer function of the complete tomographic scanner.
- the modulation transfer function is the ratio of recorded contrast to original contrast for different frequency sine waves modulations of the incident x-ray intensity where and Imax (Imin) is the maximum (minimum) intensity in the sine wave pattern.
- Imax (Imin) is the maximum (minimum) intensity in the sine wave pattern.
- the frequency dependence of this contrast function provides a unique characterization of the image quality produced by the system. At high frequencies, the function will smoothly fall from a value near one to zero and the frequency at which the MTF is .5 can be taken as the spatial resolution A X of the system.
- the MTF can also be used to evaluate focusing within the detector.
- the detector is considered focused when the measured resolution is within a factor of 4 of the resolution obtained at best focus. In a more preferred embodiment, the measured resolution is within a factor of 1.5 of that obtained at best focus.
- the detector resolution, A X will be taken to be the resolution obtained at best focus. In a preferred embodiment the resolution at focus, A X, is less than two pixels, ensuring a large number of real resolution elements across the image. At low frequencies (long wavelength), the small deviation between the MTF and 1 is a direct measure of the useful dynamic range of the system with
- Another and perhaps more useful definition of the useful dynamic range of the detector is the ratio of the maximum signal level recorded in an exposure to the sum of all signal dependent backgrounds and noise sources (other than counting statistics).
- the useful dynamic range is maximized.
- noise sources other than counting statistics are readout and dark noise. Dark noise accumulates with time in the absence of an input signal and can severely limit maximum exposure times. Readout noise is an uncertainty added to the signal during readout of the sensor used to record optical images. Since it was shown that under optimal observation conditions signals with an optical density of 2 (-13% transmission) must be recorded, the detector must be operated in a manner such that the useful dynamic range is greater than 10. In a more preferred embodiment, the detector is configured and operated in a manner such that the useful dynamic range is greater than 50. To obtain such useful dynamic ranges, the dark noise accumulated during exposure should be a factor of 10 less than the recorded signal. To satisfy this condition, the incident x-ray intensity must be chosen to be sufficiently large to insure that appreciable dark noise does not accumulate in the detector. In a more preferred embodiment, the dark noise accumulated during the exposure should be a factor of 50 less than the recorded signal.
- Signal dependent backgrounds can also limit the useful dynamic range of the detector.
- a signal dependent background exists in all electro-optic x-ray detectors due to scattering of radiation between the energy conversion process and detection at the electrooptic readout device. Scattered radiation produces a signal dependent background component which is spatially correlated with the signal as well as a component which is spatially uncorrelated with the original signal. Because optimal observation conditions occur when the optical density through the target ( FD)is nearly equal to 2 (13.5% transmission), the total signal dependent background (correlated + uncorrelated) in any pixel covered by the sample must be less than 10 0 /o of that from the unattenuated x-ray beam.
- the total signal dependent background (correlated + uncorrelated) in any pixel covered by the sample is less than 20/0 of the signal derived from the unattenuated x-ray beam.
- Signal dependent backgrounds for an electro-optic x-ray detector can be measured using a variety of techniques. A simple technique is to cover half the incident x-ray beam with a mask which totally absorbs x-rays. In principle, there should be no signal in the region covered by the mask, and signal levels detected in the region behind the mask are clearly due to the correlated and uncorrelated backgrounds. Far from the mask edge the signal dependent background slowly varies and is primarily due to the uncorrelated signal level. Near the mask edge spatial variation of the signal dependent background is a direct measure of the correlated scattered light. Thus, by fitting a spatial correlation function to the signal dependent background near the mask edge, the correlated and uncorrelated signal dependent backgrounds can be quantified.
- scattered radiation can be significantly reduced by coating all optical surfaces with an anti-reflection coating. This is especially important in the vicinity of the optical readout device. In this region, reflected light can readily reenter the readout device.
- retroreflection of light backscattered by the chip can limit the useful dynamic range to 100-500:1. For front illuminated CCD's more than 400/o of the incident light may be backscattered from the CCD surface into the optics, while back illuminated CCD's only backscatter half as much light.
- Front illuminated CCD's detect light incident through the gate structure on its front surface while back illuminated devices are thinned to ⁇ 10 micron thickness and illuminated through the flat rear surface. If 1-20/ 0 of the light is retroflected from the optics than the useful dynamic range will be limited 100-200:1, for front illuminated CCD's and 200-500:1 for back illuminated CCD's.
- signal dependent backgrounds can be directly measured. They can be reduced by (1) designing the apparatus to minimize scattered light and (2) scattered light effects can be stripped away from measured data using a mathematical filter function.
- the non-uniformity of response between adjacent pixels be less than 750/0.
- Limits also exist on variations of the locally averaged sensitivity across the detector surface.
- the locally averaged sensitivity is defined as the average of the sensitivity of a pixel and its immediately adjacent neighbors. From signal to noise considerations it is preferred that the locally averaged sensitivity varies by no more than a factor of 2 across the entire detector surface. Variations in the locally averaged sensitivity across the detector surface lead to a variation in the detected signal to noise ratio. To optimize performance of the device it is desired that the fewest possible x-ray photons be required for reconstruction of a target at a given signal to noise ratio.
- the locally averaged sensitivity When the locally averaged sensitivity varies across the detector, the required number of x-ray photons correspond most closely with that expected for the minimum average sensitivity. Regions of minimum locally averaged sensitivity generally correspond to defects in the detector. Thus, to minimize exposure time and optimize performance of the tomography system, it is desired that the variations in the locally averaged sensitivity across the detector be less than 10 and in a more preferred embodiment be less than 2.
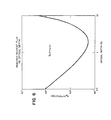
- FIG. 8 shows a mathematical simulation of ring artifacts in the reconstruction of a sandstone sample. Projection data for the sandstone were mathematically simulated. Successive reconstructions of the target were obtained with the addition of 1, 5, 10 and 500/0 modulations added to projection data in isolated pixels. At impact parameters where the excess modulation was added, a ring artifact appears in the reconstructed image.
- This correction is made for every pixel in the image and is performed by subtracting a frame, D(t), with the required offsets from both the calibration frame and transmitted intensity measurement.
- D(t) the detector can be exposed with no incident x-ray flux.
- a CCD is used in the electrooptic detector
- a very low signal level is required to establish the offset frame D(t), because of well known "fat" zero effects.
- some of the effects of detector spatial uniformity are removed (Fig. 9 - Step 2) by correcting the data with a flat field gain map.
- the gain map is designed to correct spatial response variations of all elements in the detector except for the energy conversion element.
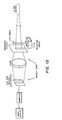
- a gain map for the CCD based electrooptic detector shown in Figure 10 can be obtained by removing the phosphor-plate and recording a spatially uniform optical beam. Such a beam can be generated from a point optical source which is far from the detector. The correction with. a gain map would be redundant if scattered light effects did not have to be removed from the image.
- a spatial filter function, F can be designed which mimicks the effect of light scattering within the detector. The filter function generates a correction from, F, whose values depend directly on the data in the unfiltered frame.
- a simple filter function is a spatial high pass filter which has a correlation length that is determined by the spatial extent of light scattering in the system.
- the amplitude of the filter function is determined by the intensity of light scattering which is typically less than 40/0.
- the grey scale level should be normalized (Fig. 9 -Step 4) to the average value in a region of the image not obscured by the sample.
- This normalization factor [p o and ⁇ ⁇ for the calibration frame and intensity measurements, respectively] removes time dependent variations in the x-ray source intensity.
- the projection measurements are determined from the ratio of the fully corrected calibration frame and intensity measurement.
- Amplitude of ring artifacts can be limited to less than 100/0 of the local attenuation coefficient values in reconstructed images by following the described design criteria and calibration procedures. At values above 10%, ring artifacts severely obscure the local image and thus it is preferred to limit them to values below 10%.
- pixel to pixel gain variations introduced by the cellular structure can be reduced by rapidly moving the phosphor back and forth across the x-ray beam. This movement has the effect of averaging out variations in the cell structure projected on the detector. Several of these cycles need to be repeated within a single frame exposure time.
- intensity of ring type artifacts can be reduced.
- the detector response vs. X-ray intensity must be linearized to accurately measure the projections which are defined in Eq. 2.
- the projection measurements form the basis for the tomographic inversion methods. Projection measurements can only be accurately obtained when the detector response is linearized.
- Detector response vs. incident X-ray dose can be linearized by appropriate calibration methods when the deviations from linearity are less than 250/0 over the useful dynamic range of the detector. When deviations from linearity exceed 2000/0 anywhere within the usefuly dynamic range of the detector, calibration techniques fail to adequately correct the data. Failure to adequately linearize the detector response when deviations from linearity exceed a factor of 2 generally stem from change of the response with time. It is preferred that the corrected detector linearity be better than 50/0 over the useful dynamic range. Correction for detector linearity must be applied directly to all measurements before using the type of processing sequence outlined in Figure 9. In a more preferred embodiment, linearity of the detector after calibration correction is better than .50/0 over the useful dynamic range.
- the sample being studied must be aligned so that its centroid is on or near the rotation axis. This alignment can be accomplished by mounting a gonio meter between the sample and rotation stage. The sample is then viewed during rotation and centered on the rotation axis by mechanical translation. The sample must be well centered and small enough that it does not move outside the detector field of view during a complete 180° rotation.
- the X-ray microtomography system shown in Figure 10 was used to examine a 750 micron hollow glass tube packed with 200 micron silica spheres along with a 10 micron tungsten wire which ran along the axis of the tube.
- the electro-optic detector shown in Figure 10 consists of a phospor conversion plate, lens system and CCD based readout device. X-rays were generated from a Cu fine focus X-ray tube manufactured by Phillips Electronic Instruments. The tube was aligned to present a point X-ray source to the experiment and was operated at a power of 1.5 kw.
- the distance between X-ray source and specimen was chosen to be 20 cm and the tube was positioned so that the line connecting the center of the point X-ray source was within 1 mm of the optical axis of the lens system.
- Take-off angle of the experiment with respect to the anode shadow projected by the tube was approximately 5° yielding an effective X-ray source size of approximately 750 microns by 500 microns.
- the sample was held on a rotatable goniometer within the X-ray beam.
- the rotation stage was controlled with stepping motors which can move the stage in increments as small as 0.01°. For a full 360° rotation of the rotary stage, wobble in the axis of rotation was less than 10- 5 radians.
- the axis of rotation remains fixed in space and does not translate as the sample is rotated.
- the sample was aligned so that it remained within the lateral field of view as the sample was rotated.
- a phosphor conversion plate was located 2mm behind the sample.
- the phosphor was a 5 micron thick layer of evaporated Csl doped with thallium. Light emanating from the phosphor conversion plate was imaged by a photographic lens onto a charged coupled device.
- the CCD used in these experiments was a RCA SID-501 which has 336 by 540 active pixel elements.
- the CCD was aligned so that its columns were parallel to the sample axis of rotation. This alignment was determined by comparing two images of the sample taken before and after rotation through 180°. By measuring centroids of the sample in these two frames, the axis of rotation was located at several rows to ⁇ 1/2 pixel. The axis of rotation orignally did not lay along a column of the detector, so the CCD was rotated within its cryostat. After rotation, the axis of rotation was within ⁇ 1/2 pixel of column 201 of the detector.
- a photographic lens with a f number of 1.4 was chosen. Magnification of the lens sytem was adjusted so that an 8 micron element on the phosphor plate was magnified to 30 microns which is the pixel size of the CCD. The lens element was focused on the phosphor plate by maximizing contrast in the X-ray image of a wire mesh screen (25p.m openings). Spatial resolution of this system corresponds accurately to one pixel in the detector. Diffraction limited resolution of the lens systems was 2.8 ⁇ m, while light spreading in the flat phosphor limited resolution to 5.8 ⁇ m. It should be noted that resolution is not degraded by width of the penumbral shadow cast by the sample onto the phosphor.
- the penumbral shadow extends over 5 ⁇ m, for the geometric arrangement of source, sample and detector.
- the number of equally spaced view angles, M, required for data acquisitioned in this mode, must be greater than N/2, wherein N is the number of equally spaced discrete parallel impact parameters spanning the target. Since the target is 750 microns in diameter and each pixel spans 8 microns, approximately 85 impact parameters span the target. To satisfy the protocol for data acquisitioned in the plane parallel mode, 240 equally spaced view angles A (p, were chosen to scan the target.
- Detective quantum efficiency of the detector was measured to be .75 and the total signal dependent background was found to be less than 2 percent of the signal from the unattenuated x-ray beam.
- Useful dynamic range of this detector configuration was a factor of 80 and the maximum non-uniformity of response between adjacent active pixels was less than 1 percent.
- a signal dependent background was measured by inserting a lead foil which covered half the active area of the detector. Far from the lead foil edge there existed a spatially uncorrelated signal dependent background of -7.5 0 /o of the incident x-ray flux. The signal rose as the foil edge was approached and the rate of rise could be fitted with a high pass filter function that had a correlation length of 8 pixels and an amplitude of 3% of the incident flux.
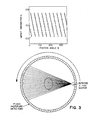
- Figure 12 shows projection data acquired in one view of the hollow glass tube as well as reconstructed cross sectional views at the points indicated in Figure 12. It is seen that the 200 micron glass spheres are clearly visible in the cross-sectional images as well as the 10 micron tungsten wire. Spatial resolution achieved in this reconstruction is more than 25 times better than that achieved with conventional medical CAT scanners.
Landscapes
- Health & Medical Sciences (AREA)
- Physics & Mathematics (AREA)
- Life Sciences & Earth Sciences (AREA)
- General Physics & Mathematics (AREA)
- Chemical & Material Sciences (AREA)
- Analytical Chemistry (AREA)
- Spectroscopy & Molecular Physics (AREA)
- Engineering & Computer Science (AREA)
- Nuclear Medicine, Radiotherapy & Molecular Imaging (AREA)
- Pulmonology (AREA)
- Radiology & Medical Imaging (AREA)
- Theoretical Computer Science (AREA)
- High Energy & Nuclear Physics (AREA)
- Molecular Biology (AREA)
- Biochemistry (AREA)
- General Health & Medical Sciences (AREA)
- Immunology (AREA)
- Pathology (AREA)
- Analysing Materials By The Use Of Radiation (AREA)
- Apparatus For Radiation Diagnosis (AREA)
- Measurement Of Radiation (AREA)
- Conversion Of X-Rays Into Visible Images (AREA)
- Ultra Sonic Daignosis Equipment (AREA)
- Eye Examination Apparatus (AREA)
Applications Claiming Priority (2)
| Application Number | Priority Date | Filing Date | Title |
|---|---|---|---|
| US932273 | 1986-11-19 | ||
| US06/932,273 US4891829A (en) | 1986-11-19 | 1986-11-19 | Method and apparatus for utilizing an electro-optic detector in a microtomography system |
Publications (3)
| Publication Number | Publication Date |
|---|---|
| EP0268488A2 true EP0268488A2 (de) | 1988-05-25 |
| EP0268488A3 EP0268488A3 (en) | 1990-03-14 |
| EP0268488B1 EP0268488B1 (de) | 1994-05-25 |
Family
ID=25462066
Family Applications (1)
| Application Number | Title | Priority Date | Filing Date |
|---|---|---|---|
| EP87310238A Expired - Lifetime EP0268488B1 (de) | 1986-11-19 | 1987-11-19 | Verfahren und Vorrichtung zur Anwendung eines elektrooptischen Detektors in einem mikrotomographischen System |
Country Status (6)
| Country | Link |
|---|---|
| US (1) | US4891829A (de) |
| EP (1) | EP0268488B1 (de) |
| JP (1) | JPS63308548A (de) |
| CA (1) | CA1282192C (de) |
| DE (1) | DE3789890T2 (de) |
| NO (1) | NO174224C (de) |
Cited By (6)
| Publication number | Priority date | Publication date | Assignee | Title |
|---|---|---|---|---|
| EP0364863A1 (de) * | 1988-10-21 | 1990-04-25 | Fiad S.P.A. | In der Mundhöhle angeordneter Sensor für ein Röntgengerät |
| NL1012642C2 (nl) * | 1996-11-04 | 2007-06-05 | Analogic Corp | Gecomputeriseerde tomografiescanner voor medische doeleinden met röntgenbron met gereduceerd vermogen en werkwijze voor het uitvoeren van een dergelijke scan. |
| CN108291854A (zh) * | 2016-03-10 | 2018-07-17 | 松下知识产权经营株式会社 | 光学检查装置、透镜以及光学检查方法 |
| WO2019171169A1 (en) * | 2018-03-07 | 2019-09-12 | Ge Sensing & Inspection Technologies Gmbh | Wobble compensation for computed tomography applications |
| US10835199B2 (en) | 2016-02-01 | 2020-11-17 | The University Of North Carolina At Chapel Hill | Optical geometry calibration devices, systems, and related methods for three dimensional x-ray imaging |
| US10980494B2 (en) | 2014-10-20 | 2021-04-20 | The University Of North Carolina At Chapel Hill | Systems and related methods for stationary digital chest tomosynthesis (s-DCT) imaging |
Families Citing this family (116)
| Publication number | Priority date | Publication date | Assignee | Title |
|---|---|---|---|---|
| US5117829A (en) * | 1989-03-31 | 1992-06-02 | Loma Linda University Medical Center | Patient alignment system and procedure for radiation treatment |
| JP3092127B2 (ja) * | 1989-09-08 | 2000-09-25 | 株式会社日立メディコ | X線ct装置 |
| JPH04150572A (ja) * | 1990-10-12 | 1992-05-25 | Ricoh Co Ltd | Mtf劣化補正法及び原稿読取装置 |
| US5323007A (en) * | 1992-02-07 | 1994-06-21 | Univ. Of Chicago Development Corp. Argonne National Laboratories | Method of recovering tomographic signal elements in a projection profile or image by solving linear equations |
| JP3327948B2 (ja) * | 1992-06-09 | 2002-09-24 | オリンパス光学工業株式会社 | 光学像再構成装置 |
| US5432349A (en) * | 1993-03-15 | 1995-07-11 | The United State Of America As Represented By The Secretary Of The Navy | Fourier transform microscope for x-ray and/or gamma-ray imaging |
| US5454022A (en) * | 1993-03-26 | 1995-09-26 | Eastman Kodak Company | Method of taking X-ray images with a CCD image sensor, and a CCD image sensor system |
| US5701360A (en) * | 1993-05-07 | 1997-12-23 | Siemens Aktiengesellschaft | Fourier reconstruction of computer tomography images which represent a selectable region of the examination subject |
| US5432834A (en) * | 1993-11-22 | 1995-07-11 | Hologic, Inc. | Whole-body dual-energy bone densitometry using a narrow angle fan beam to cover the entire body in successive scans |
| US6217214B1 (en) | 1993-11-22 | 2001-04-17 | Hologic, Inc. | X-ray bone densitometry apparatus |
| US5592523A (en) * | 1994-12-06 | 1997-01-07 | Picker International, Inc. | Two dimensional detector array for CT scanners |
| US6032070A (en) * | 1995-06-07 | 2000-02-29 | University Of Arkansas | Method and apparatus for detecting electro-magnetic reflection from biological tissue |
| US5703677A (en) * | 1995-11-14 | 1997-12-30 | The Trustees Of The University Of Pennsylvania | Single lens range imaging method and apparatus |
| US5778038A (en) * | 1996-06-06 | 1998-07-07 | Yeda Research And Development Co., Ltd. | Computerized tomography scanner and method of performing computerized tomography |
| DE19626775A1 (de) * | 1996-07-03 | 1998-01-08 | Siemens Ag | Schnelle Faltung von Projektionen |
| US6920238B1 (en) * | 1996-12-03 | 2005-07-19 | Synchrotronics, Co. | Precision imaging system |
| US6826422B1 (en) | 1997-01-13 | 2004-11-30 | Medispectra, Inc. | Spectral volume microprobe arrays |
| US6847490B1 (en) * | 1997-01-13 | 2005-01-25 | Medispectra, Inc. | Optical probe accessory device for use in vivo diagnostic procedures |
| US5937103A (en) * | 1997-01-25 | 1999-08-10 | Neopath, Inc. | Method and apparatus for alias free measurement of optical transfer function |
| US5974365A (en) * | 1997-10-23 | 1999-10-26 | The United States Of America As Represented By The Secretary Of The Army | System for measuring the location and orientation of an object |
| US6577775B1 (en) * | 1998-05-20 | 2003-06-10 | Cognex Corporation | Methods and apparatuses for normalizing the intensity of an image |
| US20020075210A1 (en) * | 1998-08-05 | 2002-06-20 | Microvision, Inc. | Low light viewer with image simulation |
| WO2000036973A1 (en) * | 1998-12-23 | 2000-06-29 | Medispectra, Inc. | Optical methods and systems for cervical screening |
| JP2002533142A (ja) | 1998-12-23 | 2002-10-08 | メディスペクトラ, インコーポレイテッド | サンプルの光学的試験のためのシステムおよび方法 |
| US6115445A (en) * | 1999-01-12 | 2000-09-05 | Analogic Corporation | Progressive correction of ring artifacts in a computed tomography system |
| US7187810B2 (en) * | 1999-12-15 | 2007-03-06 | Medispectra, Inc. | Methods and systems for correcting image misalignment |
| US20020007122A1 (en) * | 1999-12-15 | 2002-01-17 | Howard Kaufman | Methods of diagnosing disease |
| US7260248B2 (en) * | 1999-12-15 | 2007-08-21 | Medispectra, Inc. | Image processing using measures of similarity |
| JPWO2002043001A1 (ja) * | 2000-11-24 | 2004-04-02 | 学校法人日本大学 | 画像処理方法 |
| US6839661B2 (en) | 2000-12-15 | 2005-01-04 | Medispectra, Inc. | System for normalizing spectra |
| US7003145B2 (en) * | 2001-01-05 | 2006-02-21 | Ge Medical Systems Global Technology Company, Llc. | Image cropping for asymmetrical imaging |
| JP2002329473A (ja) * | 2001-02-27 | 2002-11-15 | Jeol Ltd | X線分光器を備えた透過型電子顕微鏡 |
| US20060023219A1 (en) * | 2001-03-28 | 2006-02-02 | Meyer Michael G | Optical tomography of small objects using parallel ray illumination and post-specimen optical magnification |
| US6944322B2 (en) * | 2001-03-28 | 2005-09-13 | Visiongate, Inc. | Optical tomography of small objects using parallel ray illumination and post-specimen optical magnification |
| US7907765B2 (en) * | 2001-03-28 | 2011-03-15 | University Of Washington | Focal plane tracking for optical microtomography |
| US6717146B2 (en) * | 2001-05-24 | 2004-04-06 | Applied Materials, Inc. | Tandem microchannel plate and solid state electron detector |
| US7382856B2 (en) * | 2001-12-04 | 2008-06-03 | X-Ray Optical Systems, Inc. | X-ray source assembly having enhanced output stability, and fluid stream analysis applications thereof |
| ATE476088T1 (de) * | 2001-12-04 | 2010-08-15 | X Ray Optical Sys Inc | Röntgenquelle mit verbesserter strahlstabilität und ihre anwendung in der analyse von strömenden flüssigkeiten |
| US20050085708A1 (en) * | 2002-04-19 | 2005-04-21 | University Of Washington | System and method for preparation of cells for 3D image acquisition |
| US7738945B2 (en) | 2002-04-19 | 2010-06-15 | University Of Washington | Method and apparatus for pseudo-projection formation for optical tomography |
| US7260253B2 (en) * | 2002-04-19 | 2007-08-21 | Visiongate, Inc. | Method for correction of relative object-detector motion between successive views |
| US7811825B2 (en) * | 2002-04-19 | 2010-10-12 | University Of Washington | System and method for processing specimens and images for optical tomography |
| US7197355B2 (en) * | 2002-04-19 | 2007-03-27 | Visiongate, Inc. | Variable-motion optical tomography of small objects |
| US20040209237A1 (en) * | 2003-04-18 | 2004-10-21 | Medispectra, Inc. | Methods and apparatus for characterization of tissue samples |
| US20040208390A1 (en) * | 2003-04-18 | 2004-10-21 | Medispectra, Inc. | Methods and apparatus for processing image data for use in tissue characterization |
| US7469160B2 (en) * | 2003-04-18 | 2008-12-23 | Banks Perry S | Methods and apparatus for evaluating image focus |
| US7136518B2 (en) * | 2003-04-18 | 2006-11-14 | Medispectra, Inc. | Methods and apparatus for displaying diagnostic data |
| US7282723B2 (en) * | 2002-07-09 | 2007-10-16 | Medispectra, Inc. | Methods and apparatus for processing spectral data for use in tissue characterization |
| US20040208385A1 (en) * | 2003-04-18 | 2004-10-21 | Medispectra, Inc. | Methods and apparatus for visually enhancing images |
| US6933154B2 (en) * | 2002-07-09 | 2005-08-23 | Medispectra, Inc. | Optimal windows for obtaining optical data for characterization of tissue samples |
| US7309867B2 (en) | 2003-04-18 | 2007-12-18 | Medispectra, Inc. | Methods and apparatus for characterization of tissue samples |
| US6818903B2 (en) * | 2002-07-09 | 2004-11-16 | Medispectra, Inc. | Method and apparatus for identifying spectral artifacts |
| US7459696B2 (en) | 2003-04-18 | 2008-12-02 | Schomacker Kevin T | Methods and apparatus for calibrating spectral data |
| US7103401B2 (en) | 2002-07-10 | 2006-09-05 | Medispectra, Inc. | Colonic polyp discrimination by tissue fluorescence and fiberoptic probe |
| US6768918B2 (en) * | 2002-07-10 | 2004-07-27 | Medispectra, Inc. | Fluorescent fiberoptic probe for tissue health discrimination and method of use thereof |
| US7228004B2 (en) * | 2002-09-05 | 2007-06-05 | Eastman Kodak Company | Method for sharpening a digital image |
| US7687167B2 (en) * | 2003-07-18 | 2010-03-30 | Panasonic Corporation | Power supply unit |
| JP2007501503A (ja) * | 2003-08-04 | 2007-01-25 | エックス−レイ オプティカル システムズ インコーポレーテッド | 管電力調節および遠隔較正を使用して出力安定性が向上したx線源アセンブリ |
| DE10343496B4 (de) * | 2003-09-19 | 2015-08-06 | Siemens Aktiengesellschaft | Korrektur eines von einem digitalen Röntgendetektor aufgenommenen Röntgenbildes sowie Kalibrierung des Röntgendetektors |
| US7020243B2 (en) * | 2003-12-05 | 2006-03-28 | Ge Medical Systems Global Technology Company Llc | Method and system for target angle heel effect compensation |
| US7136450B2 (en) * | 2004-05-26 | 2006-11-14 | Analogic Corporation | Method of and system for adaptive scatter correction in multi-energy computed tomography |
| JP2006000225A (ja) * | 2004-06-15 | 2006-01-05 | Canon Inc | X線ct装置 |
| US6991738B1 (en) | 2004-10-13 | 2006-01-31 | University Of Washington | Flow-through drum centrifuge |
| US20060096358A1 (en) * | 2004-10-28 | 2006-05-11 | University Of Washington | Optical projection tomography microscope |
| US7494809B2 (en) | 2004-11-09 | 2009-02-24 | Visiongate, Inc. | Automated cell sample enrichment preparation method |
| US8155262B2 (en) | 2005-04-25 | 2012-04-10 | The University Of North Carolina At Chapel Hill | Methods, systems, and computer program products for multiplexing computed tomography |
| US7576853B2 (en) | 2005-06-10 | 2009-08-18 | The Research Foundation Of State University Of New York | Electronically modulated dynamic optical phantoms for biomedical imaging |
| DE102005034876B3 (de) * | 2005-07-26 | 2007-04-05 | Siemens Ag | Verfahren zur Erstellung von computertomographischen Darstellungen durch ein CT mit mindestens zwei winkelversetzten Strahlenquellen |
| CN101313214B (zh) * | 2005-09-23 | 2013-03-06 | 北卡罗来纳大学查珀尔希尔分校 | 用于复用计算机层析成像的方法和系统 |
| US7486772B2 (en) * | 2005-11-17 | 2009-02-03 | Xintek, Inc. | Systems and methods for x-ray imaging and scanning of objects |
| US20070274435A1 (en) * | 2006-02-27 | 2007-11-29 | Ruola Ning | Phase contrast cone-beam CT imaging |
| US8189893B2 (en) | 2006-05-19 | 2012-05-29 | The University Of North Carolina At Chapel Hill | Methods, systems, and computer program products for binary multiplexing x-ray radiography |
| JP2007315908A (ja) * | 2006-05-25 | 2007-12-06 | Ratoc System Engineering Co Ltd | 撮像システム |
| US7920672B2 (en) * | 2006-07-20 | 2011-04-05 | Koninklijke Philips Electronics N.V. | X-ray detector gain calibration depending on the fraction of scattered radiation |
| US7835561B2 (en) | 2007-05-18 | 2010-11-16 | Visiongate, Inc. | Method for image processing and reconstruction of images for optical tomography |
| JP2010527741A (ja) * | 2007-05-31 | 2010-08-19 | ジェネラル エレクトリック カンパニー | 画像再構成において利得変動の補正を容易にする方法及びシステム |
| US7787112B2 (en) * | 2007-10-22 | 2010-08-31 | Visiongate, Inc. | Depth of field extension for optical tomography |
| JP5468021B2 (ja) | 2008-02-22 | 2014-04-09 | ローマ リンダ ユニヴァーシティ メディカル センター | 3d画像化システムにおける空間歪を特徴づけるシステム及び方法 |
| JP2008175829A (ja) * | 2008-02-25 | 2008-07-31 | Toshiba Corp | 粒子線測定方法および粒子線測定用モニタ装置 |
| SE533704C2 (sv) | 2008-12-05 | 2010-12-07 | Flatfrog Lab Ab | Pekkänslig apparat och förfarande för drivning av densamma |
| US8600003B2 (en) | 2009-01-16 | 2013-12-03 | The University Of North Carolina At Chapel Hill | Compact microbeam radiation therapy systems and methods for cancer treatment and research |
| US8358739B2 (en) | 2010-09-03 | 2013-01-22 | The University Of North Carolina At Chapel Hill | Systems and methods for temporal multiplexing X-ray imaging |
| US9411444B2 (en) * | 2010-10-11 | 2016-08-09 | Flatfrog Laboratories Ab | Touch determination by tomographic reconstruction |
| WO2012155201A1 (en) | 2011-05-19 | 2012-11-22 | Newsouth Innovations Pty Ltd | A method and apparatus for generating a representation of an internal structure of an object |
| EP2823382B1 (de) * | 2012-03-09 | 2018-10-03 | FlatFrog Laboratories AB | Effiziente tomographische verarbeitung zur berührungsbestimmung |
| US10168835B2 (en) | 2012-05-23 | 2019-01-01 | Flatfrog Laboratories Ab | Spatial resolution in touch displays |
| JP2014042564A (ja) * | 2012-08-24 | 2014-03-13 | Sony Corp | 画像処理装置、画像処理方法、および画像処理システム |
| US9364191B2 (en) | 2013-02-11 | 2016-06-14 | University Of Rochester | Method and apparatus of spectral differential phase-contrast cone-beam CT and hybrid cone-beam CT |
| US10019113B2 (en) | 2013-04-11 | 2018-07-10 | Flatfrog Laboratories Ab | Tomographic processing for touch detection |
| US9874978B2 (en) | 2013-07-12 | 2018-01-23 | Flatfrog Laboratories Ab | Partial detect mode |
| EP3080593B1 (de) | 2013-12-12 | 2021-11-24 | General Electric Company | Verfahren zur defektmeldungsdetektion |
| US10126882B2 (en) | 2014-01-16 | 2018-11-13 | Flatfrog Laboratories Ab | TIR-based optical touch systems of projection-type |
| US10146376B2 (en) | 2014-01-16 | 2018-12-04 | Flatfrog Laboratories Ab | Light coupling in TIR-based optical touch systems |
| WO2015199602A1 (en) | 2014-06-27 | 2015-12-30 | Flatfrog Laboratories Ab | Detection of surface contamination |
| EP3250993B1 (de) | 2015-01-28 | 2019-09-04 | FlatFrog Laboratories AB | Dynamische berührungsquarantänerahmen |
| US10318074B2 (en) | 2015-01-30 | 2019-06-11 | Flatfrog Laboratories Ab | Touch-sensing OLED display with tilted emitters |
| EP3537269A1 (de) | 2015-02-09 | 2019-09-11 | FlatFrog Laboratories AB | Optisches berührungssystem |
| CN107250855A (zh) | 2015-03-02 | 2017-10-13 | 平蛙实验室股份公司 | 用于光耦合的光学部件 |
| EP3387516B1 (de) | 2015-12-09 | 2022-04-20 | FlatFrog Laboratories AB | Verbesserte stiftidentifizierung |
| US11069054B2 (en) | 2015-12-30 | 2021-07-20 | Visiongate, Inc. | System and method for automated detection and monitoring of dysplasia and administration of immunotherapy and chemotherapy |
| WO2018096430A1 (en) | 2016-11-24 | 2018-05-31 | Flatfrog Laboratories Ab | Automatic optimisation of touch signal |
| KR102629629B1 (ko) | 2016-12-07 | 2024-01-29 | 플라트프로그 라보라토리즈 에이비 | 개선된 터치 장치 |
| CN110300950B (zh) | 2017-02-06 | 2023-06-16 | 平蛙实验室股份公司 | 触摸感测系统中的光学耦合 |
| WO2018174786A1 (en) | 2017-03-22 | 2018-09-27 | Flatfrog Laboratories | Pen differentiation for touch displays |
| WO2018182476A1 (en) | 2017-03-28 | 2018-10-04 | Flatfrog Laboratories Ab | Touch sensing apparatus and method for assembly |
| CN111052058B (zh) | 2017-09-01 | 2023-10-20 | 平蛙实验室股份公司 | 改进的光学部件 |
| US10426424B2 (en) | 2017-11-21 | 2019-10-01 | General Electric Company | System and method for generating and performing imaging protocol simulations |
| US11567610B2 (en) | 2018-03-05 | 2023-01-31 | Flatfrog Laboratories Ab | Detection line broadening |
| JP2019158534A (ja) * | 2018-03-12 | 2019-09-19 | 株式会社ミツトヨ | 計測用x線ct装置、及び、その断層画像生成方法 |
| CN112889016A (zh) | 2018-10-20 | 2021-06-01 | 平蛙实验室股份公司 | 用于触摸敏感装置的框架及其工具 |
| WO2020153890A1 (en) | 2019-01-25 | 2020-07-30 | Flatfrog Laboratories Ab | A videoconferencing terminal and method of operating the same |
| EP4066089B1 (de) | 2019-11-25 | 2024-09-25 | FlatFrog Laboratories AB | Ein berührungsempfindliches gerät |
| WO2021158164A1 (en) | 2020-02-08 | 2021-08-12 | Flatfrog Laboratories Ab | Touch apparatus with low latency interactions |
| CN115039063B (zh) | 2020-02-10 | 2026-02-13 | 平蛙实验室股份公司 | 改进的触摸感测设备 |
| CN111839562B (zh) * | 2020-06-19 | 2023-04-11 | 东软医疗系统股份有限公司 | 射线数据的处理方法、装置、存储介质和电子设备 |
| US12198257B2 (en) | 2022-08-26 | 2025-01-14 | General Electric Company | System and method of producing a computer-generated image of a component part using computed tomography |
Family Cites Families (12)
| Publication number | Priority date | Publication date | Assignee | Title |
|---|---|---|---|---|
| GB1493593A (en) * | 1974-01-31 | 1977-11-30 | Emi Ltd | Radiography |
| US4365339A (en) * | 1975-12-23 | 1982-12-21 | General Electric Company | Tomographic apparatus and method for reconstructing planar slices from non-absorbed and non-scattered radiation |
| NL7611420A (nl) * | 1976-10-15 | 1978-04-18 | Optische Ind De Oude Delft Nv | Voor tomometrie dienend stelsel met voorzieningen voor het naar keuze instellen van het kader van een weergegeven beeld. |
| US4298800A (en) * | 1978-02-27 | 1981-11-03 | Computome Corporation | Tomographic apparatus and method for obtaining three-dimensional information by radiation scanning |
| FR2431853A1 (fr) * | 1978-07-27 | 1980-02-22 | Radiologie Cie Gle | Procede de centrage automatique d'un objet a examiner dans un tomodensitometre a faisceau en eventail et tomodensitometre adapte a ce procede |
| US4521688A (en) * | 1983-01-21 | 1985-06-04 | The United States Of America As Represented By The Administrator Of The National Aeronautics And Space Administration | Three-dimensional and tomographic imaging device for x-ray and gamma-ray emitting objects |
| US4670840A (en) * | 1983-03-09 | 1987-06-02 | Elscint, Inc. | Ring artifact correction for computerized tomography |
| JPS60194939A (ja) * | 1984-03-16 | 1985-10-03 | 横河メディカルシステム株式会社 | 計算機トモグラフイ装置 |
| US4682291A (en) * | 1984-10-26 | 1987-07-21 | Elscint Ltd. | Noise artifacts reduction |
| JPS61209641A (ja) * | 1985-03-15 | 1986-09-17 | 株式会社東芝 | X線ct装置 |
| US4789930A (en) * | 1985-11-15 | 1988-12-06 | Picker International, Inc. | Energy dependent gain correction for radiation detection |
| US4833698A (en) * | 1986-02-24 | 1989-05-23 | Exxon Research And Engineering Company | Apparatus for three dimensional tomography utilizing an electro-optic x-ray detector |
-
1986
- 1986-11-19 US US06/932,273 patent/US4891829A/en not_active Expired - Lifetime
-
1987
- 1987-11-16 NO NO874773A patent/NO174224C/no unknown
- 1987-11-16 CA CA000551926A patent/CA1282192C/en not_active Expired - Lifetime
- 1987-11-19 JP JP62293062A patent/JPS63308548A/ja active Pending
- 1987-11-19 DE DE3789890T patent/DE3789890T2/de not_active Expired - Fee Related
- 1987-11-19 EP EP87310238A patent/EP0268488B1/de not_active Expired - Lifetime
Cited By (10)
| Publication number | Priority date | Publication date | Assignee | Title |
|---|---|---|---|---|
| EP0364863A1 (de) * | 1988-10-21 | 1990-04-25 | Fiad S.P.A. | In der Mundhöhle angeordneter Sensor für ein Röntgengerät |
| NL1012642C2 (nl) * | 1996-11-04 | 2007-06-05 | Analogic Corp | Gecomputeriseerde tomografiescanner voor medische doeleinden met röntgenbron met gereduceerd vermogen en werkwijze voor het uitvoeren van een dergelijke scan. |
| NL1012640C2 (nl) * | 1996-11-04 | 2007-06-05 | Analogic Corp | Gecomputeriseerde tomografiescanner voor medische doeleinden met röntgenbron met gereduceerd vermogen en werkwijze voor het uitvoeren van een dergelijke scan. |
| US10980494B2 (en) | 2014-10-20 | 2021-04-20 | The University Of North Carolina At Chapel Hill | Systems and related methods for stationary digital chest tomosynthesis (s-DCT) imaging |
| US12193852B2 (en) | 2014-10-20 | 2025-01-14 | The University Of North Carolina At Chapel Hill | Systems and related methods for stationary digital chest tomosynthesis (s-DCT) imaging |
| US10835199B2 (en) | 2016-02-01 | 2020-11-17 | The University Of North Carolina At Chapel Hill | Optical geometry calibration devices, systems, and related methods for three dimensional x-ray imaging |
| CN108291854A (zh) * | 2016-03-10 | 2018-07-17 | 松下知识产权经营株式会社 | 光学检查装置、透镜以及光学检查方法 |
| WO2019171169A1 (en) * | 2018-03-07 | 2019-09-12 | Ge Sensing & Inspection Technologies Gmbh | Wobble compensation for computed tomography applications |
| CN112313502A (zh) * | 2018-03-07 | 2021-02-02 | Ge传感与检测技术有限公司 | 计算机断层摄影应用的摆动补偿 |
| CN112313502B (zh) * | 2018-03-07 | 2024-11-19 | 贝克休斯数据解决方案有限公司 | 计算机断层摄影应用的摆动补偿 |
Also Published As
| Publication number | Publication date |
|---|---|
| DE3789890D1 (de) | 1994-06-30 |
| NO174224B (no) | 1993-12-20 |
| NO174224C (no) | 1994-03-30 |
| DE3789890T2 (de) | 1994-09-08 |
| EP0268488B1 (de) | 1994-05-25 |
| EP0268488A3 (en) | 1990-03-14 |
| JPS63308548A (ja) | 1988-12-15 |
| NO874773D0 (no) | 1987-11-16 |
| CA1282192C (en) | 1991-03-26 |
| US4891829A (en) | 1990-01-02 |
| NO874773L (no) | 1988-05-20 |
Similar Documents
| Publication | Publication Date | Title |
|---|---|---|
| EP0268488B1 (de) | Verfahren und Vorrichtung zur Anwendung eines elektrooptischen Detektors in einem mikrotomographischen System | |
| EP0234922B1 (de) | Herstellung tomographischer Abbildungen | |
| Flynn et al. | Experimental comparison of noise and resolution for and storage phosphor radiography systems | |
| Flannery et al. | Three-dimensional X-ray microtomography | |
| JP3381223B2 (ja) | 電子的に強化されたx線検出装置 | |
| EP0782375B1 (de) | Vorrichtung und Verfahren zur Entfernung der Streuung aus Röntgenbildern | |
| US5307264A (en) | Method and apparatus for computing tomographic scans | |
| US4727562A (en) | Measurement of scatter in x-ray imaging | |
| US4686695A (en) | Scanned x-ray selective imaging system | |
| EP1378148B1 (de) | Verfahren und vorrichtung zur messung der position, form, grösse und intensitätsverteilung eines effektiven röntgenröhrenfokus | |
| US5757005A (en) | Advanced x-ray imaging spectrometer | |
| Hammersley et al. | Calibration and application of an X-ray image intensifier/charge-coupled device detector for monochromatic macromolecular crystallography | |
| Deckman et al. | Development of quantitative X-ray microtomography | |
| Flannery et al. | Observational strategies for three‐dimensional synchrotron microtomography | |
| JPH0815182A (ja) | x線画像システムにおける放射線散乱を補償するための方法 | |
| Rao et al. | The modulation transfer functions of x-ray focal spots | |
| Deckman et al. | Microtomography detector design: It's not just resolution | |
| DiBianca et al. | A variable resolution x‐ray detector for computed tomography: I. Theoretical basis and experimental verification | |
| JP2000107162A (ja) | 放射線撮像装置 | |
| JPS62254045A (ja) | 電気−光学式のx線検出器を使用した三次元断層撮影装置 | |
| Ryon et al. | X-ray imaging: Status and trends | |
| Naday et al. | Gold detector: modular CCD area detector for macromolecular crystallography | |
| Floyd Jr et al. | Evaluation of a selenium-based digital chest radiography system | |
| Zoltani et al. | Flash x‐ray computed tomography facility for microsecond events | |
| Palmer et al. | A laboratory demonstration of high-resolution hard x-ray and gamma-ray imaging using Fourier-transform techniques |
Legal Events
| Date | Code | Title | Description |
|---|---|---|---|
| PUAI | Public reference made under article 153(3) epc to a published international application that has entered the european phase |
Free format text: ORIGINAL CODE: 0009012 |
|
| AK | Designated contracting states |
Kind code of ref document: A2 Designated state(s): CH DE FR GB IT LI NL |
|
| PUAL | Search report despatched |
Free format text: ORIGINAL CODE: 0009013 |
|
| AK | Designated contracting states |
Kind code of ref document: A3 Designated state(s): CH DE FR GB IT LI NL |
|
| 17P | Request for examination filed |
Effective date: 19900726 |
|
| 17Q | First examination report despatched |
Effective date: 19920116 |
|
| GRAA | (expected) grant |
Free format text: ORIGINAL CODE: 0009210 |
|
| AK | Designated contracting states |
Kind code of ref document: B1 Designated state(s): CH DE FR GB IT LI NL |
|
| REF | Corresponds to: |
Ref document number: 3789890 Country of ref document: DE Date of ref document: 19940630 |
|
| ET | Fr: translation filed | ||
| ITF | It: translation for a ep patent filed | ||
| PGFP | Annual fee paid to national office [announced via postgrant information from national office to epo] |
Ref country code: CH Payment date: 19941011 Year of fee payment: 8 |
|
| PGFP | Annual fee paid to national office [announced via postgrant information from national office to epo] |
Ref country code: GB Payment date: 19941013 Year of fee payment: 8 |
|
| PGFP | Annual fee paid to national office [announced via postgrant information from national office to epo] |
Ref country code: FR Payment date: 19941114 Year of fee payment: 8 |
|
| PGFP | Annual fee paid to national office [announced via postgrant information from national office to epo] |
Ref country code: NL Payment date: 19941130 Year of fee payment: 8 |
|
| PGFP | Annual fee paid to national office [announced via postgrant information from national office to epo] |
Ref country code: DE Payment date: 19950118 Year of fee payment: 8 |
|
| PLBE | No opposition filed within time limit |
Free format text: ORIGINAL CODE: 0009261 |
|
| STAA | Information on the status of an ep patent application or granted ep patent |
Free format text: STATUS: NO OPPOSITION FILED WITHIN TIME LIMIT |
|
| 26N | No opposition filed | ||
| PG25 | Lapsed in a contracting state [announced via postgrant information from national office to epo] |
Ref country code: GB Effective date: 19951119 |
|
| PG25 | Lapsed in a contracting state [announced via postgrant information from national office to epo] |
Ref country code: LI Effective date: 19951130 Ref country code: CH Effective date: 19951130 |
|
| PG25 | Lapsed in a contracting state [announced via postgrant information from national office to epo] |
Ref country code: NL Effective date: 19960601 |
|
| REG | Reference to a national code |
Ref country code: CH Ref legal event code: PL |
|
| GBPC | Gb: european patent ceased through non-payment of renewal fee |
Effective date: 19951119 |
|
| NLV4 | Nl: lapsed or anulled due to non-payment of the annual fee |
Effective date: 19960601 |
|
| PG25 | Lapsed in a contracting state [announced via postgrant information from national office to epo] |
Ref country code: DE Effective date: 19960801 |
|
| PG25 | Lapsed in a contracting state [announced via postgrant information from national office to epo] |
Ref country code: FR Effective date: 19960830 |
|
| REG | Reference to a national code |
Ref country code: FR Ref legal event code: ST |
|
| REG | Reference to a national code |
Ref country code: FR Ref legal event code: ST |
|
| PG25 | Lapsed in a contracting state [announced via postgrant information from national office to epo] |
Ref country code: IT Free format text: LAPSE BECAUSE OF NON-PAYMENT OF DUE FEES;WARNING: LAPSES OF ITALIAN PATENTS WITH EFFECTIVE DATE BEFORE 2007 MAY HAVE OCCURRED AT ANY TIME BEFORE 2007. THE CORRECT EFFECTIVE DATE MAY BE DIFFERENT FROM THE ONE RECORDED. Effective date: 20051119 |